infrastruktur analyse zur sektorenkopplung strom und verkehr · iek-3: institute of electrochemical...
TRANSCRIPT
IEK-3: Institute of Electrochemical Process Engineering
Infrastruktur – Analyse zur Sektorenkopplung
Strom und Verkehr
21. MÄRZ 2019| MARTIN ROBINIUS, DETLEF STOLTEN ET AL.
Arbeitskreis Energie in der Deutschen Physikalischen Gesellschaft - Frühjahrssitzung
IEK-3: Institute of Electrochemical Process Engineering
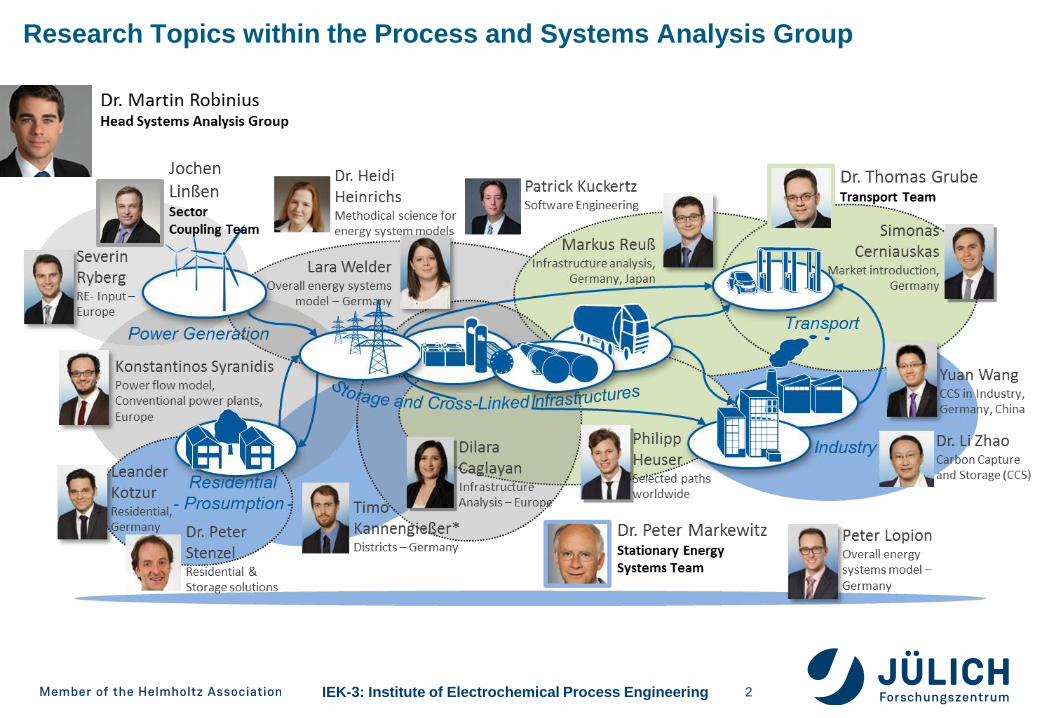
Research Topics within the Process and Systems Analysis Group
2
IEK-3: Institute of Electrochemical Process Engineering
Table of Contents
3
Sector Coupling – Definition and Literature Review
Multiscale Toolbox for Energy Systems Modeling
- Example Wind Modeling
- Framework for Integrated Energy System Assessment
- Hydrogen Infrastructure Modeling
Comparative Analysis of Infrastructures in Germany
European and Global Pathways
IEK-3: Institute of Electrochemical Process Engineering 4
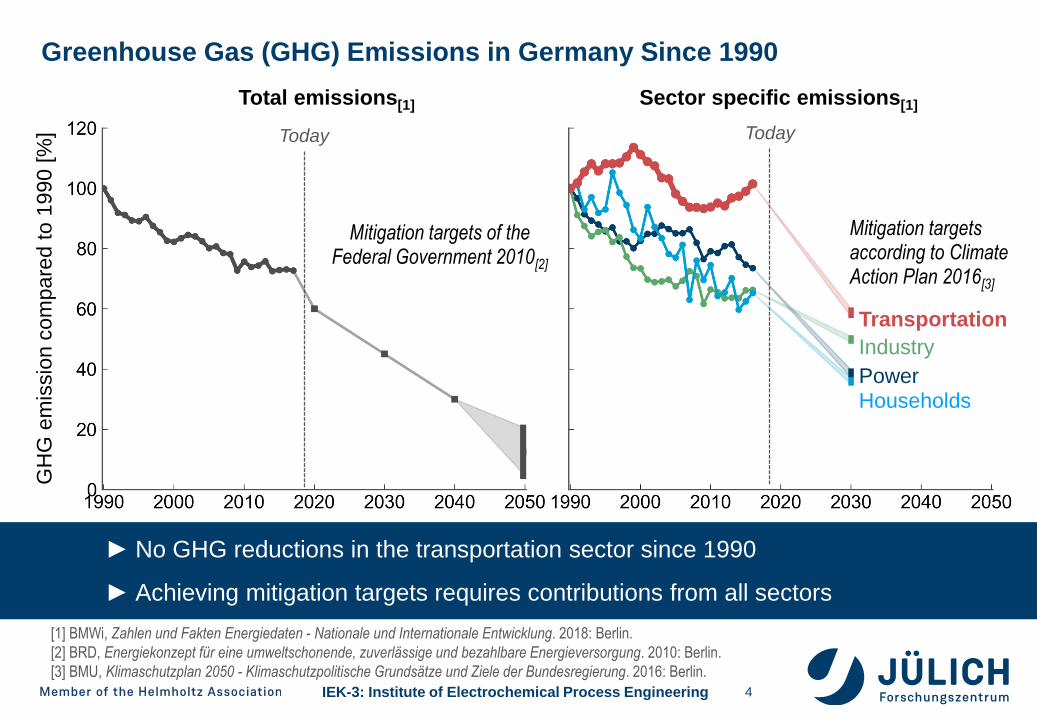
Greenhouse Gas (GHG) Emissions in Germany Since 1990
[1] BMWi, Zahlen und Fakten Energiedaten - Nationale und Internationale Entwicklung. 2018: Berlin.
[2] BRD, Energiekonzept für eine umweltschonende, zuverlässige und bezahlbare Energieversorgung. 2010: Berlin.
[3] BMU, Klimaschutzplan 2050 - Klimaschutzpolitische Grundsätze und Ziele der Bundesregierung. 2016: Berlin.
GH
G e
mis
sio
n c
om
pare
d t
o 1
990 [
%]
Total emissions[1] Sector specific emissions[1]
Today Today
Mitigation targets of the Federal Government 2010[2]
Mitigation targets according to Climate Action Plan 2016[3]
► No GHG reductions in the transportation sector since 1990
► Achieving mitigation targets requires contributions from all sectors
Transportation
Industry
PowerHouseholds
IEK-3: Institute of Electrochemical Process Engineering 5
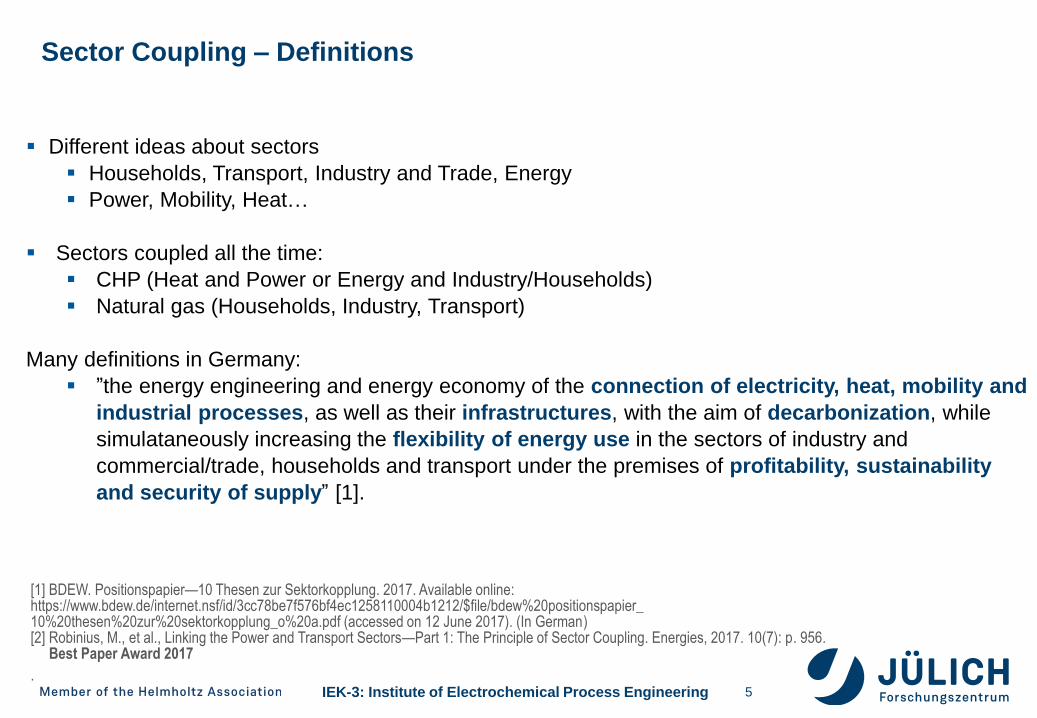
Sector Coupling – Definitions
[1] BDEW. Positionspapier—10 Thesen zur Sektorkopplung. 2017. Available online: https://www.bdew.de/internet.nsf/id/3cc78be7f576bf4ec1258110004b1212/$file/bdew%20positionspapier_10%20thesen%20zur%20sektorkopplung_o%20a.pdf (accessed on 12 June 2017). (In German)[2] Robinius, M., et al., Linking the Power and Transport Sectors—Part 1: The Principle of Sector Coupling. Energies, 2017. 10(7): p. 956.
Best Paper Award 2017
.
Different ideas about sectors
Households, Transport, Industry and Trade, Energy
Power, Mobility, Heat…
Sectors coupled all the time:
CHP (Heat and Power or Energy and Industry/Households)
Natural gas (Households, Industry, Transport)
Many definitions in Germany:
”the energy engineering and energy economy of the connection of electricity, heat, mobility and
industrial processes, as well as their infrastructures, with the aim of decarbonization, while
simulataneously increasing the flexibility of energy use in the sectors of industry and
commercial/trade, households and transport under the premises of profitability, sustainability
and security of supply” [1].
IEK-3: Institute of Electrochemical Process Engineering
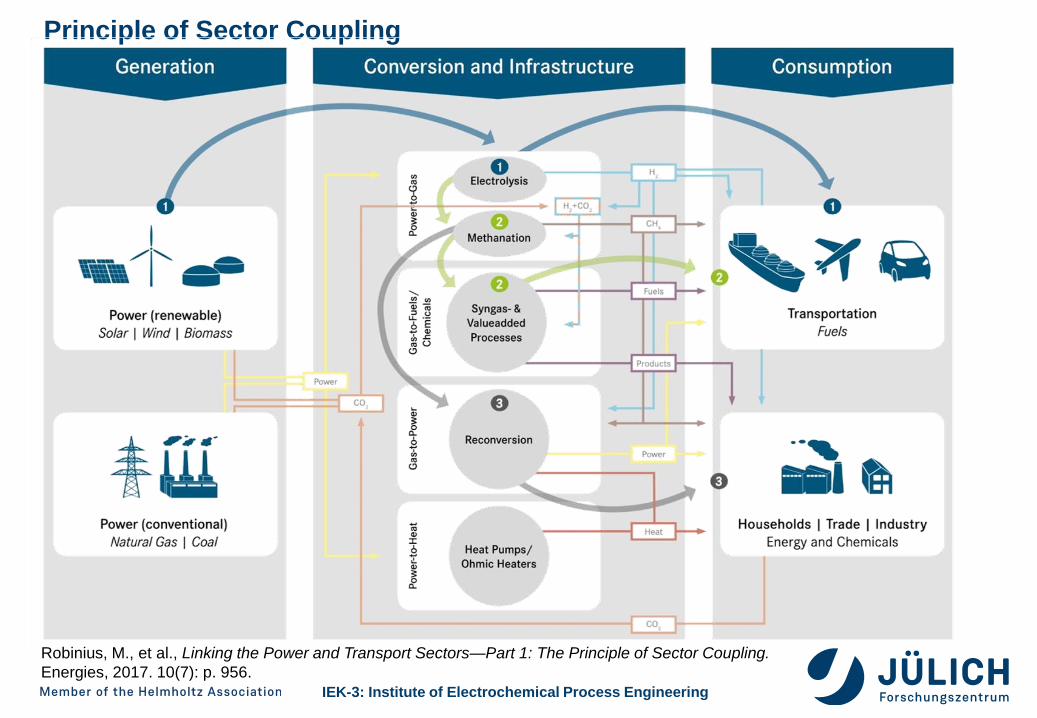
Principle of Sector Coupling
Robinius, M., et al., Linking the Power and Transport Sectors—Part 1: The Principle of Sector Coupling.
Energies, 2017. 10(7): p. 956.
IEK-3: Institute of Electrochemical Process Engineering
Pu
bli
sh
ed
[ye
ar]
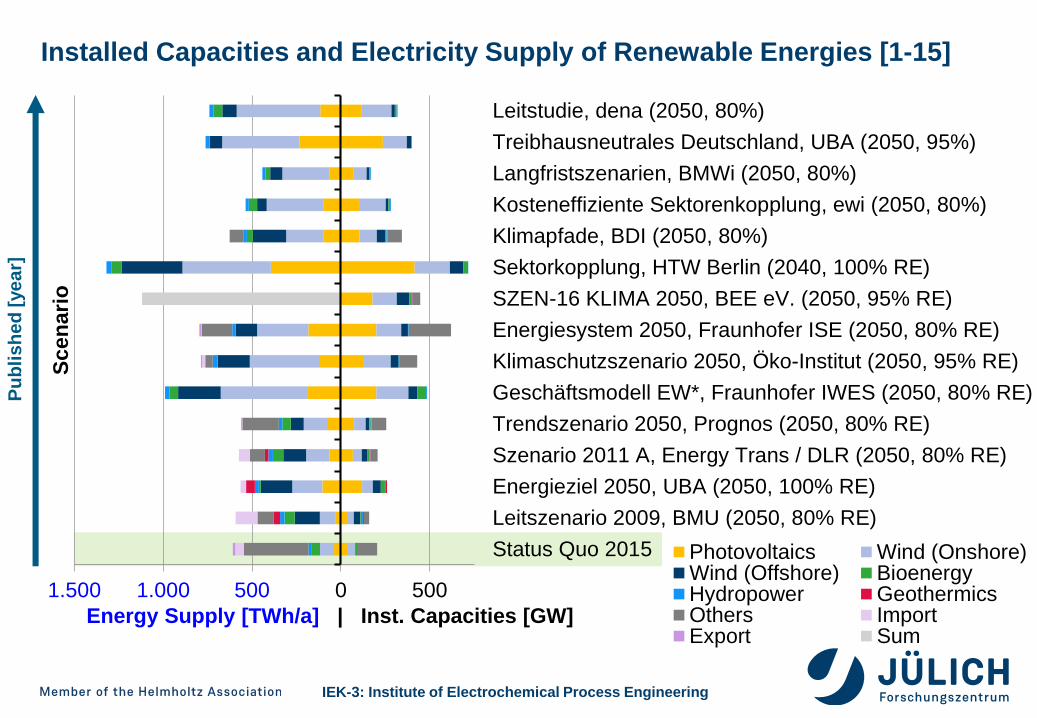
1.500 1.000 500 0 500
Status Quo 2015
Leitszenario 2009, BMU (2050, 80% RE)
Energieziel 2050, UBA (2050, 100% RE)
Szenario 2011 A, Energy Trans / DLR (2050, 80% RE)
Trendszenario 2050, Prognos (2050, 80% RE)
Geschäftsmodell EW*, Fraunhofer IWES (2050, 80% RE)
Klimaschutzszenario 2050, Öko-Institut (2050, 95% RE)
Energiesystem 2050, Fraunhofer ISE (2050, 80% RE)
SZEN-16 KLIMA 2050, BEE eV. (2050, 95% RE)
Sektorkopplung, HTW Berlin (2040, 100% RE)
Klimapfade, BDI (2050, 80%)
Kosteneffiziente Sektorenkopplung, ewi (2050, 80%)
Langfristszenarien, BMWi (2050, 80%)
Treibhausneutrales Deutschland, UBA (2050, 95%)
Leitstudie, dena (2050, 80%)
Energy Supply [TWh/a] | Inst. Capacities [GW]
Scen
ari
o
Photovoltaics Wind (Onshore)Wind (Offshore) BioenergyHydropower GeothermicsOthers ImportExport Sum
Installed Capacities and Electricity Supply of Renewable Energies [1-15]
IEK-3: Institute of Electrochemical Process Engineering
Table of Contents
8
Sector Coupling – Definition and Literature Review
Multiscale Toolbox for Energy Systems Modeling
- Example Wind Modeling
- Framework for Integrated Energy System Assessment
- Hydrogen Infrastructure Modeling
Comparative Analysis of Infrastructures in Germany
European and Global Pathways
IEK-3: Institute of Electrochemical Process Engineering
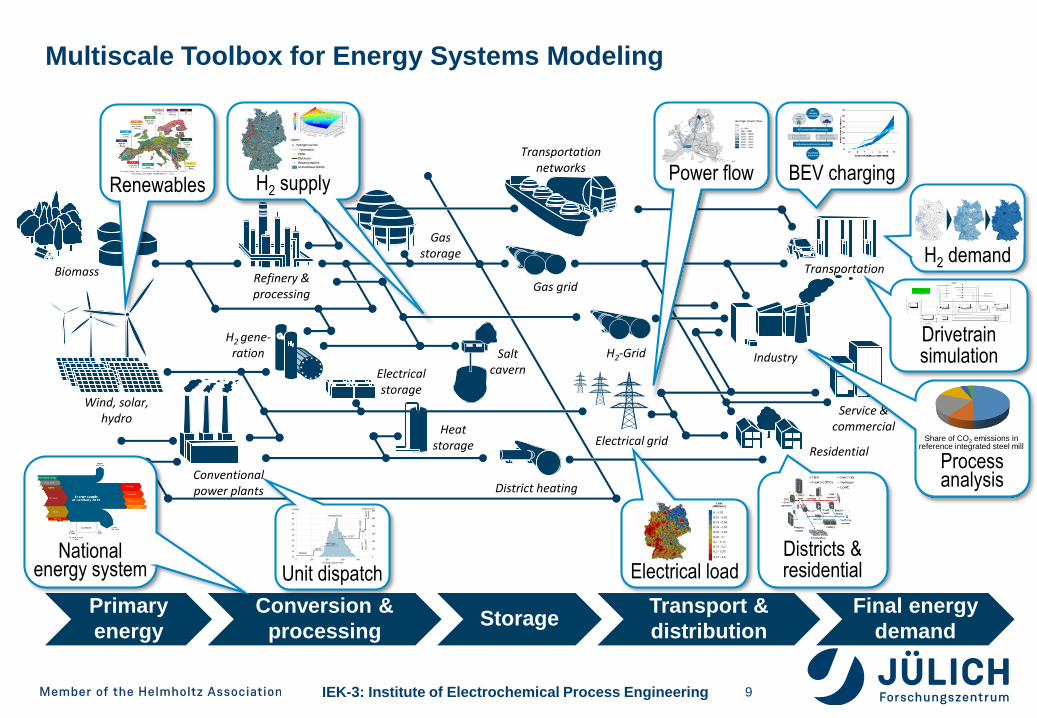
Multiscale Toolbox for Energy Systems Modeling
BEV charging
H2 gene-ration
District heating
Transportation
Residential
Service &commercial
Industry
Biomass Refinery & processing
Conventionalpower plants
Wind, solar,hydro
Electrical grid
H2-Grid
Transportationnetworks
Gas grid
Gasstorage
Electricalstorage
Heatstorage
Saltcavern
Power flowH2 supplyRenewables
H2 demand
Electrical load
Drivetrain simulation
Primary
energy
Conversion &
processingStorage
Transport &
distribution
Final energy
demand
Process analysis
Share of CO2 emissions in reference integrated steel mill
Districts & residentialUnit dispatch
0
100
200
300
400
500
600
10
20
30
40
50
60
70
80
90
0 100 200 300 400
Frequency [h]€/MWh
Installed Capacity [GW]
Nuclear
Lignite
Hard Coal
Gas - CCGT
Oil
-C
CG
TG
as-
ST
Oil-
STG
as-
OC
GT
Residual load
National energy system
9
IEK-3: Institute of Electrochemical Process Engineering
Table of Contents
10
Sector Coupling – Definition and Literature Review
Multiscale Toolbox for Energy Systems Modeling
- Example Wind Modeling
- Framework for Integrated Energy System Assessment
- Hydrogen Infrastructure Modeling
Comparative Analysis of Infrastructures in Germany
European and Global Pathways
IEK-3: Institute of Electrochemical Process Engineering
BEV charging
H2 gene-ration
District heating
Transportation
Residential
Service &commercial
Industry
Biomass Refinery & processing
Conventionalpower plants
Wind, solar,hydro
Electrical grid
H2-Grid
Transportationnetworks
Gas grid
Gasstorage
Electricalstorage
Heatstorage
Saltcavern
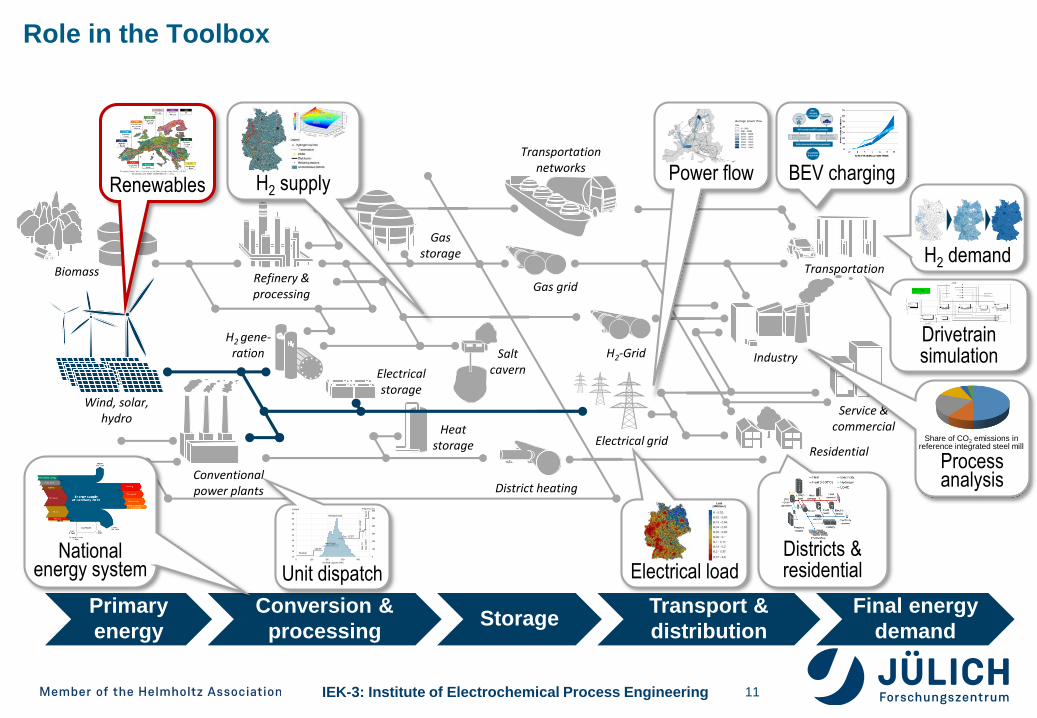
Power flowH2 supplyRenewables
H2 demand
Electrical load
Drivetrain simulation
Primary
energy
Conversion &
processingStorage
Transport &
distribution
Final energy
demand
Process analysis
Share of CO2 emissions in reference integrated steel mill
Districts & residentialUnit dispatch
0
100
200
300
400
500
600
10
20
30
40
50
60
70
80
90
0 100 200 300 400
Frequency [h]€/MWh
Installed Capacity [GW]
Nuclear
Lignite
Hard Coal
Gas - CCGT
Oil
-C
CG
TG
as-
ST
Oil-
STG
as-
OC
GT
Residual load
National energy system
Role in the Toolbox
11
IEK-3: Institute of Electrochemical Process Engineering
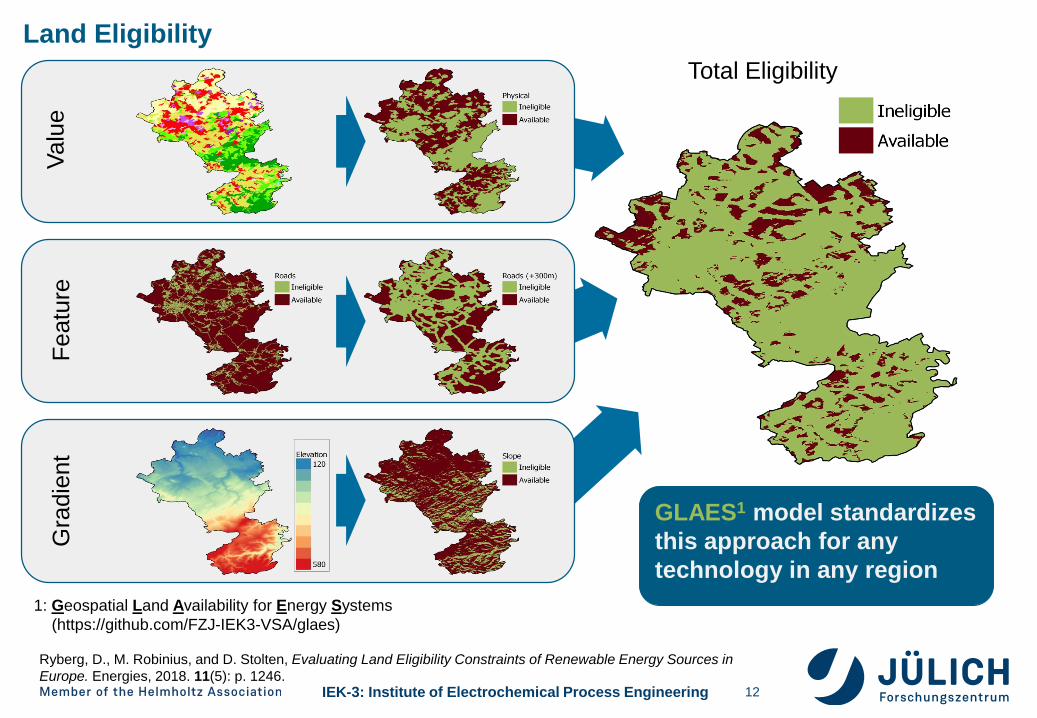
Valu
eF
eatu
reG
radie
nt
Total Eligibility
GLAES1 model standardizes
this approach for any
technology in any region
1: Geospatial Land Availability for Energy Systems
(https://github.com/FZJ-IEK3-VSA/glaes)
Land Eligibility
Ryberg, D., M. Robinius, and D. Stolten, Evaluating Land Eligibility Constraints of Renewable Energy Sources in
Europe. Energies, 2018. 11(5): p. 1246.12
IEK-3: Institute of Electrochemical Process Engineering
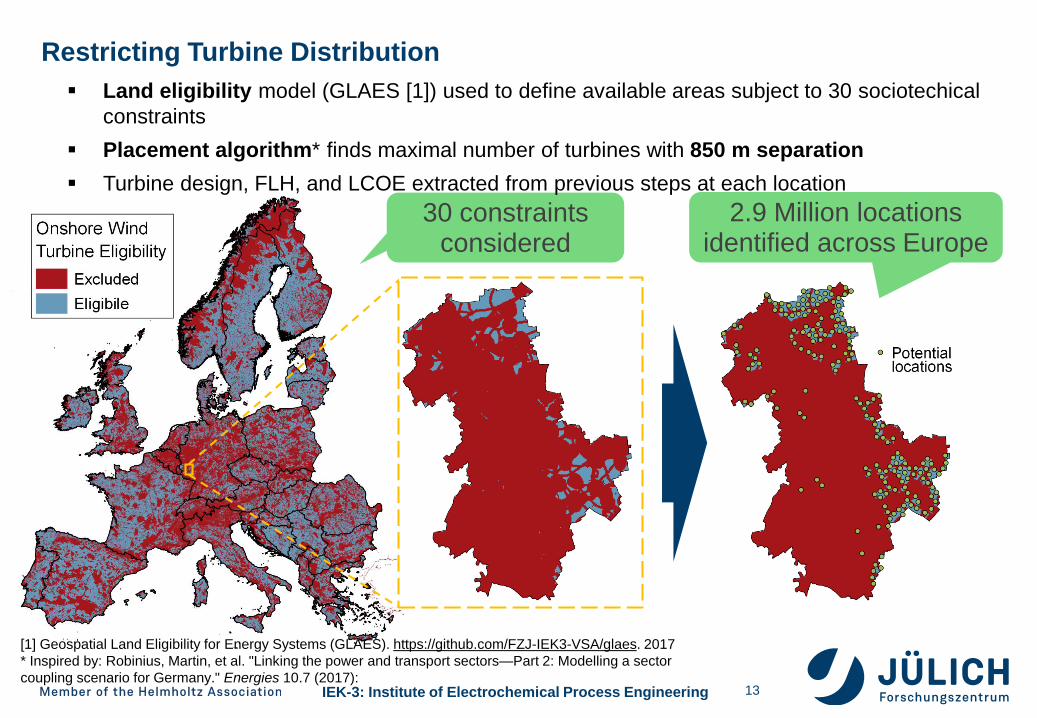
30 constraints considered
2.9 Million locations identified across Europe
Land eligibility model (GLAES [1]) used to define available areas subject to 30 sociotechical
constraints
Placement algorithm* finds maximal number of turbines with 850 m separation
Turbine design, FLH, and LCOE extracted from previous steps at each location
13
[1] Geospatial Land Eligibility for Energy Systems (GLAES). https://github.com/FZJ-IEK3-VSA/glaes. 2017
* Inspired by: Robinius, Martin, et al. "Linking the power and transport sectors—Part 2: Modelling a sector
coupling scenario for Germany." Energies 10.7 (2017):
Restricting Turbine Distribution
IEK-3: Institute of Electrochemical Process Engineering
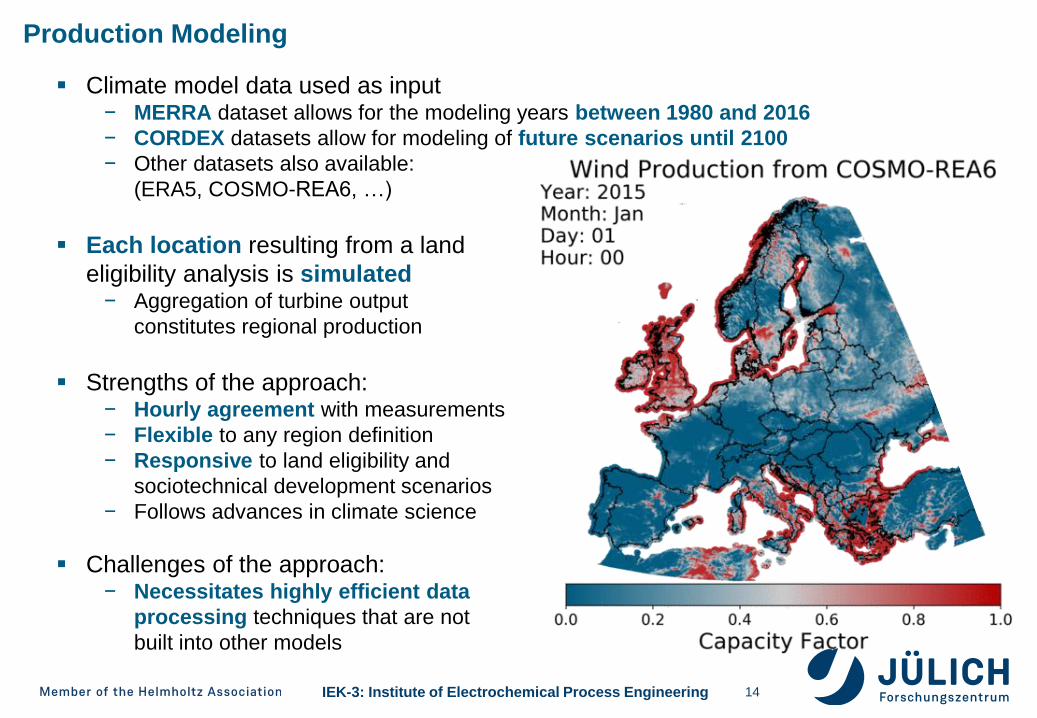
Production Modeling
Climate model data used as input− MERRA dataset allows for the modeling years between 1980 and 2016
− CORDEX datasets allow for modeling of future scenarios until 2100
− Other datasets also available:
(ERA5, COSMO-REA6, …)
Each location resulting from a land
eligibility analysis is simulated− Aggregation of turbine output
constitutes regional production
Strengths of the approach:− Hourly agreement with measurements
− Flexible to any region definition
− Responsive to land eligibility and
sociotechnical development scenarios
− Follows advances in climate science
Challenges of the approach:− Necessitates highly efficient data
processing techniques that are not
built into other models
14
IEK-3: Institute of Electrochemical Process Engineering
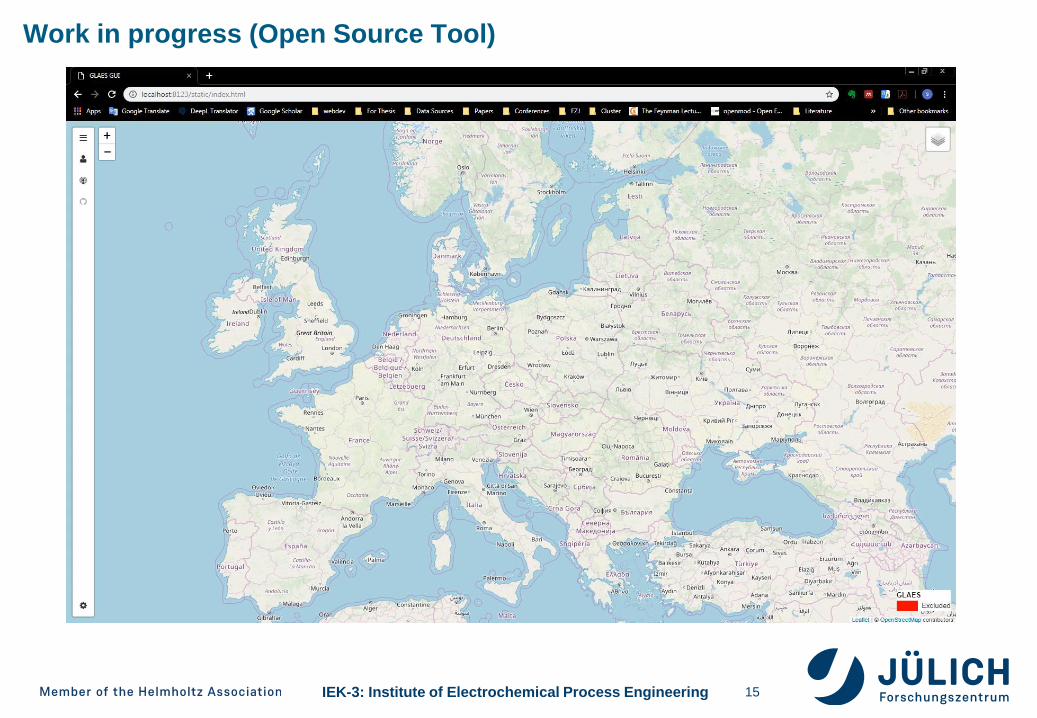
Work in progress (Open Source Tool)
15
IEK-3: Institute of Electrochemical Process Engineering
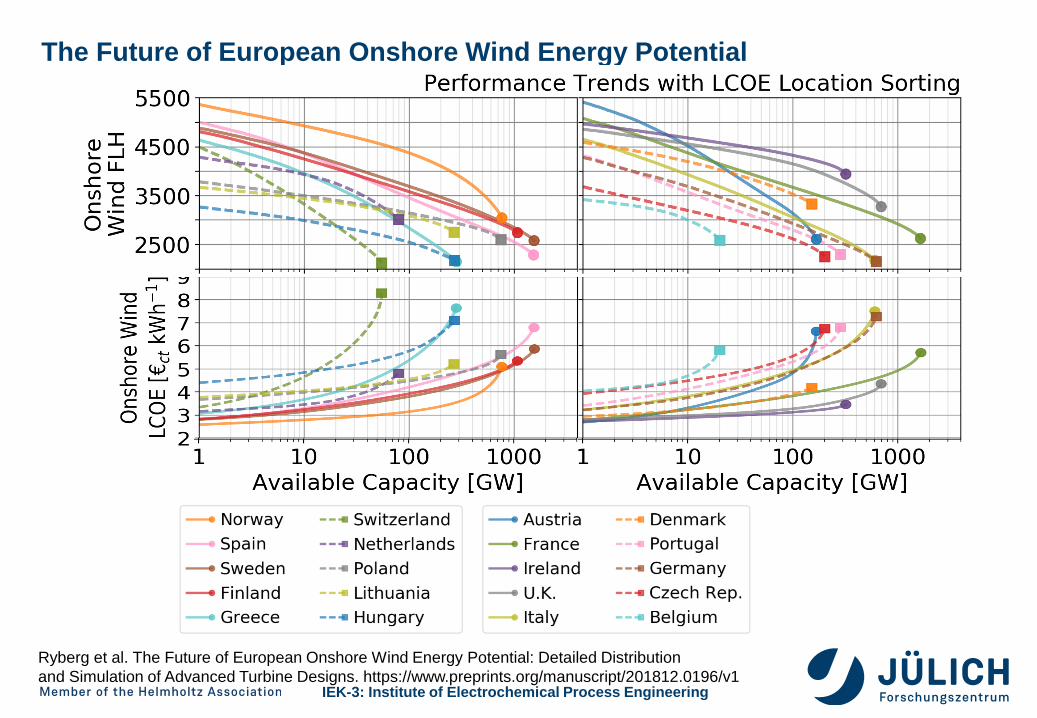
The Future of European Onshore Wind Energy Potential
Ryberg et al. The Future of European Onshore Wind Energy Potential: Detailed Distribution
and Simulation of Advanced Turbine Designs. https://www.preprints.org/manuscript/201812.0196/v1
IEK-3: Institute of Electrochemical Process Engineering
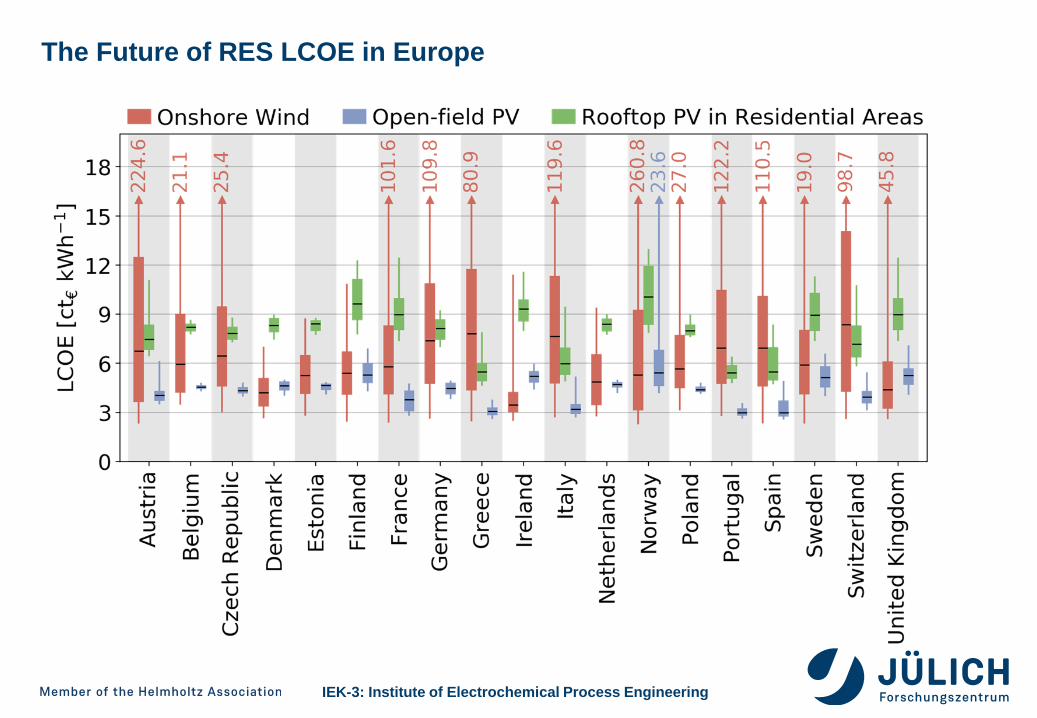
The Future of RES LCOE in Europe
IEK-3: Institute of Electrochemical Process Engineering 18
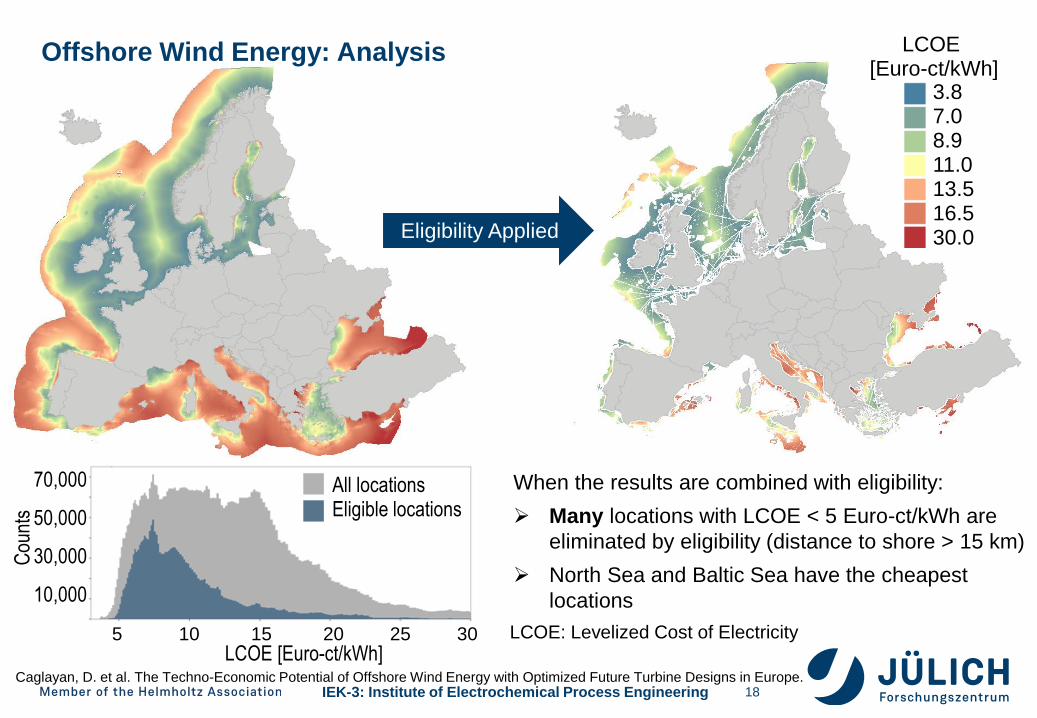
Offshore Wind Energy: Analysis
When the results are combined with eligibility:
Many locations with LCOE < 5 Euro-ct/kWh are
eliminated by eligibility (distance to shore > 15 km)
North Sea and Baltic Sea have the cheapest
locations
5 10 15 20 25 30LCOE [Euro-ct/kWh]
Eligibility Applied
3.87.08.911.013.516.530.0
LCOE [Euro-ct/kWh]
Cou
nts
All locationsEligible locations
70,000
50,000
30,000
10,000
LCOE: Levelized Cost of Electricity
Caglayan, D. et al. The Techno-Economic Potential of Offshore Wind Energy with Optimized Future Turbine Designs in Europe.
IEK-3: Institute of Electrochemical Process Engineering
Table of Contents
19
Sector Coupling – Definition and Literature Review
Multiscale Toolbox for Energy Systems Modeling
- Example Wind Modeling
- Framework for Integrated Energy System Assessment
- Hydrogen Infrastructure Modeling
Comparative Analysis of Infrastructures in Germany
European and Global Pathways
IEK-3: Institute of Electrochemical Process Engineering
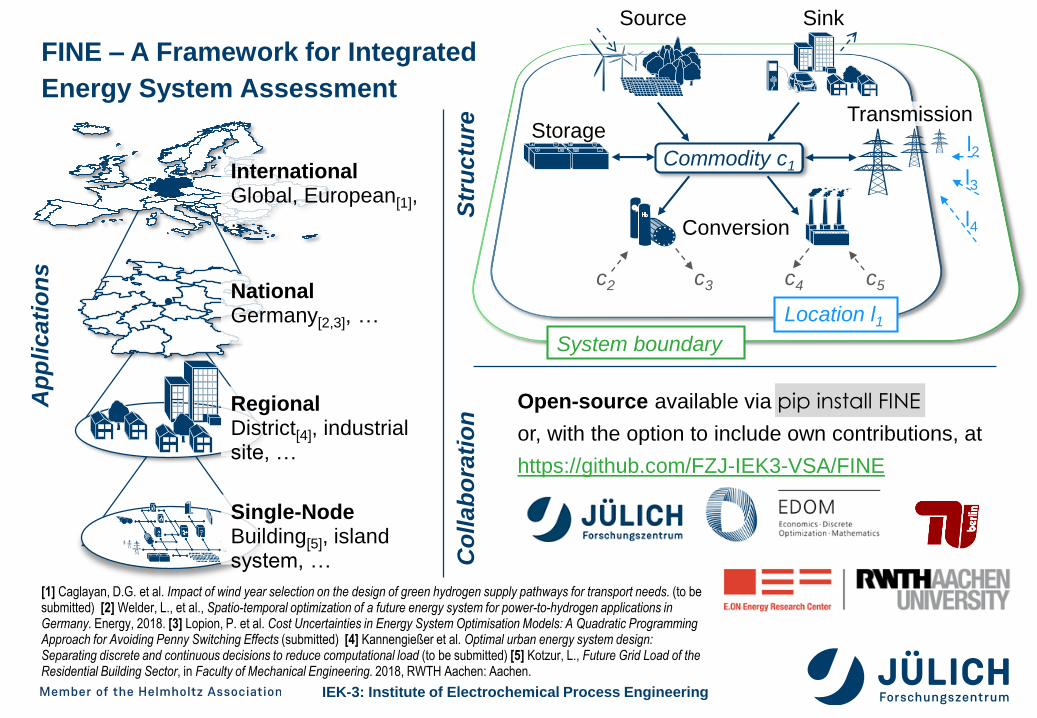
Open-source available via pip install FINE
or, with the option to include own contributions, at
https://github.com/FZJ-IEK3-VSA/FINE
Electricity
StorageTransmission
SinkSource
Conversion
Location l1System boundary
l2
l3
l4
FINE – A Framework for Integrated
Energy System Assessment
InternationalGlobal, European[1], ..
RegionalDistrict[4], industrial site, …
Single-NodeBuilding[5], island system, …
NationalGermany[2,3], …
Ap
pli
cati
on
s
Str
uctu
reC
oll
ab
ora
tio
n
[1] Caglayan, D.G. et al. Impact of wind year selection on the design of green hydrogen supply pathways for transport needs. (to be submitted) [2] Welder, L., et al., Spatio-temporal optimization of a future energy system for power-to-hydrogen applications in Germany. Energy, 2018. [3] Lopion, P. et al. Cost Uncertainties in Energy System Optimisation Models: A Quadratic Programming Approach for Avoiding Penny Switching Effects (submitted) [4] Kannengießer et al. Optimal urban energy system design: Separating discrete and continuous decisions to reduce computational load (to be submitted) [5] Kotzur, L., Future Grid Load of the Residential Building Sector, in Faculty of Mechanical Engineering. 2018, RWTH Aachen: Aachen.
Commodity c1
c5c4c3c2
IEK-3: Institute of Electrochemical Process Engineering
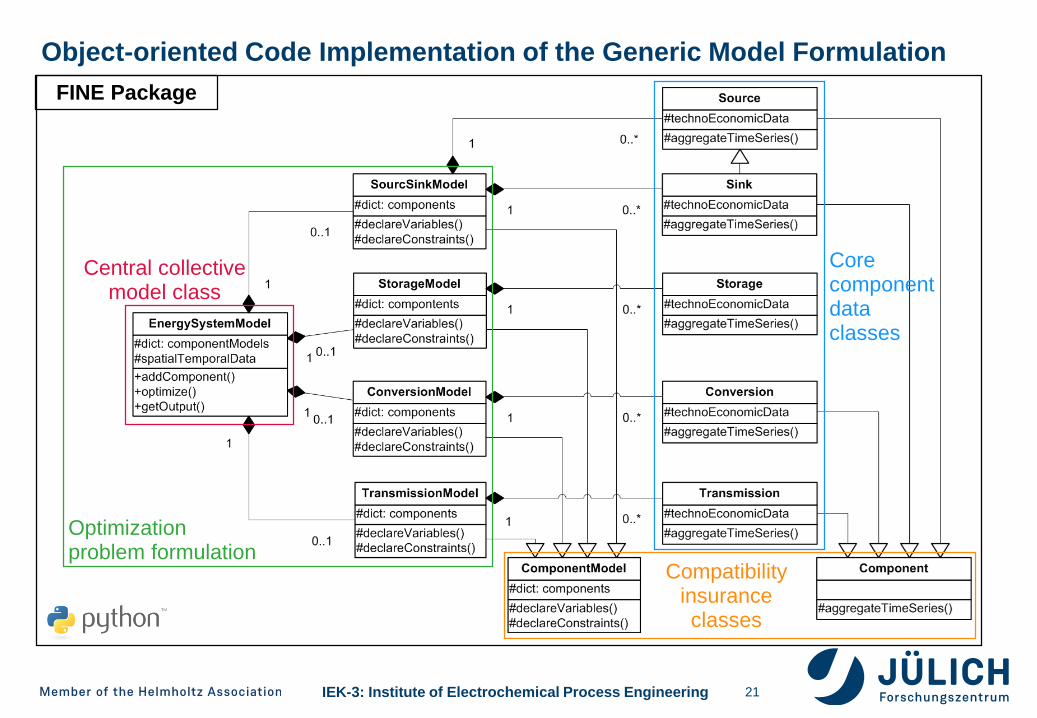
Corecomponentdataclasses
Central collective model class
Optimizationproblem formulation
Compatibilityinsuranceclasses
Object-oriented Code Implementation of the Generic Model Formulation
21
FINE Package
IEK-3: Institute of Electrochemical Process EngineeringBig Data
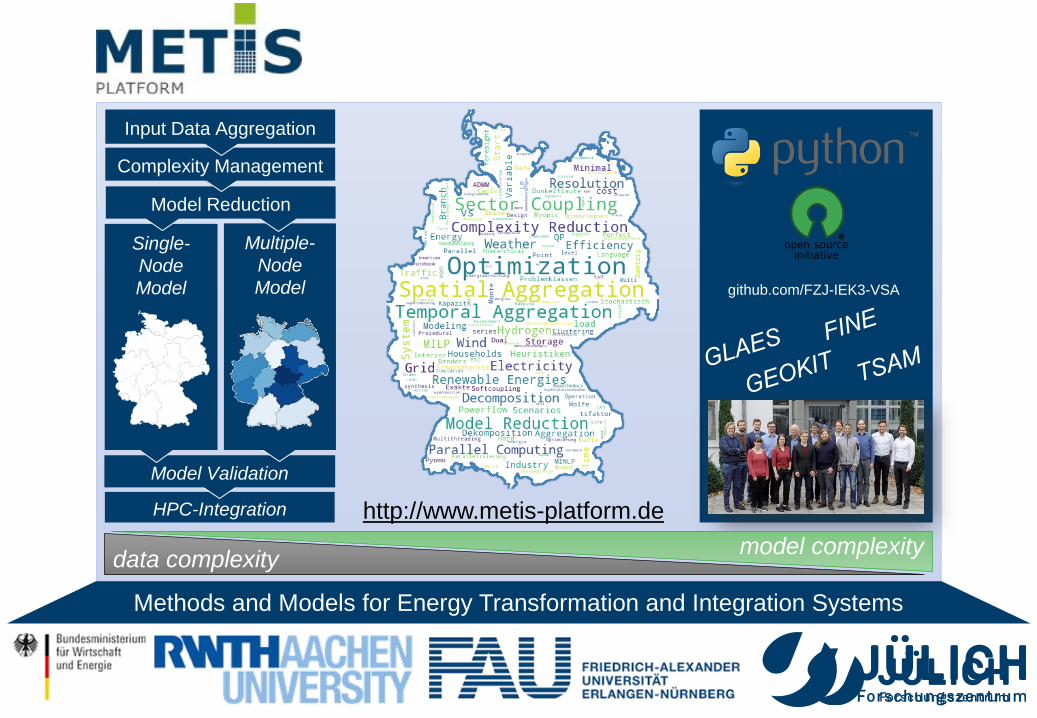
Methods and Models for Energy Transformation and Integration Systems
http://www.metis-platform.deHPC-Integration
Model Validation
Single-
Node
Model
Multiple-
Node
Model
Model Reduction
Complexity Management
Input Data Aggregation
data complexitymodel complexity
github.com/FZJ-IEK3-VSA
IEK-3: Institute of Electrochemical Process Engineering
Table of Contents
23
Sector Coupling – Definition and Literature Review
Multiscale Toolbox for Energy Systems Modeling
- Example Wind Modeling
- Framework for Integrated Energy System Assessment
- Hydrogen Infrastructure Modeling
Comparative Analysis of Infrastructures in Germany
European and Global Pathways
IEK-3: Institute of Electrochemical Process Engineering
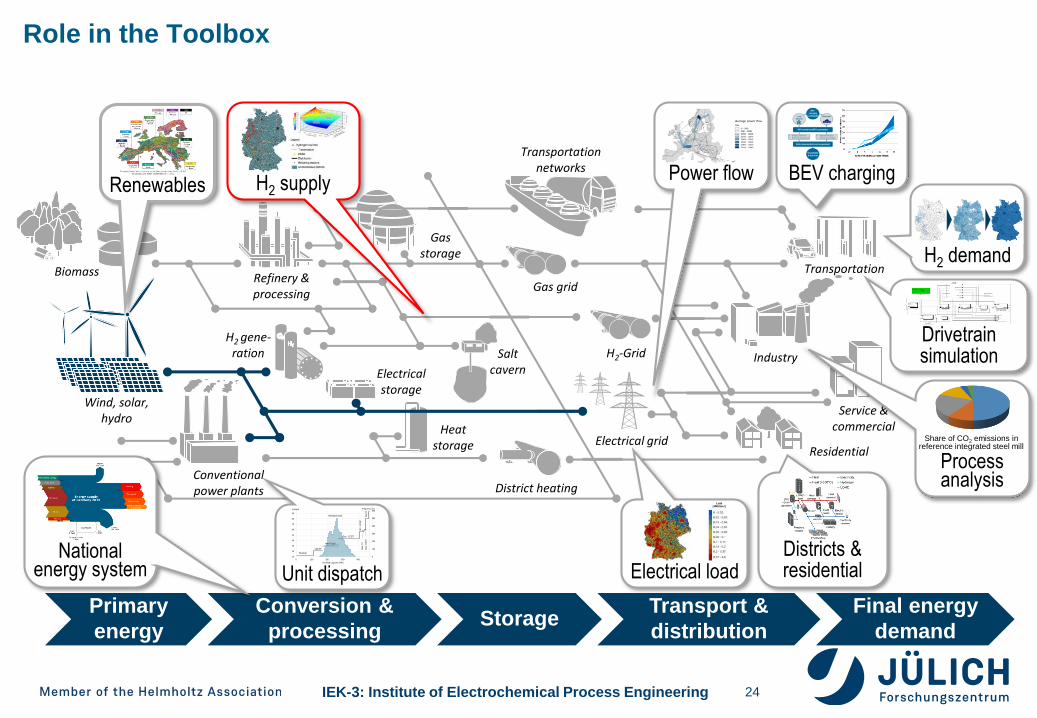
BEV charging
H2 gene-ration
District heating
Transportation
Residential
Service &commercial
Industry
Biomass Refinery & processing
Conventionalpower plants
Wind, solar,hydro
Electrical grid
H2-Grid
Transportationnetworks
Gas grid
Gasstorage
Electricalstorage
Heatstorage
Saltcavern
Power flowH2 supplyRenewables
H2 demand
Electrical load
Drivetrain simulation
Primary
energy
Conversion &
processingStorage
Transport &
distribution
Final energy
demand
Process analysis
Share of CO2 emissions in reference integrated steel mill
Districts & residentialUnit dispatch
0
100
200
300
400
500
600
10
20
30
40
50
60
70
80
90
0 100 200 300 400
Frequency [h]€/MWh
Installed Capacity [GW]
Nuclear
Lignite
Hard Coal
Gas - CCGT
Oil
-C
CG
TG
as-
ST
Oil-
STG
as-
OC
GT
Residual load
National energy system
Role in the Toolbox
24
IEK-3: Institute of Electrochemical Process Engineering
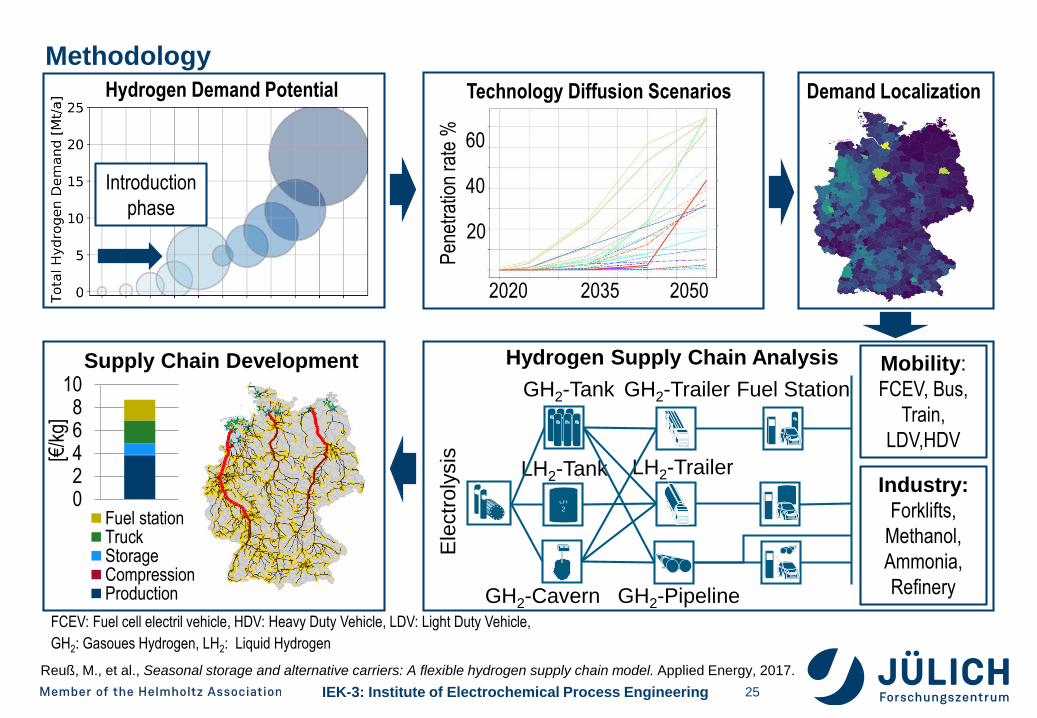
Methodology
25
Introduction
phase
Hydrogen Demand Potential Technology Diffusion Scenarios
Pen
etra
tion
rate
%
2020 20502035
Demand Localization
GH2-Trailer
LH
2
GH2-Tank
LH2-Tank LH2-Trailer
Fuel Station
Hydrogen Supply Chain Analysis
Ele
ctr
oly
sis
Mobility:
FCEV, Bus,
Train,
LDV,HDV
Industry:
Forklifts,
Methanol,
Ammonia,
RefineryGH2-PipelineGH2-Cavern
Supply Chain Development
02468
10
[€/k
g]
Fuel stationTruckStorageCompressionProduction
60
20
40
FCEV: Fuel cell electril vehicle, HDV: Heavy Duty Vehicle, LDV: Light Duty Vehicle,
GH2: Gasoues Hydrogen, LH2: Liquid Hydrogen
Reuß, M., et al., Seasonal storage and alternative carriers: A flexible hydrogen supply chain model. Applied Energy, 2017.
IEK-3: Institute of Electrochemical Process Engineering
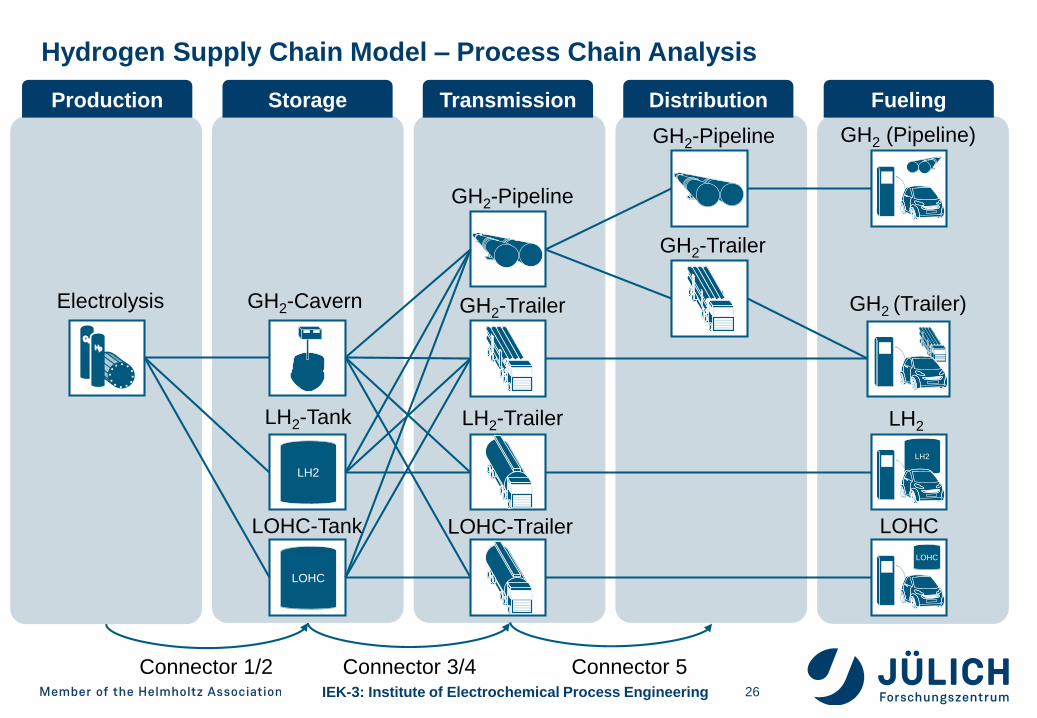
Hydrogen Supply Chain Model – Process Chain Analysis
26
LH2
LOHC
GH2-Cavern
LH2-Tank
LOHC-Tank LOHC-Trailer
LH2-Trailer
GH2-Trailer
GH2-Pipeline
LH2
LOHC
LOHC
GH2 (Trailer)
LH2
Electrolysis
GH2 (Pipeline)
GH2-Trailer
GH2-Pipeline
Production Storage Transmission Distribution Fueling
Connector 1/2 Connector 3/4 Connector 5
IEK-3: Institute of Electrochemical Process Engineering 27
Reuß, M., et al., Seasonal storage and alternative carriers: A flexible hydrogen supply chain model.
Applied Energy, 2017. 200: p. 290-302.
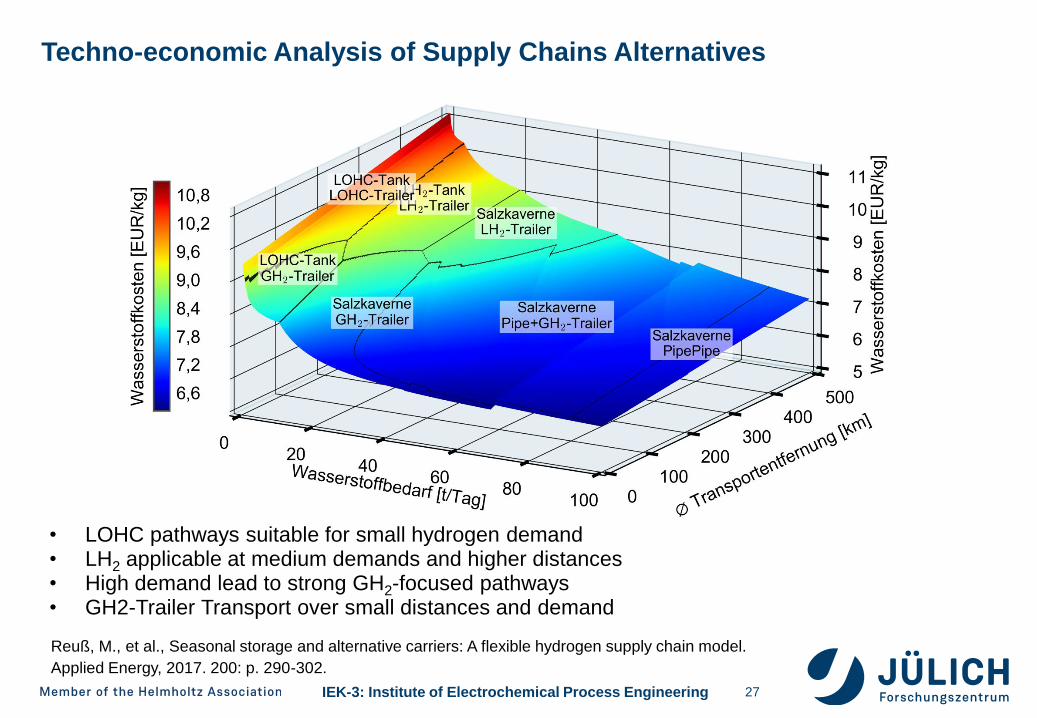
Techno-economic Analysis of Supply Chains Alternatives
• LOHC pathways suitable for small hydrogen demand• LH2 applicable at medium demands and higher distances• High demand lead to strong GH2-focused pathways • GH2-Trailer Transport over small distances and demand
IEK-3: Institute of Electrochemical Process Engineering
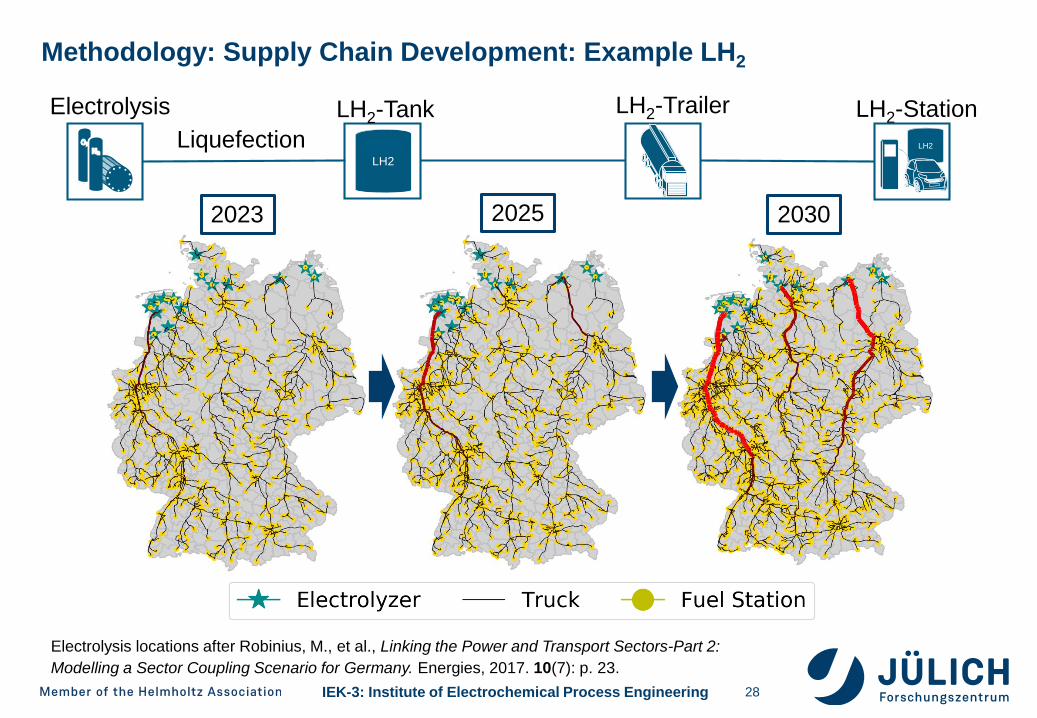
Methodology: Supply Chain Development: Example LH2
28
Electrolysis locations after Robinius, M., et al., Linking the Power and Transport Sectors-Part 2:
Modelling a Sector Coupling Scenario for Germany. Energies, 2017. 10(7): p. 23.
2030
LH2
LH2-Tank LH2-Trailer
LH2
LH2-Station
Liquefection
Electrolysis
20252023
IEK-3: Institute of Electrochemical Process Engineering
Table of Contents
29
Sector Coupling – Definition and Literature Review
Multiscale Toolbox for Energy Systems Modeling
- Example Wind Modeling
- Framework for Integrated Energy System Assessment
- Hydrogen Infrastructure Modeling
Comparative Analysis of Infrastructures in Germany
European and Global Pathways
IEK-3: Institute of Electrochemical Process Engineering
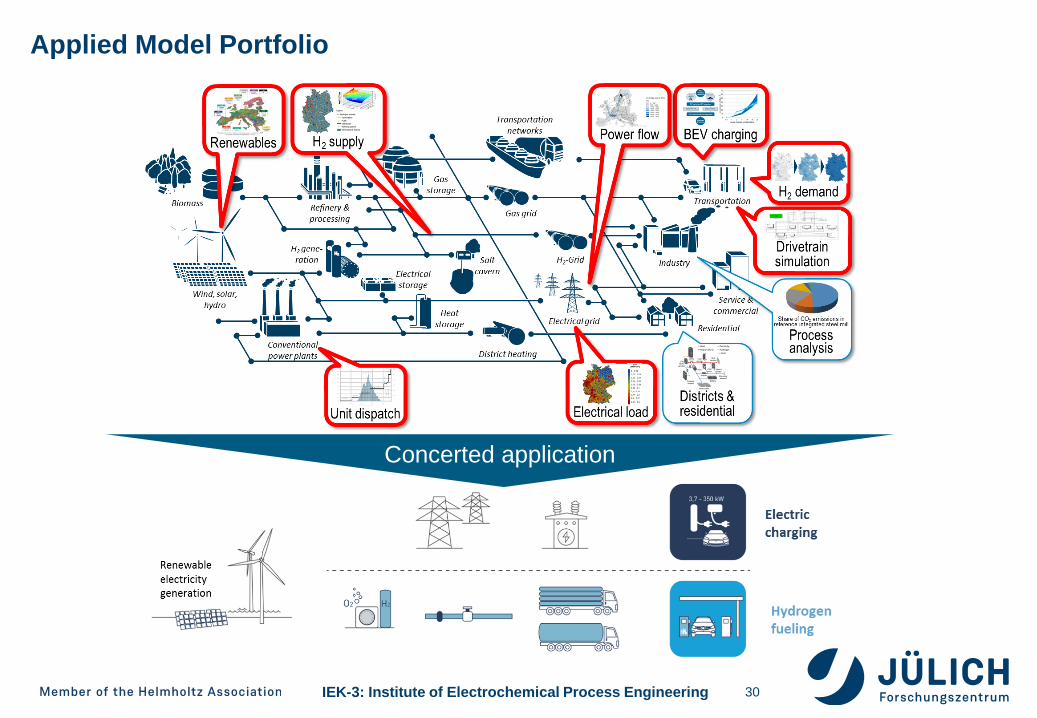
Applied Model Portfolio
Concerted application
30
IEK-3: Institute of Electrochemical Process Engineering
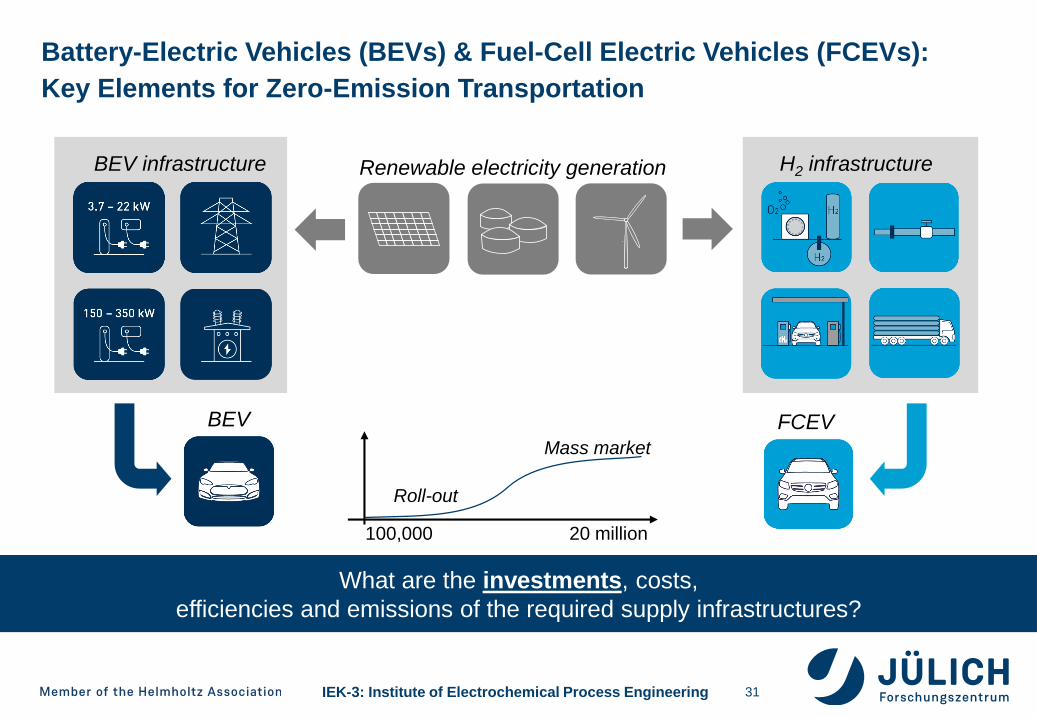
What are the investments, costs,
efficiencies and emissions of the required supply infrastructures?
Battery-Electric Vehicles (BEVs) & Fuel-Cell Electric Vehicles (FCEVs):
Key Elements for Zero-Emission Transportation
31
Renewable electricity generation
FCEVBEV
BEV infrastructure H2 infrastructure
Mass market
Roll-out
100,000 20 million
IEK-3: Institute of Electrochemical Process Engineering
Supply infrastructures ready for market and required technologies mature
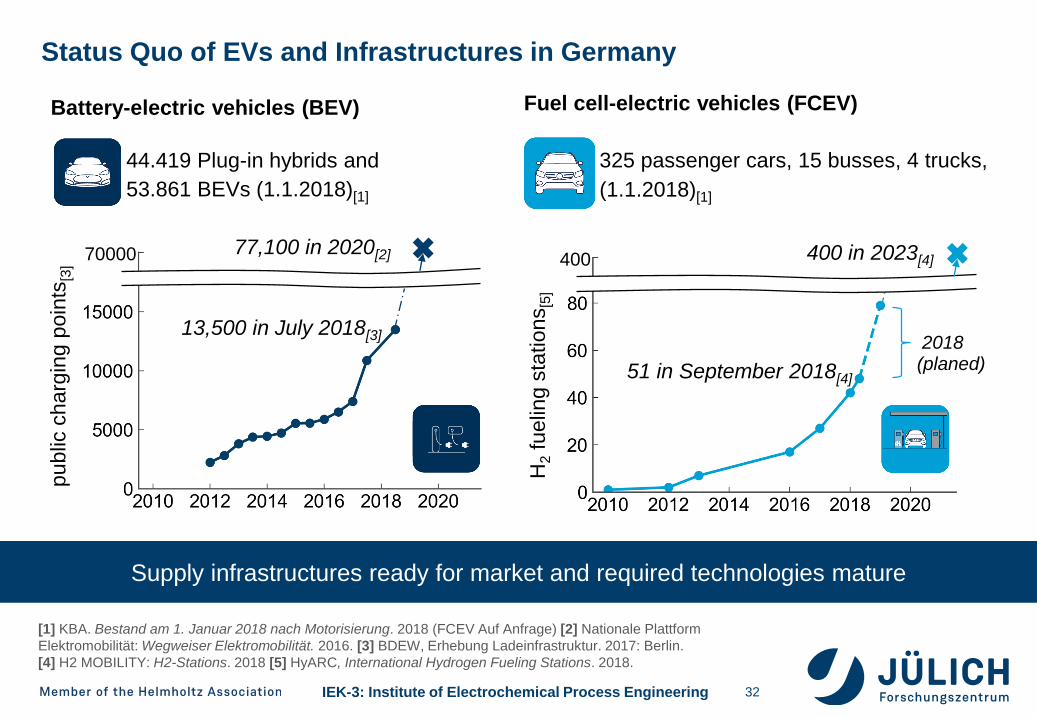
Fuel cell-electric vehicles (FCEV)
325 passenger cars, 15 busses, 4 trucks,
(1.1.2018)[1]
Status Quo of EVs and Infrastructures in Germany
32
Battery-electric vehicles (BEV)
44.419 Plug-in hybrids and
53.861 BEVs (1.1.2018)[1]
public
charg
ing
poin
ts[3
]
H2
fuelin
g s
tations
[5]
2018 (planed)
[1] KBA. Bestand am 1. Januar 2018 nach Motorisierung. 2018 (FCEV Auf Anfrage) [2] Nationale Plattform
Elektromobilität: Wegweiser Elektromobilität. 2016. [3] BDEW, Erhebung Ladeinfrastruktur. 2017: Berlin.
[4] H2 MOBILITY: H2-Stations. 2018 [5] HyARC, International Hydrogen Fueling Stations. 2018.
40070000 77,100 in 2020[2] 400 in 2023[4]
13,500 in July 2018[3]
51 in September 2018[4]
IEK-3: Institute of Electrochemical Process Engineering
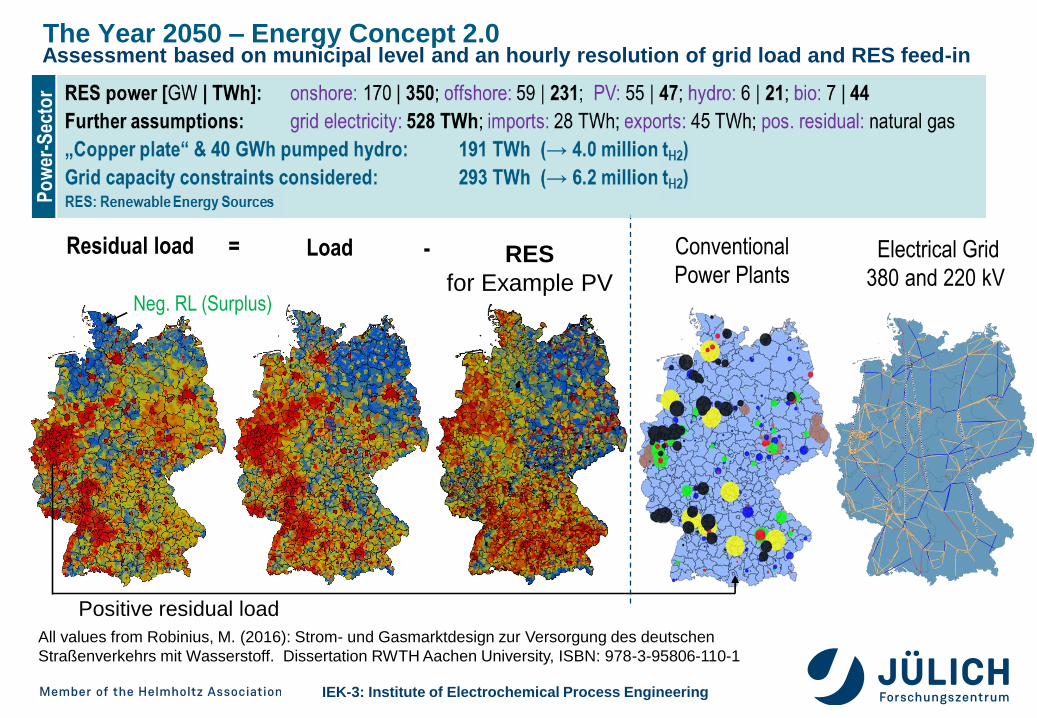
Assessment based on municipal level and an hourly resolution of grid load and RES feed-in
All values from Robinius, M. (2016): Strom- und Gasmarktdesign zur Versorgung des deutschen
Straßenverkehrs mit Wasserstoff. Dissertation RWTH Aachen University, ISBN: 978-3-95806-110-1
Electrical Grid
380 and 220 kV
Conventional
Power Plants
Residual load Load RES
for Example PV
= -
Neg. RL (Surplus)
Positive residual load
The Year 2050 – Energy Concept 2.0
IEK-3: Institute of Electrochemical Process Engineering
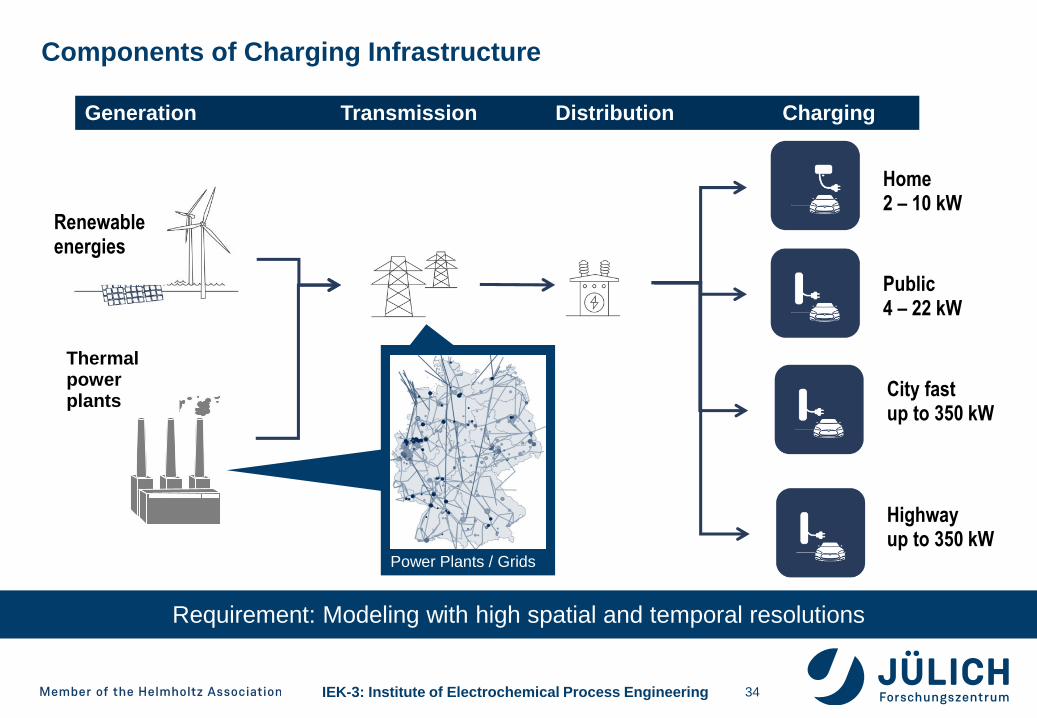
Components of Charging Infrastructure
34
Generation Transmission Distribution Charging
Public4 – 22 kW
Home 2 – 10 kW
Highwayup to 350 kW
City fast up to 350 kW
Renewable energies
Thermal power plants
Power Plants / Grids
Requirement: Modeling with high spatial and temporal resolutions
IEK-3: Institute of Electrochemical Process Engineering
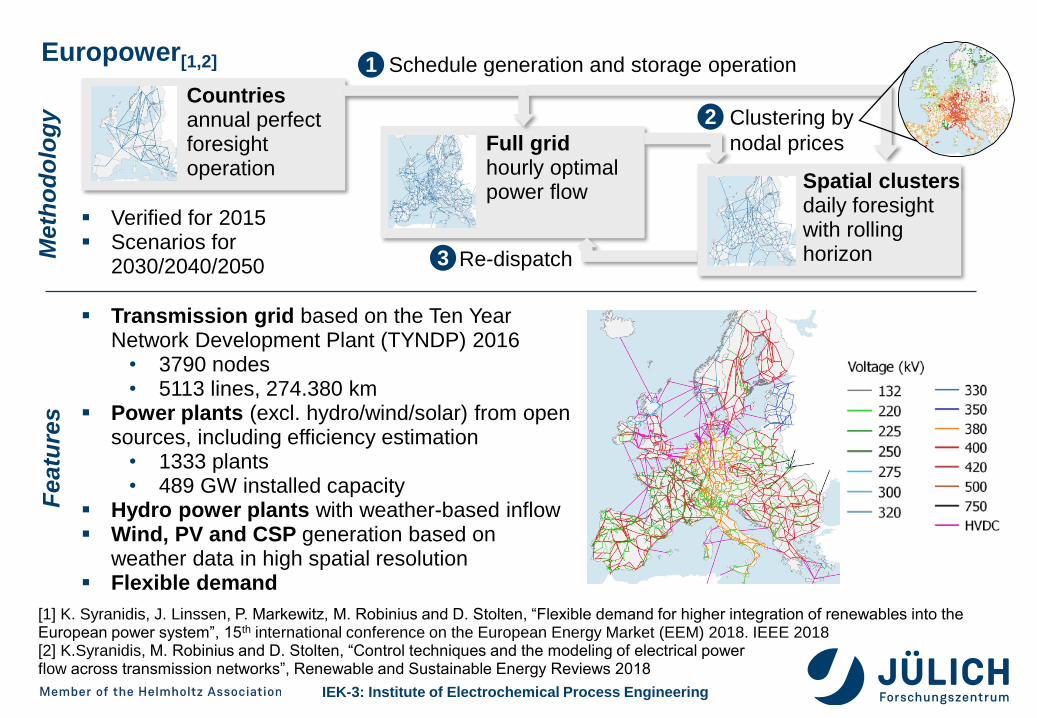
Europower[1,2]M
eth
od
olo
gy
Featu
res
Countries annual perfect foresight operation
[1] K. Syranidis, J. Linssen, P. Markewitz, M. Robinius and D. Stolten, “Flexible demand for higher integration of renewables into the European power system”, 15th international conference on the European Energy Market (EEM) 2018. IEEE 2018[2] K.Syranidis, M. Robinius and D. Stolten, “Control techniques and the modeling of electrical power flow across transmission networks”, Renewable and Sustainable Energy Reviews 2018
Full gridhourly optimal power flow
Transmission grid based on the Ten Year Network Development Plant (TYNDP) 2016
• 3790 nodes• 5113 lines, 274.380 km
Power plants (excl. hydro/wind/solar) from open sources, including efficiency estimation
• 1333 plants• 489 GW installed capacity
Hydro power plants with weather-based inflow Wind, PV and CSP generation based on
weather data in high spatial resolution Flexible demand
1
Spatial clustersdaily foresight with rolling horizonRe-dispatch3
Verified for 2015 Scenarios for
2030/2040/2050
Schedule generation and storage operation
Clustering by
nodal prices
2
IEK-3: Institute of Electrochemical Process Engineering
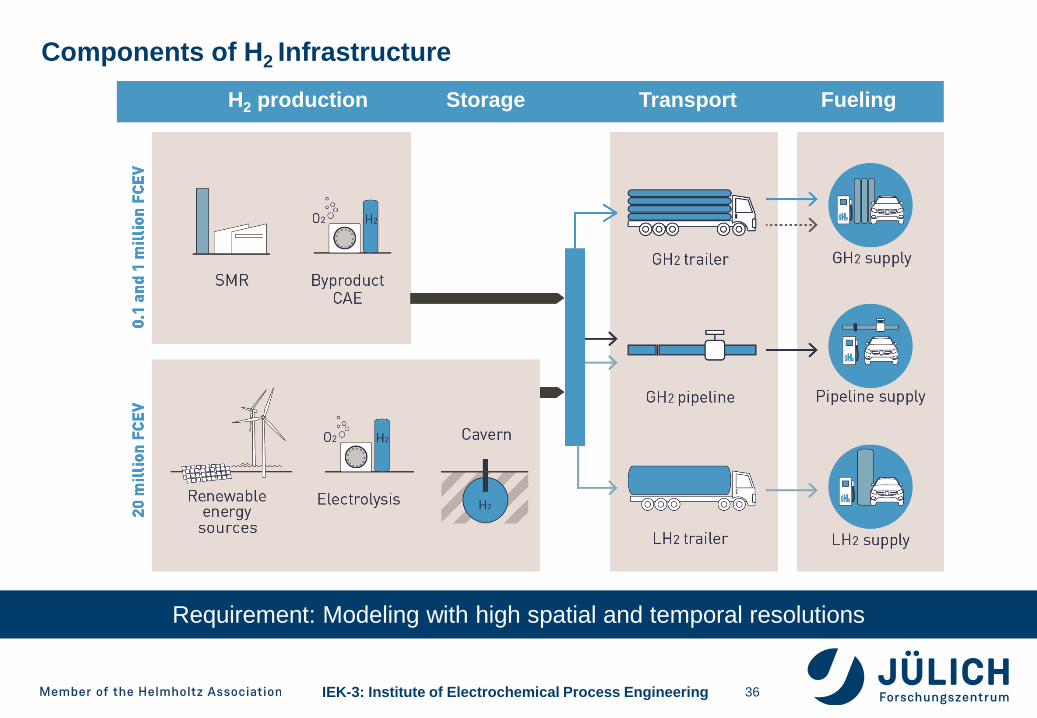
Components of H2 Infrastructure
36
H2 production Storage Transport Fueling
Requirement: Modeling with high spatial and temporal resolutions
IEK-3: Institute of Electrochemical Process Engineering
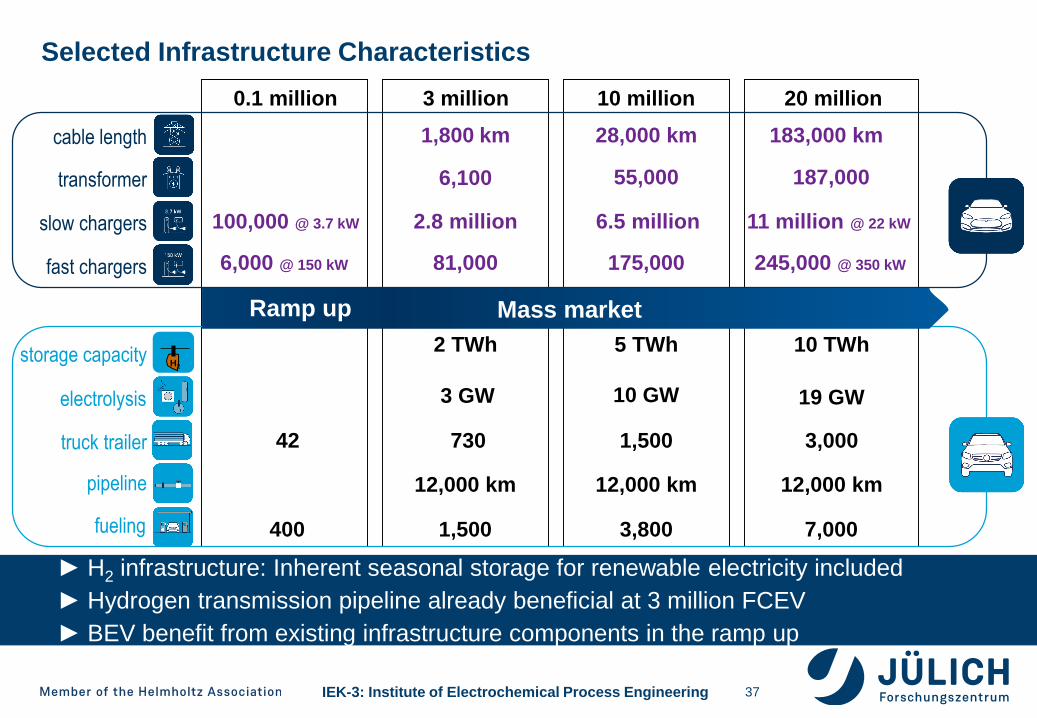
Selected Infrastructure Characteristics
37
► H2 infrastructure: Inherent seasonal storage for renewable electricity included
► Hydrogen transmission pipeline already beneficial at 3 million FCEV
► BEV benefit from existing infrastructure components in the ramp up
400
42
12,000 km
1,500
2 TWh
730
12,000 km
3,800
10 GW
1,500
12,000 km
7,000
19 GW
3,000
11 million @ 22 kW
245,000 @ 350 kW
187,000
0.1 million 10 million3 million 20 million
100,000 @ 3.7 kW
6,000 @ 150 kW
2.8 million
81,000
6,100
6.5 million
175,000
55,000
H2
1,800 km 28,000 km 183,000 km
3 GW
5 TWh 10 TWh
Mass marketRamp up
cable length
transformer
slow chargers
fast chargers
storage capacity
electrolysis
truck trailer
pipeline
fueling
IEK-3: Institute of Electrochemical Process Engineering
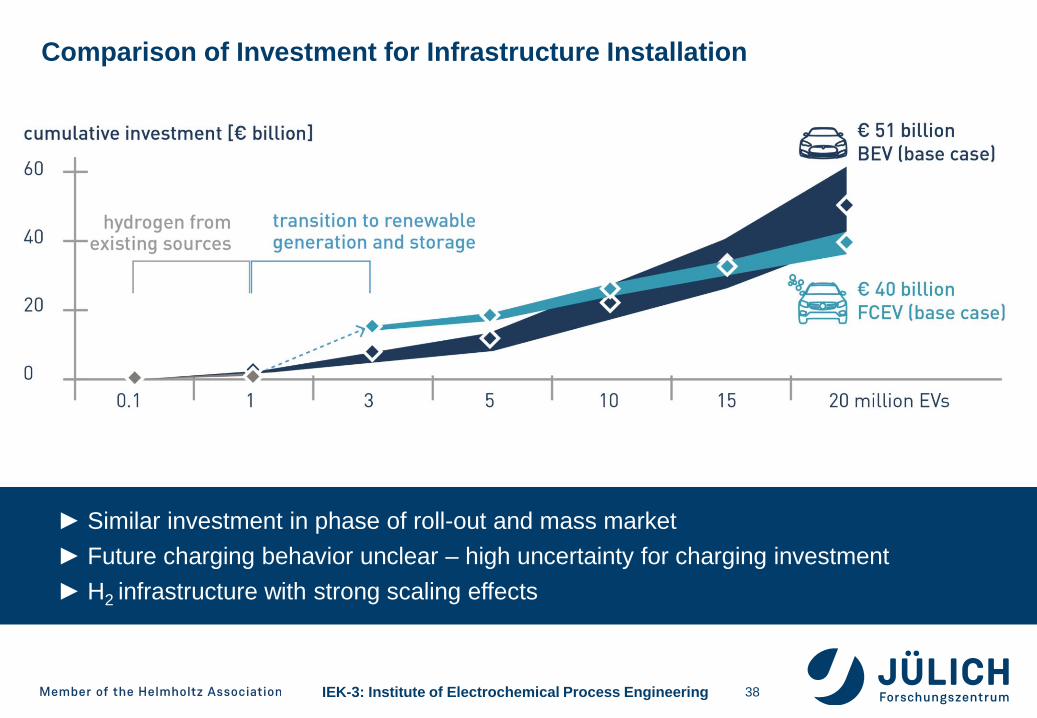
Comparison of Investment for Infrastructure Installation
38
► Similar investment in phase of roll-out and mass market
► Future charging behavior unclear – high uncertainty for charging investment
► H2 infrastructure with strong scaling effects
IEK-3: Institute of Electrochemical Process Engineering
Installation
0
5
10
15
20
25
An
nu
al
inve
stm
en
t
[b
illio
n €
/a]
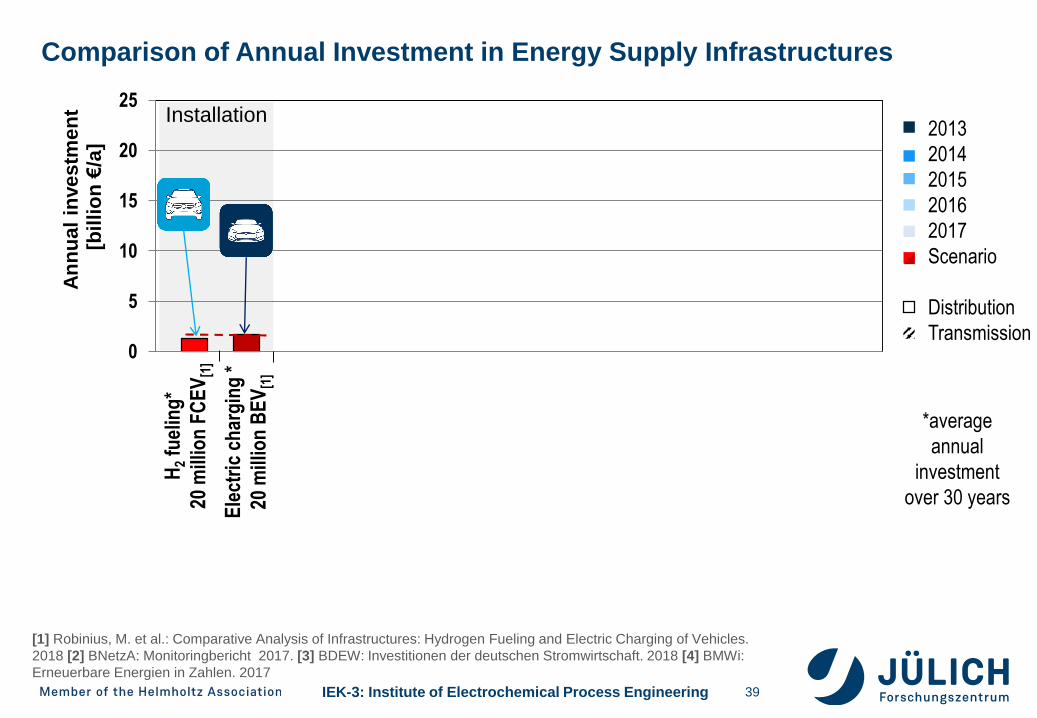
Comparison of Annual Investment in Energy Supply Infrastructures
39
[1] Robinius, M. et al.: Comparative Analysis of Infrastructures: Hydrogen Fueling and Electric Charging of Vehicles.
2018 [2] BNetzA: Monitoringbericht 2017. [3] BDEW: Investitionen der deutschen Stromwirtschaft. 2018 [4] BMWi:
Erneuerbare Energien in Zahlen. 2017
H2
fuel
ing
*
20 m
illio
n F
CE
V[1
]
Ele
ctri
c ch
arg
ing
*
20 m
illio
n B
EV
[1]
*average
annual
investment
over 30 years
2013
2014
2015
2016
2017
Scenario
Distribution
Transmission
IEK-3: Institute of Electrochemical Process Engineering
Installation GridMaintenance and upgrade
0
5
10
15
20
25
An
nu
al
inve
stm
en
t
[b
illio
n €
/a]
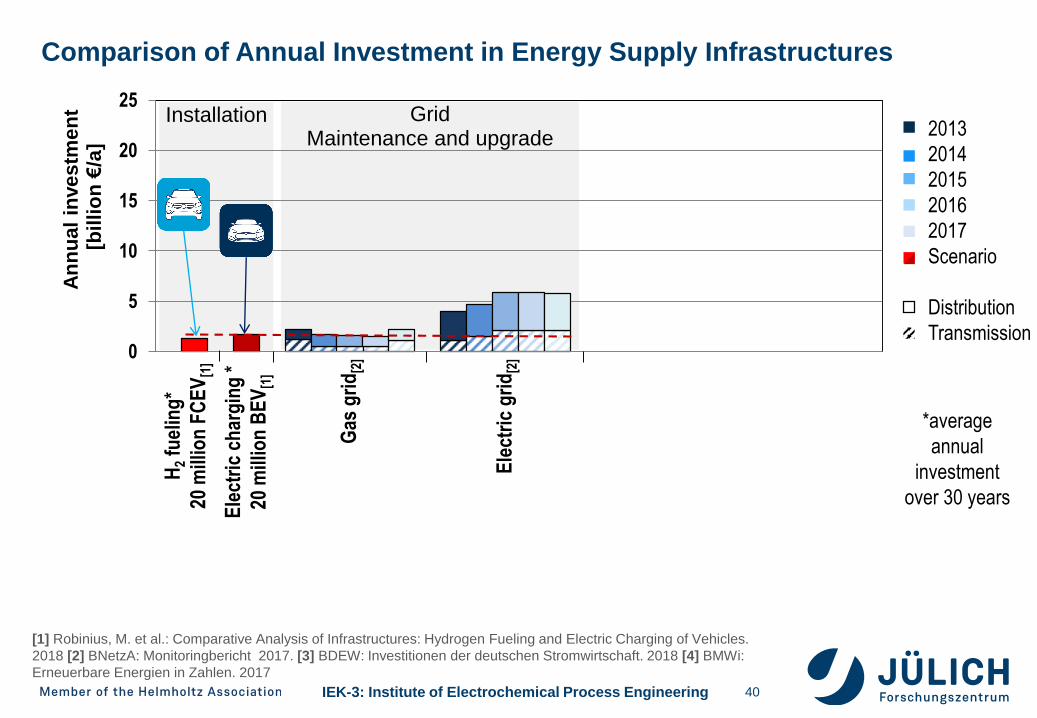
Comparison of Annual Investment in Energy Supply Infrastructures
40
[1] Robinius, M. et al.: Comparative Analysis of Infrastructures: Hydrogen Fueling and Electric Charging of Vehicles.
2018 [2] BNetzA: Monitoringbericht 2017. [3] BDEW: Investitionen der deutschen Stromwirtschaft. 2018 [4] BMWi:
Erneuerbare Energien in Zahlen. 2017
H2
fuel
ing
*
20 m
illio
n F
CE
V[1
]
Ele
ctri
c ch
arg
ing
*
20 m
illio
n B
EV
[1]
Ele
ctri
c g
rid
[2]
Gas
gri
d[2
]
*average
annual
investment
over 30 years
2013
2014
2015
2016
2017
Scenario
Distribution
Transmission
IEK-3: Institute of Electrochemical Process Engineering
GenerationMaintenance and upgrade
GridMaintenance and upgrade
Installation
0
5
10
15
20
25
An
nu
al
investm
en
t
[bil
lio
n €
/a]
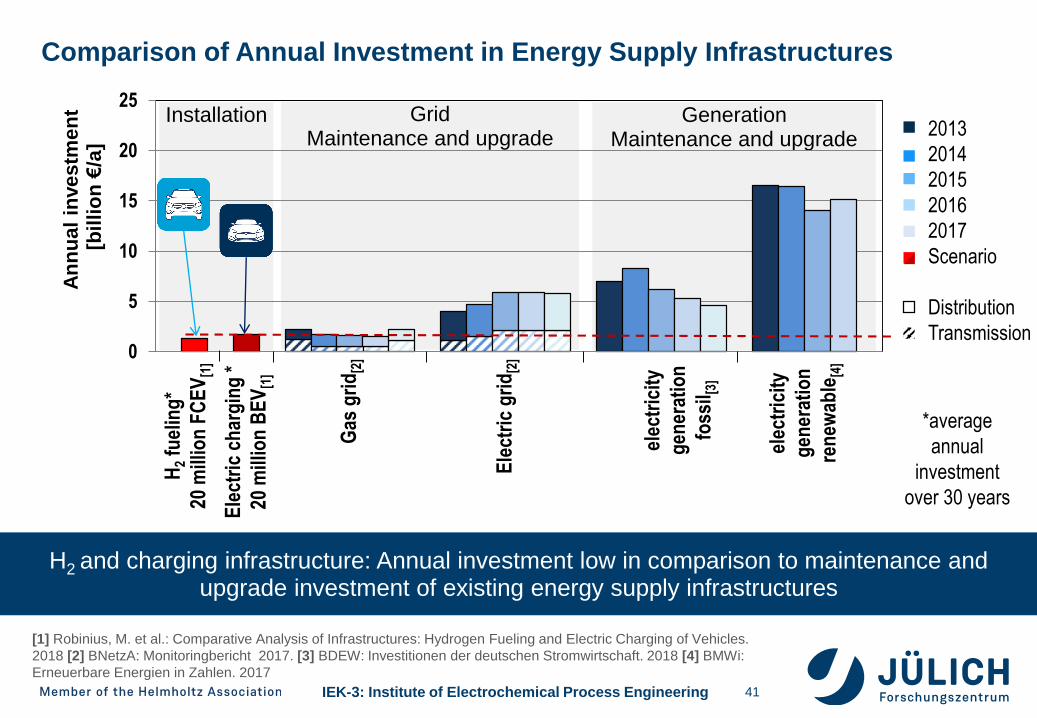
H2 and charging infrastructure: Annual investment low in comparison to maintenance and upgrade investment of existing energy supply infrastructures
Comparison of Annual Investment in Energy Supply Infrastructures
41
[1] Robinius, M. et al.: Comparative Analysis of Infrastructures: Hydrogen Fueling and Electric Charging of Vehicles.
2018 [2] BNetzA: Monitoringbericht 2017. [3] BDEW: Investitionen der deutschen Stromwirtschaft. 2018 [4] BMWi:
Erneuerbare Energien in Zahlen. 2017
H2
fuel
ing
*
20 m
illio
n F
CE
V[1
]
Ele
ctri
c ch
arg
ing
*
20 m
illio
n B
EV
[1]
Ele
ctri
c g
rid
[2]
Gas
gri
d[2
]
elec
tric
ity
gen
erat
ion
ren
ewab
le[4
]
elec
tric
ity
gen
erat
ion
foss
il [3]
*average
annual
investment
over 30 years
2013
2014
2015
2016
2017
Scenario
Distribution
Transmission
IEK-3: Institute of Electrochemical Process Engineering
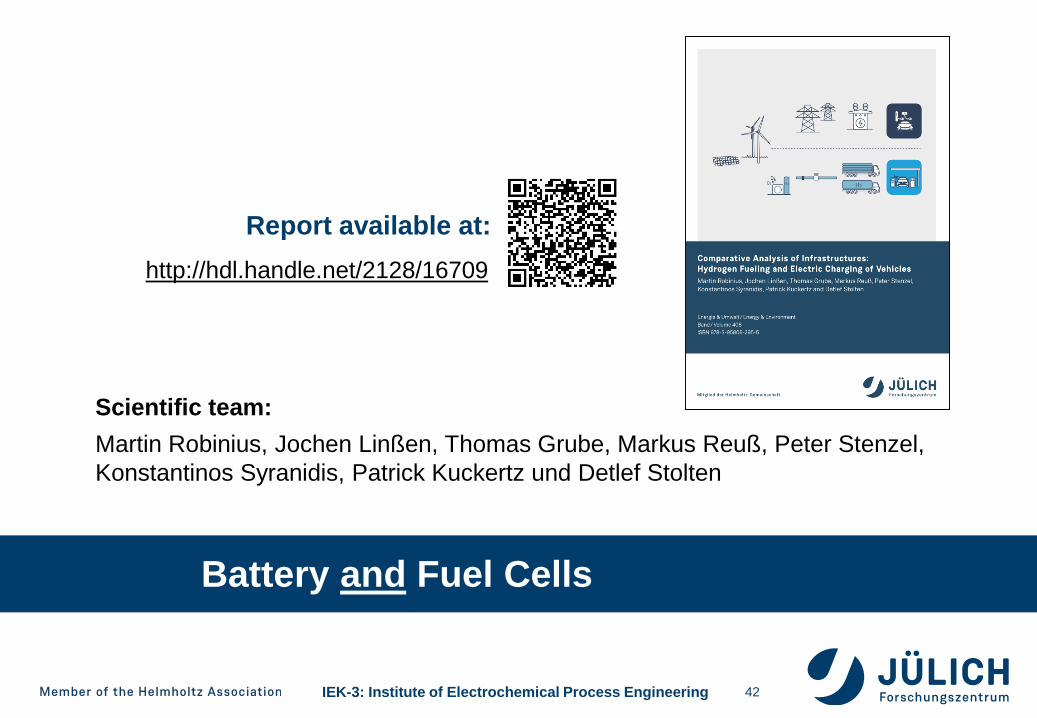
Battery and Fuel Cells
42
http://hdl.handle.net/2128/16709
Scientific team:
Martin Robinius, Jochen Linßen, Thomas Grube, Markus Reuß, Peter Stenzel,
Konstantinos Syranidis, Patrick Kuckertz und Detlef Stolten
Report available at:
IEK-3: Institute of Electrochemical Process Engineering
Table of Contents
43
Sector Coupling – Definition and Literature Review
Multiscale Toolbox for Energy Systems Modeling
- Example Wind Modeling
- Framework for Integrated Energy System Assessment
- Hydrogen Infrastructure Modeling
Comparative Analysis of Infrastructures in Germany
European and Global Pathways
IEK-3: Institute of Electrochemical Process Engineering 44
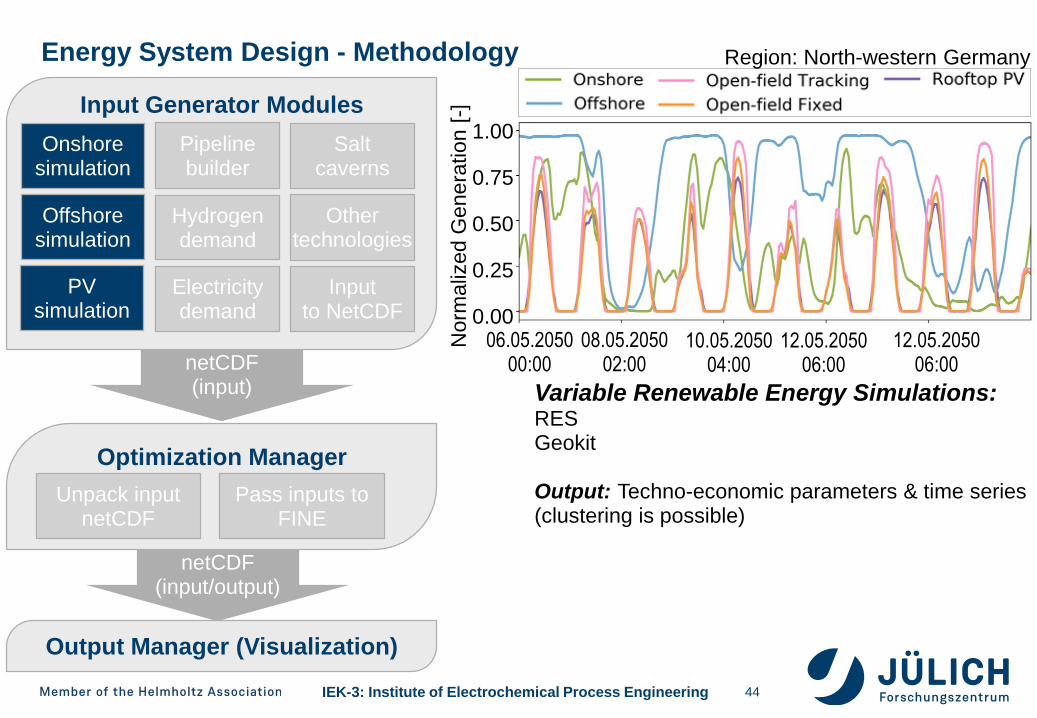
Energy System Design - Methodology
Variable Renewable Energy Simulations:RESGeokit
Output: Techno-economic parameters & time series (clustering is possible)
Input Generator Modules
Onshore simulation
Offshore simulation
PV simulation
Pipeline builder
Hydrogen demand
Electricity demand
Other technologies
Inputto NetCDF
Optimization Manager
Output Manager (Visualization)
netCDF(input)
Unpack inputnetCDF
Pass inputs to FINE
netCDF(input/output)
06.05.205000:00
Norm
aliz
ed
Genera
tion [
-]
1.00
0.75
0.50
0.25
0.0008.05.2050
02:0010.05.2050
04:0012.05.2050
06:0012.05.2050
06:00
Region: North-western Germany
Salt caverns
IEK-3: Institute of Electrochemical Process Engineering 45
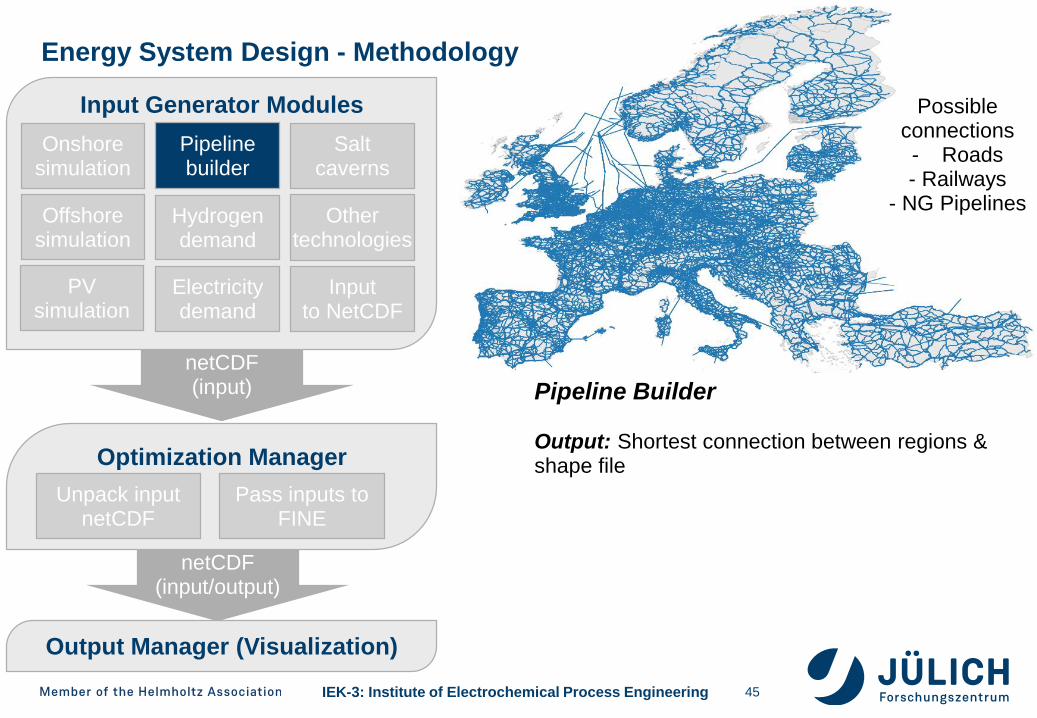
Energy System Design - Methodology
Pipeline Builder
Output: Shortest connection between regions & shape file
Possible connections- Roads- Railways
- NG Pipelines
Input Generator Modules
Onshore simulation
Offshore simulation
PV simulation
Pipeline builder
Hydrogen demand
Electricity demand
Other technologies
Inputto NetCDF
Optimization Manager
Output Manager (Visualization)
netCDF(input)
Unpack inputnetCDF
Pass inputs to FINE
netCDF(input/output)
Salt caverns
IEK-3: Institute of Electrochemical Process Engineering
Input Generator Modules
46
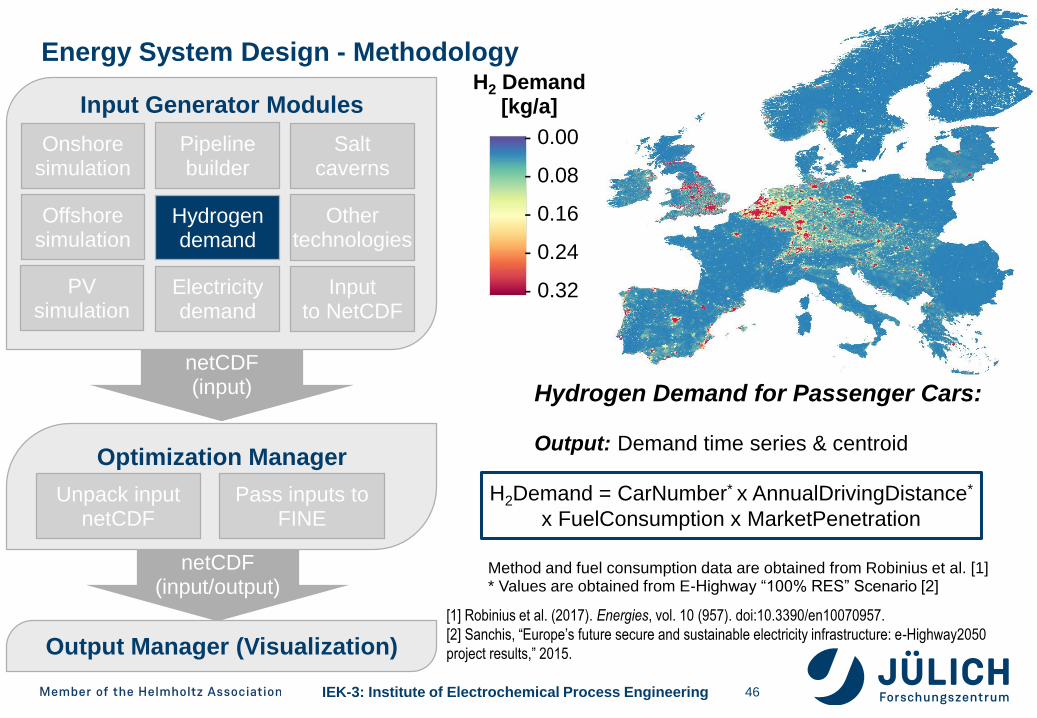
Energy System Design - Methodology
Hydrogen Demand for Passenger Cars:
Output: Demand time series & centroid
H2Demand = CarNumber* x AnnualDrivingDistance*
x FuelConsumption x MarketPenetration
Method and fuel consumption data are obtained from Robinius et al. [1]* Values are obtained from E-Highway “100% RES” Scenario [2]
Hydrogen demand
H2 Demand [kg/a]
- 0.00
- 0.08
- 0.16
- 0.24
- 0.32
Onshore simulation
Offshore simulation
PV simulation
Pipeline builder
Electricity demand
Other technologies
Inputto NetCDF
Optimization Manager
Output Manager (Visualization)
netCDF(input)
Unpack inputnetCDF
Pass inputs to FINE
netCDF(input/output)
[1] Robinius et al. (2017). Energies, vol. 10 (957). doi:10.3390/en10070957.
[2] Sanchis, “Europe’s future secure and sustainable electricity infrastructure: e-Highway2050
project results,” 2015.
Salt caverns
IEK-3: Institute of Electrochemical Process Engineering
Input Generator Modules
47
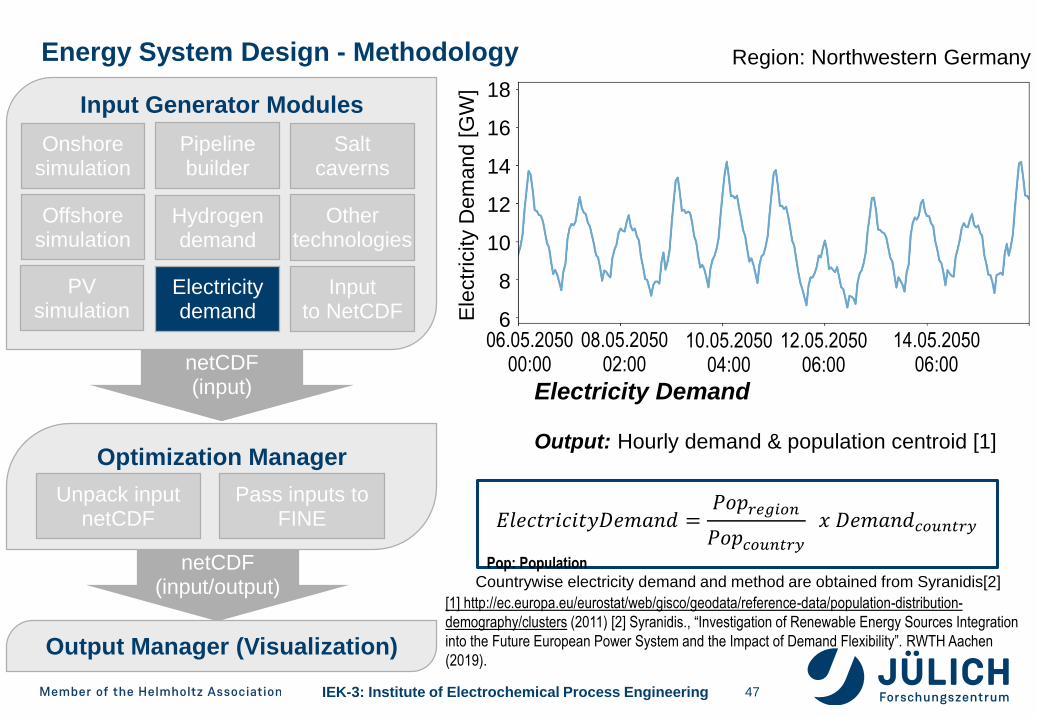
Energy System Design - Methodology
Electricity Demand
Output: Hourly demand & population centroid [1]
Countrywise electricity demand and method are obtained from Syranidis[2]
𝐸𝑙𝑒𝑐𝑡𝑟𝑖𝑐𝑖𝑡𝑦𝐷𝑒𝑚𝑎𝑛𝑑 =𝑃𝑜𝑝𝑟𝑒𝑔𝑖𝑜𝑛
𝑃𝑜𝑝𝑐𝑜𝑢𝑛𝑡𝑟𝑦𝑥 𝐷𝑒𝑚𝑎𝑛𝑑𝑐𝑜𝑢𝑛𝑡𝑟𝑦
Pop: Population
Electricity demand
Onshore simulation
Offshore simulation
PV simulation
Pipeline builder
Hydrogen demand
Salt caverns
Other technologies
Inputto NetCDF
Optimization Manager
Output Manager (Visualization)
netCDF(input)
Unpack inputnetCDF
Pass inputs to FINE
netCDF(input/output)
06.05.205000:00
08.05.205002:00
10.05.205004:00
12.05.205006:00
14.05.205006:00
18
16
14
12
10
8
6Ele
ctr
icity D
em
and
[G
W]
Region: Northwestern Germany
[1] http://ec.europa.eu/eurostat/web/gisco/geodata/reference-data/population-distribution-
demography/clusters (2011) [2] Syranidis., “Investigation of Renewable Energy Sources Integration
into the Future European Power System and the Impact of Demand Flexibility”. RWTH Aachen
(2019).
IEK-3: Institute of Electrochemical Process Engineering
Input Generator Modules
48
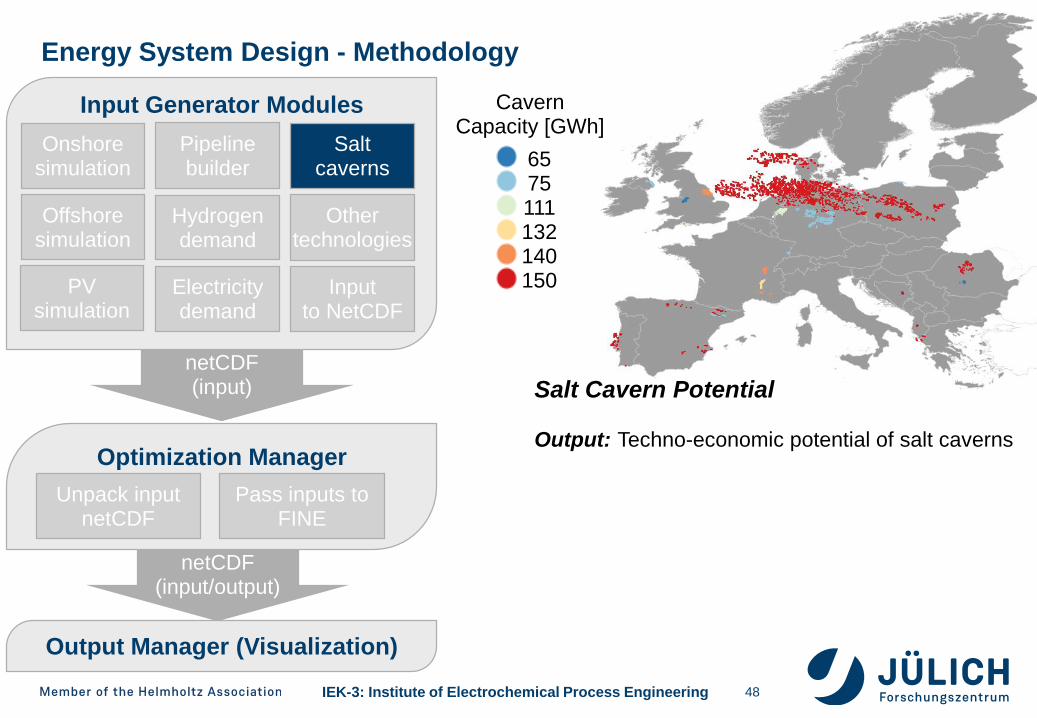
Energy System Design - Methodology
Salt Cavern Potential
Output: Techno-economic potential of salt caverns
Salt caverns
Cavern Capacity [GWh]
6575111132140150Electricity
demand
Onshore simulation
Offshore simulation
PV simulation
Pipeline builder
Hydrogen demand
Other technologies
Inputto NetCDF
Optimization Manager
Output Manager (Visualization)
netCDF(input)
Unpack inputnetCDF
Pass inputs to FINE
netCDF(input/output)
IEK-3: Institute of Electrochemical Process Engineering
Input Generator Modules
49
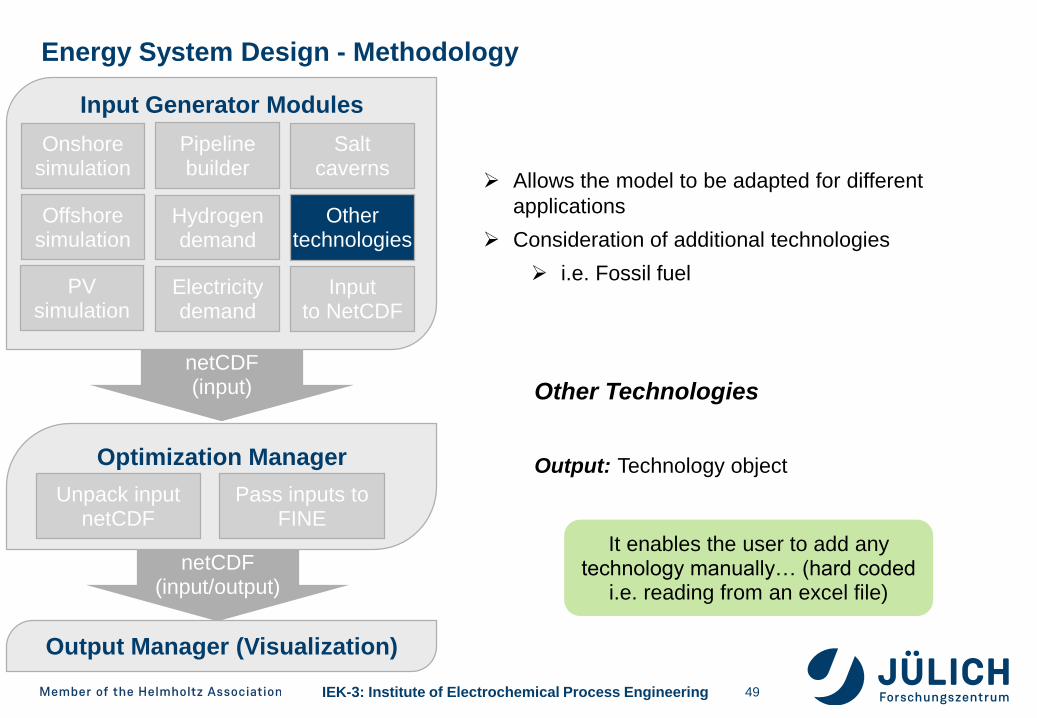
Energy System Design - Methodology
Other Technologies
Output: Technology object
Other technologies
Salt caverns
Electricity demand
Onshore simulation
Offshore simulation
PV simulation
Pipeline builder
Hydrogen demand
Inputto NetCDF
Optimization Manager
Output Manager (Visualization)
netCDF(input)
Unpack inputnetCDF
Pass inputs to FINE
netCDF(input/output)
Allows the model to be adapted for different
applications
Consideration of additional technologies
i.e. Fossil fuel
It enables the user to add any technology manually… (hard coded
i.e. reading from an excel file)
IEK-3: Institute of Electrochemical Process Engineering 50
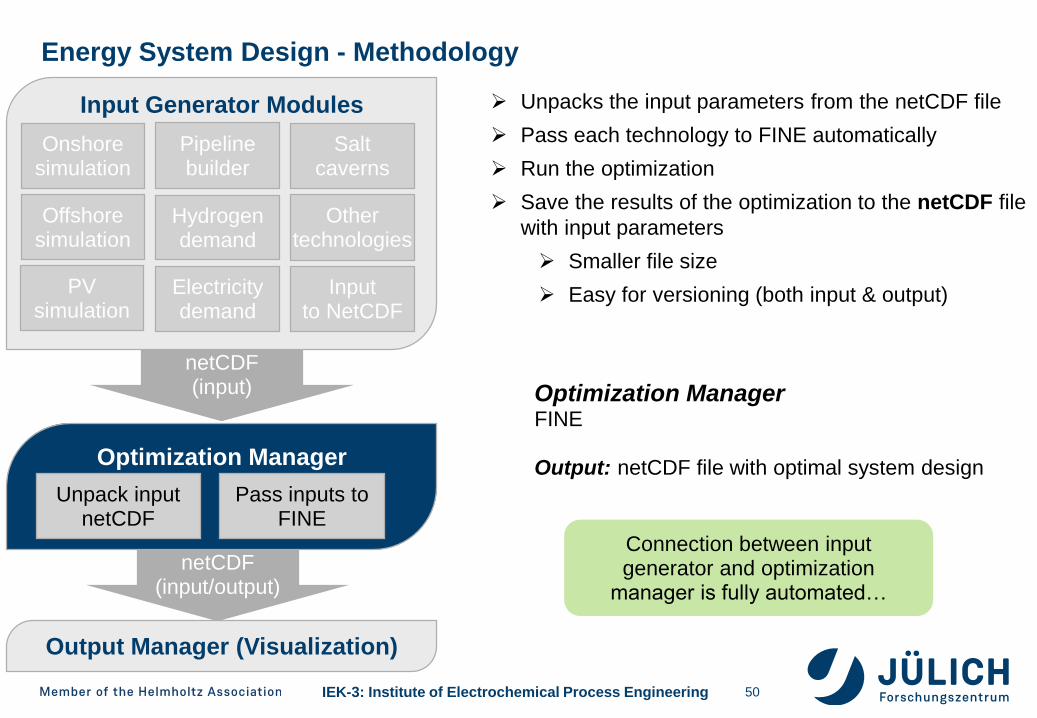
Energy System Design - Methodology
Optimization ManagerFINE
Output: netCDF file with optimal system design
Input Generator Modules
Salt caverns
Electricity demand
Onshore simulation
Offshore simulation
PV simulation
Pipeline builder
Hydrogen demand
Other technologies
Inputto NetCDF
Optimization Manager
Output Manager (Visualization)
netCDF(input)
Unpack inputnetCDF
Pass inputs to FINE
netCDF(input/output)
Unpacks the input parameters from the netCDF file
Pass each technology to FINE automatically
Run the optimization
Save the results of the optimization to the netCDF file
with input parameters
Smaller file size
Easy for versioning (both input & output)
Connection between input generator and optimization
manager is fully automated…
IEK-3: Institute of Electrochemical Process Engineering 51
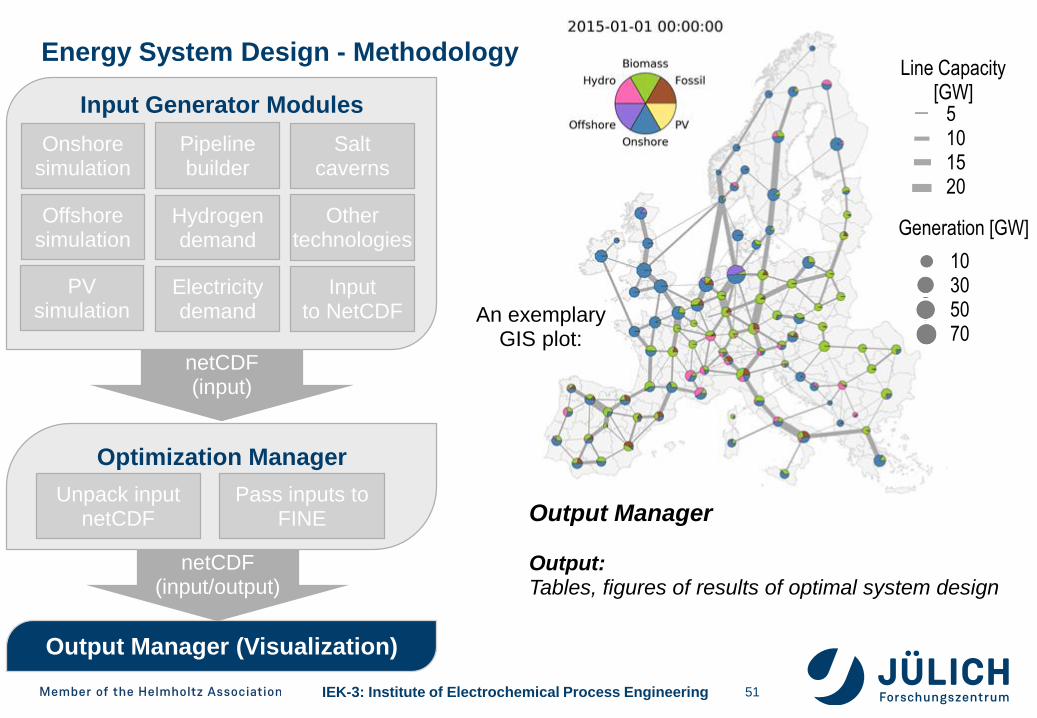
Energy System Design - Methodology
Output Manager
Output:Tables, figures of results of optimal system design
Input Generator Modules
Other technologies
Salt caverns
Electricity demand
Onshore simulation
Offshore simulation
PV simulation
Pipeline builder
Hydrogen demand
Inputto NetCDF
Optimization Manager
Output Manager (Visualization)
netCDF(input)
Unpack inputnetCDF
Pass inputs to FINE
netCDF(input/output)
An exemplary GIS plot:
Generation [GW]
10305070
5101520
Line Capacity[GW]
IEK-3: Institute of Electrochemical Process Engineering 52
European Reference Scenario Definition & Results
IEK-3: Institute of Electrochemical Process Engineering
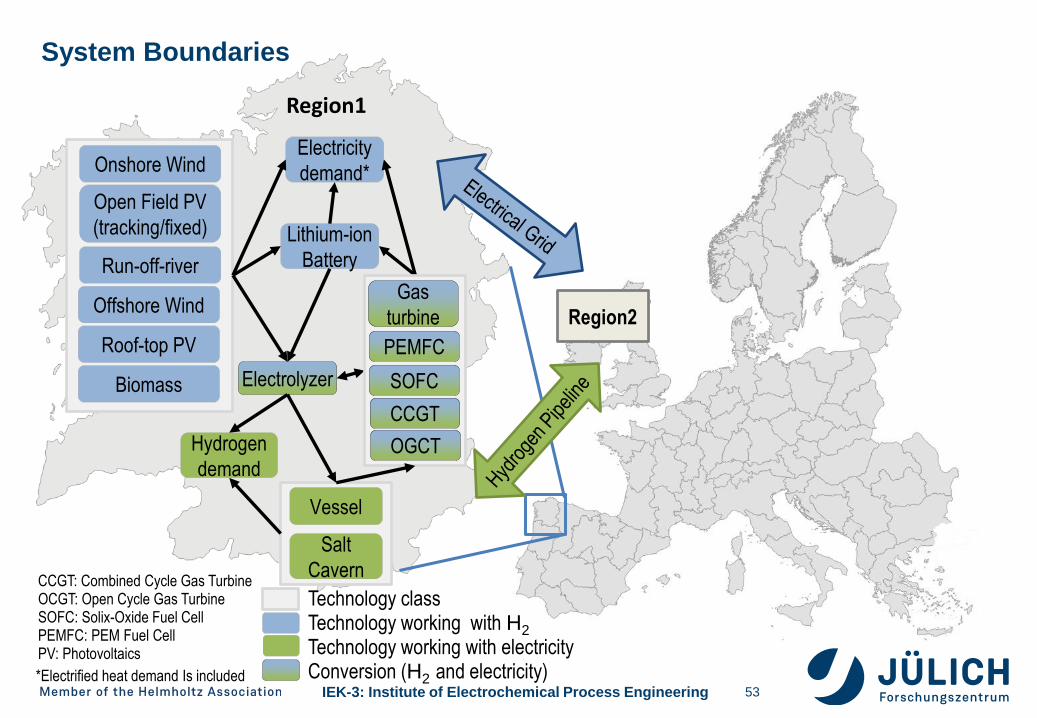
Electricity
demand*
Hydrogen
demand
Onshore Wind
Offshore Wind
Open Field PV
(tracking/fixed)
Roof-top PV
Run-off-river
Biomass Electrolyzer
Vessel
Salt
Cavern
Lithium-ion
Battery
Region2
Region1
SOFC
CCGT
OGCT
PEMFC
Gas
turbine
System Boundaries
53*Electrified heat demand Is included
CCGT: Combined Cycle Gas TurbineOCGT: Open Cycle Gas TurbineSOFC: Solix-Oxide Fuel CellPEMFC: PEM Fuel CellPV: Photovoltaics
Technology classTechnology working with H2
Technology working with electricityConversion (H2 and electricity)
IEK-3: Institute of Electrochemical Process Engineering
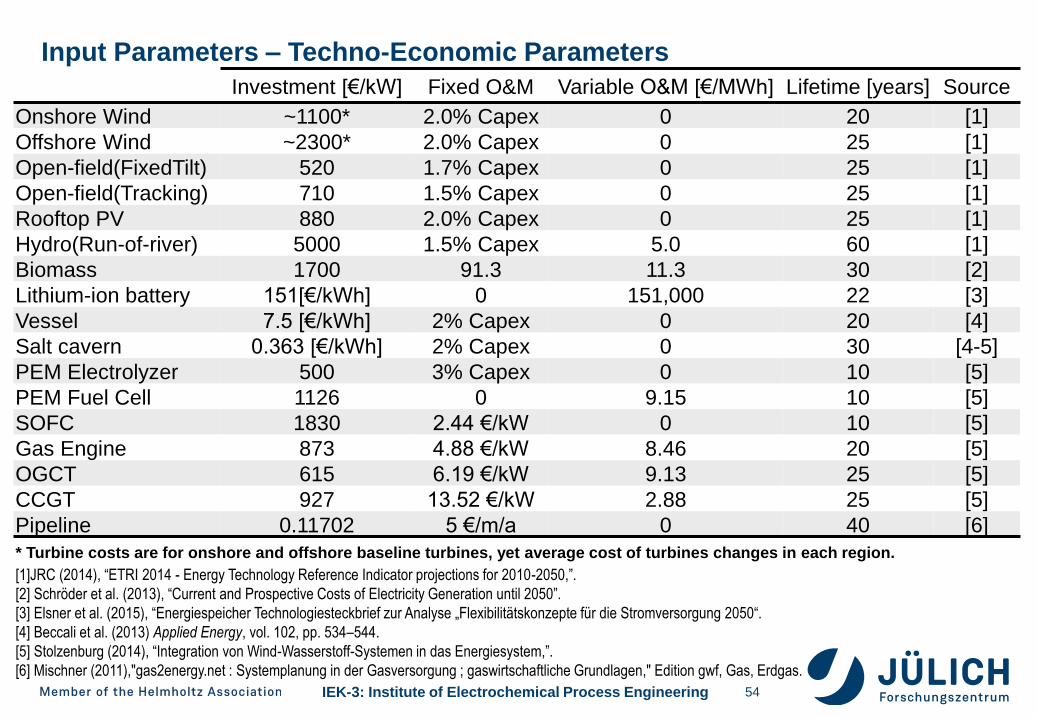
Input Parameters – Techno-Economic Parameters
54
* Turbine costs are for onshore and offshore baseline turbines, yet average cost of turbines changes in each region.
Investment [€/kW] Fixed O&M Variable O&M [€/MWh] Lifetime [years] Source
Onshore Wind ~1100* 2.0% Capex 0 20 [1]
Offshore Wind ~2300* 2.0% Capex 0 25 [1]
Open-field(FixedTilt) 520 1.7% Capex 0 25 [1]
Open-field(Tracking) 710 1.5% Capex 0 25 [1]
Rooftop PV 880 2.0% Capex 0 25 [1]
Hydro(Run-of-river) 5000 1.5% Capex 5.0 60 [1]
Biomass 1700 91.3 11.3 30 [2]
Lithium-ion battery 151[€/kWh] 0 151,000 22 [3]
Vessel 7.5 [€/kWh] 2% Capex 0 20 [4]
Salt cavern 0.363 [€/kWh] 2% Capex 0 30 [4-5]
PEM Electrolyzer 500 3% Capex 0 10 [5]
PEM Fuel Cell 1126 0 9.15 10 [5]
SOFC 1830 2.44 €/kW 0 10 [5]
Gas Engine 873 4.88 €/kW 8.46 20 [5]
OGCT 615 6.19 €/kW 9.13 25 [5]
CCGT 927 13.52 €/kW 2.88 25 [5]
Pipeline 0.11702 5 €/m/a 0 40 [6]
[1]JRC (2014), “ETRI 2014 - Energy Technology Reference Indicator projections for 2010-2050,”.
[2] Schröder et al. (2013), “Current and Prospective Costs of Electricity Generation until 2050”.
[3] Elsner et al. (2015), “Energiespeicher Technologiesteckbrief zur Analyse „Flexibilitätskonzepte für die Stromversorgung 2050“.
[4] Beccali et al. (2013) Applied Energy, vol. 102, pp. 534–544.
[5] Stolzenburg (2014), “Integration von Wind-Wasserstoff-Systemen in das Energiesystem,”.
[6] Mischner (2011),"gas2energy.net : Systemplanung in der Gasversorgung ; gaswirtschaftliche Grundlagen," Edition gwf, Gas, Erdgas.
IEK-3: Institute of Electrochemical Process Engineering
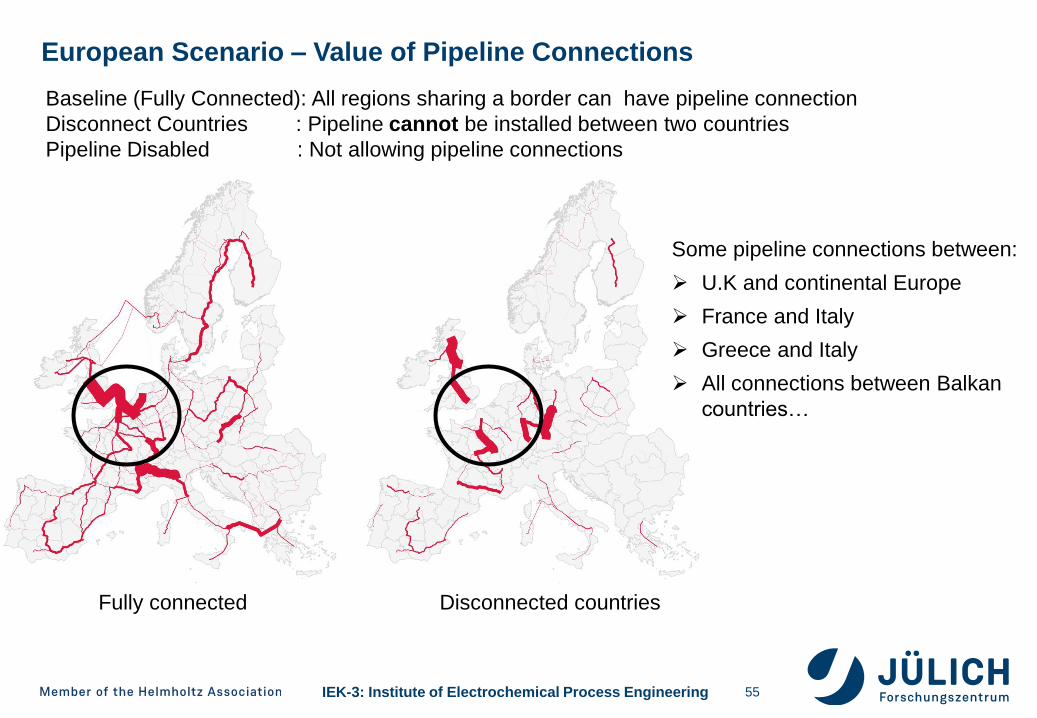
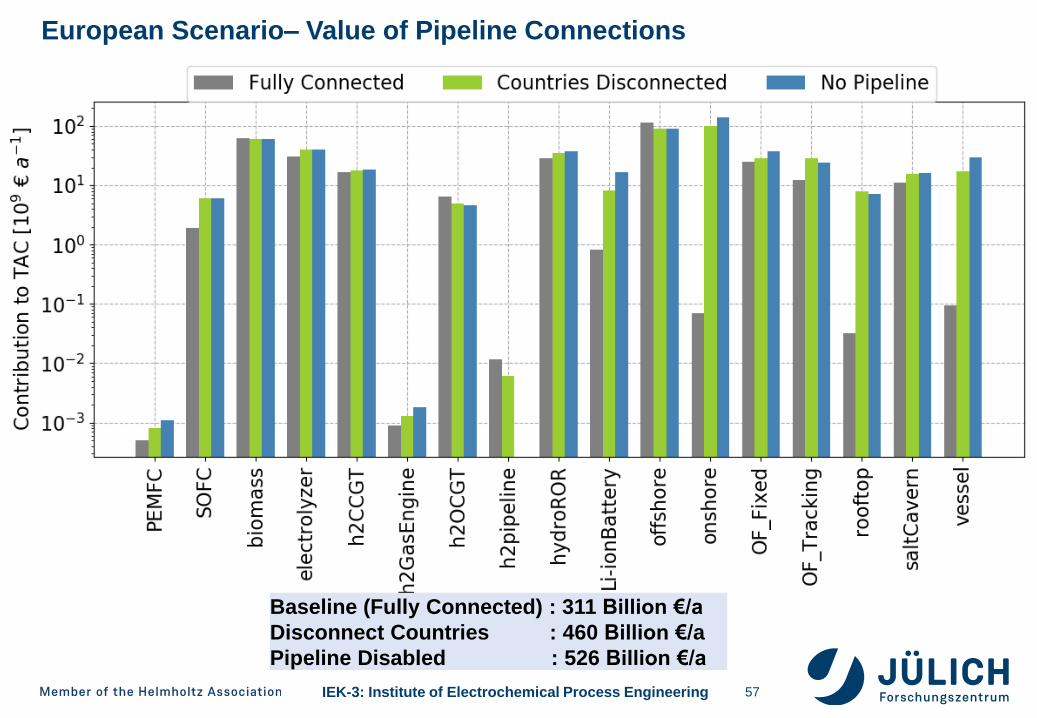
European Scenario – Value of Pipeline Connections
55
Baseline (Fully Connected): All regions sharing a border can have pipeline connection
Disconnect Countries : Pipeline cannot be installed between two countries
Pipeline Disabled : Not allowing pipeline connections
Fully connected Disconnected countries
Some pipeline connections between:
U.K and continental Europe
France and Italy
Greece and Italy
All connections between Balkan
countries…
IEK-3: Institute of Electrochemical Process Engineering
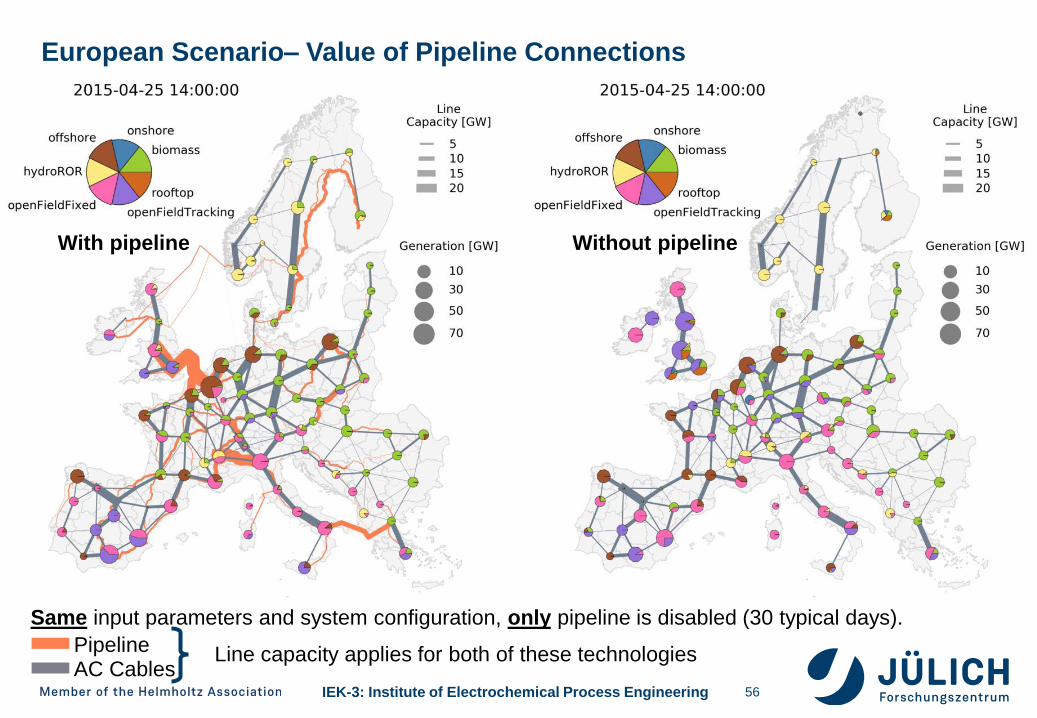
European Scenario– Value of Pipeline Connections
56
With pipeline Without pipeline
Same input parameters and system configuration, only pipeline is disabled (30 typical days).
PipelineAC Cables
Line capacity applies for both of these technologies
IEK-3: Institute of Electrochemical Process Engineering
European Scenario– Value of Pipeline Connections
57
Baseline (Fully Connected) : 311 Billion €/a
Disconnect Countries : 460 Billion €/a
Pipeline Disabled : 526 Billion €/a
IEK-3: Institute of Electrochemical Process Engineering
Global Hydrogen Supply Pathways
58
IEK-3: Institute of Electrochemical Process Engineering
Ele
ctr
icity
Ele
ctr
o-
lysis
Pip
elin
e
Liq
ue-
factio
n
Sto
rage
H2 c
osts
at po
rt
Sh
ipp
ing
Import
costs
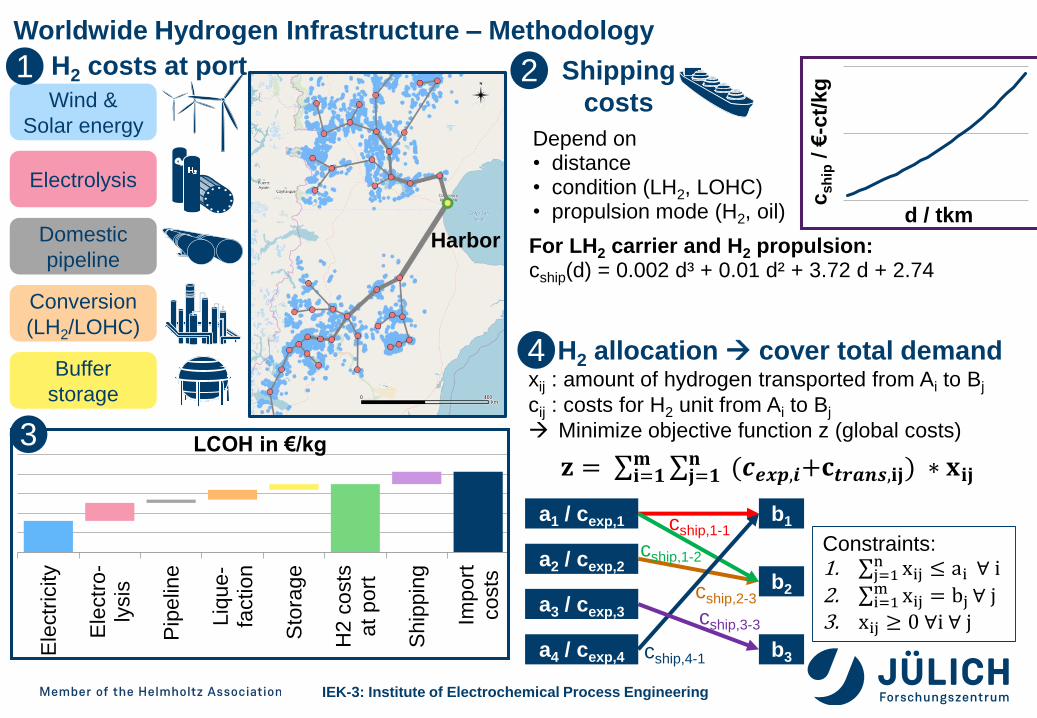
LCOH in €/kg
Wind &
Solar energy
Electrolysis
Domestic
pipeline
Conversion
(LH2/LOHC)
Buffer
storage
Shipping
costs
Worldwide Hydrogen Infrastructure – Methodology
H2 costs at port
csh
ip/
€-c
t/k
g
d / tkm
For LH2 carrier and H2 propulsion:cship(d) = 0.002 d³ + 0.01 d² + 3.72 d + 2.74
H2 allocation cover total demandxij : amount of hydrogen transported from Ai to Bj
cij : costs for H2 unit from Ai to Bj
Minimize objective function z (global costs)
𝐳 = σ𝐢=𝟏𝐦 σ𝐣=𝟏
𝐧 (𝒄𝒆𝒙𝒑,𝒊+𝐜𝒕𝒓𝒂𝒏𝒔,𝐢𝐣) ∗ 𝐱𝐢𝐣
a1 / cexp,1 b1
b2
b3
cship,1-1
a2 / cexp,2
a3 / cexp,3
a4 / cexp,4
cship,1-2
cship,3-3
cship,4-1
Constraints: 1. σj=1
n xij ≤ ai ∀ i
2. σi=1m xij = bj ∀ j
3. xij ≥ 0 ∀i ∀ j
cship,2-3
Harbor
Depend on• distance• condition (LH2, LOHC)• propulsion mode (H2, oil)
1 2
3
4
IEK-3: Institute of Electrochemical Process Engineering
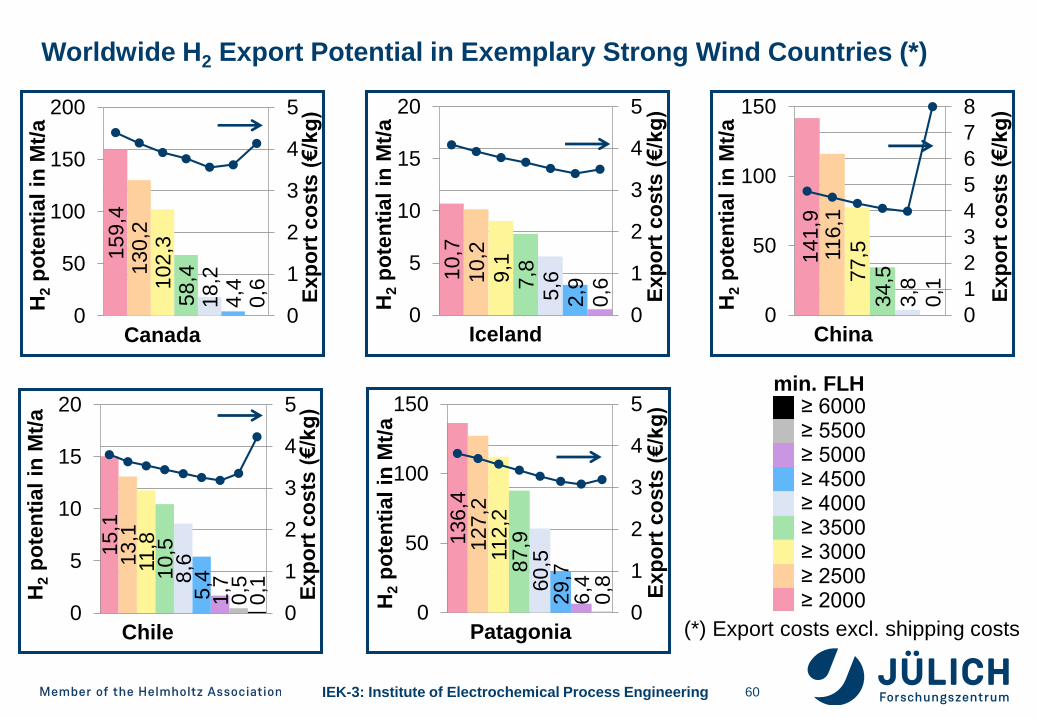
Worldwide H2 Export Potential in Exemplary Strong Wind Countries (*)
60
13
6,4
12
7,2
11
2,2
87
,96
0,5
29
,76
,40
,80
1
2
3
4
5
0
50
100
150
Exp
ort
co
sts
(€/k
g)
H2
po
ten
tial
in M
t/a
Patagonia
15
,11
3,1
11,8
10
,58
,65
,41
,70
,50
,1
0
1
2
3
4
5
0
5
10
15
20
Ex
po
rt c
os
ts(€
/kg
)
H2
po
ten
tial
in M
t/a
Chile
15
9,4
13
0,2
10
2,3
58
,41
8,2
4,4
0,6
0
1
2
3
4
5
0
50
100
150
200
Exp
ort
co
sts
(€/k
g)
H2
po
ten
tial
in M
t/a
Canada
14
1,9
116,1
77
,5
34
,5
3,8
0,1
0
1
2
3
4
5
6
7
8
0
50
100
150
Exp
ort
co
sts
(€/k
g)
H2
po
ten
tial
in M
t/a
China
(*) Export costs excl. shipping costs
10
,71
0,2
9,1
7,8
5,6
2,9
0,6
0
1
2
3
4
5
0
5
10
15
20
Exp
ort
co
sts
(€/k
g)
H2
po
ten
tial
in M
t/a
Iceland
≥ 6000≥ 5500≥ 5000≥ 4500≥ 4000≥ 3500≥ 3000≥ 2500≥ 2000
min. FLH
IEK-3: Institute of Electrochemical Process Engineering
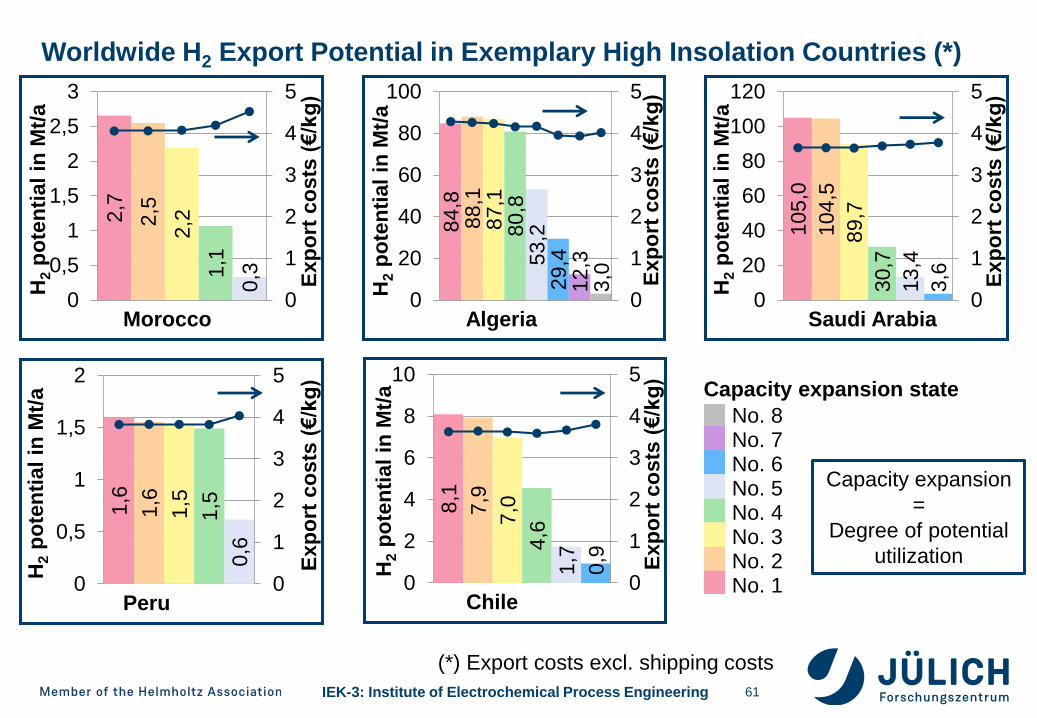
Worldwide H2 Export Potential in Exemplary High Insolation Countries (*)
61
84,8
88
,18
7,1
80
,85
3,2
29
,41
2,3
3,0
0
1
2
3
4
5
0
20
40
60
80
100
Exp
ort
co
sts
(€/k
g)
H2
po
ten
tial
in M
t/a
Algeria
8,1
7,9
7,0
4,6
1,7
0,9
0
1
2
3
4
5
0
2
4
6
8
10
Exp
ort
co
sts
(€/k
g)
H2
po
ten
tial
in M
t/a
Chile
10
5,0
10
4,5
89
,7
30,7
13
,4
3,6
0
1
2
3
4
5
0
20
40
60
80
100
120
Exp
ort
co
sts
(€/k
g)
H2
po
ten
tial
in M
t/a
Saudi Arabia
1,6
1,6
1,5
1,5
0,6
0
1
2
3
4
5
0
0,5
1
1,5
2
Exp
ort
co
sts
(€/k
g)
H2
po
ten
tia
l in
Mt/
a
Peru
(*) Export costs excl. shipping costs
2,7
2,5
2,2
1,1
0,3
0
1
2
3
4
5
0
0,5
1
1,5
2
2,5
3
Exp
ort
co
sts
(€/k
g)
H2
po
ten
tial
in M
t/a
Morocco
No. 8 No. 7No. 6No. 5No. 4No. 3No. 2No. 1
Capacity expansion
=
Degree of potential
utilization
Capacity expansion state
IEK-3: Institute of Electrochemical Process Engineering 62
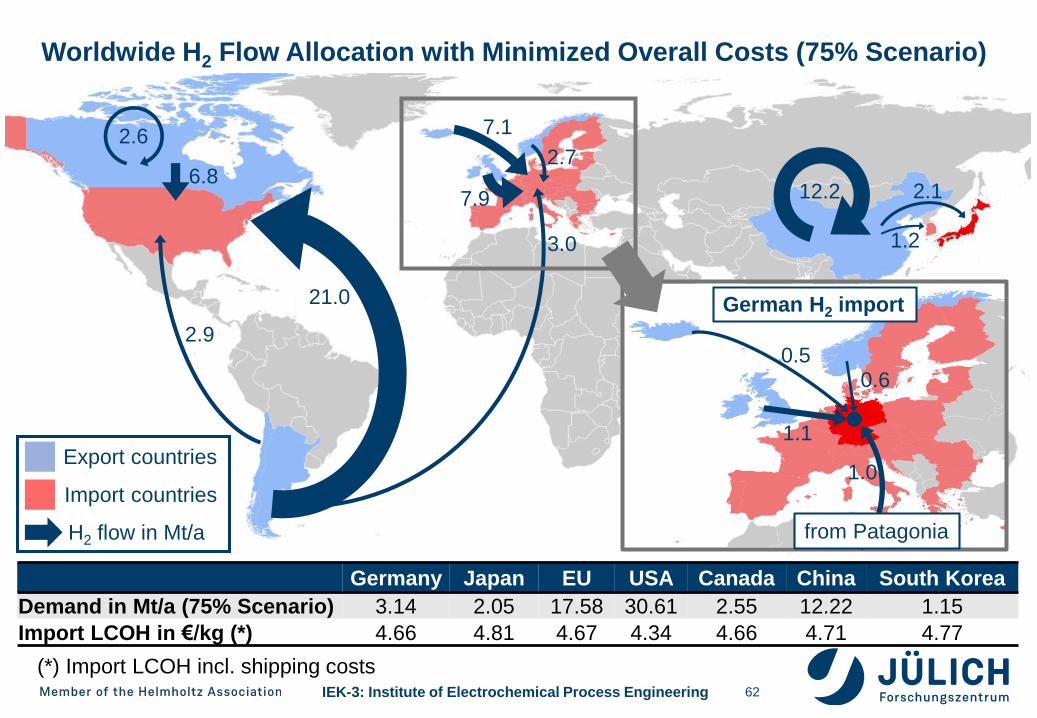
Worldwide H2 Flow Allocation with Minimized Overall Costs (75% Scenario)
6.8
2.6
12.2
2.9
21.0
2.1
1.2
7.9
7.1
2.7
3.0
0.50.6
1.1
1.0
from Patagonia
German H2 import
H2 flow in Mt/a
Germany Japan EU USA Canada China South Korea
Demand in Mt/a (75% Scenario) 3.14 2.05 17.58 30.61 2.55 12.22 1.15
Import LCOH in €/kg (*) 4.66 4.81 4.67 4.34 4.66 4.71 4.77
(*) Import LCOH incl. shipping costs
Export countries
Import countries
IEK-3: Institute of Electrochemical Process Engineering
Thank you for your attention
Dr. Martin Robinius
Head of Systems Analysis (IEK-3)
63
IEK-3: Institute of Electrochemical Process Engineering
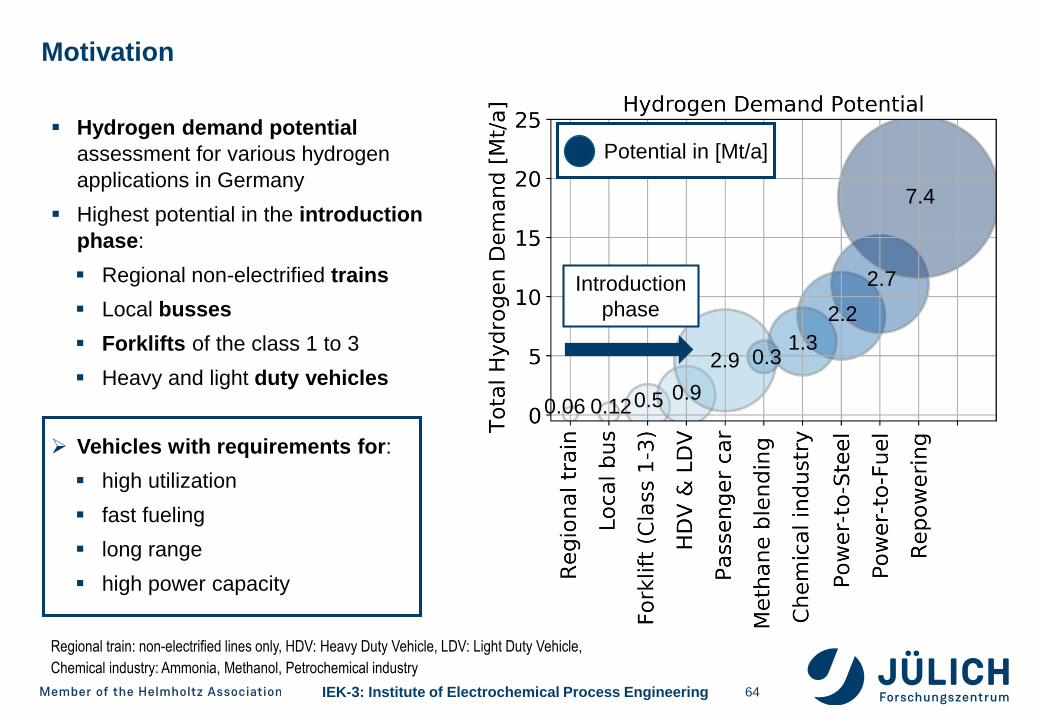
Hydrogen demand potential
assessment for various hydrogen
applications in Germany
Highest potential in the introduction
phase:
Regional non-electrified trains
Local busses
Forklifts of the class 1 to 3
Heavy and light duty vehicles
Vehicles with requirements for:
high utilization
fast fueling
long range
high power capacity
Motivation
64
Regional train: non-electrified lines only, HDV: Heavy Duty Vehicle, LDV: Light Duty Vehicle,
Chemical industry: Ammonia, Methanol, Petrochemical industry
Potential in [Mt/a]
Introduction
phase
7.4
2.7
2.2
2.91.3
0.3
0.120.060.90.5
IEK-3: Institute of Electrochemical Process Engineering
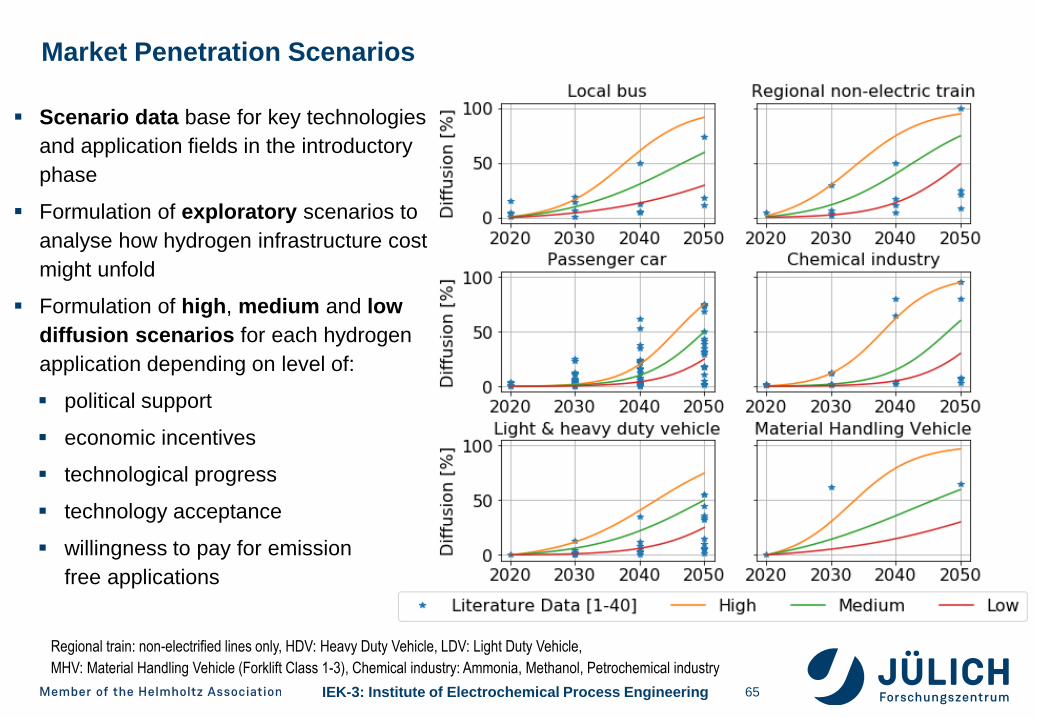
Market Penetration Scenarios
65
Regional train: non-electrified lines only, HDV: Heavy Duty Vehicle, LDV: Light Duty Vehicle,
MHV: Material Handling Vehicle (Forklift Class 1-3), Chemical industry: Ammonia, Methanol, Petrochemical industry
Scenario data base for key technologies
and application fields in the introductory
phase
Formulation of exploratory scenarios to
analyse how hydrogen infrastructure cost
might unfold
Formulation of high, medium and low
diffusion scenarios for each hydrogen
application depending on level of:
political support
economic incentives
technological progress
technology acceptance
willingness to pay for emission
free applications
IEK-3: Institute of Electrochemical Process Engineering
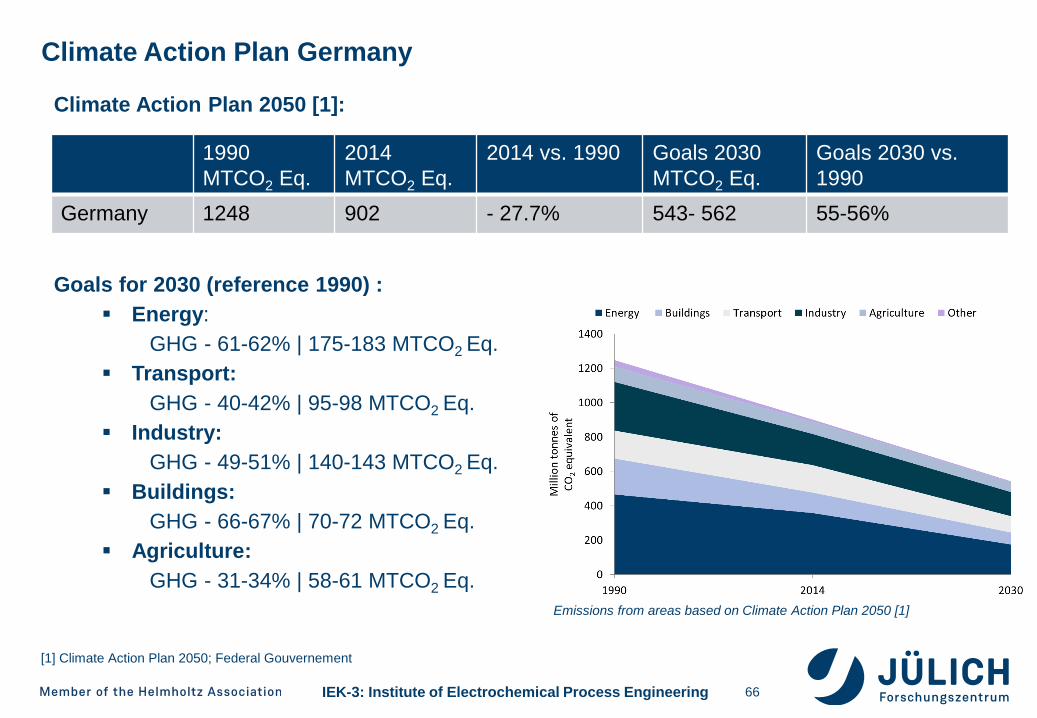
Climate Action Plan Germany
66
Climate Action Plan 2050 [1]:
Goals for 2030 (reference 1990) :
Energy:
GHG - 61-62% | 175-183 MTCO2 Eq.
Transport:
GHG - 40-42% | 95-98 MTCO2 Eq.
Industry:
GHG - 49-51% | 140-143 MTCO2 Eq.
Buildings:
GHG - 66-67% | 70-72 MTCO2 Eq.
Agriculture:
GHG - 31-34% | 58-61 MTCO2 Eq.
[1] Climate Action Plan 2050; Federal Gouvernement
Emissions from areas based on Climate Action Plan 2050 [1]
1990
MTCO2 Eq.
2014
MTCO2 Eq.
2014 vs. 1990 Goals 2030
MTCO2 Eq.
Goals 2030 vs.
1990
Germany 1248 902 - 27.7% 543- 562 55-56%
IEK-3: Institute of Electrochemical Process Engineering 67
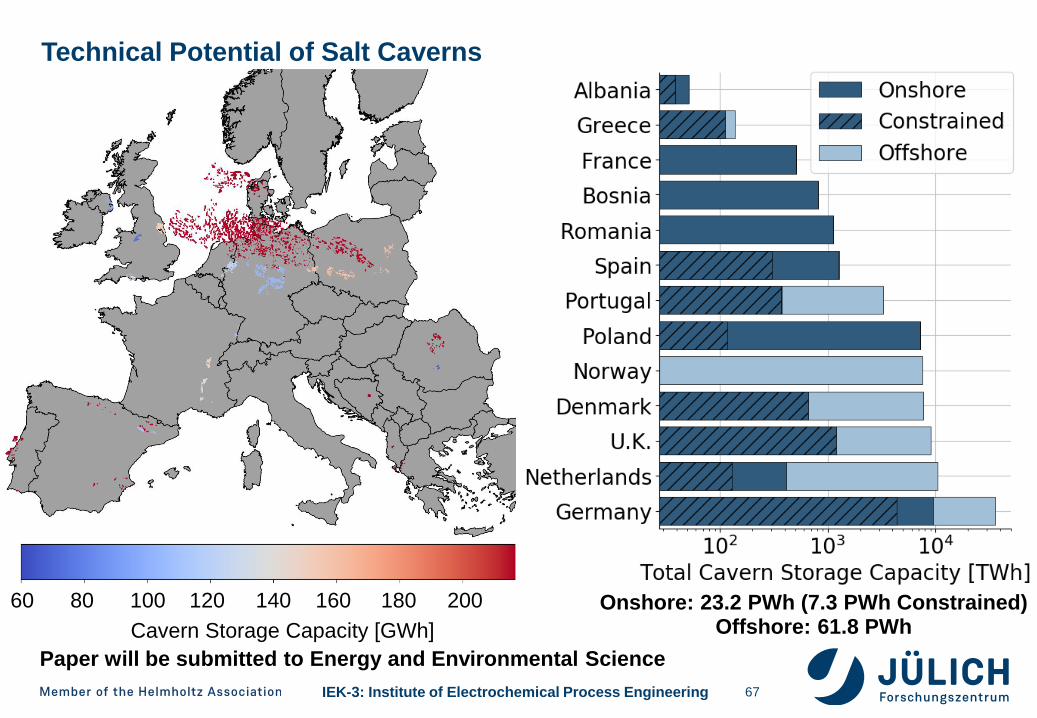
Technical Potential of Salt Caverns
Onshore: 23.2 PWh (7.3 PWh Constrained)Offshore: 61.8 PWh
Paper will be submitted to Energy and Environmental Science
60 80 100 120 140 160 180 200
Cavern Storage Capacity [GWh]