infusion pump inventory and distribution optimization ...ioe481/ioe481_past_reports/f1210.pdf ·...
TRANSCRIPT
University of Michigan Hospital Materiel Services
Infusion Pump Inventory and Distribution Optimization
Final Report
December 11, 2012
Submitted to: Hank Davis, Patient Equipment Manager, Program and Operations Analysis
Amanda Silva, Lean Coach, Program and Operations Analysis [email protected]
Matthew Claysen, Industrial Engineer, Program and Operations Analysis
Mark Van Oyen, Supervising Faculty Member, Department of Industrial and Operations Engineering
Submitted by:
IOE 481 - Team 10 - Fall 2012
Jason Handerhan, Jueying Liu, Carolyn Zick
Table of Contents
Executive Summary ........................................................................................................................ 1 Background ................................................................................................................................. 1
Methodology ................................................................................................................................ 1
Findings and Conculsions ........................................................................................................... 2
Recommendations........................................................................................................................ 3
Introduction ..................................................................................................................................... 4
Background ..................................................................................................................................... 5
Goals and Objectives .................................................................................................................. 6
Key Issues .................................................................................................................................... 6
Project Scope............................................................................................................................... 7
Methods........................................................................................................................................... 7
Scanning Process Data ............................................................................................................... 7
Pump Ordering Data ................................................................................................................... 9
Secondary Demand Data .......................................................................................................... 10
Internally Maintained Pump Data ........................................................................................... 11
Cultural Norms Data ................................................................................................................ 11
Findings and Reulting Conclusions .............................................................................................. 12
Scanning Process Data ............................................................................................................. 12
Pump Ordering Data ................................................................................................................. 13
Secondary Demand Data .......................................................................................................... 14
Internally Maintained Pump Data ............................................................................................ 17
Cultural Norms Data ................................................................................................................. 19
Scenarios ....................................................................................................................................... 20
Comparison of Scenarios .............................................................................................................. 25
Conclusions from Scenarios ......................................................................................................... 26
Assumptions used for Recommendation ...................................................................................... 27
Recommendation .......................................................................................................................... 27
Expected Impact............................................................................................................................ 28
Future Steps .................................................................................................................................. 28
Appendices .................................................................................................................................... 30
List of Figures and Tables
Figure 1 ........................................................................................................................................... 5
Figure 2 ........................................................................................................................................... 9
Figure 3 ......................................................................................................................................... 12
Table 1 .......................................................................................................................................... 13
Table 2 .......................................................................................................................................... 13
Table 3 .......................................................................................................................................... 15
Table 4 .......................................................................................................................................... 16
Table 5 .......................................................................................................................................... 17
Table 6 .......................................................................................................................................... 18
Table 7 .......................................................................................................................................... 18
Table 8 .......................................................................................................................................... 19
Table 9 .......................................................................................................................................... 19
Table 10 ........................................................................................................................................ 22
Table 11 ........................................................................................................................................ 23
Table 12 ........................................................................................................................................ 23
Table 13 ........................................................................................................................................ 23
Table 14 ........................................................................................................................................ 24
Table 15 ........................................................................................................................................ 24
Table 16 ........................................................................................................................................ 24
Table 17 ........................................................................................................................................ 24
Table 18 ........................................................................................................................................ 25
Table 19 ........................................................................................................................................ 25
Table 20 ........................................................................................................................................ 25
Table 21 ........................................................................................................................................ 26
1
Executive Summary
The University of Michigan Health System (UMHS) has a shortage of Alaris infusion pumps and currently rents pumps to meet demand. Due to variable patient usage and inconsistent utilization of the pump distribution system currently in place, it is difficult to determine the true demand for infusion pumps in order to optimize the number in inventory. Therefore, the Patient Equipment Manager asked the IOE 481 team to analyze the current scanning system that tracks pump location, determine demand by unit, and recommend storage location distribution and the daily available inventory needed to meet demand.
Background UMHS delayed a decision to purchase new infusion pumps, and instead, pumps were rented to help meet increased demand following the opening of Children and Women’s Hospital (C&W). Despite the additional rented pumps, shortages and delayed deliveries of pumps still occur, as reported to the team by the project coordinators and Patient Equipment employees. Currently, pumps are stored either in the Patient Equipment area or in storage areas in 41 units throughout UMHS. Periodic Automatic Replenishment (PAR) levels of pumps are set in each of these units. Although the current system is set for PAR levels to be replenished hourly by Patient Equipment employees, some locations are not regularly replenished. Additionally, at times not enough pumps are available to replenish PAR level or fill web orders. When stock-outs occur, nurses and technicians often clean dirty pumps themselves and reuse them, resulting in untracked pumps usages. In addition to the main distribution system, the Cancer Center and the Bone Marrow Transplant infusion areas maintain their own supply of pumps.
Methodology
The team performed the following tasks to collect and evaluate data from five data sets and to develop pump storage and PAR level scenarios:
• Scanning system data: o Obtained scanning system data. The team received MEMS scanning system data
from fiscal year (FY) 2012 from the project coordinators. o Grouped units and analyzed scanning system data. The team grouped the hospital
units into 12 unit categories, into hospital floors, and into hospital wings. The team sorted the data to find the average daily demand for each grouping.
o Calculated percentiles of demand. The team used the demand for each grouping to calculate various percentiles which represented daily available inventory required to meet demand.
• Ordering data: o Obtained ordering data. The team received data from FY 2012 of all nurse orders
of Alaris pumps o Assessed accuracy of ordering data vs. scanning data. The team compared the
two sets of data to determine which more accurately represented true demand • Secondary demand data (data representing true demand for pumps):
o Shadowed Patient Equipment employees.

2
o Interviewed nurse managers from each major unit category. The team interviewed nurse managers to understand their usage of the pumps distribution system and to find ways to collect data for true demand for pumps
o Conducted surveys with nurses and technicians. The team surveyed nurses and technicians in order to try to find true demand for pumps
• Internally maintained pump data o Interviewed BMT and Cancer Center nurse managers o Obtained monthly infusion records
• Cultural norms data o Interviewed nurse managers and St. Joseph Mercy Hospital nurse
Findings and Conclusions
The scanning data showed a large variance in daily demand for each unit. The team found that the Adult Inpatient units had the highest demand in FY 2012, followed by Adult Intensive Care units and Adult Operating Room units, according to the scanning data. Pump ordering data showed irregular patterns due to a lack of standardization as to when pump orders are made. Therefore, the team concluded that ordering data does not provide a good representation of hourly demand. The team observed irregular PAR replenishment and soiled room sweeps while shadowing Patient Equipment employees.
From interviews with 5 nurse managers from units request pumps from Patient Equipment center, the team learned that many of the major units, especially the Adult Intensive Care Units, experience pump shortages and delayed deliveries. The team also learned that pump usage is generally determined based on medication and different units have different numbers of pumps needed per patient, with trends found within unit categories. The team collected 168 nurses and technician surveys to qualitatively analyze the demand data. According to survey results, the average number of pumps cleaned by nurse or technicians varies between unit categories. The adjusted demand using the survey results showed an increase of over 400% for some units. The team believes this does not accurately represent true demand due to the difficulty of estimating the number of pumps cleaned. Rather, the team believes the results of the surveys demonstrate that true demand is higher than demand found through the scanning system. The most common suggestions made by nurses and technicians in the surveys were to decrease delivery times, keep PAR levels stocked, and perform more regular sweeps of soiled rooms.
The team developed five PAR and storage location scenarios. The first scenario is to maintain a PAR level for each unit high enough to meet one day’s demand for each unit. The second scenario is to maintain a PAR level that covers 1/3 of daily demand. The other 2/3 of daily demand is met by central storage inventory. The third scenario is to group units by floors and establish one storage location for each floor. The PAR storage meets 1/3 of daily demand and central storage inventory meets the other 2/3. The fourth scenario is to have only a central storage location. The fifth scenario is to group units by hospital wing, with each wing having its own storage location with a PAR set to meet 1/3 of daily demand. The other 2/3 of daily demand is met by central storage inventory.
If the PAR level is set to meet a lower percentage of daily demand, more demand is met by inventory at the central storage location (Patient Equipment area). As a result, the total inventory
3
needed to meet daily demand decreases. However, the trade-off of setting lower PAR levels is that employees would have to deliver pumps and collect dirty pumps more frequently. If the units are grouped by floor, the total available inventory needed to meet daily demand decreases. However, nurses and technicians would have farther distances to retrieve pumps or employees would have to be assigned on floors to deliver pumps from floor storage areas to units.
Recommendations
If only considering inventory, the team recommends implementing central inventory storage. If considering lead time and work capacity, the team recommends implementing hospital wing storage based on assumptions made by the team.
The wing storage system provides what the team believes to be the lowest total available inventory per day needed to meet daily demand without imposing overbearing workloads on Patient Equipment employees and extensive walking distances on nursing staff.
The team also recommends that further analysis to obtain accurate demand data, quantitative delivery lead time capabilities, and workload capacities be done before implementing a new system.

4
Introduction An Alaris infusion pump is a piece of equipment used to infuse medication or fluids into a patient’s bloodstream at a steady rate. Infusion pumps are used throughout the University of Michigan Health System (UMHS), including units in the University Hospital (UH), the Cardiovascular Center (CVC), the Cancer Center, and the Children and Women’s Hospital (C&W). True demand and required inventory of infusion pumps has always been difficult to gauge. The difficulty in gauging demand is due to variable patient usage and inconsistent utilization of the pump distribution system currently in place, as reported to the IOE 481 student team by the project coordinators. The Patient Equipment Manager wants to know the true demand for pumps in each unit, the required available daily inventory needed to meet daily demand for varying distribution systems, and the best physical storage and distribution of pumps. Therefore, the Patient Equipment Manager asked the team to analyze the current scanning system that tracks pump location, determine demand by unit, and analyze how the distribution of pumps among storage locations affects daily available inventory required to meet demand. The Patient Equipment Manager also asked the team to determine how pump usage varies among hospital units and between institutions. Finally, the Patient Equipment Manager asked the team to review areas with internally maintained pumps, including the Cancer Center infusion area and the Bone Marrow Transplant infusion areas, to verify that current inventory is justified in those areas. The team analyzed scanning system and pump ordering data, conducted interviews and distributed surveys to achieve the project goal. Based on the data and analysis, the team built five scenarios for distributing pump inventory throughout the hospital as well as calculators that can be used to develop more scenarios. If the only factor considered is inventory, the team recommends implementing central inventory storage to minimize inventory. Given the limited scope of the team’s project, the team had to make several assumptions before making a recommendation considering factors of lead time and work capacity. If the assumptions discussed in the Assumptions used for Recommendation section are validated, the team recommends that the hospital use one storage location for each wing of the UH, C&W, and one storage location for each floor of the CVC. This scenario provides the lowest total available inventory per day required to meet daily demand without imposing what the team believes would be overbearing workloads for Patient Equipment employees and extensive delivery lead times (based on assumptions made from observations while shadowing Patient Equipment employees and speaking with nurse managers).
The project is one component of a larger institutional initiative to improve the Alaris infusion pump distribution process. The team’s data and analyses of pump demand will be utilized in conjunction with other project teams’ analyses of pump delivery lead times and rate of pump return to Patient Equipment. An improved pump distribution system will be implemented based on these combined analyses.
5
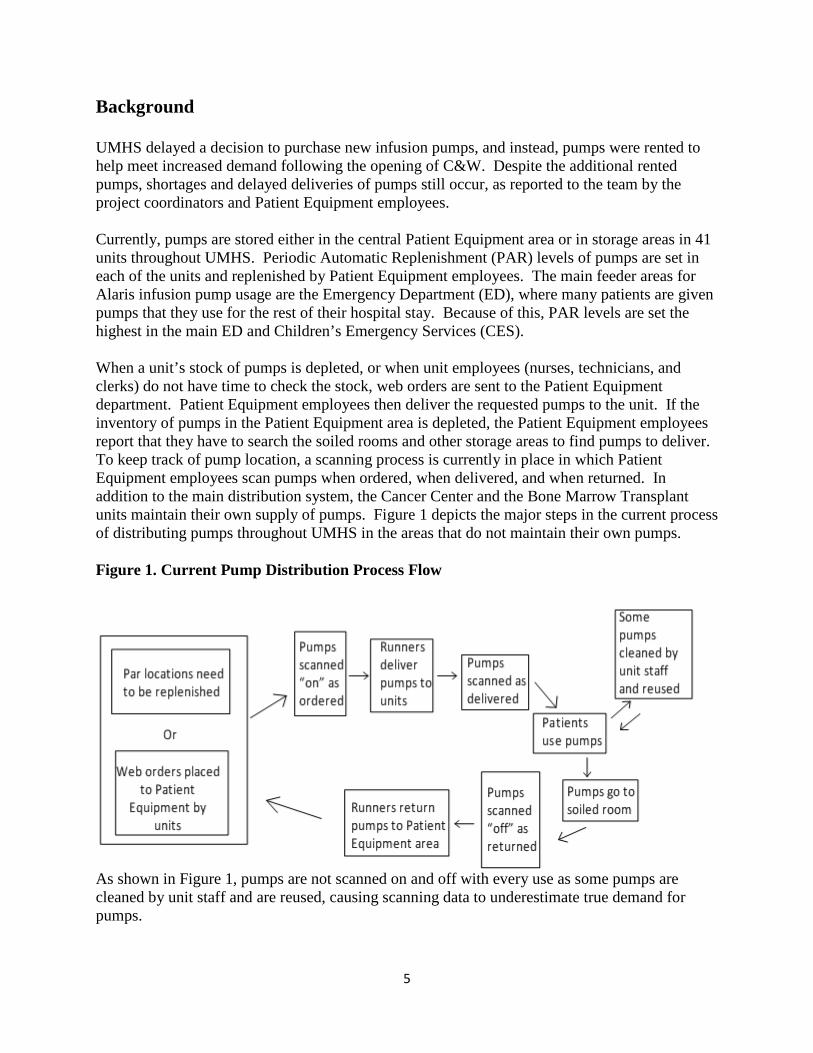
Background UMHS delayed a decision to purchase new infusion pumps, and instead, pumps were rented to help meet increased demand following the opening of C&W. Despite the additional rented pumps, shortages and delayed deliveries of pumps still occur, as reported to the team by the project coordinators and Patient Equipment employees. Currently, pumps are stored either in the central Patient Equipment area or in storage areas in 41 units throughout UMHS. Periodic Automatic Replenishment (PAR) levels of pumps are set in each of the units and replenished by Patient Equipment employees. The main feeder areas for Alaris infusion pump usage are the Emergency Department (ED), where many patients are given pumps that they use for the rest of their hospital stay. Because of this, PAR levels are set the highest in the main ED and Children’s Emergency Services (CES). When a unit’s stock of pumps is depleted, or when unit employees (nurses, technicians, and clerks) do not have time to check the stock, web orders are sent to the Patient Equipment department. Patient Equipment employees then deliver the requested pumps to the unit. If the inventory of pumps in the Patient Equipment area is depleted, the Patient Equipment employees report that they have to search the soiled rooms and other storage areas to find pumps to deliver. To keep track of pump location, a scanning process is currently in place in which Patient Equipment employees scan pumps when ordered, when delivered, and when returned. In addition to the main distribution system, the Cancer Center and the Bone Marrow Transplant units maintain their own supply of pumps. Figure 1 depicts the major steps in the current process of distributing pumps throughout UMHS in the areas that do not maintain their own pumps. Figure 1. Current Pump Distribution Process Flow
As shown in Figure 1, pumps are not scanned on and off with every use as some pumps are cleaned by unit staff and are reused, causing scanning data to underestimate true demand for pumps.
6
The criteria for deciding whether or not to give medication or fluids through an infusion pump vary between hospital units as well as between hospital institutions, as reported by the project coordinators. These criteria constitute “cultural norms” and need to be better understood. A study was completed in winter 2012 on the distribution of pumps in the Emergency Department. This study found that pump shortages were common in the ED, and that a lot of time was wasted searching for pumps during these shortages. The study led to an increase in the PAR level of pumps in the ED. Following this study, pump availability problems continued throughout the entire hospital, as reported by the project coordinators. The continuation of availability problems led to the request of this project. Goals and Objectives The primary goal of the project was to analyze the effects of altering the distribution of pumps throughout storage locations on daily inventory requirements. Secondary goals of the project included:
• Determining if inventory in areas that internally maintain pumps is justified • Assessing the accuracy of data obtained from the scanning process • Understanding how pump cultural norms vary between departments and institutions The team achieved these goals by performing the following tasks:
• Determined daily demand by unit • Determined daily available inventory required to meet various percentiles of demand • Modeled effects on required daily inventory of:
o Changing the number of storage locations o Changing the proportion of daily demand met by central inventory
• Determined the seasonality in demand by day of week • Qualitatively assessed the accuracy of the scanning process data • Analyzed how determination of patient need for pumps varies between units and institutions
(cultural norms) • Obtained the average daily demand for units that internally maintain pumps Key Issues The following key issues led to the request for this project.
• The overall shortage of infusion pumps led UMHS to rent more pumps, at a cost three times that of purchasing.
• Employees’ time is often wasted searching for or requesting delivery of pumps. • Nurses and technicians tend to order pumps without checking their storage unit and
sometimes sub-stock pumps for later usage, decreasing efficiency of resource allocation. • Based on observations from shadowing Patient Equipment employees, due to a lack of daily
available pump inventory, the large number of PAR storage locations, and the time it takes to
7
deliver a pump, the current goal of hourly PAR inventory replenishment is not possible. As a result the current system’s procedures are loosely followed.
• Nurses sometimes clean dirty pumps in the soiled room without scanning them as returned to Patient Equipment and/or order a pump without checking their unit storage location for available pumps. As a result, scanning data does not accurately represent true demand.
Project Scope This project scope includes all Alaris infusion pumps maintained by Patient Equipment and all of the units that use those pumps in the Ann Arbor campus of the UMHS. Areas that maintain their own pumps, including the Cancer Center and Bone Marrow Transplant infusion areas are also within the scope of this project. The scope does not include pump repairs or “lost” pumps, which are pumps not scanned within fiscal year (FY) 2012, July 1 2011 – June 30 2012. Off-site locations are not within the scope of this project. Syringe pumps are outside of the scope of this project. Pump return rate to Patient Equipment, quantitative delivery lead times, and Patient Equipment work capacity are also out of scope. Methods The five data sets the team analyzed for this project were scanning process data, pump ordering data, secondary demand data, internally maintained pump data, and cultural norms data. The following describes the methods the team used to collect and analyze each of the five data sets. Scanning Process Data Scanning process data is data obtained from the MEMS scanning system that the Patient Equipment employees use to track pump usage and location. Sorting data The project coordinators provided the team with an Excel spreadsheet containing scanning data. These data consisted of 64,617 demand points specifying scan-on and scan-off dates and delivery locations for each pump delivery within FY 2012. The delivery locations included 132 units and locations. The data also specified whether the pump was a single pump or a dual pump. To make dual points count as two pumps, the team added an extra demand point for each dual pump. Additionally, the team deleted scan records to the areas that maintain their own pumps, the Cancer Center and Bone Marrow Transplant transfusion areas, since the team analyzed these areas separately. The team deleted any data points with scan-on dates before June 30, 2011. The project coordinators provided a list of 12 unit categories that organize units throughout the hospital based on pump usage practices. These categories were: Adult Intensive Care Units, Pediatric Intensive Care Units, Birth Center Units, Adult Inpatient Units, Pediatric Inpatient Units, Adult Observation Units, Adult Operating Rooms, Pediatric Operating Rooms, Adult Procedure Units, Adult Emergency, and Pediatric Emergency. The team assigned each of the units to one of these categories, or to an “other” category which
8
included off-site and training locations. Due to the December 2011 opening of the Children and Women’s hospital, some of the units only included demand before December 2011, and the new units replacing them only contained demand after December 2011. As a result, for some analyses, the team only utilized the data points from the last 6 months of the fiscal year. Finally, the team categorized the units by floor and by hospital wing (east and west side of a floor) to be able to look at demand by floor and by wing. The team later utilized these unit groupings while developing scenarios. Analyzing demand Once the data points were categorized, the team sorted demand by unit, category, floor, and wing using Excel pivot tables. The sum of all of the scan-on dates for each sorting throughout the year represented the yearly demand for pumps for that sorting. The sum of scan-on points for a particular date in the year for each sorting represented the demand for pumps on that day for that sorting. From these daily demand points, the team was able to calculate average daily demand and daily demand and variance for each unit, category, floor, and wing. Determining daily available inventory required to meet demand After determining daily demands by unit, category, floor, and wing, the team then determined the necessary daily available pump inventory required to meet demand if the hospital were to use the following storage location scenarios: one storage location for each unit, one storage location for each category, one storage location for each floor, and one storage location for each wing. The team developed Excel spreadsheets that allow the user to input the percentage of daily demand met by each PAR location. The team then multiplied this percentage by the daily demand for each day of the year for each unit, category, floor, or wing (depending on the storage location scenario being analyzed). The team then calculated various percentiles of the resulting fractions of daily demand using the Excel PERCENTILE function. These percentiles represent the amount of infusion pump inventory required at each PAR storage location to meet the user specified percentage of daily demand at varying confidence levels. Next, the team subtracted the demand met by inventory at PAR storage locations from the total daily demand for each day of the year. The team then calculated various percentiles of this unmet demand using the Excel PERCENTILE function to determine the central inventory required to meet the daily demand that is not met by PAR location inventory at varying confidence levels. The sum of the central inventory and PAR location storage inventory represents the total daily available pump inventory required to meet demand for a given percentage of the time. For example, the sum of the PAR storage location inventory required to meet 1/3 of daily demand 99% of the time, plus the sum of the central storage location inventory required to meet the remaining 2/3 of demand 99% of the time, represents the total available daily pump inventory required to meet daily demand 99% of the time in the case of three daily replenishments when PAR levels are set to meet 1/3 of daily demand.
9
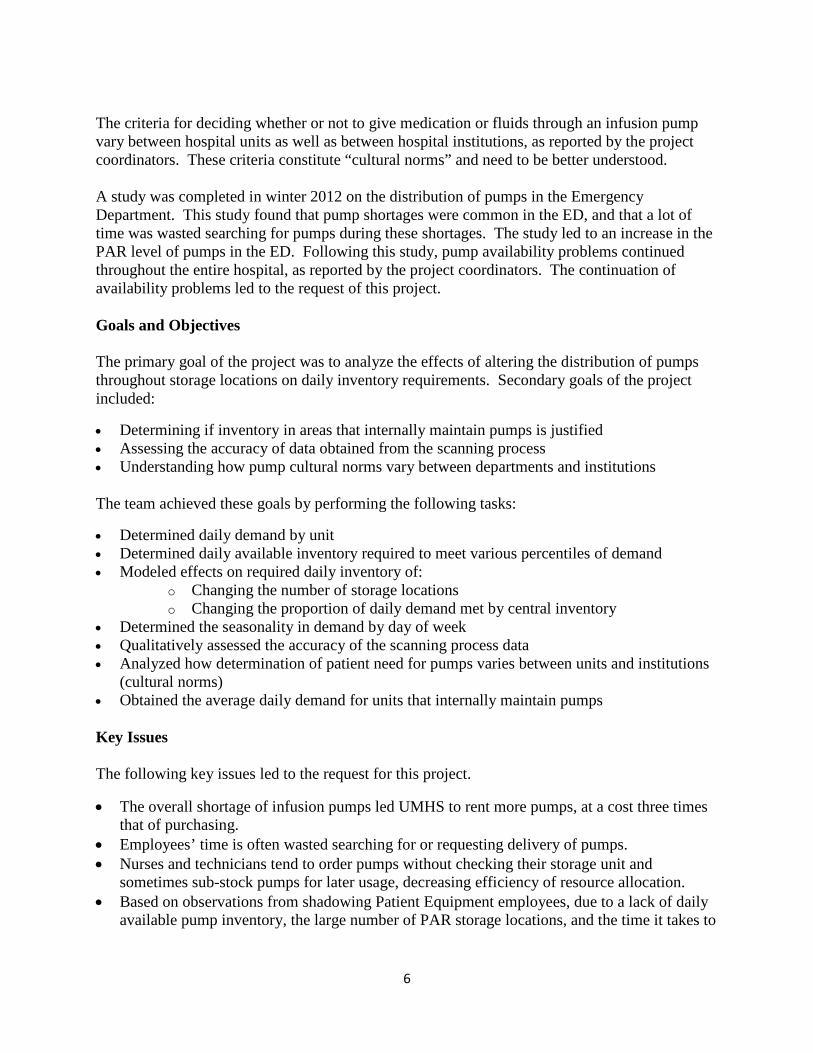
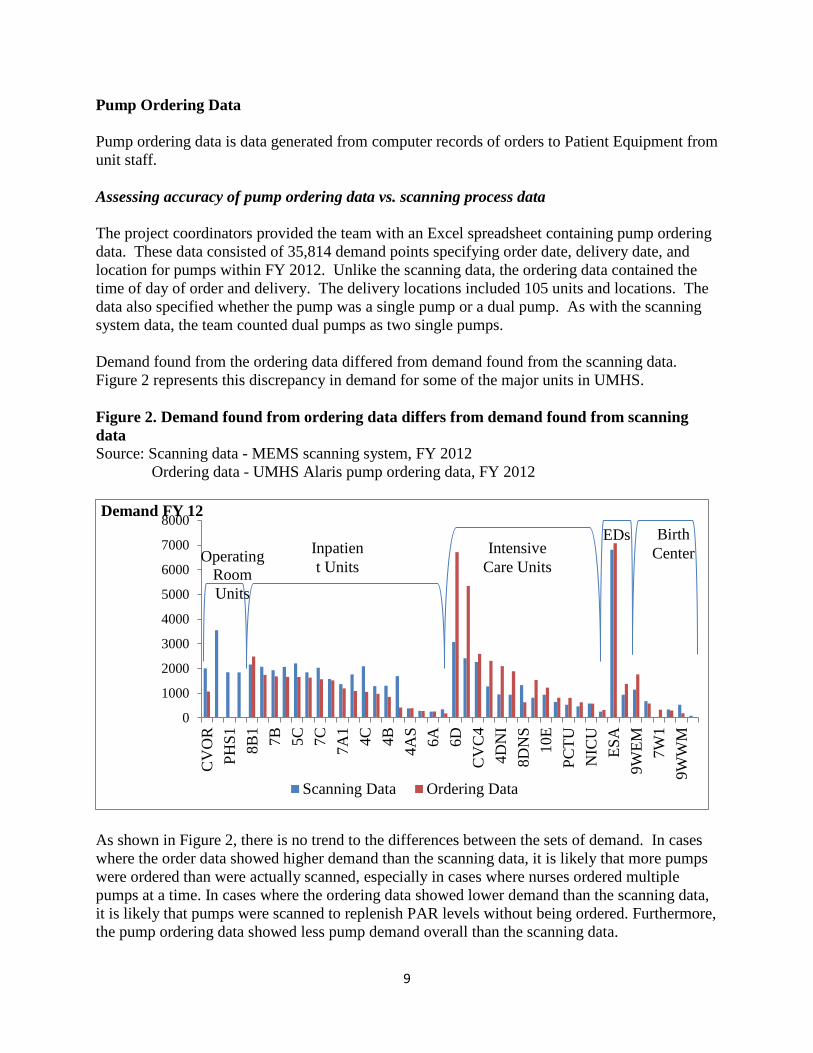
Pump Ordering Data Pump ordering data is data generated from computer records of orders to Patient Equipment from unit staff. Assessing accuracy of pump ordering data vs. scanning process data The project coordinators provided the team with an Excel spreadsheet containing pump ordering data. These data consisted of 35,814 demand points specifying order date, delivery date, and location for pumps within FY 2012. Unlike the scanning data, the ordering data contained the time of day of order and delivery. The delivery locations included 105 units and locations. The data also specified whether the pump was a single pump or a dual pump. As with the scanning system data, the team counted dual pumps as two single pumps. Demand found from the ordering data differed from demand found from the scanning data. Figure 2 represents this discrepancy in demand for some of the major units in UMHS. Figure 2. Demand found from ordering data differs from demand found from scanning data Source: Scanning data - MEMS scanning system, FY 2012 Ordering data - UMHS Alaris pump ordering data, FY 2012
As shown in Figure 2, there is no trend to the differences between the sets of demand. In cases where the order data showed higher demand than the scanning data, it is likely that more pumps were ordered than were actually scanned, especially in cases where nurses ordered multiple pumps at a time. In cases where the ordering data showed lower demand than the scanning data, it is likely that pumps were scanned to replenish PAR levels without being ordered. Furthermore, the pump ordering data showed less pump demand overall than the scanning data.
0
1000
2000
3000
4000
5000
6000
7000
8000
CV
OR
PHS1 8B
17B 5C 7C 7A
14C 4B 4A
S6A 6D
CV
C4
4DN
I8D
NS
10E
PCTU
NIC
UES
A9W
EM 7W1
9WW
M
Demand FY 12
Scanning Data Ordering Data
Operating Room Units
Inpatient Units
Intensive Care Units
EDs Birth Center
10
The team considered two assumptions as to the accuracy of the demand sets. First, the team assumed that the scanning data always more accurately represented true demand. For the rest of this paper, all of the PAR levels were found using this assumption. Next, the team assumed that whichever data set showed higher demand for each unit more accurately represented true demand for that unit. The team made required inventory calculators for this assumption, found in PumpInventoryCalculators-CombinedData.xlsx. Secondary Demand Data Secondary demand data represents actual pump demand, including demand not recorded in the scanning process. This data is used to identify the error in demand data obtained from the scanning process. To obtain secondary demand data, the team shadowed Patient Equipment employees, interviewed nurse managers, distributed registered nurse surveys, and compared length of stay found in the scanning data to true length of stay. Shadowing Patient Equipment employees The team shadowed Patient Equipment employees on two occasions (for a total of 20 person- hours) while they distributed pumps throughout the hospital. Through these observations, the team gained an understanding of how the scanning system is used, and how the PAR levels are maintained, and why Patient Equipment employees are unable to follow the pump distribution system that is currently in place. Interviewing nurse managers To determine how to best collect secondary demand data, the team met with nurse managers from the categories with the highest demand, which were Adult Inpatient Units, Adult Intensive Care Units, Adult Operating Rooms, Pediatric Inpatient Units, Pediatric Intensive Care Units, and Birth Center Units. During interviews with nurse managers, the team had the goal of determining the best method to obtain actual demand data for that unit by preparing a list of interview questions. The interviews included general questions about the source of patient admittances, the percentage of patients that use pumps, and how patient need for pumps is determined. The interviews also included questions about the unit’s usage of the pump distribution system. Through these questions, the team found out generally how often pumps are ordered with and without checking the storage areas, how often the units have no pumps in the storage areas, and how often pumps are cleaned by unit staff and reused. Finally, the interviews included questions to evaluate the idea of using different methods to obtain secondary demand data. The team’s ideas included asking the unit staff to record pump usage, distributing surveys to unit nurses, using nurse notes to identify pump usage, and asking nurses to record each time they clean a pump.
11
Surveying nurses and technicians Following the nurse manager interviews, the team prepared a survey to distribute to nurses and technicians which included 12 questions. The team submitted the survey to nurse managers for approval, and several nurse managers advised that the survey be fewer than 6-7 questions. The final questions and purpose of each question are listed in Appendix A. Comparing to true duration-of-stay Another method the team attempted to obtain secondary demand data was to compare average patient length of stay in the hospital to duration of use data from the scanning process. The duration of use from the scanning process was calculated by subtracting the scan on date from the scan off date. The team assumed that on average, the duration of use for pumps would be longer than the patient length of stay because pumps were being used multiple times in units during long periods between the scan-on and scan-off dates. In order to test this, the team obtained patient admittance and discharge data for FY 2012. However, these records only noted the units of admittance and discharge, and didn’t specify how long patients stayed in a particular unit. Because of this, comparing the length of usage of pumps to patient stays yielded varying results that didn’t help to quantify increased demand for pumps. Internally Maintained Pump Data The BMT and Cancer Center infusion areas internally maintain their infusion pumps, and are only maintained by Patient Equipment if they need to be repaired. Interviewing BMT and Cancer Center infusion area nurse managers The team interviewed nurse managers from the BMT and Cancer Center infusion areas to understand the current system that these areas use to maintain their pumps and to obtain data for patient pump usage. This data included the times of infusions and numbers of pumps used during a week for the Cancer Center, and a count of the pumps in inventory. Obtaining monthly infusion records The team obtained monthly infusion record data in order to find daily averages for the numbers of infusions in the Cancer Center and the Bone Marrow Transplant infusion areas. If these data are paired with data on the number of pumps used and length of use, a number of pumps required for inventory can be found. Cultural Norms Data The interviews with nurse managers throughout the hospital helped the team to determine standards used for decisions regarding patient need for infusion pumps in each unit. This information was used to identify differences in cultural norms among the unit categories. The
12
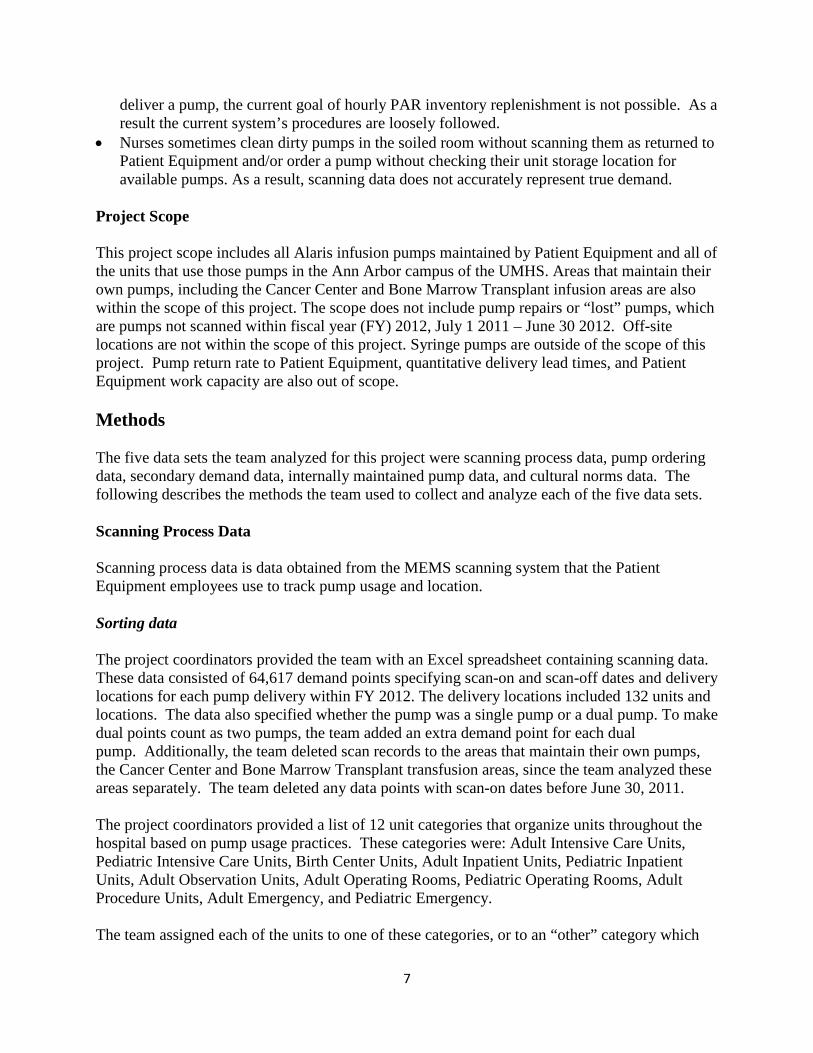
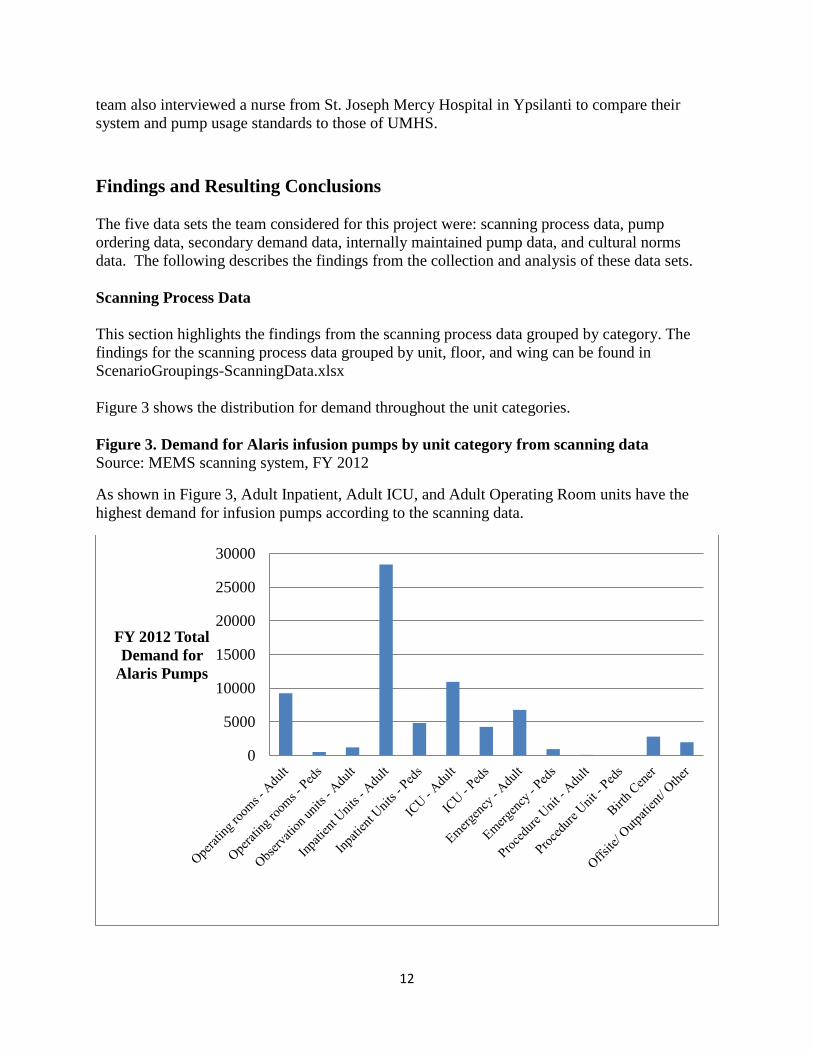
team also interviewed a nurse from St. Joseph Mercy Hospital in Ypsilanti to compare their system and pump usage standards to those of UMHS. Findings and Resulting Conclusions The five data sets the team considered for this project were: scanning process data, pump ordering data, secondary demand data, internally maintained pump data, and cultural norms data. The following describes the findings from the collection and analysis of these data sets. Scanning Process Data This section highlights the findings from the scanning process data grouped by category. The findings for the scanning process data grouped by unit, floor, and wing can be found in ScenarioGroupings-ScanningData.xlsx Figure 3 shows the distribution for demand throughout the unit categories. Figure 3. Demand for Alaris infusion pumps by unit category from scanning data Source: MEMS scanning system, FY 2012
As shown in Figure 3, Adult Inpatient, Adult ICU, and Adult Operating Room units have the highest demand for infusion pumps according to the scanning data.
0
5000
10000
15000
20000
25000
30000
FY 2012 Total Demand for
Alaris Pumps

13
Table 1 shows statistics for infusion pump demand in the unit categories.
Table 1. Statistics for Alaris pump demand from scanning data Source: MEMS scanning system, FY 2012
Unit Category
Mean daily demand
Daily demand variance
Index of dispersion
Percentiles of daily pump demand
0.99 0.98 0.75 0.5 Operating rooms - Adult 25.33 343.13 13.55 65.7 60.7 39 27 Operating rooms - Peds 1.50 5.07 3.38 9.35 8 2 0 Observation units - Adult 3.38 8.92 2.64 12 11 5 3 Inpatient Units - Adult 77.61 503.73 6.49 124.1 117 95 79 Inpatient Units - Peds 13.29 44.27 3.33 28.7 27 18 13 ICU - Adult 29.89 150.80 5.04 56 54.7 38 30 ICU - Peds 11.64 40.18 3.45 27.35 24.7 16 11 Emergency - Adult 18.61 118.77 6.38 45.05 41 25 18 Emergency - Peds 2.64 17.38 6.57 15 14 5 0 Procedure Units - Adult 0.31 1.17 3.80 4 4 0 0 Procedure Units - Peds 0.02 0.08 3.21 0 0 0 0 Birth Center 7.67 23.30 3.04 20 19 11 7 Offsite/ Outpatient/ Other 5.44 74.05 13.61 41 35.1 6 3
The index of dispersion noted in Table 1 is a figure representing the ratio of the variance to the mean of demand. A high index of dispersion indicates high variability in demand due to days with no demand and other days with demand greater than 30 pumps. In cases where the index of dispersion is highest, as in the Adult operating room units, the 50th -99th percentiles of daily pump demand are much higher than the mean daily demand. The findings and conclusions from determining the required daily available pump inventory required to meet demand are discussed in detail in the Scenarios section. Pump Ordering Data Table 2 demonstrates an example of the sorted ordering data for one unit, 6D. Table 2. Example of three days of sorted ordering data from unit 6D Source: UMHS Ordering data FY 2012
Hour 0 1 2 3 4 5 6 7 8 9 10 11 12 13 14 15 16 17 18 19 20 21 22 23
Day 1 0 4 0 0 0 0 0 0 4 2 0 0 0 0 12 1 0 0 6 0 2 0 4 4
Day 2 0 0 0 0 0 0 0 4 0 0 0 0 0 0 0 0 0 4 0 0 0 4 0 0
Day 3 4 4 0 0 0 0 0 0 0 0 0 0 0 0 4 0 0 4 4 4 4 0 2 0

14
Table 2 shows that the ordering of pumps is very irregular, and currently there is little standardization as to when pump orders are made. For example, on day 1, in hour 14, twelve pumps were ordered. It is not likely that there was a demand for twelve pumps in that specific hour, but rather that nurses ordered pumps to cover demand for the hours ahead. Because of this order pattern, the team believes that the ordering data does not accurately represent hourly demand. Secondary Demand Data The following section describes findings relating to secondary demand data representing true demand for pumps from Patient Equipment employee observations, nurse manager interviews, and nurse and technician surveys. Patient Equipment employee shadowing Through shadowing and speaking with Patient Equipment employees, the team made the following observations with regard to understanding the scanning data. Due to the large number of equipment orders, long travel times from the Patient Equipment area to hospital units, and the overall number of pump storage locations, the following trends were noted: • Many PAR storage areas are not restocked regularly • Full sweeps of soiled rooms are completed once per shift (according to Patient Equipment
employee)
These observations suggest that Patient Equipment employees lack the work capacity to follow the current pump distribution procedure to replenish PAR locations hourly. Furthermore, these observations indicate that demand from the scanning system is an underestimate of true demand. Nurses and technicians rely less on pump PAR levels in the storage rooms and instead must clean pumps from the soiled room and reuse them. As a result, these pumps are not scanned as returned to Patient Equipment, and there is no record of demand for this pump in the scanning data. Nurse manager interviews To determine how to best collect secondary demand data, the team met or spoke with nurse managers from the categories with the highest demand, which were: -Adult inpatient units -Adult intensive care units -Adult operating rooms -Pediatric inpatient units -Pediatric intensive care units -Birth center units Table 3 presents an overview of results from the in-person nurse manager interviews that the team was able to conduct.
15
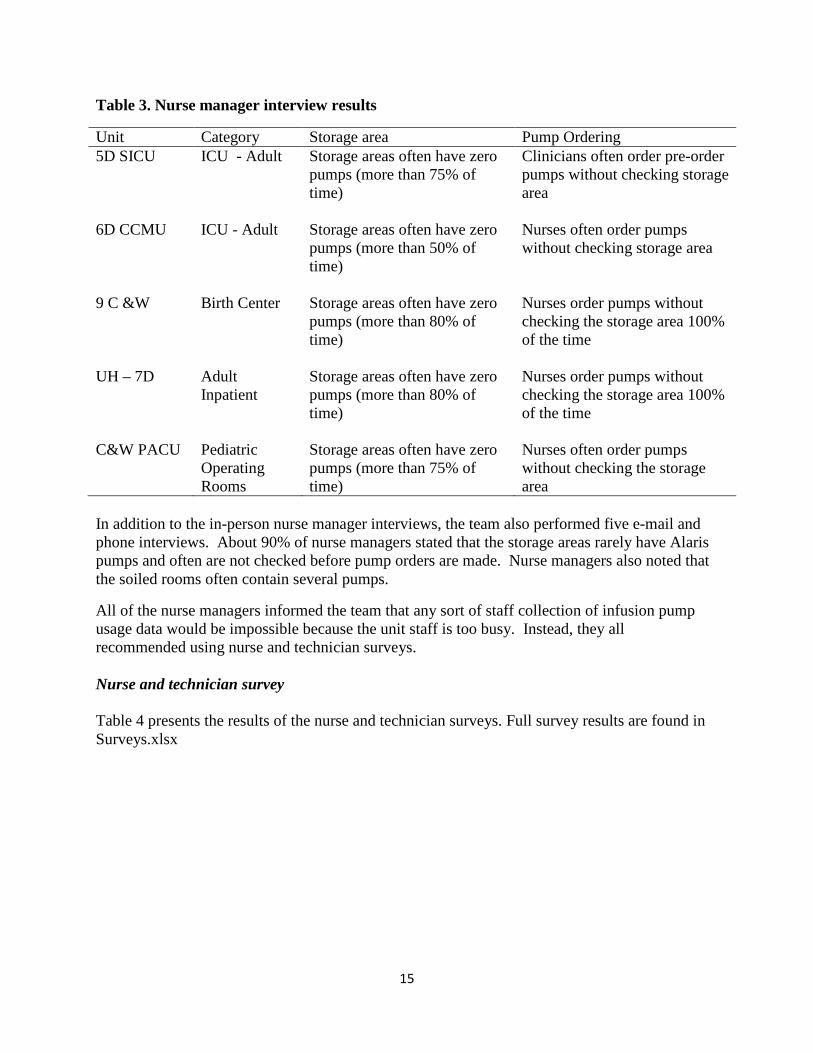
Table 3. Nurse manager interview results
Unit Category Storage area Pump Ordering 5D SICU ICU - Adult Storage areas often have zero
pumps (more than 75% of time)
Clinicians often order pre-order pumps without checking storage area
6D CCMU ICU - Adult Storage areas often have zero pumps (more than 50% of time)
Nurses often order pumps without checking storage area
9 C &W Birth Center Storage areas often have zero pumps (more than 80% of time)
Nurses order pumps without checking the storage area 100% of the time
UH – 7D Adult Inpatient
Storage areas often have zero pumps (more than 80% of time)
Nurses order pumps without checking the storage area 100% of the time
C&W PACU Pediatric Operating Rooms
Storage areas often have zero pumps (more than 75% of time)
Nurses often order pumps without checking the storage area
In addition to the in-person nurse manager interviews, the team also performed five e-mail and phone interviews. About 90% of nurse managers stated that the storage areas rarely have Alaris pumps and often are not checked before pump orders are made. Nurse managers also noted that the soiled rooms often contain several pumps.
All of the nurse managers informed the team that any sort of staff collection of infusion pump usage data would be impossible because the unit staff is too busy. Instead, they all recommended using nurse and technician surveys. Nurse and technician survey Table 4 presents the results of the nurse and technician surveys. Full survey results are found in Surveys.xlsx
16
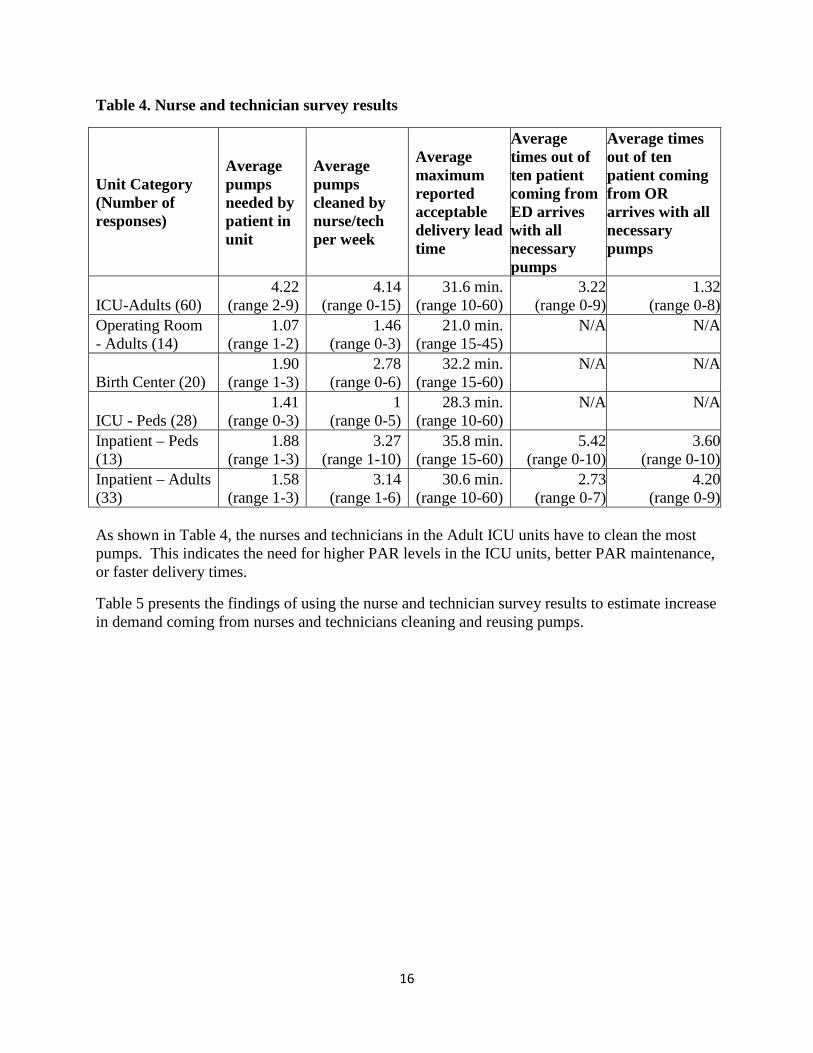
Table 4. Nurse and technician survey results
Unit Category (Number of responses)
Average pumps needed by patient in unit
Average pumps cleaned by nurse/tech per week
Average maximum reported acceptable delivery lead time
Average times out of ten patient coming from ED arrives with all necessary pumps
Average times out of ten patient coming from OR arrives with all necessary pumps
ICU-Adults (60) 4.22
(range 2-9) 4.14
(range 0-15) 31.6 min.
(range 10-60) 3.22
(range 0-9) 1.32
(range 0-8) Operating Room - Adults (14)
1.07 (range 1-2)
1.46 (range 0-3)
21.0 min. (range 15-45)
N/A N/A
Birth Center (20) 1.90
(range 1-3) 2.78
(range 0-6) 32.2 min.
(range 15-60) N/A N/A
ICU - Peds (28) 1.41
(range 0-3) 1
(range 0-5) 28.3 min.
(range 10-60) N/A N/A
Inpatient – Peds (13)
1.88 (range 1-3)
3.27 (range 1-10)
35.8 min. (range 15-60)
5.42 (range 0-10)
3.60 (range 0-10)
Inpatient – Adults (33)
1.58 (range 1-3)
3.14 (range 1-6)
30.6 min. (range 10-60)
2.73 (range 0-7)
4.20 (range 0-9)
As shown in Table 4, the nurses and technicians in the Adult ICU units have to clean the most pumps. This indicates the need for higher PAR levels in the ICU units, better PAR maintenance, or faster delivery times.
Table 5 presents the findings of using the nurse and technician survey results to estimate increase in demand coming from nurses and technicians cleaning and reusing pumps.

17
Table 5. Apparent increase in demand from nurses/techs cleaning pumps
5D-CICU (Adult ICU)
6D-CCMU (Adult ICU)
6B (Adult Inpatient)
Nurses and techs working in unit 91 79 73
Nurses and techs who responded to survey 23 27 9
Average weekly demand for pumps from scanning data 46.2 58.7 39.5
Average weekly pumps cleaned per nurse/tech, as reported form surveys 3.49 3.3 2.7
Increased average weekly demand from pumps reported and extrapolated to be cleaned by ALL nurses and techs in unit 317.6 261.5 194.9
Apparent percent increase in demand 687% 445% 494%
Increased average weekly demand from pumps reported to be cleaned by nurses and techs who responded to survey 80.3 89.4 24.0
Apparent percent increase in demand 174% 152% 61%
As Table 5 shows, the increase in demand found by multiplying the number of nurses/techs by the pumps cleaned in a week is very large, even if only considering nurses and technicians who responded to the survey. The team doesn’t believe that these numbers can accurately represent the increase in demand due to the difficulty of estimating the number of pumps cleaned per week. Instead, these numbers demonstrate a general trend of significantly increased demand.
The requests or suggestions made by nurses and technicians to improve the infusion pump distribution system are attached in Appendix B.
Internally Maintained Pump Data The units that internally maintain their own pumps, including the Cancer Center and Bone Marrow Transplant infusion areas have relatively stable demand compared with units with PAR
18
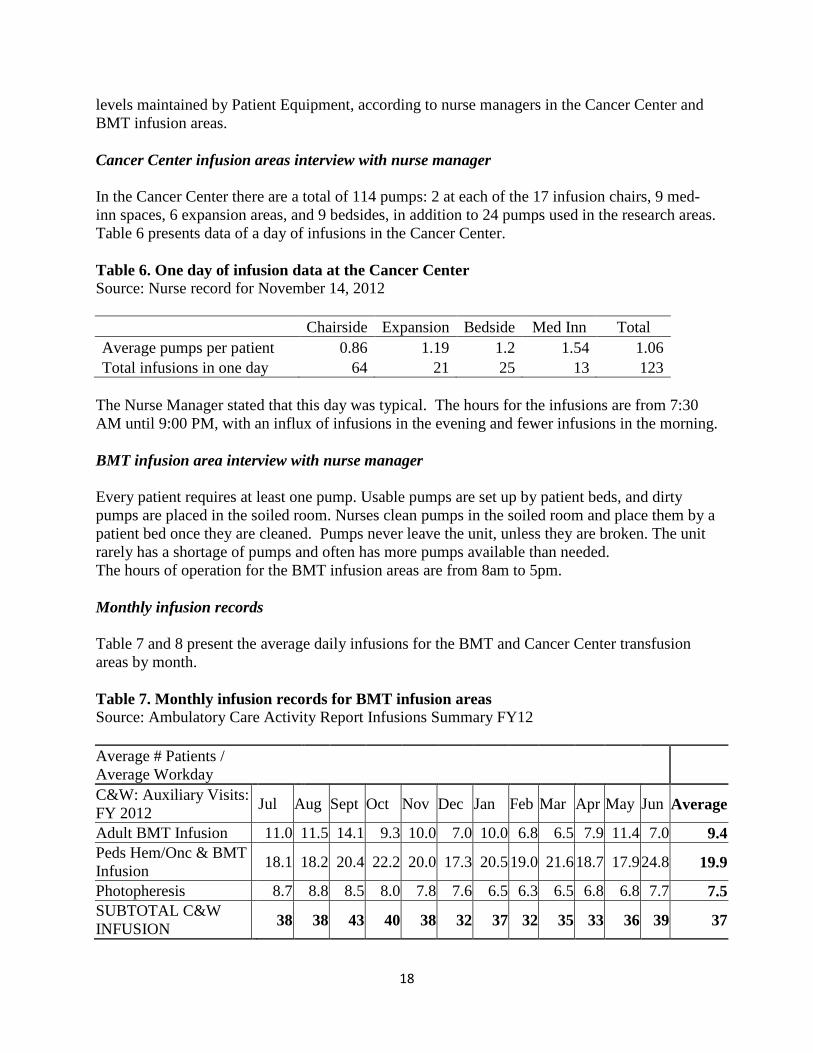
levels maintained by Patient Equipment, according to nurse managers in the Cancer Center and BMT infusion areas. Cancer Center infusion areas interview with nurse manager In the Cancer Center there are a total of 114 pumps: 2 at each of the 17 infusion chairs, 9 med-inn spaces, 6 expansion areas, and 9 bedsides, in addition to 24 pumps used in the research areas. Table 6 presents data of a day of infusions in the Cancer Center. Table 6. One day of infusion data at the Cancer Center Source: Nurse record for November 14, 2012
Chairside Expansion Bedside Med Inn Total
Average pumps per patient 0.86 1.19 1.2 1.54 1.06 Total infusions in one day 64 21 25 13 123
The Nurse Manager stated that this day was typical. The hours for the infusions are from 7:30 AM until 9:00 PM, with an influx of infusions in the evening and fewer infusions in the morning. BMT infusion area interview with nurse manager Every patient requires at least one pump. Usable pumps are set up by patient beds, and dirty pumps are placed in the soiled room. Nurses clean pumps in the soiled room and place them by a patient bed once they are cleaned. Pumps never leave the unit, unless they are broken. The unit rarely has a shortage of pumps and often has more pumps available than needed. The hours of operation for the BMT infusion areas are from 8am to 5pm. Monthly infusion records Table 7 and 8 present the average daily infusions for the BMT and Cancer Center transfusion areas by month. Table 7. Monthly infusion records for BMT infusion areas Source: Ambulatory Care Activity Report Infusions Summary FY12 Average # Patients / Average Workday
C&W: Auxiliary Visits: FY 2012 Jul Aug Sept Oct Nov Dec Jan Feb Mar Apr May Jun Average
Adult BMT Infusion 11.0 11.5 14.1 9.3 10.0 7.0 10.0 6.8 6.5 7.9 11.4 7.0 9.4 Peds Hem/Onc & BMT Infusion 18.1 18.2 20.4 22.2 20.0 17.3 20.5 19.0 21.6 18.7 17.9 24.8 19.9
Photopheresis 8.7 8.8 8.5 8.0 7.8 7.6 6.5 6.3 6.5 6.8 6.8 7.7 7.5 SUBTOTAL C&W INFUSION 38 38 43 40 38 32 37 32 35 33 36 39 37
19
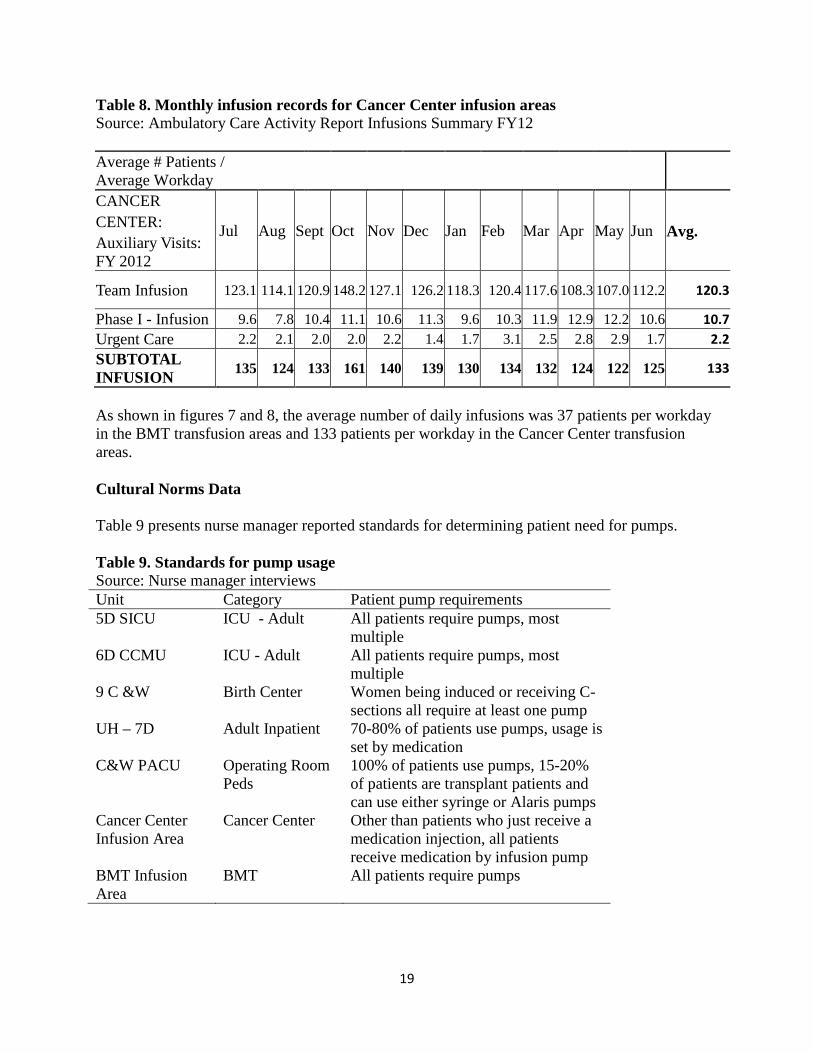
Table 8. Monthly infusion records for Cancer Center infusion areas Source: Ambulatory Care Activity Report Infusions Summary FY12 Average # Patients / Average Workday
CANCER CENTER: Auxiliary Visits: FY 2012
Jul Aug Sept Oct Nov Dec Jan Feb Mar Apr May Jun Avg.
Team Infusion 123.1 114.1 120.9 148.2 127.1 126.2 118.3 120.4 117.6 108.3 107.0 112.2 120.3
Phase I - Infusion 9.6 7.8 10.4 11.1 10.6 11.3 9.6 10.3 11.9 12.9 12.2 10.6 10.7 Urgent Care 2.2 2.1 2.0 2.0 2.2 1.4 1.7 3.1 2.5 2.8 2.9 1.7 2.2 SUBTOTAL INFUSION
135 124 133 161 140 139 130 134 132 124 122 125 133
As shown in figures 7 and 8, the average number of daily infusions was 37 patients per workday in the BMT transfusion areas and 133 patients per workday in the Cancer Center transfusion areas. Cultural Norms Data Table 9 presents nurse manager reported standards for determining patient need for pumps. Table 9. Standards for pump usage Source: Nurse manager interviews Unit Category Patient pump requirements 5D SICU ICU - Adult All patients require pumps, most
multiple 6D CCMU ICU - Adult All patients require pumps, most
multiple 9 C &W Birth Center Women being induced or receiving C-
sections all require at least one pump UH – 7D Adult Inpatient 70-80% of patients use pumps, usage is
set by medication C&W PACU Operating Room
Peds 100% of patients use pumps, 15-20% of patients are transplant patients and can use either syringe or Alaris pumps
Cancer Center Infusion Area
Cancer Center Other than patients who just receive a medication injection, all patients receive medication by infusion pump
BMT Infusion Area
BMT All patients require pumps
20
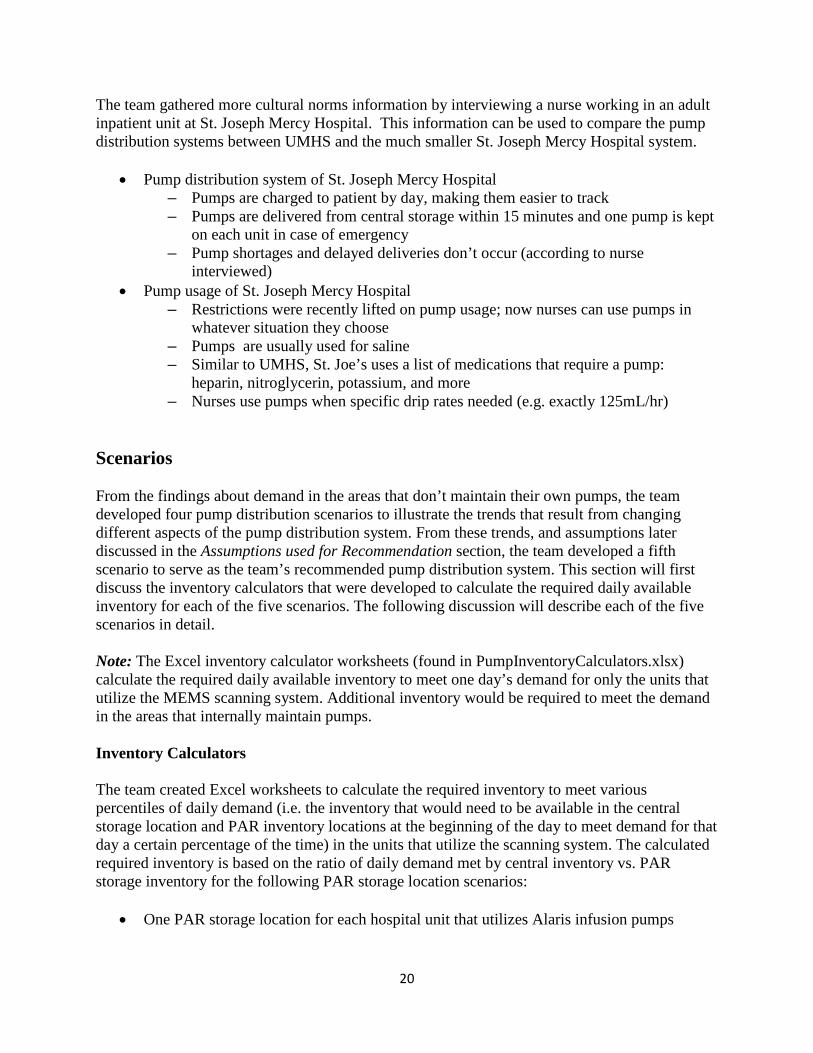
The team gathered more cultural norms information by interviewing a nurse working in an adult inpatient unit at St. Joseph Mercy Hospital. This information can be used to compare the pump distribution systems between UMHS and the much smaller St. Joseph Mercy Hospital system.
• Pump distribution system of St. Joseph Mercy Hospital – Pumps are charged to patient by day, making them easier to track – Pumps are delivered from central storage within 15 minutes and one pump is kept
on each unit in case of emergency – Pump shortages and delayed deliveries don’t occur (according to nurse
interviewed) • Pump usage of St. Joseph Mercy Hospital
– Restrictions were recently lifted on pump usage; now nurses can use pumps in whatever situation they choose
– Pumps are usually used for saline – Similar to UMHS, St. Joe’s uses a list of medications that require a pump:
heparin, nitroglycerin, potassium, and more – Nurses use pumps when specific drip rates needed (e.g. exactly 125mL/hr)
Scenarios From the findings about demand in the areas that don’t maintain their own pumps, the team developed four pump distribution scenarios to illustrate the trends that result from changing different aspects of the pump distribution system. From these trends, and assumptions later discussed in the Assumptions used for Recommendation section, the team developed a fifth scenario to serve as the team’s recommended pump distribution system. This section will first discuss the inventory calculators that were developed to calculate the required daily available inventory for each of the five scenarios. The following discussion will describe each of the five scenarios in detail. Note: The Excel inventory calculator worksheets (found in PumpInventoryCalculators.xlsx) calculate the required daily available inventory to meet one day’s demand for only the units that utilize the MEMS scanning system. Additional inventory would be required to meet the demand in the areas that internally maintain pumps. Inventory Calculators The team created Excel worksheets to calculate the required inventory to meet various percentiles of daily demand (i.e. the inventory that would need to be available in the central storage location and PAR inventory locations at the beginning of the day to meet demand for that day a certain percentage of the time) in the units that utilize the scanning system. The calculated required inventory is based on the ratio of daily demand met by central inventory vs. PAR storage inventory for the following PAR storage location scenarios:
• One PAR storage location for each hospital unit that utilizes Alaris infusion pumps

21
• One PAR storage location for each previously defined unit category (defined in the Methods section under Data sorting)
• One PAR storage location for each hospital floor that utilizes Alaris infusion pumps • One PAR storage location for each hospital wing that utilizes Alaris infusion pumps.
There are two wings on each floor (east wing and west wing) Each of the above storage location scenarios also has one central storage inventory location. How the Calculator Works This section briefly describes how to use the inventory calculators, and how the daily required inventory to meet one day’s demand is calculated. User instructions are numbered, and descriptions of how required inventory is calculated follow bullet points. They are intended for the team’s project coordinators who already have a general understanding of how to use the calculators and how they work. To use the calculator:
1.) Select a PAR storage location scenario from the available Excel worksheets.
2.) Input the fraction of daily demand to be met by PAR storage inventory. The input cell is near the top of the worksheet under cell with the text % of daily demand met by PAR.
• The calculator uses the inverse of the entered fraction to calculate the number of daily PAR replenishments needed
• The calculator multiplies the entered fraction by each storage location’s pump demand for each day of FY 2012 (or second half of FY 2012 for the wing and floor storage location scenarios).
• The Excel PERCENTILE function is used to calculate various percentiles of the fractions of daily demand to be met by PAR inventory for each storage location. The calculated percentiles are the required PAR inventory levels for each storage location to meet the entered fraction of daily demand to be met by PAR inventory a certain percentage of the time.
• The PAR inventory levels are summed for each different calculated percentile to determine the total daily available PAR inventory required to meet one day’s demand.
• The fractions of each storage location’s daily demand are summed for each day of FY 2012 (or second half of FY 2012). The resulting sums represent the demand that is met by PAR inventory for each day.
• The calculator subtracts each day’s met demand from the total system (excluding areas that maintain their own pumps) to determine the demand that is not met by PAR inventory for each day.
• The Excel PERCENTILE function is then used to calculate various percentiles of the daily demand that is not met by PAR inventory. These percentiles represent the central inventory required to meet the daily demand not met by PAR inventory a certain percentage of the time.
22
• The calculated total PAR inventory and central inventory are summed to determine the total daily available inventory required to meet demand for one day a certain percentage of the time.
3.) The user may also choose to input the fraction of daily demand to be met by PAR
inventory for each individual storage location instead (i.e. set one storage location to have inventory to meet 1/4 of a day’s demand, and another to meet 1/3 of a day’s demand). These input cells are located at the bottom of the worksheet.
• When this is done, the calculator multiplies each storage location’s demand by the entered fraction of demand to be met by PAR inventory for that storage location. The rest of the calculations are performed in the same manner as described above.
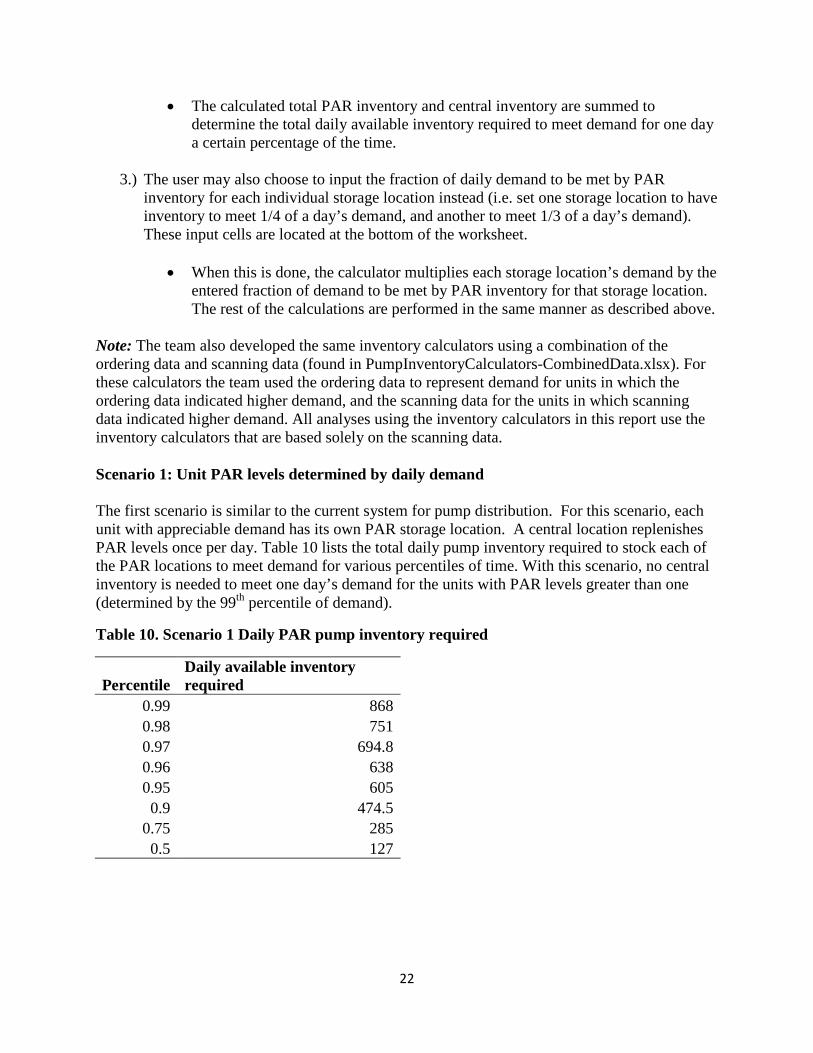
Note: The team also developed the same inventory calculators using a combination of the ordering data and scanning data (found in PumpInventoryCalculators-CombinedData.xlsx). For these calculators the team used the ordering data to represent demand for units in which the ordering data indicated higher demand, and the scanning data for the units in which scanning data indicated higher demand. All analyses using the inventory calculators in this report use the inventory calculators that are based solely on the scanning data. Scenario 1: Unit PAR levels determined by daily demand The first scenario is similar to the current system for pump distribution. For this scenario, each unit with appreciable demand has its own PAR storage location. A central location replenishes PAR levels once per day. Table 10 lists the total daily pump inventory required to stock each of the PAR locations to meet demand for various percentiles of time. With this scenario, no central inventory is needed to meet one day’s demand for the units with PAR levels greater than one (determined by the 99th percentile of demand).
Table 10. Scenario 1 Daily PAR pump inventory required
Percentile Daily available inventory required
0.99 868 0.98 751 0.97 694.8 0.96 638 0.95 605 0.9 474.5
0.75 285 0.5 127
23
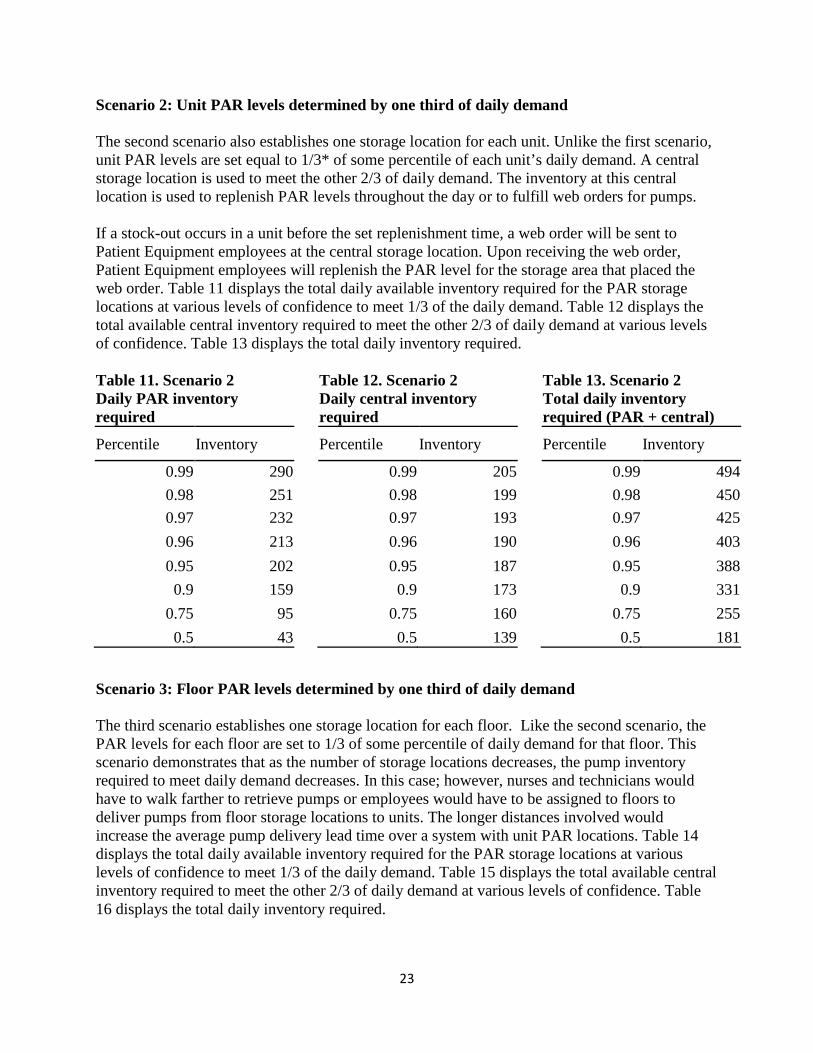
Scenario 2: Unit PAR levels determined by one third of daily demand The second scenario also establishes one storage location for each unit. Unlike the first scenario, unit PAR levels are set equal to 1/3* of some percentile of each unit’s daily demand. A central storage location is used to meet the other 2/3 of daily demand. The inventory at this central location is used to replenish PAR levels throughout the day or to fulfill web orders for pumps. If a stock-out occurs in a unit before the set replenishment time, a web order will be sent to Patient Equipment employees at the central storage location. Upon receiving the web order, Patient Equipment employees will replenish the PAR level for the storage area that placed the web order. Table 11 displays the total daily available inventory required for the PAR storage locations at various levels of confidence to meet 1/3 of the daily demand. Table 12 displays the total available central inventory required to meet the other 2/3 of daily demand at various levels of confidence. Table 13 displays the total daily inventory required. Table 11. Scenario 2 Daily PAR inventory required
Percentile Inventory
0.99 290 0.98 251 0.97 232 0.96 213 0.95 202 0.9 159
0.75 95 0.5 43
Table 12. Scenario 2 Daily central inventory required
Percentile Inventory
0.99 205 0.98 199 0.97 193 0.96 190 0.95 187 0.9 173
0.75 160 0.5 139
Table 13. Scenario 2 Total daily inventory required (PAR + central)
Percentile Inventory
0.99 494 0.98 450 0.97 425 0.96 403 0.95 388 0.9 331
0.75 255 0.5 181
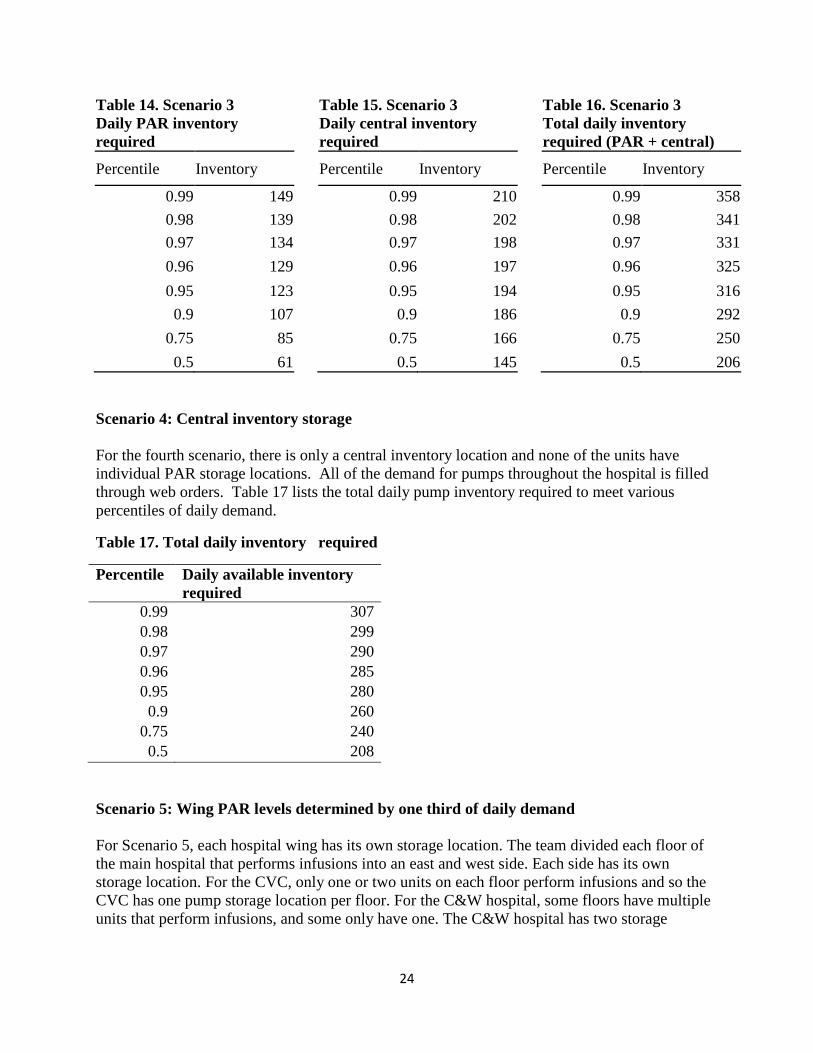
Scenario 3: Floor PAR levels determined by one third of daily demand The third scenario establishes one storage location for each floor. Like the second scenario, the PAR levels for each floor are set to 1/3 of some percentile of daily demand for that floor. This scenario demonstrates that as the number of storage locations decreases, the pump inventory required to meet daily demand decreases. In this case; however, nurses and technicians would have to walk farther to retrieve pumps or employees would have to be assigned to floors to deliver pumps from floor storage locations to units. The longer distances involved would increase the average pump delivery lead time over a system with unit PAR locations. Table 14 displays the total daily available inventory required for the PAR storage locations at various levels of confidence to meet 1/3 of the daily demand. Table 15 displays the total available central inventory required to meet the other 2/3 of daily demand at various levels of confidence. Table 16 displays the total daily inventory required.
24
Table 14. Scenario 3 Daily PAR inventory required
Percentile Inventory
0.99 149 0.98 139 0.97 134 0.96 129 0.95 123 0.9 107
0.75 85 0.5 61
Table 15. Scenario 3 Daily central inventory required
Percentile Inventory
0.99 210 0.98 202 0.97 198 0.96 197 0.95 194 0.9 186
0.75 166 0.5 145
Table 16. Scenario 3 Total daily inventory required (PAR + central)
Percentile Inventory
0.99 358 0.98 341 0.97 331 0.96 325 0.95 316 0.9 292
0.75 250 0.5 206
Scenario 4: Central inventory storage For the fourth scenario, there is only a central inventory location and none of the units have individual PAR storage locations. All of the demand for pumps throughout the hospital is filled through web orders. Table 17 lists the total daily pump inventory required to meet various percentiles of daily demand.
Table 17. Total daily inventory required
Percentile Daily available inventory required
0.99 307 0.98 299 0.97 290 0.96 285 0.95 280 0.9 260
0.75 240 0.5 208
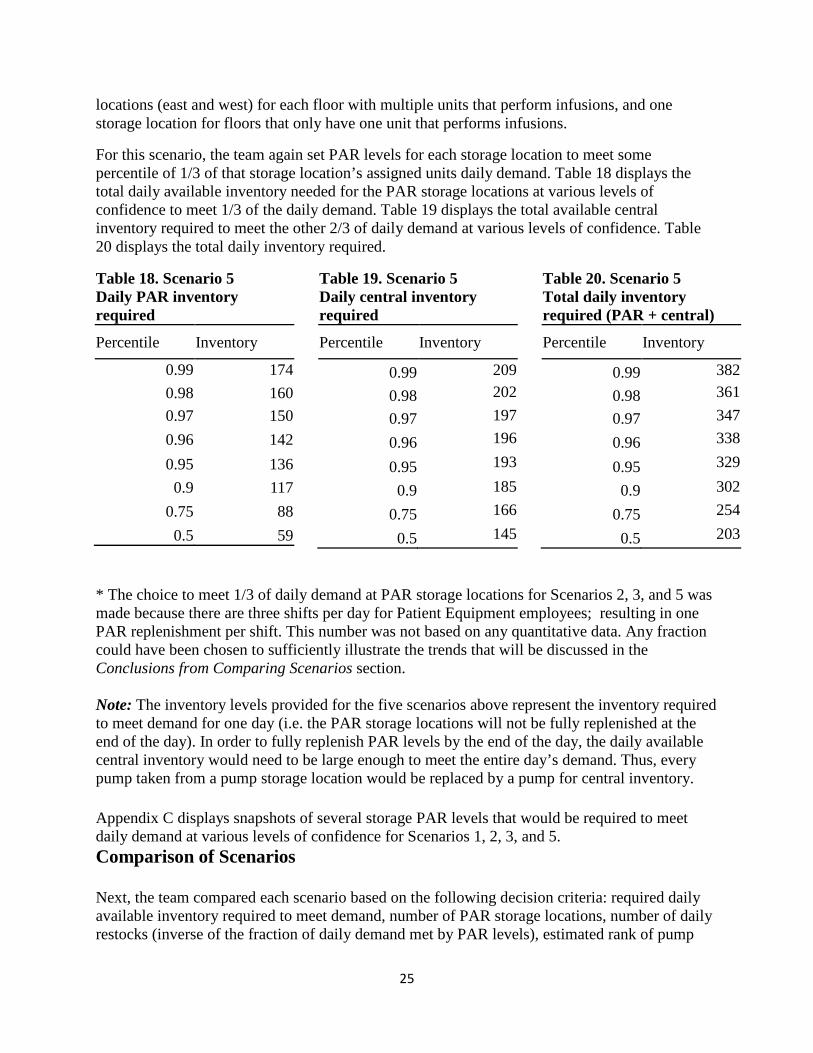
Scenario 5: Wing PAR levels determined by one third of daily demand For Scenario 5, each hospital wing has its own storage location. The team divided each floor of the main hospital that performs infusions into an east and west side. Each side has its own storage location. For the CVC, only one or two units on each floor perform infusions and so the CVC has one pump storage location per floor. For the C&W hospital, some floors have multiple units that perform infusions, and some only have one. The C&W hospital has two storage
25
locations (east and west) for each floor with multiple units that perform infusions, and one storage location for floors that only have one unit that performs infusions.
For this scenario, the team again set PAR levels for each storage location to meet some percentile of 1/3 of that storage location’s assigned units daily demand. Table 18 displays the total daily available inventory needed for the PAR storage locations at various levels of confidence to meet 1/3 of the daily demand. Table 19 displays the total available central inventory required to meet the other 2/3 of daily demand at various levels of confidence. Table 20 displays the total daily inventory required.
Table 18. Scenario 5 Daily PAR inventory required
Percentile Inventory
0.99 174 0.98 160 0.97 150 0.96 142 0.95 136 0.9 117
0.75 88 0.5 59
Table 19. Scenario 5 Daily central inventory required
Percentile Inventory
0.99 209 0.98 202
0.97 197
0.96 196
0.95 193
0.9 185
0.75 166
0.5 145
Table 20. Scenario 5 Total daily inventory required (PAR + central)
Percentile Inventory
0.99 382 0.98 361
0.97 347
0.96 338
0.95 329
0.9 302
0.75 254
0.5 203
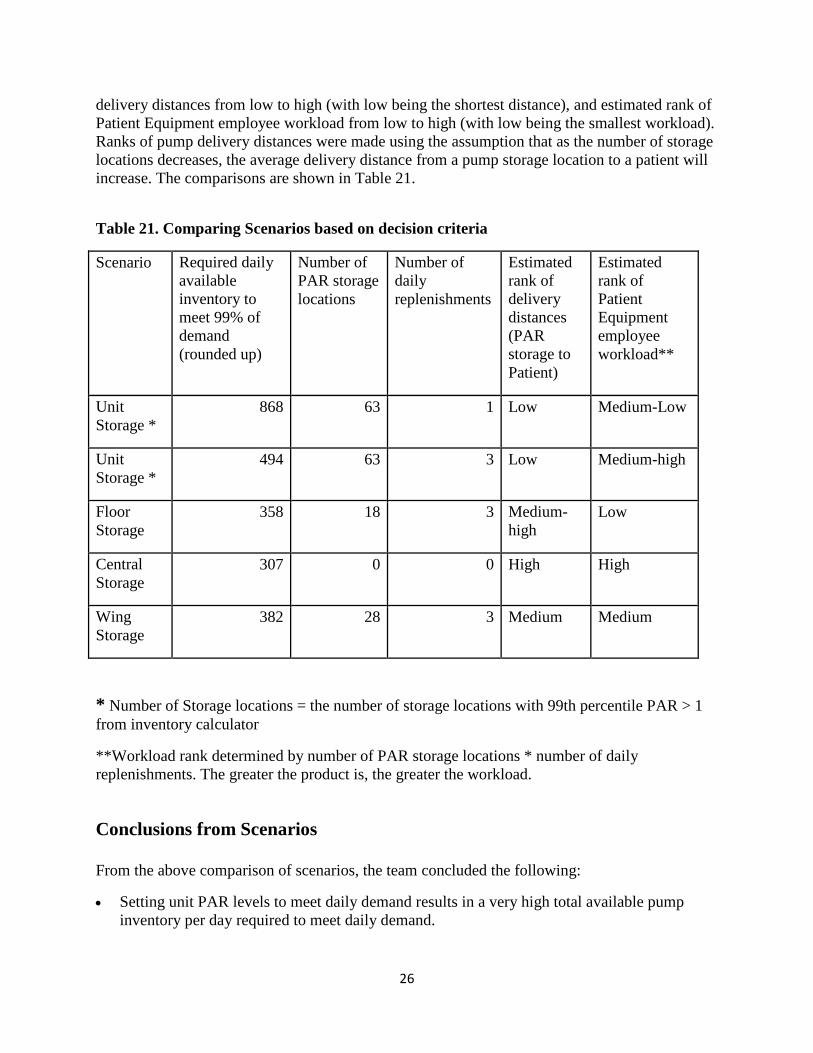
* The choice to meet 1/3 of daily demand at PAR storage locations for Scenarios 2, 3, and 5 was made because there are three shifts per day for Patient Equipment employees; resulting in one PAR replenishment per shift. This number was not based on any quantitative data. Any fraction could have been chosen to sufficiently illustrate the trends that will be discussed in the Conclusions from Comparing Scenarios section. Note: The inventory levels provided for the five scenarios above represent the inventory required to meet demand for one day (i.e. the PAR storage locations will not be fully replenished at the end of the day). In order to fully replenish PAR levels by the end of the day, the daily available central inventory would need to be large enough to meet the entire day’s demand. Thus, every pump taken from a pump storage location would be replaced by a pump for central inventory. Appendix C displays snapshots of several storage PAR levels that would be required to meet daily demand at various levels of confidence for Scenarios 1, 2, 3, and 5. Comparison of Scenarios Next, the team compared each scenario based on the following decision criteria: required daily available inventory required to meet demand, number of PAR storage locations, number of daily restocks (inverse of the fraction of daily demand met by PAR levels), estimated rank of pump
26
delivery distances from low to high (with low being the shortest distance), and estimated rank of Patient Equipment employee workload from low to high (with low being the smallest workload). Ranks of pump delivery distances were made using the assumption that as the number of storage locations decreases, the average delivery distance from a pump storage location to a patient will increase. The comparisons are shown in Table 21.
Table 21. Comparing Scenarios based on decision criteria
Scenario Required daily available inventory to meet 99% of demand (rounded up)
Number of PAR storage locations
Number of daily replenishments
Estimated rank of delivery distances (PAR storage to Patient)
Estimated rank of Patient Equipment employee workload**
Unit Storage *
868 63 1 Low Medium-Low
Unit Storage *
494 63 3 Low Medium-high
Floor Storage
358 18 3 Medium-high
Low
Central Storage
307 0 0 High High
Wing Storage
382 28 3 Medium Medium
* Number of Storage locations = the number of storage locations with 99th percentile PAR > 1 from inventory calculator
**Workload rank determined by number of PAR storage locations * number of daily replenishments. The greater the product is, the greater the workload.
Conclusions from Scenarios From the above comparison of scenarios, the team concluded the following:
• Setting unit PAR levels to meet daily demand results in a very high total available pump inventory per day required to meet daily demand.
27
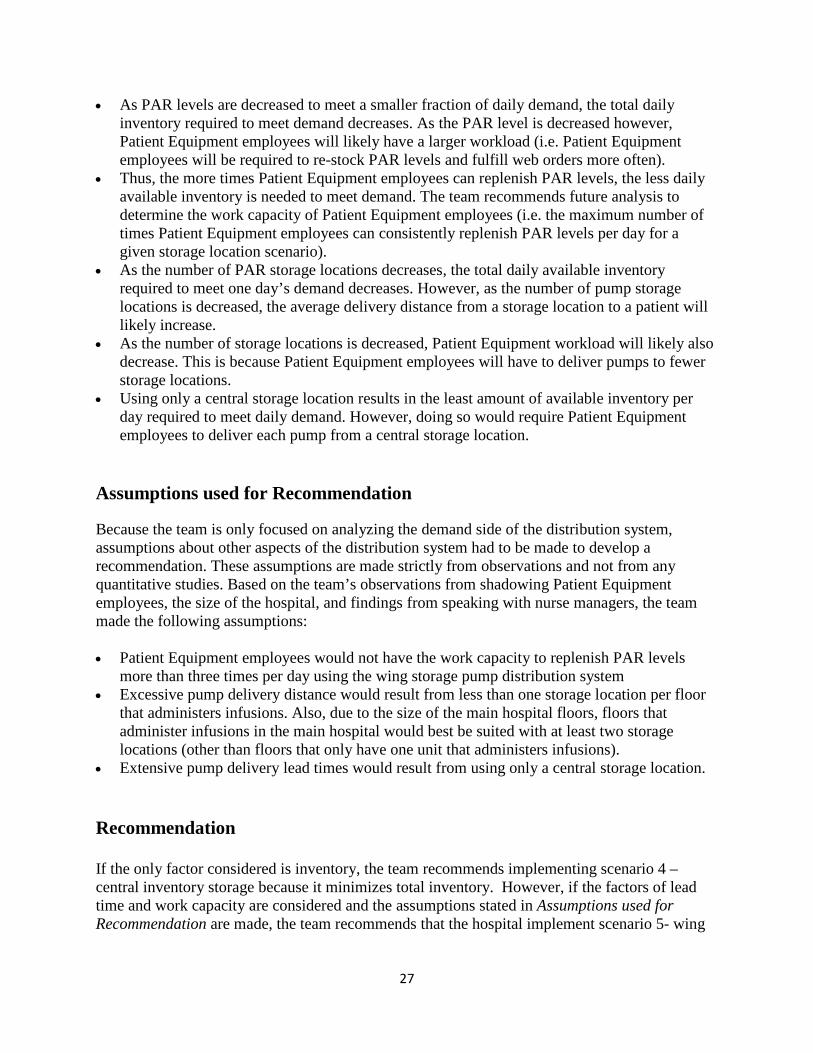
• As PAR levels are decreased to meet a smaller fraction of daily demand, the total daily inventory required to meet demand decreases. As the PAR level is decreased however, Patient Equipment employees will likely have a larger workload (i.e. Patient Equipment employees will be required to re-stock PAR levels and fulfill web orders more often).
• Thus, the more times Patient Equipment employees can replenish PAR levels, the less daily available inventory is needed to meet demand. The team recommends future analysis to determine the work capacity of Patient Equipment employees (i.e. the maximum number of times Patient Equipment employees can consistently replenish PAR levels per day for a given storage location scenario).
• As the number of PAR storage locations decreases, the total daily available inventory required to meet one day’s demand decreases. However, as the number of pump storage locations is decreased, the average delivery distance from a storage location to a patient will likely increase.
• As the number of storage locations is decreased, Patient Equipment workload will likely also decrease. This is because Patient Equipment employees will have to deliver pumps to fewer storage locations.
• Using only a central storage location results in the least amount of available inventory per day required to meet daily demand. However, doing so would require Patient Equipment employees to deliver each pump from a central storage location.
Assumptions used for Recommendation
Because the team is only focused on analyzing the demand side of the distribution system, assumptions about other aspects of the distribution system had to be made to develop a recommendation. These assumptions are made strictly from observations and not from any quantitative studies. Based on the team’s observations from shadowing Patient Equipment employees, the size of the hospital, and findings from speaking with nurse managers, the team made the following assumptions: • Patient Equipment employees would not have the work capacity to replenish PAR levels
more than three times per day using the wing storage pump distribution system • Excessive pump delivery distance would result from less than one storage location per floor
that administers infusions. Also, due to the size of the main hospital floors, floors that administer infusions in the main hospital would best be suited with at least two storage locations (other than floors that only have one unit that administers infusions).
• Extensive pump delivery lead times would result from using only a central storage location. Recommendation If the only factor considered is inventory, the team recommends implementing scenario 4 – central inventory storage because it minimizes total inventory. However, if the factors of lead time and work capacity are considered and the assumptions stated in Assumptions used for Recommendation are made, the team recommends that the hospital implement scenario 5- wing
28
storage with PAR levels determined by the 99th percentile of 1/3 of daily demand. From the team’s analysis, minimizing required pump inventory to meet demand is constrained by:
1.) The Maximum number of times Patient Equipment employees can replenish PAR levels per day
2.) The minimum number of storage locations that can be used while still meeting all other
system requirements such as: • Acceptable pump delivery lead times • Economical delivery of pumps
Using the assumptions previously stated, Scenario 5 results in the least required inventory to meet demand while adhering to the two constraints above. Furthermore, the team recommends the inventory levels calculated from the 99th percentile of demand to minimize the number of PAR storage location stock-outs. Note: The team does not recommend implementing the wing storage scenario unless the assumptions made in the Assumptions for Recommendation section are validated. Expected Impact The team expects their findings, conclusions, and recommendations to be utilized by other project teams focused on other aspects of the pump distribution system. The team’s findings, conclusions, and recommendation will be utilized with the findings, conclusions, and recommendations of other project teams to determine the total required pump inventory to consistently meet daily demand, and to develop a new, improved infusion pump distribution system. Furthermore, if the team’s recommendation is implemented, the team expects that the increased feasibility of following the distribution process’s procedures will result in more employee confidence in the system. As a result, system standardization will increase. This standardization will result in shorter pump delivery lead times, and more regular replenishment of PAR inventory storage locations. In addition, due to the decrease in the number of storage locations for the team’s recommendation compared to the current system, the inventory required to meet Alaris infusion pump demand will decrease, reducing the hospital’s infusion pump inventory holding costs. Future Steps The team recommends the following future steps be taken before implementing a new infusion pump distribution system.
1.) Perform studies to quantify the system constraints (described in the Recommendation section) on minimizing pump inventory requirements
29
2.) Quantitatively rather than qualitatively assess the error in the scanning data’s representation of true demand
3.) Adjust inventory calculators for found error in the scanning data 4.) Develop a project to obtain hourly demand data 5.) Use hourly demand data to determine optimal irregular replenishment times (Because
daily demand is not evenly distributed, the time periods between optimal replenishment times would be uneven if PAR levels are set using the developed inventory calculator) , or use the hourly demand data to determine PAR levels that allow for regular replenishment periods.
6.) Develop a project with the specific focus of determining if demand in the areas that internally maintain pumps is justified
7.) Determine the total inventory needed to consistently meet infusion pump demand.
30
Appendix A – Nurse/ technician survey questions and purpose
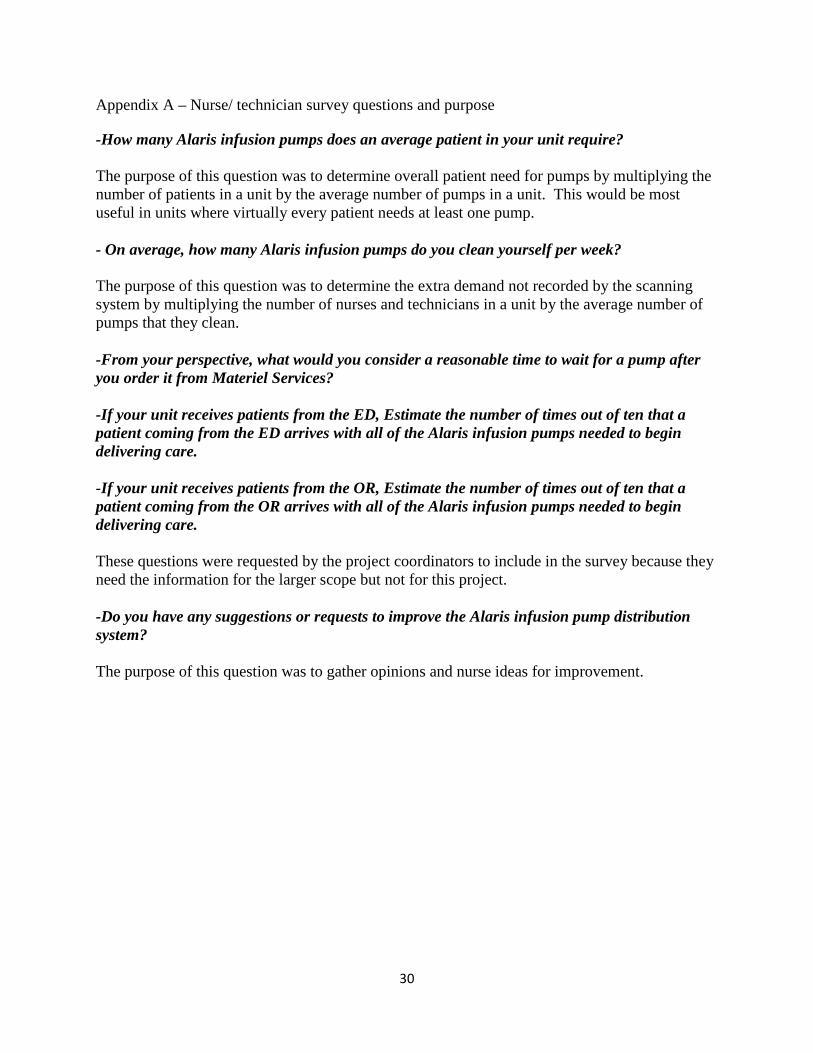
-How many Alaris infusion pumps does an average patient in your unit require? The purpose of this question was to determine overall patient need for pumps by multiplying the number of patients in a unit by the average number of pumps in a unit. This would be most useful in units where virtually every patient needs at least one pump. - On average, how many Alaris infusion pumps do you clean yourself per week? The purpose of this question was to determine the extra demand not recorded by the scanning system by multiplying the number of nurses and technicians in a unit by the average number of pumps that they clean. -From your perspective, what would you consider a reasonable time to wait for a pump after you order it from Materiel Services? -If your unit receives patients from the ED, Estimate the number of times out of ten that a patient coming from the ED arrives with all of the Alaris infusion pumps needed to begin delivering care. -If your unit receives patients from the OR, Estimate the number of times out of ten that a patient coming from the OR arrives with all of the Alaris infusion pumps needed to begin delivering care. These questions were requested by the project coordinators to include in the survey because they need the information for the larger scope but not for this project. -Do you have any suggestions or requests to improve the Alaris infusion pump distribution system? The purpose of this question was to gather opinions and nurse ideas for improvement.

31
Appendix B – Nurse/ technician requests and suggestions to improve infusion pump distribution
ICU – Adults (Sample size=60) • Keep more clean pumps on the unit (12) • Deliver pumps faster (7) • Buy more/new pumps (7) • Use universal pump, have the OR use Alaris instead of syringe pumps (4) • Have more double pumps, ICUs priority (5) • Replace/repair broken pumps (4)
ICU – Peds (Sample size = 28)
• Clean pumps properly (3) • Check PAR level every four hours(1) • Buy more pumps (1)
Birth Center Units (Sample size = 20)
• Keep a larger PAR and restock more frequently (6) • Regularly sweep rooms and floors and collect dirty pumps (2) • Assign one person to deliver pumps to an area (1) • At least 1 double and 2 singles on the unit at all times (1) • Have clerk take a floor stock with each order and have Mat. Services bring up
the necessary number of pumps (1) • Direct communication - Carelink orders instead of phone calls to allow
auditing of delivery times (1)
Operating Room Units – Adult (Sample size = 14)
• Collect dirty pumps more often (2) • Call unit to ask about needs (2) • Better maintain PAR levels/ keep continuous supply/ hourly PAR maintenance
(2) • Don't put broken pumps back in the system (2) • Deliver regularly during high volume hour (1) • Better weekend stocking (1) • Better afternoon/evening stocking (1)
• Find out how many patients are having surgery and plan ahead (1)
32
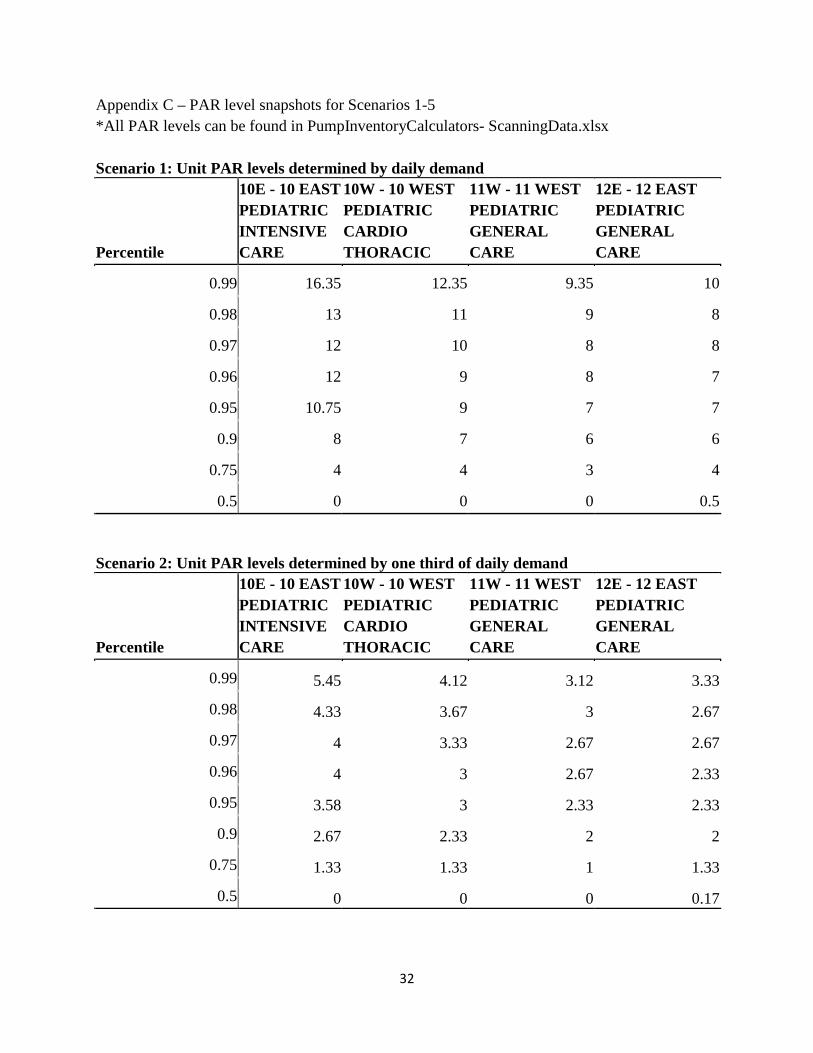
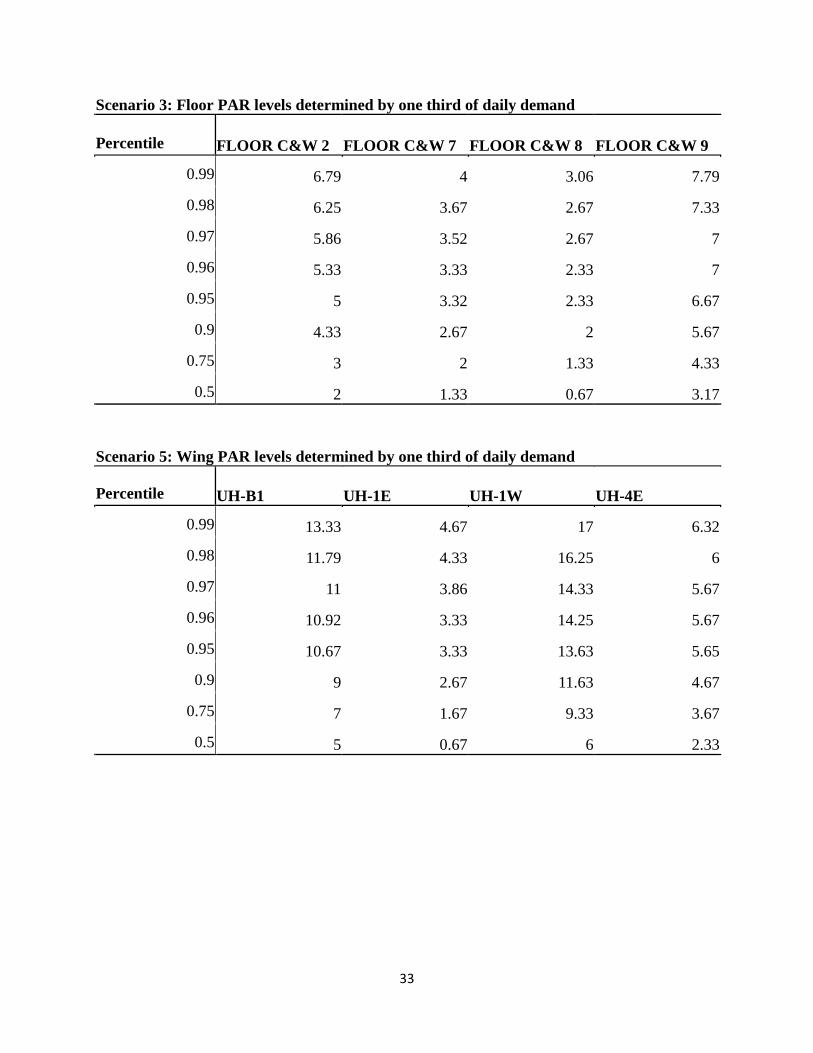
Appendix C – PAR level snapshots for Scenarios 1-5 *All PAR levels can be found in PumpInventoryCalculators- ScanningData.xlsx Scenario 1: Unit PAR levels determined by daily demand
Percentile
10E - 10 EAST PEDIATRIC INTENSIVE CARE
10W - 10 WEST PEDIATRIC CARDIO THORACIC
11W - 11 WEST PEDIATRIC GENERAL CARE
12E - 12 EAST PEDIATRIC GENERAL CARE
0.99 16.35 12.35 9.35 10
0.98 13 11 9 8
0.97 12 10 8 8
0.96 12 9 8 7
0.95 10.75 9 7 7
0.9 8 7 6 6
0.75 4 4 3 4
0.5 0 0 0 0.5 Scenario 2: Unit PAR levels determined by one third of daily demand
Percentile
10E - 10 EAST PEDIATRIC INTENSIVE CARE
10W - 10 WEST PEDIATRIC CARDIO THORACIC
11W - 11 WEST PEDIATRIC GENERAL CARE
12E - 12 EAST PEDIATRIC GENERAL CARE
0.99 5.45 4.12 3.12 3.33
0.98 4.33 3.67 3 2.67
0.97 4 3.33 2.67 2.67
0.96 4 3 2.67 2.33
0.95 3.58 3 2.33 2.33
0.9 2.67 2.33 2 2
0.75 1.33 1.33 1 1.33
0.5 0 0 0 0.17
33
Scenario 3: Floor PAR levels determined by one third of daily demand
Percentile FLOOR C&W 2 FLOOR C&W 7 FLOOR C&W 8 FLOOR C&W 9
0.99 6.79 4 3.06 7.79
0.98 6.25 3.67 2.67 7.33
0.97 5.86 3.52 2.67 7
0.96 5.33 3.33 2.33 7
0.95 5 3.32 2.33 6.67
0.9 4.33 2.67 2 5.67
0.75 3 2 1.33 4.33
0.5 2 1.33 0.67 3.17 Scenario 5: Wing PAR levels determined by one third of daily demand
Percentile UH-B1 UH-1E UH-1W UH-4E
0.99 13.33 4.67 17 6.32
0.98 11.79 4.33 16.25 6
0.97 11 3.86 14.33 5.67
0.96 10.92 3.33 14.25 5.67
0.95 10.67 3.33 13.63 5.65
0.9 9 2.67 11.63 4.67
0.75 7 1.67 9.33 3.67
0.5 5 0.67 6 2.33