innovation impact report - nexight...
TRANSCRIPT

Sponsored by the Advanced Manufacturing Office - U.S. DOE Contracted to TMS through the Oak Ridge National LaboratoryIn cooperation with ASM International and The Energy Materials Initiative
energy.tms.org
Innovation Impact Report

About this RepoRtLinking Transformational Materials and Processing for an Energy-Efficient and Low-Carbon Economy—Innovation Impact Report draws on the contributions of 50 technical experts from industry, academia, and government. These experts worked in five teams led by Brajendra Mishra (Functional Surface Technologies), Diana Lados (Materials Integration in Clean Energy Systems), John Lewandowski (Higher-Performance Materials), Ray Peterson (New Paradigm Materials Manufacturing Processes), and George Spanos (Materials and Process Development Acceleration Tools). The dedication and active involvement of all of the experts has been an integral part of this effort; the information enclosed in this Innovation Impact Report is the compilation of their contributions. References that serve as the basis of their interpretations have been provided wherever they are available.
This report was sponsored by the U.S. Department of Energy Advanced Manufacturing Office and contracted to The Minerals, Metals, & Materials Society (TMS) through Oak Ridge National Laboratory. The authors thank Steve Sikirica and Ron Ott for their guidance. This document was prepared by Jared Kosters, Sarah Lichtner, and Ross Brindle of Nexight Group under the direction of Dr. Warren Hunt, Executive Director, TMS. Mauricio Justiniano and Ridah Sabouni of Energetics Incorporated contributed analytical expertise to the report. Emily Maffett and Lindsay Pack of Nexight Group and Lianne Hepler of Station 10 Creative provided editing and design.
Notice: This report was prepared as an account of work sponsored by an agency of the United States government. Neither the United States government nor any agency thereof, nor any of their employees, makes any warranty, express or implied, or assumes any legal liability or responsibility for the accuracy, completeness, or usefulness of any information, apparatus, product, or process disclosed, or represents that its use would not infringe privately owned rights. Reference herein to any specific commercial product, process, or service by trade name, trademark, manufacturer, or otherwise does not necessarily constitute or imply its endorsement, recommendation, or favoring by the United States government or any agency thereof. The views and opinions of authors expressed herein do not necessarily state or reflect those of the United States government or any agency thereof.

iii
tAble of Contentsi. MAteRiAls: the foundAtion foR the CleAn eneRgy Age ................................................1
Project Background: Creating the Vision and Accelerating Realization ..................................................... 1Phase III: Identifying Opportunities and Assessing Potential Impact .......................................................... 1Notes ......................................................................................................................................................... 5Research Priorities ..................................................................................................................................... 5
ii. pRoCess oveRview ........................................................................................................................18Breakthrough Opportunities: A Closer Look ..................................................................................... 18
iii. funCtionAl suRfACe teChnologies .....................................................................................20Catalysts .................................................................................................................................................. 20
Market Opportunity: Industrial Processes ......................................................................................... 20Market Opportunity: Oil and Gas ...................................................................................................... 20Breakthrough Opportunities .............................................................................................................. 20
Catalysts with High Selectivity and Conversion Efficiency .............................................................. 21Catalysts for Alternate Feedstocks ................................................................................................. 22
R&D Priority Activities: Catalysts ....................................................................................................... 23Solar Materials ......................................................................................................................................... 23
Market Opportunity: Electricity Generation ...................................................................................... 23Breakthrough Opportunities .............................................................................................................. 23
Generation 1 and 2 Photovoltaics ................................................................................................... 24Generation 3 and 4 Photovoltaics ................................................................................................... 25Solar Thermal / Concentrated Solar Power Technologies .............................................................. 26
R&D Priority Activities: Solar Materials .............................................................................................. 27Gas-Separating Membranes ..................................................................................................................... 28
Market Opportunity: Electricity Generation ...................................................................................... 28Market Opportunity: Industrial Processes ......................................................................................... 28Breakthrough Opportunities .............................................................................................................. 28
Ceramic Membranes ...................................................................................................................... 29Metallic Membranes........................................................................................................................ 30Polymeric Membranes .................................................................................................................... 31Composite Membranes .................................................................................................................. 32
R&D Priority Activities: Gas-Separating Membranes ......................................................................... 33Coatings ................................................................................................................................................... 33
Market Opportunity: Electricity Generation ...................................................................................... 33Market Opportunity: Industrial Processes ......................................................................................... 33Breakthrough Opportunities .............................................................................................................. 34
Wear/Tribology ............................................................................................................................... 34High-Temperature and Thermal Barrier Coatings .......................................................................... 35
R&D Priority Activities: Coatings ....................................................................................................... 36Notes ....................................................................................................................................................... 37
iv. MAteRiAls integRAtion in CleAn eneRgy systeMs ..........................................................39Next-Generation Batteries and Fuel Cells............................................................................................... 39
Market Opportunity: Transportation .................................................................................................. 39Market Opportunity: Electricity Generation ...................................................................................... 39Breakthrough Opportunities .............................................................................................................. 39
Short-Duration Stationary Storage and Conversion ....................................................................... 40Long-Duration Stationary Storage and Conversion ........................................................................ 41Transportation ................................................................................................................................. 42
R&D Priority Activities: Next-Generation Batteries and Fuel Cells ................................................... 43Joining Processes for Multi-Material Structures ....................................................................................... 44
Market Opportunity: Transportation .................................................................................................. 44

iv
Market Opportunity: Oil and Gas ...................................................................................................... 44Breakthrough Opportunities .............................................................................................................. 44
Adhesive Bonding ........................................................................................................................... 45Solid-State Bonding ......................................................................................................................... 46Design Data and Testing ................................................................................................................. 47
R&D Priority Activities: Joining Processes for Multi-Material Structures ........................................... 48Composites with Structural Capabilities.................................................................................................. 50
Market Opportunity: Industrial Processes (Heat Exchangers) ........................................................... 50Market Opportunity: Transportation .................................................................................................. 50Breakthrough Opportunities .............................................................................................................. 50
Metal Matrix Composites and Nanocomposites ............................................................................ 51Polymer Composites and Nanocomposites ................................................................................... 52Layered, Sandwich, and Infiltrated Materials .................................................................................. 53
R&D Priority Activities: Composites with Structural Capabilities ...................................................... 54Notes ....................................................................................................................................................... 55
v. higheR-peRfoRMAnCe MAteRiAls ............................................................................................57Thermoelectric Materials ........................................................................................................................ 57
Market Opportunity: Industrial Processes ......................................................................................... 57Market Opportunity: Transportation .................................................................................................. 57Breakthrough Opportunities .............................................................................................................. 57
Improved Manufacturing ................................................................................................................. 58Higher Figure of Merit (ZT) ............................................................................................................ 59Sealants ........................................................................................................................................... 60Substitute Materials ........................................................................................................................ 61
R&D Priority Activities: Thermoelectric Materials ............................................................................. 62Phase-Stable Metallic Materials ................................................................................................................ 63
Market Opportunity: Electricity Generation ...................................................................................... 63Breakthrough Opportunities .............................................................................................................. 63
Next-Generation Steels .................................................................................................................. 64Next-Generation Nickel-Cobalt ..................................................................................................... 65Irradiation-Resistant Materials ........................................................................................................ 66Next-Generation Zirconium Cladding ........................................................................................... 67
R&D Priority Activities: Phase-Stable Metallic Materials .................................................................... 68Surface Treatments .................................................................................................................................. 69
Market Opportunity: Transportation .................................................................................................. 69Market Opportunity: Electricity Generation ...................................................................................... 69Breakthrough Opportunities .............................................................................................................. 69
Part Restoration .............................................................................................................................. 70Surface Processing .......................................................................................................................... 71
R&D Priority Activities: Surface Treatments ....................................................................................... 72Lightweight High-Strength Materials ....................................................................................................... 73
Market Opportunity: Transportation .................................................................................................. 73Breakthrough Opportunities .............................................................................................................. 73
Processing and Synthesis ................................................................................................................. 74Hybrid Materials ............................................................................................................................. 75
R&D Priority Activities: Lightweight High-Strength Materials ............................................................ 76Notes ....................................................................................................................................................... 77

v
vi. new pARAdigM MAteRiAls MAnufACtuRing pRoCesses ..................................................79Net-Shape Processing .............................................................................................................................. 79
Market Opportunity: Industrial Processes ......................................................................................... 79Market Opportunity: Transportation .................................................................................................. 79Breakthrough Opportunities .............................................................................................................. 80
Solid-State Forming ........................................................................................................................ 81Powder Metallurgy ......................................................................................................................... 82Casting ............................................................................................................................................ 83
R&D Priority Activities: Net-Shape Processing .................................................................................. 84Additive Manufacturing ............................................................................................................................ 85
Market Opportunity: Transportation .................................................................................................. 85Breakthrough Opportunities .............................................................................................................. 85
Metals Manufacturing ...................................................................................................................... 86Polymer Manufacturing ................................................................................................................... 87Direct Writing ................................................................................................................................. 88Multifunctional Manufacturing ........................................................................................................ 89
R&D Priority Activities: Additive Manufacturing ................................................................................ 90Low-Cost Composites Manufacturing ..................................................................................................... 92
Market Opportunity: Transportation .................................................................................................. 92Market Opportunity: Wind Power ..................................................................................................... 92Breakthrough Opportunities .............................................................................................................. 92
Fibers Manufacturing ...................................................................................................................... 93Composite Matrix Manufacturing ................................................................................................... 94
R&D Priority Activities: Low-Cost Composites Manufacturing ......................................................... 95Energy-Efficient Metals Production ......................................................................................................... 96
Market Opportunity: Transportation .................................................................................................. 96Market Opportunity: Industrial Processes ......................................................................................... 96Breakthrough Opportunities .............................................................................................................. 96
Steel Production ............................................................................................................................. 97Aluminum Production ..................................................................................................................... 98Recycling ......................................................................................................................................... 99Titanium Processing ...................................................................................................................... 100
R&D Priority Activities: Energy-Efficient Metals Production ............................................................ 101Notes ..................................................................................................................................................... 102
vii. MAteRiAls And pRoCess developMent ACCeleRAtion tools ...................................105Collaborative Databases ........................................................................................................................ 105
Breakthrough Opportunities ............................................................................................................ 105Structural Materials Databases ..................................................................................................... 106Functional Materials Databases ..................................................................................................... 107
R&D Priority Activities: Collaborative Databases............................................................................. 108Predictive Modeling of Material Performance ....................................................................................... 109
Breakthrough Opportunities ............................................................................................................ 109Deformation and Texture ............................................................................................................. 110Fracture and Fatigue ..................................................................................................................... 111Materials Degradation................................................................................................................... 112
R&D Priority Activities: Predictive Modeling of Material Performance ............................................ 113Process Modeling Codes ....................................................................................................................... 113
Breakthrough Opportunities ............................................................................................................ 113Microstructural Evolution and Materials Performance ................................................................. 114Materials/Compound Discovery ................................................................................................... 115

vi
Process Manufacturing and Component Performance ................................................................. 116R&D Priority Activities: Process Modeling Codes ............................................................................ 117
Integrated Computational Materials Engineering .................................................................................. 117ICME Platforms ............................................................................................................................ 118
R&D Priority Activities: Integrated Computational Materials Engineering ....................................... 119Notes ..................................................................................................................................................... 120
viii. the pAth foRwARd ......................................................................................................................121
iX. AppendiX .........................................................................................................................................122Acronyms and Abbreviations ................................................................................................................. 122Contributors .......................................................................................................................................... 123
Functional Surface Technologies ....................................................................................................... 123Materials Integration in Clean Energy Systems ................................................................................ 123Higher-Performance Materials ......................................................................................................... 123New Paradigm Materials Manufacturing Processes .......................................................................... 124Materials and Process Development Acceleration Tools ................................................................. 124Support Group ................................................................................................................................. 124

1
Materials are fundamental to the generation, storage, delivery, and use of energy. As concerns regarding slow economic growth and
global climate change require today’s energy systems to become more efficient and productive, materials frequently determine the limits of system performance. Likewise, materials breakthroughs are often the key advances that improve the efficiency or reduce the cost of clean energy systems.
Materials advances have the potential to be the foundation for the clean energy age, making materials science and engineering (MSE) a critical national priority. While the United States is full of highly innovative, dynamic companies that are world leaders in the energy sector, they are often slow to incorporate new materials into energy systems at scale due to the massive investments and risks often associated with new technology. As a result, new materials discoveries typically require 10–20 years to become fully developed and integrated into commercial products.1 Identifying and investing in MSE opportunities with the greatest potential for impact is extremely important to providing the clean, abundant, and secure energy that the United States and the world will increasingly require.
This Innovation Impact Report, the third phase of the Linking Transformational Materials and Processing for an Energy Efficient and Low-Carbon Economy: Creating the Vision and Accelerating Realization study, focuses on identifying the most significant opportunities for materials innovation that can deliver substantial energy savings, environmental gains, and economic advantage to the United States in the next 2–10 years. Focused research and development efforts in the MSE topics outlined in this report can deliver large energy, environmental, and economic impacts.
pRojeCt bACkgRound: CReAting the vision And ACCeleRAting ReAlizAtionLinking Transformational Materials and Processing for an Energy Efficient and Low-Carbon Economy, a three-part study carried out by The Minerals, Metals, & Materials Society (TMS), aims to articulate a vision for the role that MSE can play in addressing national energy, carbon reduction, and economic development needs.
In the first phase of this work, subtitled Vision Report of the Energy Materials Blue Ribbon Panel,2 the Energy Materials Blue Ribbon Panel identified the high-level areas of the U.S. energy sector where MSE could potentially make the most significant contributions. In their Vision Report, the Panel determined which
parts of the energy sector could be most affected by MSE breakthroughs, identifying near-term and long-term priorities for MSE innovation. The Blue Ribbon Panel also identified foundational areas of MSE research (e.g., higher-performance materials for extreme environments) and crosscutting topics (e.g., computational modeling) that could be key enablers for many energy efficiency and carbon reduction solutions.
Building from this initial Vision, a second phase of the study, subtitled Opportunity Analysis for Materials Science and Engineering,3 identified product and process innovations that, if successfully developed and deployed, would create significant economic impact, energy savings, and carbon emission reductions in the priority areas identified by the Energy Materials Blue Ribbon Panel in the first phase of work. The innovations identified in this phase are organized into two classes: performance breakthroughs (e.g., breakthrough thermoelectric materials) and radical cost reduction opportunities (e.g., new paradigm manufacturing processes of metallic and non-metallic materials and their composites).
In this third phase of the study, innovation impact teams (IITs) consisting of experts from industry, academia, and government (see the Appendix for contributors) identified a subset of specific materials and processing breakthrough opportunities and quantified the magnitude of the potential impacts of each breakthrough opportunity in key energy sectors. In this process, the IITs analyzed historical rates of progress and projected future advances in material properties and systems performance. The IITs also defined the research and development (R&D) priorities necessary to move these innovations toward commercial-scale implementation.
phAse iii: identifying oppoRtunities And Assessing potentiAl iMpACtThe Phase III work was organized into five innovation impact areas that have significant potential to benefit U.S. energy sectors. These areas were originally identified by the Energy Materials Blue Ribbon Panel in Phase I and reaffirmed in Phase II of this work. The five innovation impact areas include the following:
• FunctionalSurfaceTechnologies—Tomorrow’s energy systems will require material surfaces that can effectively interact with service environments and withstand demanding operating conditions. Materials that can serve specific functions, such as speeding reaction times, capturing photons, and separating gases, can increase system efficiency.
i. MAteRiAls: the foundAtion foR the CleAn eneRgy Age executive summary

2
•MaterialsIntegrationinCleanEnergySystems—Current and emerging energy systems are composed of different classes of materials that must work together to achieve desired system structure and functionality. Materials science and engineering advances have the potential to enable the integration of new materials and the effective interfacing of materials combinations as systems become more complex and service environments become more demanding.
• Higher-PerformanceMaterials—For many energy systems, the path to realizing greater energy efficiency brings extreme conditions that today’s materials cannot withstand, such as higher temperatures, more intense radiation, greater wear, or more corrosive environments. Higher-performance materials that can maintain their chemical and physical properties while increasing component and system life under extreme conditions can effectively enhance the efficiency of energy systems.
• NewParadigmMaterialsManufacturingProcesses—Materials manufacturing is fundamentally energy-intensive and often wasteful of resources. Process innovations and novel synthesis methods that minimize energy and material losses can improve manufacturing process efficiency and cost-effectiveness, ultimately enabling greater competitiveness in the U.S. manufacturing sector.
• MaterialsandProcessDevelopmentAccelerationTools—Materials and process development tools, including computational modeling and data visualization, are critical to understanding the nature of materials, preventing detrimental defects and faults, and simulating system performance. Ultimately, developing and using these tools will help reduce the cost and time necessary to facilitate materials discovery and development.
Using the methodology outlined in section II of this report, the IITs identified R&D pathways within the innovation impact areas and 54 specific breakthrough opportunities (shown in Figure 1) within the R&D pathways. These MSE breakthrough opportunities have significant potential to help address the nation’s energy, environmental, and economic needs. Figure 1 shows a map of the breakthrough opportunities within each of the R&D pathways and broader innovation impact areas.
While each material or processing breakthrough opportunity has the potential to individually benefit the United States, the true impact will occur when these innovations come together and are applied to energy sectors at scale. The Phase III IITs agree that advancing the following energy sectors through materials and processing innovation has the greatest potential to help achieve U.S. clean energy and efficiency needs:4
• Energy Generation, including solar, wind, biomass, nuclear, and fossil (oil and gas as well as coal) energy
• Energy Storage, including batteries and fuel cells
• Energy Use, in both industrial and transportation sectors

3
INNOVATION IMPACT AREA
R&DPathway
• Breakthrough Opportunity
FUNCTIONAL SURFACE TECHNOLOGIES
Catalysts SolarMaterials Gas-SeparatingMembranes Coatings
• Catalysts with High Selectivity and Conversion Efficiency
• Catalysts for Alternate Feedstocks
• Generation 1 and 2 Photovoltaics
• Generation 3 and 4 Photovoltaics
• Solar Thermal/Concentrated Solar Power Technologies
• Ceramic Membranes• Metallic Membranes• Polymeric Membranes• Composite Membranes
• Wear/Tribology• High-Temperature
and Thermal Barrier Coatings
MATERIALS INTEGRATION IN CLEAN ENERGy SySTEMS
Next-GenerationBatteriesandFuelCells
JoiningProcessesforMulti-MaterialStructures
CompositeswithStructuralCapabilities
• Short- Duration Stationary Storage and Conversion
• Long- Duration Stationary Storage and Conversion
• Transportation
• Adhesive Bonding• Solid- State Bonding• Design Data and Testing
• Metal-Matrix Composites and Nanocomposites• Polymer Composites and Nanocomposites• Layered, Sandwich, and Infiltrated Materials
HIGHER-PERFORMANCE MATERIALS
ThermoelectricMaterials
Phase-StableMetallicMaterials SurfaceTreatments LightweightHigh-
StrengthMaterials
• Improved Manufacturing• Higher Figure of Merit
(ZT)• Sealants• Substitute Materials
• Next- Generation Steels• Next- Generation
Nickel-Cobalt• Irradiation-Resistant
Materials• Next- Generation
Zirconium Cladding
• Part Restoration• Surface Processing
• Processing and Synthesis• Hybrid Materials
NEW PARADIGM MATERIALS MANUFACTURING PROCESSES
Net-ShapeProcessing AdditiveManufacturing
Low-CostCompositesManufacturing
Energy-EfficientMetalsProduction
• Solid- State Forming• Powder Metallurgy• Casting
• Metals Manufacturing• Polymer Manufacturing• Direct Writing• Multifunctional
Manufacturing
• Fibers Manufacturing• Composite Matrix
Manufacturing
• Steel Production• Aluminum Production• Recycling• Titanium Processing
MATERIALS AND PROCESS DEVELOPMENT ACCELERATION TOOLS
CollaborativeDatabases
PredictiveModelingofMaterialPerformance
ProcessModelingCodes
IntegratedComputationalMaterialsEngineering(ICME)
• Structural Materials Databases
• Functional Materials Databases
• Deformation and Texture
• Fracture and Fatigue• Materials Degradation
• Microstructural Evolution and Materials Performance
• Materials/Compound Discovery
• Process Manufacturing and Component Performance
• ICME Platforms
Figure1.MapofBreakthroughOpportunitiesforDeliveringSignificantEnergy,Environmental,andEconomicImpacts

4
Figure2.ImpactofR&DPathwaysonEnergySectors
ENERGy GENERATION ENERGy STORAGE ENERGy USE
Solar WInd Biomass Nuclear Oil&Gas Coal Batteries FuelCells IndustrialProcesses Transportation
FUN
CT
ION
AL
SURF
AC
E T
ECH
NO
LOG
IES
Catalysts
SolarMaterials
Gas-SeparatingMembranes
Coatings
MAT
ERIA
LS
I NT
EGRA
TIO
N IN
C
LEA
N E
NER
Gy
SyST
EMS
Next-GenerationBatteriesandFuelCells
JoiningProcessesforMulti-MaterialStructures
CompositeswithStructuralCapabilities
HIG
HER
-PER
FORM
AN
CE
MAT
ERIA
LS
ThermoelectricMaterials
Phase-StableMetallicMaterials
SurfaceTreatments
LightweightHigh-StrengthMaterials
NEW
PA
RAD
IGM
MAT
ERIA
LS
MA
NU
FAC
TU
RIN
G
PRO
CES
SES
Net-ShapeProcessing
AdditiveManufacturing
Low-CostCompositesManufacturing
Energy-EfficientMetalsProduction
5
The IITs identified the energy sectors that could benefit from advancing the selected breakthrough opportunities. Figure 2 summarizes the market potential of the breakthrough opportunities at the R&D pathway level,5 illustrating both the breadth of impact of each R&D pathway across the energy sectors (horizontal) and the potential for materials and processing innovation in individual sectors (vertical).
One of the important aspects of this phase of the study is the additional impact that Materials and Process Development Acceleration Tools can have on facilitating materials development and reducing their time to commercial readiness. Because the impact of these tools is on the MSE R&D process rather than energy applications, the IITs identified the breakthrough opportunities with the greatest potential to benefit the other innovation impact areas. Figure 3 includes the identified Materials and Process Development breakthrough opportunities and the R&D pathways they have the potential to benefit.
ReseARCh pRioRitiesTo realize the impacts that materials and processing innovations have the potential to deliver, the MSE community in the United States, including funding agencies, needs to make a significant, sustained commitment to R&D. Phase III identified R&D activities that can advance materials and processing innovations to commercial readiness in a 2–10 year time frame. Figures 4 through 8 summarize the top-priority R&D activities identified by the IITs in each of the five innovation impact areas. These activities are categorized as near term (0–2 years), mid term (2–5 years), and long term (5–10 years). This comprehensive list shows that many significant, yet focused, R&D efforts are needed to realize the 2–10 year commercial readiness target.
notes1 National Science and Technology Council, Materials Genome Initiative
for Global Competitiveness (Washington, DC: Office of the White House, June 2011) http://www.whitehouse.gov/sites/default/ files/microsites/ostp/materials_genome_initiative-final.pdf.
2 The Minerals, Metals, & Materials Society (TMS) in support of the U.S. Department of Energy Industrial Technologies Program, Linking Transformational Materials and Processing for an Energy-Efficient and Low-Carbon Economy: Creating the Vision and Accelerating Realization. Vision Report of the Energy Materials Blue Ribbon Panel (Washington, DC: TMS, 2010).
3 The Minerals, Metals, & Materials Society (TMS) in support of the U.S. Department of Energy Industrial Technologies Program, Linking Transformational Materials and Processing for an Energy-Efficient and Low-Carbon Economy: Creating the Vision and Accelerating Realization. Opportunity Analysis for Materials Science and Engineering, (Washington, DC: TMS, 2010).
4 The energy sectors addressed in this report are based on the Blue Ribbon Panel’s assessment of the components of the energy sector that will make the largest contributions toward addressing U.S. clean energy and efficiency needs. While other sectors, including energy transmission and energy use in buildings are important to the whole energy industry, the Blue Ribbon Panel did not identify them as sectors in which MSE has the greatest potential to reduce energy and carbon emissions and improve the U.S. economy.
5 The Materials and Process Development Acceleration Tools innovation impact area is discussed separately (see Figure 3) because it affects Functional Surface Technology, Materials Integration in Clean Energy Systems, Higher-Performance Materials, and New Paradigm Materials Manufacturing Processes.

6
Figure3.MaterialsandProcessDevelopmentAccelerationToolswithHighImpactonMaterialsandProcessInnovation
COLLABORATIVE DATABASES
PREDICTIVE MODELING
OF MATERIAL PERFORMANCE
PROCESS MODELING CODES
INTEGRATED COMPUTATIONAL
MATERIALS ENGINEERING
StructuralMaterials
Databases
FunctionalMaterials
Databases
Deformationand
Texture
FractureandFatigue
MaterialsDegradation
Microstructural
EvolutionandMaterials
Performance
Materials/Compound
Discovery
ProcessManufacturing
andComponent
Performance
ICMEPlatforms
F UN
CT
ION
AL
SURF
AC
E T
ECH
NO
LOG
IES Catalysts • • • •
SolarMaterials • • •Gas-SeparatingMembranes • •Coatings • • • •
MAT
ERIA
LS
INT
EGRA
TIO
N IN
CLE
AN
EN
ERG
y Sy
STEM
S
Next-GenerationBatteriesandFuelCells • • • • •JoiningProcessesforMulti-MaterialStructures • • • • • • •CompositeswithStructuralCapabilities • • • • • • •
HIG
HER
-PE
RFO
RMA
NC
E M
ATER
IALS
ThermoelectricMaterials • • • •Phase-StableMetallicMaterials • • • • • • • •SurfaceTreatments • • • • • • •LightweightHigh-StrengthMaterials • • • • • • •
NEW
PA
RAD
IGM
M
ATER
IALS
M
AN
UFA
CT
URI
NG
P R
OC
ESSE
S
Net-ShapeProcessing • • • • •AdditiveManufacturing • • • • • • •Low-CostCompositesManufacturing • •Energy-EfficientMetalsProduction • • • • •

7
Figure4.FunctionalSurfaceTechnologiesR&DPriorityActivities
FUNCTIONAL SURFACE TECHNOLOGIES
NearTerm(0–2Years)
MidTerm(2–5Years)
LongTerm(5–10Years)
CATALYSTS • Integrate catalysis in membranes at the laboratory scale (e.g., via infiltration processes and membrane reactors).
• Integrate catalysis in membranes at larger scale than near-term efforts (e.g., via infiltration process and membrane reactors).
• Conduct predictive modeling and testing of existing catalysts.
• Identify catalysts for alternate feedstocks (more advanced and on a larger scale than near-term work).
SOLARMATERIALS
• Increase efficiency of generation 4 systems via materials substitution.
• Identify replacement materials for indium tin oxide to develop a new thermal conducting oxide with better electrical conductivity and optical transparency.
• Improve the balance of solar systems (e.g., glass, protective coatings, self-cleaning surfaces, and dust/water resistance).
• Bring generation 4 solar applications to market (e.g., solar onboard vehicle paint, recharging stations, and smart-grid interaction).
• Scale existing manufacturing technologies to reduce cost.
GAS-SEPARATINGMEMBRANES
• Develop a fundamental understanding of the trade-off of flux and stability in membrane systems.
• Identify how materials react under real-world conditions (e.g., degradation mechanisms).
• Increase the flux of dense ceramic membranes.
• Identify selectivity issues in polymers to decrease the system thickness.
COATINGS • Leverage materials substitution to create multifunctional coatings that are able to withstand high-wear environments.
• Advance research in sensing/health monitoring to detect defects in coatings and prognostic tools.
• Develop a non-vacuum coating application process.
• Identify key materials for coatings with high temperature stability, high electrical conductivity, and oxidation resistance.

8
Figure5.MaterialsIntegrationinCleanEnergySystemsR&DPriorityActivities
MATERIALS INTEGRATION IN CLEAN ENERGy SySTEMS
NearTerm(0–2Years)
MidTerm(2–5Years)
LongTerm(5–10Years)
NEXT-GENERATIONBATTERIESANDFUELCELLS
• Advance high-speed stacking for lithium-ion batteries so that prismatic cells consisting of layers of electrodes can be manufactured more quickly.
• Develop roll-to-roll vacuum drying and advance water management for lithium-ion cell assembly.
• Develop low-cost fabrication of redox flow battery systems.
• Develop low-cost, mass fabrication of oxide membranes for sodium-sulfur batteries.
• Improve cell formation and grading for lithium-ion cells to decrease the footprint and capital expenditures associated with the need to charge batteries after they are assembled.
• Develop high-speed, 100% inspection, nondestructive evaluation techniques for battery joints (e.g., aluminum and copper), packs, and modules.
• Reduce or eliminate the use of organic solvents (e.g., lithium-ion electrode fabrication).
• Develop new metal or ceramic surfaces with controlled porosity for direct bonding of polymers or elastomers to improve adhesion.
• Reduce the use of inactive materials, expanding beyond thick electrodes.
• Identify processes for functionalizing surfaces for polymer chemical bonding.

9
MATERIALS INTEGRATION IN CLEAN ENERGy SySTEMS
NearTerm(0–2Years)
MidTerm(2–5Years)
LongTerm(5–10Years)
JOININGPROCESSESFORMULTI-MATERIALSTRUCTURES
• Develop low-cost, flexible, mass-production joining processes for multi-material automotive sheet and tubular structures (e.g., aluminum to steel) and develop design data and fatigue data for each joining process.
• Develop joining processes for high-temperature, oxide-dispersion-strengthened materials in extreme environments.
• Fabricate new metal or ceramic surfaces with controlled porosity for direct bonding of polymers or elastomers to improve adhesion of materials.
• Develop processes for producing functional surfaces that can improve the integrity of polymer chemical bonding.
• Develop low-cost (50% cost reduction) surface adhesives (e.g., prepolymers, epoxies, ultraviolet cure, thermal cure, and laser cure) that are not sensitive to substrate contamination.
• Measure and analyze post-weld heat treatment properties and residual stresses in solid-state friction stir welding in real time and after processing.
• Develop an integrated computational materials engineering process model for solid-solid joining that incorporates residual stress, diffusion, microstructure evolution, and mechanical properties and interlayers.
• Develop high-speed and reliable nondestructive evaluation techniques to evaluate bond quality in similar and dissimilar materials.
• Develop low-cost, mass-production joining processes for multi-material automotive sheet and tubular structures (e.g., steel with composites, aluminum, or magnesium).

10
MATERIALS INTEGRATION IN CLEAN ENERGy SySTEMS
NearTerm(0–2Years)
MidTerm(2–5Years)
LongTerm(5–10Years)
COMPOSITESWITHSTRUCTURALCAPABILITIES
• Identify and deploy joining and oxidation-protection approaches that could be used to integrate refractory metal plates, foils, or sheets as the outer face of sandwich structures.
• Develop low-cost, in-situ fabrication of metal-matrix nanocomposites, including casting and powder metallurgy techniques.
• Establish manufacturing processes and design criteria to enable low-cost, high-volume continuous fiber polymer composites for transportation lightweighting.
• Discover high-performance polymers or polymer composites with higher thermal gradient and/or lower creep at elevated temperatures to substitute for metals.
• Identify out-of-autoclave curing technologies (e.g., selective heating by microwave or radio frequency, cold processing by electron beam curing) to reduce curing times.
• Conduct high-temperature evaluation of metal-matrix composites, metal-matrix nanocomposites, and layered materials.

11
Figure6.Higher-PerformanceMaterialsR&DPriorityActivities
HIGHER-PERFORMANCE MATERIALS
NearTerm(0–2Years)
MidTerm(2–5Years)
LongTerm(5–10Years)
THERMOELECTRICMATERIALS
• Develop a range of thermoelectric polymers to enable wide-scale application of weight-optimized components for use in defense, automotive, and commercial applications.
• Develop highly conductive thermoelectric materials compatible with additive manufacturing systems to enable corrosion-resistant, highly functional polymer designs for multifunctional components with structurally integrated power and communication circuits.
• Develop capacitance materials compatible with additive manufacturing methods to enable structurally integrated electrical energy storage systems.
• Develop an oxidation barrier coating for thermoelectric materials operating at 1,000°C.
PHASE-STABLEMETALLICMATERIALS
• Create high-strength, low-alloy steel for ultra-deep-well drilling.
• Develop corrosion-resistant zirconium alloys with reduced hydrogen pickup.
• Develop stress-corrosion-cracking-resistant stainless steel variants (e.g., AISI 304 and 316 steels) for reactor applications.
• Develop 1,200°F steels for use in power plant steam turbines.
• Develop irradiation-resistant pressure vessel steels (e.g., A508 and A533 steels).
• Create physics-based models to predict component lifetime in power plants.
• Identify alternate fuel cladding materials (e.g., silicon carbide metal-matrix composites).
• Develop oxidation- and corrosion-resistant refractory alloys for next-generation gas turbines.
• Develop a materials database to enable more accurate computational design.
• Use new phase diagrams to create more accurate thermomechanical processing and heat treating of steels.
SURFACETREATMENTS
• Create a user test facility for remanufactured parts testing.
• Develop lower-cost coating materials that are validated for use and have appropriate cost-performance specifications, rather than overdesigning coatings as happens today.
• Develop low-cost laser hybrid processing that can metallurgically bond surface layers.
• Conduct highly accurate non-planar or larger-scale surface treating without damaging substrates (e.g., laser, high-density infrared, high-precision hybrid deposition).
• Develop ceramics for gas turbine parts (e.g., air foils).
• Develop ultra-high-temperature (~1,600°F) thermal barrier coatings for oxy-combustion turbines.

12
HIGHER-PERFORMANCE MATERIALS
NearTerm(0–2Years)
MidTerm(2–5Years)
LongTerm(5–10Years)
LIGHTWEIGHTHIGH-STRENGTHMATERIALS
• Develop low-cost, improved processing methods of aluminum-, magnesium-, and metal-based composites for casting.
• Improve wear resistance via a gradient-type approach or surface treatment of aluminum, magnesium, and other lightweight, high-strength materials.
• Identify top transportation opportunities for custom optimized hybrid/gradient metallic systems.
• Develop new alloy designs with higher alloy retention for better recyclability.
• Improve damage detection techniques for defects and mechanical reliability of all types of material systems.
• Increase corrosion resistance of aluminum or magnesium via surface treatment and/or alloying approaches.

13
Figure7.NewParadigmManufacturingProcessesR&DPriorityActivities
NEW PARADIGM MANUFACTURING PROCESSES
NearTerm(0–2Years)
MidTerm(2–5Years)
LongTerm(5–10Years)
NET-SHAPEPROCESSING
• Use innovative joining methods to improve dimensional control and enable forged and formed components to replace machined components and assemblies (fits all time ranges because this is an ongoing effort).
• Increase closed-loop spring-back control and strain-distribution control for high-strength sheet metal components.
• Improve room-temperature formability of magnesium, titanium, and aluminum sheet metals by controlling crystallographic texture.
• Develop new nanomaterials (e.g., tooling and bearings) using spark plasma sintering techniques.
• Develop a process for direct consolidation of titanium powder into tubular and structural shapes.
• Develop and commercialize a process for high-property, thin-walled, complex light metal castings.
• Develop a metal casting technique that uses a high magnetic field to achieve wrought properties and improved yield.
• Develop multi-material processing techniques.
• Use innovative joining methods to improve dimensional control and enable forged and formed components to replace machined components and assemblies (fits all time ranges because this is an ongoing effort).
• Develop processes that simultaneously improve both shape and material properties (e.g., variations of hot stamping, peen forming, and temperature-controlled stamping).
• Use innovative joining methods to improve dimensional control and enable forged and formed components to replace machined components and assemblies (fits all time ranges because this is an ongoing effort).

14
NEW PARADIGM MANUFACTURING PROCESSES
NearTerm(0–2Years)
MidTerm(2–5Years)
LongTerm(5–10Years)
ADDITIVEMANUFACTURING
• Develop and advance automated spark plasma sintering techniques for the production of metal-matrix composites (e.g., silicon carbide, silicon nitride, tungsten carbide).
• Develop closed-loop hardware/software to provide Ti-6Al-4V (titanium-aluminum-vanadium) material/part traceability for quality standards, thus improving yield numbers.
• Develop families of polymer compounds with nano-fillers that are compatible with additive manufacturing processes to create a wide spectrum of material properties.
• Develop new inks and slurries for direct writing systems (fits all time ranges because this is an ongoing effort).
• Set up additive manufacturing stations or areas for regional economic zones to lower shipping costs.
• Develop a continuous process for titanium metal production, preferably in powder form.
• Develop methods to increase throughput of additive manufacturing systems while increasing accuracy and in-situ process monitoring.
• Develop new inks and slurries for direct writing systems (e.g., silver and copper inks) (fits all time ranges because this is an ongoing effort).
• Create an alternative file format to “.stl” to enable multi-material fabrication in a monolithic piece; less energy-intensive materials may be used functionally in place of a single energy-intensive material.
• Develop larger chambers or multi-heads for direct metal deposition processes.
• Develop a system for sensing and controlling surface quality and residual stresses.
• Develop large-scale printed energy storage batteries and capacitors (e.g., ones that may be used for wind farms).
• Develop new inks and slurries for direct writing systems (fits all time ranges because this is an ongoing effort).
• Create a residual stress analytical modeling system for non-vacuum-based additive manufactured systems; this will help predict residual stress or distortion of direct parts to increase yield numbers and increase part robustness.
• Develop additive system techniques to integrate additive manufacturing systems seamlessly.
LOW-COSTCOMPOSITESMANUFACTURING
• Develop new autoclave-free continuous processes (e.g., automation of fiber lay-up in resin transfer molding and vacuum-assisted resin transfer molding) that ensure accurate shape and orientation of polymer-matrix composites.
• Develop automated panel lay-up forming to achieve a high production rate.
• Create fiber manufacturing processes that require less energy to create the final product.
• Develop a high-volume production technology to reduce production cycle times.
• Develop low-cost fiber feedstocks (e.g., by reducing energy input in fiber production or developing alternate precursors to pitch and polyacrylonitrile for carbon fibers).
15
NEW PARADIGM MANUFACTURING PROCESSES
NearTerm(0–2Years)
MidTerm(2–5Years)
LongTerm(5–10Years)
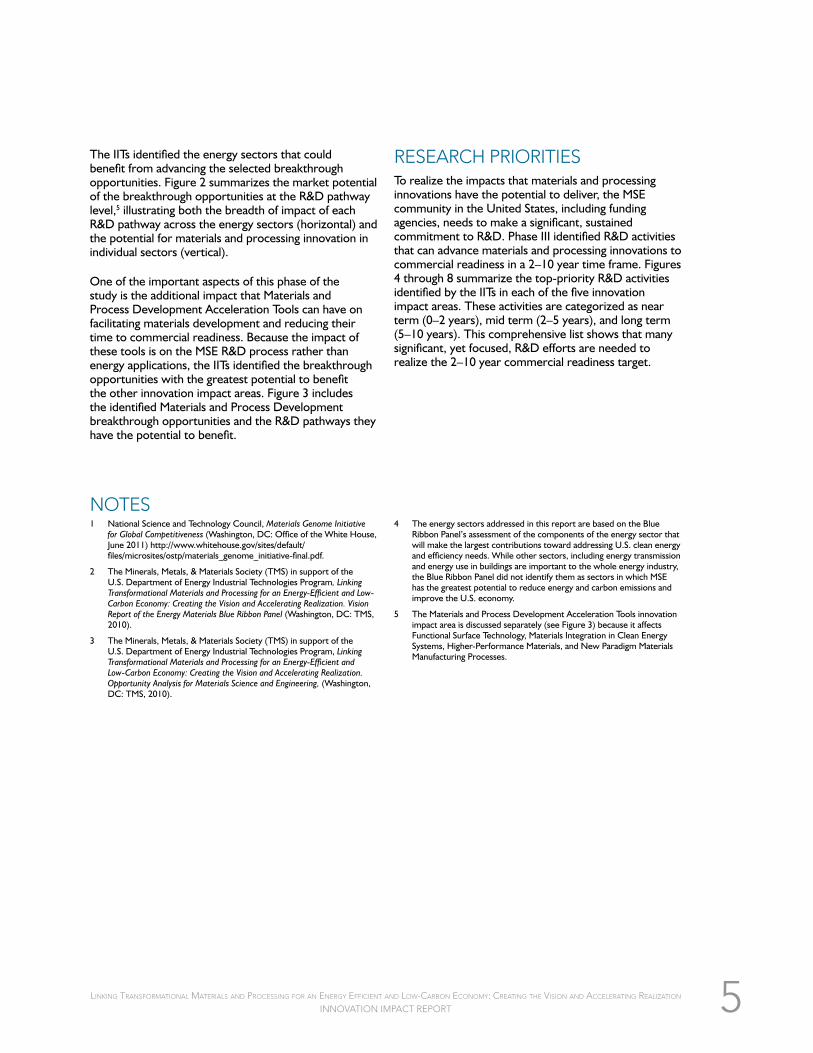
ENERGY-EFFICIENTMETALSPRODUCTION
• Improve instrumentation for aluminum reduction cells, leading to better process control.
• Develop new electrode materials for aluminum reduction cells.
• Develop a continuous process for titanium metal production, preferably in powder form.
• Develop a titanium molten metal delivery system (i.e., closed-coupled gas atomization) to lower the cost of production via a high-performance continuous process.
• Develop a process for the direct reduction of iron ore using an electrolytic hydrogen or other non-carbon-reduction process.
• Develop novel electrochemistry processes for the production of aluminum and/or magnesium (e.g., lower-temperature ionic liquids).
• Develop a continuous casting process for high-end alloys (e.g., titanium and nickel).
• Advance scaling of melt facilities to increase product yield.
• Develop a low-cost, high-property magnesium system for high-volume casting or sheet production.
• Optimize the yield, use, and scale of vacuum-arc remelting and electroslag melting of high-end metals (e.g., iron, nickel, titanium); high-end alloys usually need multiple melting cycles.

16
Figure8.MaterialsandProcessDevelopmentAccelerationToolsR&DPriorityActivities
MATERIALS AND PROCESS DEVELOPMENT AND ACCELERATION TOOLS
NearTerm(0–2Years)
MidTerm(2–5Years)
LongTerm(5–10Years)
COLLABORATIVEDATABASES
• Establish fundamental databases for epoxy resin design and other polymers and for advanced metallics and composites systems.
• Add topology/structure to databases and include a search function.
• Establish a database for nanoparticle synthesis that may be used for catalysis-based work.
• Establish basic databases/infrastructure for photovoltaics, thermoelectrics, and fuel cells.
• Enhance coatings and substrates databases intended for descriptive and predictive modeling.
PREDICTIVEMODELINGOFMATERIALPERFORMANCE
• Create a statistical representation of microstructural evolution in codes for the prediction of material performance.
• Develop a coatings “degradation predictor” for energy technologies.
• Develop practical and computationally efficient approaches in coupling multiphysics and multi-scale modeling of materials performance.
• Establish probabilistic strategies for extending part life that account for microstructural variances.
• Improve the coupling of CALPHAD-type (CALculation of PHAse Diagrams) databases into corrosion models and irradiation-damage models.

17
MATERIALS AND PROCESS DEVELOPMENT AND ACCELERATION TOOLS
NearTerm(0–2Years)
MidTerm(2–5Years)
LongTerm(5–10Years)
PROCESSMODELINGCODES
• Develop physics-based material constitutive models with integrated experimentation and data generation for multi-axial straining (over a broad range of strain rates, temperatures, etc.) for metals and polymers. In addition, combine such models with interfacial constitutive models when deformation involves contact (e.g., tool/workpiece interface).
• Develop the ability to model compounds of polymers and metals with nano-fillers.
• Integrate models and databases for welding and joining issues of dissimilar materials.
• Create multi-scale codes that link density functional theory and kinetic Monte Carlo codes for microstructural evolution.
• Develop methods to analyze finite element predictive performance for unique additive manufacturing internal structures.
• Introduce composition-dependent models and data into higher-level process modeling codes for casting, deformation, etc.
INTEGRATEDCOMPUTATIONALMATERIALSENGINEERING
• Develop a high-profile ICME example to show its applicability to energy problems (e.g., fuel cells, batteries, heat exchangers, or wind turbines).
• Advance and accelerate the qualification of high-temperature alloys.
• Introduce materials design for novel joinability (e.g., automobile industry spot welding).
• Advance materials design for additive manufacturing of magnesium and transformation-induced plasticity steels.
• Integrate models and databases for welding and joining issues of dissimilar materials.
• Develop inverse methodologies for materials design.
• Develop concurrent design of a material and its applicable component within an energy sector.

18
To prepare this report, The Minerals, Metals, & Materials Society (TMS) convened five innovation impact teams (IITs) consisting of materials
experts from academia, industry, and government in five innovation impact areas identified in earlier phases of this project. Each IIT met several times via phone and conducted independent analyses to identify the materials science and engineering breakthrough opportunities that hold the greatest promise for delivering significant energy, environmental, and economic impacts in the 2–10 year time frame. A significant part of this work required IIT members to investigate and document historical material systems improvements. This historical data provided a basis for later discussions on the projected improvements in materials performance.
Following the initial teleconferences and independent research, each team met for a one-and-a-half day working meeting at TMS headquarters to share information, discuss, debate, and ultimately come to consensus regarding the possible breakthrough opportunities, the energy sectors that would benefit from these advances, and the research and development (R&D) priority activities needed to realize these gains. After each workshop, the IIT members continued to share information and refine their work, culminating in this report.
Another important aspect of the process used to create this report was analysis conducted by Energetics Incorporated to quantify the energy savings and emissions reductions that could be realized via the successful commercialization of new material
i. pRoCess oveRview
systems. These market opportunity analyses examined specific energy sectors likely to be impacted by the breakthrough opportunities, such as transportation or solar power, and estimated the magnitude of energy consumed and carbon dioxide (CO2) emissions produced, thereby framing the potential market impact of each breakthrough opportunity. Because these market opportunity analyses required quantifiable information, the highlighted market opportunities for each R&D pathway may not be the opportunities with the greatest potential, but rather the opportunities with available market data. Each market opportunity analysis quantifies some portion of the potential impact of each R&D pathway, providing justification for pursuing the breakthrough opportunities in the respective pathways. The analysis intentionally stops short of predicting the energy savings and emissions reductions for individual breakthrough opportunities because of the high degree of uncertainty in such predictions.
bReAkthRough oppoRtunities: A CloseR look The work of the IITs culminated in detailed discussions of each breakthrough opportunity, which compose the majority of this report. Each breakthrough opportunity is represented by one dedicated page that includes the background, gaps and limitations, potential energy market impact areas, historical trends, and expected advances of each breakthrough opportunity. The template used to provide this information is explained in Figure 9.

19
Figure9.TemplateforBreakthroughOpportunities
R&D Pathway
Breakthrough Opportunity
desCRiptionBreakthrough opportunities are areas in which there is great potential for innovative progress toward a cleaner, more energy-efficient future. A breakthrough opportunity includes technologies that share common characteristics, limitations, trends, and market ties. In this section, each breakthrough opportunity is defined to reflect its importance within the R&D pathway and provide context for describing historical trends and future opportunities.
gAps And liMitAtions to oveRCoMeCertain processes, operations, and technologies have limitations or restrictions that may inhibit a breakthrough opportunity’s market potential. Some of these technological gaps can be surmounted, while others are limited by the laws of physics, requiring new approaches in order to advance the opportunity. Recognizing these boundaries helps define the path forward for realizing a breakthrough opportunity, resulting in new or improved technologies with increased efficiency, decreased carbon emissions, and economic savings.
Market Impact
Each breakthrough opportunity has an influence on certain energy generation, storage, and use sectors. The highlighted icons demonstrate the sectors that will benefit as advances are made in each breakthrough opportunity. The measurable impact on some of these sectors is provided in the market opportunities analyses included in each R&D pathway.
Historical Trends and Future Opportunities
Studying the recent history and current progress of a breakthrough opportunity helps to visualize technological progress and define a path toward realizing its potential impact on energy sectors.
This section provides a visual, where applicable, to illustrate the consensus of the IITs on the historical trends and expected advances in each breakthrough opportunity. The historical trends typically summarize the advances achieved over the past 10–20 years, unless the IITs thought a different time range better represented the advances. The projected advances are usually for the next 5–10 years, coinciding with the near-term potential (2–10 years) for commercial readiness.
Generally, the projected percent improvements assume a level R&D funding environment. The IITs approached this question from the basis of technical possibility, rather than scenarios for how the percent improvements would change given an increase or decrease in funding.
This sidebar provides a textual overview of the historical trends and future potential of a breakthrough opportunity, describing the visual portrayal to the left.

20
New and emerging energy systems require material surfaces that can effectively interact with service environments and withstand
demanding operating conditions. As U.S. demand increases for energy-efficient, cost-effective energy systems with reduced carbon dioxide (CO2) emissions, the materials within these systems must serve functions that extend beyond the structure of the system. Materials that can serve specific functions, such as facilitating chemical reactions, capturing photons, and separating gases, can optimize the contributions of each material to the system.
Functional surface technologies that harvest energy and produce higher product yields can increase the efficiency and lower the cost of energy systems. These process innovations can ultimately reduce the environmental impact, cost, and energy requirements of energy generation, storage, and use across U.S. energy sectors, particularly in industrial processes, transportation technologies, and oil and coal energy systems.
The following pathways provide a guide for research and development (R&D) in the area of functional surface technologies:
• Catalysts
• Solar Materials
• Gas-Separating Membranes
• Coatings
CAtAlystsCatalysts are important enabling technologies for many energy systems and an integral part of the production of more than 90% of all industrial chemicals,1 including ammonia and methanol. Catalysts use functional surfaces to speed up or enable chemical reactions and therefore lower the amount of energy required. Increasing the selectivity and conversion efficiency of catalysts can improve industrial processes and manufacturing by effectively boosting the yield of chemical production. As a result, materials science and engineering (MSE) advances in this area can increase the cost-effectiveness and reduce the environmental impact and energy requirements of energy generation, storage, and use. Opportunities in industrial processes and oil and gas sectors provide a quantifiable justification for pursuing R&D of catalysts.
Market Opportunity: Industrial Processes
The chemicals industry consumes more than 3,000 trillion British thermal units (TBtu) of onsite energy per year,2 of which 104 TBtu of energy is estimated to be lost from catalyst non-selectivity in 42 high-volume production petrochemical processes.3 Advanced high-volume catalysts with increased selectivity can reduce these losses by requiring less process heating fuel for catalysis, which will increase energy efficiency and reduce CO2 emissions and fuel costs. For example, reducing catalyst selectivity losses by 25% would save 26 TBtu of energy,4 2 million metric tons (MMT) of CO2,
5 and $331 million in fuel costs each year.6
Market Opportunity: Oil and Gas
Natural gas can be converted to a liquid fuel through gas-to-liquids processes involving either direct conversion or the production of an intermediate synthesis gas followed by Fischer-Tropsch (FT) synthesis. Catalytic reactions synthesize the liquefied fuel from the intermediate synthesis gas (carbon monoxide and hydrogen) produced during the FT stage of the gas-to-liquids conversion process.7 Because this process is currently energy-intensive and costly, natural gas flaring is often used to dispose of unwanted gas that cannot be transported because of limited natural gas transport mechanisms. An economically viable gas-to-liquids process enabled by the development and manufacturing of advanced catalyst materials can eliminate some of the 2.1 billion cubic meters (bcm) of natural gas that is flared and vented in the United States each year,8 resulting in energy savings and reduced CO2 emissions and fuel costs. For example, eliminating 10% of natural gas flaring (0.21 bcm) through the increased use of gas-to-liquids processing would save 8 TBtu of energy,9 0.4 MMT of CO2 emissions,10 and $15 million in fuel costs each year.11
Breakthrough Opportunities
The MSE community can advance catalysts by developing and improving catalysts with high selectivity and conversion efficiency and catalysts for alternate feedstocks. Addressing the gaps and limitations specific to each of these breakthrough opportunities will allow catalysts to make significant contributions toward addressing energy, environmental, and economic needs.
iii. funCtionAl suRfACe teChnologies

21
Catalysts
Catalysts with High Selectivity and Conversion Efficiency
The production of almost all industrially important chemicals, such as ammonia, involves catalysts. Catalytic processes yield products at a relatively constant rate over the life of a catalyst. However, as the catalyst ages, its reaction temperature increases, resulting in an increase in activity but a decrease in selectivity and conversion efficiency. The catalyst will remain in use until the selectivity is unacceptably low, which may occur after a couple of years. Advanced catalysts with higher initial selectivity and conversion efficiency will enable more efficient surface catalysis reactions and more cost-effective manufacturing by increasing product yield over a catalyst’s usable life.
gAps And liMitAtions to oveRCoMe• Many advanced catalysts have inadequate mechanical stability
and/or resistance to contamination, which limits their efficiency, lifetime, and range of application.
• Certain catalysts (e.g., catalysts for ammonia synthesis) have insufficient low-temperature reactivity.
• Materials scientists lack adequate understanding and capabilities for predicting the reactive properties of new catalysts, and therefore require a trial-and-error approach to identifying new catalysts.
• Microscopic analysis capabilities are inadequate, preventing materials scientists from fully characterizing catalyst surfaces and defects and distinguishing the relative reactivity of various geometric regions of the catalyst structure (e.g., crystal surfaces in comparison to terraces).
Market Impact
Historical Trends and Future Opportunities
seleCtivity of ethylene oXide CAtAlysts
92
90
88
86
84
82
80
78
2000 2011 2020
SELE
CT
IVIT
Y (
%)
Ethylene oxide is representative of high-selectivity catalysts. Selectivity of ethylene oxide has increased from 83% to 87% in the past 10 years. With advances in unique nanotechnology catalyst structures, the selectivity and yield of this catalyst is expected to continue to improve at an average of 4% per decade, increasing to 91% in the next 10 years.12
Selectivity
• 2000: 83%
• 2011: 87%
• 2020: 91%

22
Catalysts
Catalysts for Alternate Feedstocks
Advanced catalysts that convert alternate feedstocks can create fuels that have the potential to compete with natural gas and petroleum for the production of commodity chemicals. Coal and biomass are two alternate feedstocks that require biocatalysis—the selective formation of products using enzymes—to become more attractive fuel options. The successful development and implementation of a novel biocatalytic process requires a suitable biocatalyst, methods for enzyme stabilization to ease its application and reuse, process engineering to select an appropriate reaction system (e.g., aqueous or solvent system, batch or continuous, packed-bed or membrane reactor), and upstream and downstream processing.13
gAps And liMitAtions to oveRCoMe• It is cost-intensive to advance catalysts for alternate feedstocks with
acceptable selectivity and resistance to denaturing.
• Catalysts that operate on alternate feedstocks are subject to accelerated aging with frequent switching between feedstocks.
• Alternate feedstocks typically contain contaminants that can severely accelerate the aging of relevant catalysts. Mineral pretreatments need major advances to reduce these contaminants.
Market Impact
Historical Trends and Future Opportunities
seleCtivity of CAtAlysts foR pRoduCtion of AlteRnAte feedstoCks
92
90
88
86
84
82
80
78
2000 2011 2020
SELE
CT
IVIT
Y (
%)
Catalysts with increased selectivity can decrease the consumption of water, materials, and energy during alternate feedstock conversion, as well as the dispersion of toxins and pollutants. Historically, selectivity of catalysts for alternate feedstocks has increased by about 4% per decade, the same rate as ethylene oxide catalysts. This rate of selectivity improvement is expected to continue for the next 10 years.14
Selectivity
• 2000: 83%
• 2011: 87%
• 2020: 91%

23
R&D Priority Activities: Catalysts
To overcome the gaps and limitations within the catalyst breakthrough opportunities, the MSE community must focus their efforts on identifying catalysts for use with alternate feedstocks, integrating catalytsts into membranes, and pursuing other R&D activities provided
in the following table. The table divides the priority activities for each research initiative by the time frame in which they are estimated to impact U.S. energy sectors: near term (0–2 years), mid term (2–5 years), and long term (5–10 years).
NEAR TERM (0–2 yEARS)
CatalystsforAlternateFeedstocks• Identify promising concepts for alternate feedstock catalysts (e.g., biofuels, alkenes, and olefins)
at the laboratory scale.
Crosscutting•Integratecatalysisinmembranesatthelaboratoryscale(e.g.,viainfiltrationprocessesandmembranereactors).
• Conduct active site modeling of existing catalysts (e.g., nanoparticle thermo-stability, catalyst regeneration, and oxygen production/replacement via redox reactions).
MID TERM (2–5 yEARS)
Crosscutting•Integratecatalysisinmembranesatlargerscalethannear-termefforts(e.g.,viainfiltrationprocessandmembranereactors).
•Conductpredictivemodelingandtestingofexistingcatalysts.• Develop multifunctional/multi-site catalysts or systems with multiple catalysts.
LONG TERM (5–10 yEARS)
CatalystsforAlternateFeedstocks•Identifycatalystsforalternatefeedstocks(moreadvancedandonalargerscalethannear-termwork).
Crosscutting• Develop infiltration process for membrane with stacks (large-scale work).• Develop a membrane reactor for propane dehydrogenation at low operating temperatures
(500°C–600°C).
*The experts identified the boldedactivities as high priority.
solAR MAteRiAlsSolar materials—such as photovoltaics (PVs) (e.g., silicon, cadmium telluride, copper indium gallium selenide), encapsulants, and conductive oxides—work together to absorb photons and convert them to electrical energy. However, current solar materials are only able to absorb a narrow range of solar energies from the broad solar spectrum (low-energy infrared to high-energy and ultraviolet), leaving photons of lower ranges unabsorbed while photons of higher ranges are absorbed and mostly lost as heat. Increasing the absorption range and conversion efficiency of solar materials can reduce the cost of these materials and expand the contributions of renewable solar energy to U.S. electricity generation.
Market Opportunity: Electricity Generation
Solar energy is a renewable energy source that can decrease U.S. reliance on imported fossil fuels for electricity generation while also lowering CO2 emissions. In 2010, of the nearly 40,000 TBtu of energy consumed by the electric power sector, about two-thirds of this energy
(27,028 TBtu) was derived from fossil fuels.15 By displacing a portion of fossil fuel consumption, solar energy can also reduce CO2 emissions and fuel costs. If solar energy gained a 1% market share of U.S. electric power sector electricity production (compared to current U.S. net electricity production from solar of 0.1% from all sectors, a generation capacity of 2.6 gigawatts),16 it could displace 396 TBtu of conventional electricity generation,17 decrease CO2 emissions by 23 MMT,18 and reduce fuel costs to investor-owned utilities (which represent only a portion of U.S. power producers) by $402 million per year.19
Breakthrough Opportunities
The MSE community can advance solar materials by focusing on generation 1 and 2 PVs, generation 3 and 4 PVs, and thermal/concentrated solar power technologies. Addressing the gaps and limitations specific to each of these breakthrough opportunities will allow solar materials to make significant contributions toward addressing energy, environmental, and economic needs.

24
Solar Materials
Generation 1 and 2 Photovoltaics
Photovoltaics are based on a principle known as the photoelectric effect, which involves the conversion of solar radiation into electricity using semiconductors. Generation 1 PVs are single-junction amorphous silicon cells, and generation 2 PVs refer to thin-film cadmium telluride (CdTe) or copper indium gallium selenide (CIGS) cells. Photovoltaic systems continue to increase in efficiency through laboratory-scale testing and advances in processing techniques, which can also lower the cost of production and make these PVs cost-competitive.
gAps And liMitAtions to oveRCoMe• There is a lack of knowledge about and an inability to manipulate
the interface between the PV dye molecule and the PV surface to minimize energy loss.
• Solar PV surfaces lack self-cleaning or contaminant-resistant layers, which are necessary to increase system efficiency.
• The high costs of solar PV production and installation reduce the business case for building owners and limit wide-scale PV distribution.
• PV production defects lower the efficiency of PV systems, necessitating improvements in the production process.
Market Impact
Historical Trends and Future Opportunities
effiCienCy of geneRAtion 2 pv MAteRiAls
25
20
15
10
5
0
~1990
CIGS CdTe
2011 2015–2020
OV
ERA
LL U
SE E
FFIC
IEN
CY
(%
)
Over the past 20 years, first- and second-generation PVs have undergone processing and manufacturing changes, and new and alternative materials have been integrated into PV systems. As a result, the efficiency—the ratio of electricity generated to sunlight captured—of CIGS cells has increased by about 5% and the efficiency of CdTe cells has increased by 3%, making today’s commercial CIGS cells about 19% efficient and CdTe cells about 17% efficient. With further advancements, efficiency is expected to increase by 3% in the next 5–10 years for each technology.20
Use Efficiency
• ~1990: 14% for both cells• 2011: 19% for CIGs,
17% for CdTe• 2015–2020: 22% for CIGs,
20% for CdTe

25
Solar Materials
Generation 3 and 4 Photovoltaics
Photovoltaics are based on a principle known as the photoelectric effect, which involves the conversion of solar radiation into electricity using semiconductors. Generation 3 and 4 PVs have stacked, thin single-junction cells, also known as tandem or multijunction cells, with several band gaps to capture more wavelengths of light and increase efficiency. These PVs are still undergoing laboratory testing but have the potential to offer significantly higher efficiencies than Generation 1 and 2 PVs.
gAps And liMitAtions to oveRCoMe• Materials scientists have little control of the band gap of PV
materials, particularly oxide semiconductors, to optimize capture of the solar spectrum.
• Materials scientists have not yet been able to optimize PV power output, which increases as visible light bandwidth increases. Most light escapes because low-energy photons do not have enough energy to excite PV electron-hole pairs across the energy gap. High-energy photons excite PV electron pairs with energy above the gap, resulting in lost heat energy rather than usable electrical energy.
• There is a lack of knowledge about and an inability to manipulate the interface between the PV dye molecule and the PV surface to minimize energy loss.
• Solar PV surfaces lack self-cleaning or contaminant-resistant layers, which are necessary to increase system efficiency.
• The high costs of solar PV production and installation reduce the technology confidence of building owners and limit widespread PV distribution.
• PV production defects lower the efficiency of PV systems, necessitating improvements in the production process.
Market Impact
Historical Trends and Future Opportunities
effiCienCy of geneRAtion 3 And 4 pv MAteRiAls
45
40
35
30
25
20
15
10
5
02005 2011 2020
OV
ERA
LL U
SE E
FFIC
IEN
CY
(%
)
While generation 3 and 4 PVs are still under laboratory development, their efficiency—the ratio of electricity generated to sunlight captured—has already increased from 34% to 37% since 2005. In the next 10 years, advances in manufacturing methods and materials properties are expected to yield a 4% increase in the efficiency of generation 3 and 4 PVs. The most advanced solar cell efficiencies are already approaching 40% in laboratories.21
Use Efficiency
• 2005: 34%• 2011: 37%• 2020: 41%

26
Solar Materials
Solar Thermal / Concentrated Solar Power Technologies
Concentrated solar power (CSP) technologies use mirrors to redirect sunlight for use as a heat source in power plants or to provide industrial process heating or cooling. The four types of CSP systems are parabolic trough, parabolic dish/engine, power tower, and linear Fresnel receivers. Parabolic troughs use circular-arc mirrors to focus sunlight inward on a long tube containing a moving fluid that captures heat. Parabolic dishes/engines focus light onto a closed cylinder with a piston that moves as gas is expanded by high temperatures. Power towers are central receiver systems raised high above the ground that contain a moving fluid that is heated by sunlight reflected by multiple surrounding mirrors. Linear Fresnels use special lenses to focus sunlight onto a fixed absorber at common focal points.
gAps And liMitAtions to oveRCoMe• CSP mirror surfaces lack self-cleaning or contaminant-resistant
layers, which lowers system efficiency from contaminant exposure.
• CSP systems have a poor ability to store excess thermal and electrical energy.
Market Impact
Historical Trends and Future Opportunities
oveRview of Csp teChnology effiCienCies, lAnd oCCupAnCy, And futuRe outlook
The current state and expected advances of the four types of CSP systems are described to the left. Technology advances are under development that will enable CSP to boost electricity production and reduce costs, notably by achieving higher temperatures that bring greater efficiency.
Other technologies now under development will enable the production of liquid or gaseous fuels by concentrating solar energy. With concerted effort, these milestones can be achieved in the next 2–5 years.22
TechnologyAnnualSolar-to-ElectricEfficiency
LandOccupancy
OutlookforImprovements
Parabolic Troughs 15% Large Limited
Parabolic Dishes 25%–30% Small Through Mass
Production
Towers (central receiver systems)
20%–35% Medium Very Significant
Linear Fresnel Receivers 8%–10% Medium Significant

27
R&D Priority Activities: Solar Materials
To overcome the gaps and limitations within the solar materials breakthrough opportunities, the MSE community must focus their efforts on increasing the efficiency of solar materials, lowering their cost, and pursuing other R&D activities provided in the
following table. The table divides the priority activities for each research initiative by the time frame in which they are estimated to impact U.S. energy sectors: near term (0–2 years), mid term (2–5 years), and long term (5–10 years).
NEAR TERM (0–2 yEARS)
Generation3and4Photovoltaics• Increaseefficiencyofgeneration4systemsviamaterialssubstitution.
AllPhotovoltaics• Develop alternative processing techniques to lower production costs of CIGS and CdTe.• Advance encapsulant characteristics (e.g., stability, performance degradation, life extension,
durability, and temperature fluctuations).
MID TERM (2–5 yEARS)
Generation1and2Photovoltaics• Identify new materials for CIGS/CdTe to reduce cost and increase efficiency (e.g., toxicity
assessment, multijunction devices).
Generation3and4Photovoltaics• Identifyreplacementmaterialsforindiumtinoxidetodevelopanewthermalconductingoxidewithbetterelectricalconductivityandopticaltransparency.
AllPhotovoltaics• Advance research in PVs for building integration.
SolarThermal/ConcentratedSolarPowerTechnologies• Identify materials needs for general electrical collection and storage (e.g., increasing the
thermal conductivity and fluid heat capacity and increasing the heat transfer coefficient of collecting tube fluid).
Crosscutting• Improvethebalanceofsolarsystems(e.g.,glass,protectivecoatings,self-cleaningsurfaces,anddust/waterresistance).
LONG TERM (5–10 yEARS)
Generation3and4Photovoltaics• Bringgeneration4solarapplicationstomarket(e.g.,solaronboardvehiclepaint,rechargingstations,andsmart-gridinteraction).
AllPhotovoltaics• Scaleexistingmanufacturingtechnologiestoreducecost.
*The experts identified the boldedactivities as high priority.

28
gAs-sepARAting MeMbRAnesGas-separating membranes23 can be significantly more energy efficient than other gas-separation methods, including absorption/adsorption, distillation, and cryogenics. Unlike these traditional processes, membranes often do not require energy-intensive phase changes of the gas being separated. Improving membrane processing, reducing maintenance requirements, optimizing selectivity and membrane surface-to-volume ratio, and increasing the ability to retrofit membranes in existing systems could increase energy efficiency and reduce costs in energy sectors. Opportunities for carbon capture in electricity generation and industrial processes in the chemicals, petrochemicals, and forest products industries provide a quantifiable justification for pursuing R&D of gas-separating membranes.
Market Opportunity: Electricity Generation
In 2010, the total U.S. energy consumption for electricity generation by the electric power sector was 39,579 TBtu;24 of this consumption, 19,133 TBtu was from coal.25 Advanced membranes with increased flux can have a significant role in carbon capture, addressing intrinsic challenges such as efficiently separating CO2 from nitrogen given their similar molecule sizes (0.33 nanometers [nm] and 0.36 nm, respectively) and the tendency for CO2 molecules to move through membranes relatively slowly.26 For example, if advanced membrane-enabled carbon capture technology reduced CO2 emissions from coal-fired power plants by 10%, it could decrease CO2 emissions by more than 180 MMT.27 In addition to their use for carbon capture, advanced membranes can enable
more efficient separation of oxygen and hydrogen, which can lower energy penalties in new power plants and coal plant retrofits while also reducing energy use, CO2 emissions, and fuel costs.
Market Opportunity: Industrial Processes
Gas separation in industrial processes, including the production of oxygen, nitrogen, hydrogen, and carbon monoxide, is energy-intensive. Gas-separating membranes can help reduce some portion of the total 4,519 TBtu of energy consumed by the chemicals sector and the resulting 275 MMT of CO2 emissions.28
Specifically, the chemicals and allied products industry consumes about 2,600 TBtu each year for separation processes.29 According to a study by Lawrence Berkeley National Laboratory, the use of membrane technologies instead of existing separation processes requires 30% less energy.30 The integration of gas-separating membranes in the chemicals and allied products industry has the potential to significantly reduce energy use and emissions.
Breakthrough Opportunities
The MSE community can advance gas-separating membranes by developing and improving ceramic, metallic, polymeric, and composite membranes. Addressing the gaps and limitations specific to each of these breakthrough opportunities will allow gas-separating membranes to make significant contributions toward addressing energy, environmental, and economic needs.

29
Gas-Separating Membranes
Ceramic Membranes
Ceramic membranes are made from inorganic materials such as alumina, titania, silica, or zirconia and can be used for the separation of hydrogen and oxygen from gas mixtures in industrial processes. They have superior intrinsic properties, including stability at high temperatures, rigid porous structures, long lifetimes, the greatest number of chemical compatibilities, and the widest range of filtration sizes. There are currently two types of ceramic membranes: dense systems with high selectivity and low flux, and porous systems with low selectivity and high flux. The challenge is to maximize both selectivity and flux.
gAps And liMitAtions to oveRCoMe• Microporous ceramic membranes for water-gas shift reaction
applications have been difficult to manufacture at large scales and have low hydrothermal resistance.
• Ceramic membranes with high selectivity experience catastrophic cracking when exposed to large temperature gradients.
• It is difficult to simultaneously increase selectivity and flux.
Market Impact
Historical Trends and Future Opportunities
~1990 2011 Future
IMPROVEMENT IN CERAMIC MEMBRANE FLUX
10x 10x
~1990 2011 Future
IMPROVEMENT IN CERAMIC MEMBRANE SCALE
10x 100x
Ceramic membrane improvements are measured by increases in scale and rates of flux, which result from processing, composition, and materials property improvements. The scale, or size, of ceramic membranes has increased by one order of magnitude (10x) over the past 20 years and is expected to increase again by two orders of magnitude (100x) in the future. The rate of flux in dense ceramic membranes has increased by one order of magnitude (10x) over the past 20 years and has the potential to improve by up to one order of magnitude (10x) in the future.
Scale
• ~1990–2011: 10x improvement
• 2011–Future: 100x improvement
Flux
• ~1990–2011: 10x improvement
• 2011–Future: 10x improvement

30
Gas-Separating Membranes
Metallic Membranes
Metallic membranes used for gas separation can be made of various metals, metal alloys, or layered systems (e.g., palladium, tantalum, vanadium, and niobium). Membrane composition and density dictate the size of gases and elements that can pass through a membrane and also determine which gases a membrane can separate. Unlike other membrane materials, dense metallic membranes, such as palladium-based membranes, generally have infinite selectivity for hydrogen, the ability to be manufactured in a variety of configurations, and high thermal and mechanical stability.
gAps And liMitAtions to oveRCoMe• Metallic membranes, especially palladium-based membranes,
are extremely susceptible to contaminants such as sulfur, CO2, and heavy metals. As materials scientists make thinner metallic membranes to achieve higher levels of flux, these surface-poisoning effects are more detrimental.
• Metallic membranes generally have lower flux compared to polymers and porous ceramics and often encounter chemical degradation in applied environments.
Market Impact
Historical Trends and Future Opportunities
~1990 2011 2016
IMPROVEMENT IN METALLIC MEMBRANE FLUX
10x ~0x
~1990 2011 2020
IMPROVEMENT IN METALLIC MEMBRANE CHEMICAL STABILITY
5x 5x
~1990 2011 2020
IMPROVEMENT IN METALLIC MEMBRANE THERMAL STABILITY
5x 5x
Metallic membrane improvements are measured by increases in service life (thermal stability and chemical stability) and performance (rate of flux), which result from processing, composition, and materials property improvements. The thermal and chemical stability of metallic membranes has improved by 5x in the past 20 years from the development of thinner, more stable membranes. Thermal and chemical stability is expected to improve again by up to 5x in the next 10 years. In the past 20 years, flux has improved by one order of magnitude (10x); minimal improvements are expected over the next 5 years.
Thermal/Chemical Stability
• ~1990–2011: 5x improvement• 2011–2020: 5x improvement
Flux
• ~1990–2011: 10x improvement
• 2011–2016: Minimal improvement

31
Gas-Separating Membranes
Polymeric Membranes
Polymeric membranes cost less than other materials and are used at lower operating temperatures. Different polymers produce a variety of membrane compositions that range from rubbery to glassy. Rubbery polymeric membranes (e.g., poly dimethyl siloxane) have high permeability and low selectivity while glassy polymeric membranes (e.g., thermoplastic polyimide) have low permeability and high selectivity.
gAps And liMitAtions to oveRCoMe• Polymeric membranes are not suitable for high-temperature
applications and are limited to effective operating temperatures of about 120°C.
• An inverse relationship exists between permeability and selectivity in polymeric membranes, which makes it difficult to simultaneously recover and purify gas.
Market Impact
Historical Trends and Future Opportunities
~1990 2011 2020
IMPROVEMENT IN POLYMERIC MEMBRANE SELECTIVITY
5x 5x
~1990 2011 2020
IMPROVEMENT IN POLYMERIC MEMBRANE THERMAL STABILITY
100x 5x
The thermal stability of polymeric membranes has increased by two orders of magnitude (100x) over the past 10–20 years, making current polymeric membranes stable at about 120°C. Thermal stability is expected to improve by 5x over the next 10 years, adding a few more degrees of stability. Selectivity has improved by 5x over the past 20 years and is expected to improve another 5x over the next 10 years.
Thermal Stability
• ~1990–2011: 100x improvement
• 2011–2020: 5x improvement
Selectivity
• ~1990–2011: 5x improvement• 2011–2020: 5x improvement

32
Gas-Separating Membranes
Composite Membranes
Composite membranes cover a wide range of types, all consisting of different ceramics, metals, and polymers either layered on top of each other or integrated into a composite matrix. Different materials can produce different properties depending on the application need. Dense composite membranes made of palladium supported on porous stainless steel substrates are currently in development for high-temperature operations with the goal of providing pure hydrogen. Integrated ceramics and metals for membranes (cermets) are primarily focused on separating hydrogen and oxygen. Polymer membranes with an inorganic phase (mixed-matrix membranes) are focused on light gas separation. Scientists expect composite membranes to play an important role in fuel cells due to their potential for low water retention, high thermal stability, and high mechanical stability.
gAps And liMitAtions to oveRCoMe• Metal-particle-reinforced polymer membranes exhibit poor high-
temperature stability.
• Ceramic membranes with metal substrates experience corrosion problems due to salt in the membrane capillaries.
• Two-phase materials can experience failure from thermal expansion at high temperatures.
Market Impact
Historical Trends and Future Opportunities
~1990 2011 2020
IMPROVEMENT IN COMPOSITE MEMBRANE FLUX
10x 10x
~1990 2011 2020
IMPROVEMENT IN COMPOSITE MEMBRANE SELECTIVITY
20x 10x
~1990 2011 2020
IMPROVEMENT IN COMPOSITE MEMBRANE THERMAL STABILITY
10x 5x
Advances in manufacturing methods and materials composition have led to improvements in the thermal stability, selectivity, and flux rates of composite membranes. Thermal stability of composite membranes has improved by 10x over the past 20 years and is expected to improve by 5x over the next 10 years. Selectivity has improved by 20x over the past 20 years, and is expected to improve by 10x over the next 10 years. Flux rates have progressed at a rate of 10x over the past 20 years, and will improve at the same rate over the next 10 years.
Thermal Stability• ~1990–2011: 10x improvement• 2011–2020: 5x improvement
Selectivity• ~1990–2011: 20x improvement• 2011–2020: 10x improvement
Flux• ~1990–2011: 10x improvement• 2011–2020: 10x improvement

33
R&D Priority Activities: Gas-Separating Membranes
To overcome the gaps and limitations within the gas-separating membranes breakthrough opportunities, the MSE community must focus their efforts on increasing understanding of membrane activity, integrating catalysts into membranes, and pursuing other R&D activities
provided in the following table. The table divides the priority activities for each research initiative by the time frame in which they are estimated to impact U.S. energy sectors: near term (0–2 years), mid term (2–5 years), and long term (5–10 years).
NEAR TERM (0–2 yEARS)
Crosscutting• Developafundamentalunderstandingofthetrade-offoffluxandstabilityinmembranesystems.
• Identifyhowmaterialsreactunderreal-worldconditions(e.g.,degradationmechanisms).
• Conduct a techno-economic assessment of membrane-catalyst integration schemes and applications.
MID TERM (2–5 yEARS)
CeramicMembranes• Increasethefluxofdenseceramicmembranes.
PolymericMembranes• Identifyselectivityissuesinpolymerstodecreasethesystemthickness.
Crosscutting• Develop novel processing techniques/automation for low-cost membranes.• Conduct long-term testing of membranes.
LONG TERM (5–10 yEARS)
Crosscutting• Conduct predictive modeling of catalysis in membranes.
*The experts identified the boldedactivities as high priority.
CoAtingsCoatings protect substrates from wear and corrosion in harsh environments (e.g., high-temperature and high-friction environments) to increase system performance and lifetime. Chemical, structural, and processing innovations in coatings can prevent parasitic energy loss in automobiles, reduce corrosion in biomass systems, and improve oxidation resistance in industrial processes. These advances have the potential to increase the energy efficiency of U.S. energy sectors by reducing the need to replace system components frequently. Opportunities in electricity generation and industrial processes provide a quantifiable justification for pursuing R&D of coatings.
Market Opportunity: Electricity Generation
In 2010, the total U.S. energy consumption for electricity generation by the electric power sector was 39,579 TBtu,31 which was 40% of total U.S. energy consumption.32 Approximately 88% of electricity was generated using steam turbine engines (61% of generating capacity) or gas turbine engines (27% of generating capacity).33 Applying thermal coatings to steam and gas turbines and combustor engine components used in power generation plants can enable gas to enter turbines
at higher temperatures, improving plant efficiency, decreasing emissions, and reducing fuel costs. For example, a 1% reduction in both coal and natural gas consumed for gas and steam turbine power generation would result in 348 TBtu in energy savings34 and 22 MMT of reduced CO2 emissions.35 A 1% reduction in total fuel consumption by major U.S. investor-owned utilities (which represent only a portion of total U.S. power producers) would result in $400 million in fuel cost savings.
Market Opportunity: Industrial Processes
Corrosion and wear affect the metallic surfaces of industrial equipment and lead to progressive deterioration that can reduce plant efficiency and cause equipment failures and/or plant shutdowns. The annual cost of corrosion in various industrial processes totals $3.7 billion in the petroleum refining industry, $1.7 billion in the chemicals industry, and $5.9 billion in pulp and paper production and processing.36 Wear-resistant coatings can prevent the damaging effects of corrosion and wear, increase operating efficiency, and prevent the premature replacement of equipment. A 10% reduction in corrosion costs in these three industries could save about $1.1 billion each year.37

34
Breakthrough Opportunities
The MSE community can advance coatings by focusing on wear and tribology and high-temperature/thermal barrier coatings. Addressing the gaps and limitations
specific to each of these breakthrough opportunities will allow coatings to make significant contributions toward addressing energy, environmental, and economic needs.
Coatings
Wear/Tribology
Wear-resistant coatings are ideal for use with system components that operate in high-friction environments. These coatings can help extend component life, reduce the amount of material required for an application, and decrease the use of in-service materials, such as lubricants in machining operations. The use of wear and tribological coatings can save a significant amount of energy when used in metals and materials production. The use of coated tools and dies in these applications enhances productivity and directly helps to lower carbon emissions.38 Current R&D in wear and tribological coatings is focusing on developing materials designs that enable coatings to be repaired, minimizing the need to refurbish the substrate.
gAps And liMitAtions to oveRCoMe• High coefficient of thermal expansion can lead to separation between
the coating and substrate.
• Multi-layer coatings experience major problems with delamination, often due to thermal expansion during tooling. These coatings can also experience interdiffusion, an undesirable mixing of layers that causes failure.
Market Impact
Historical Trends and Future Opportunities
levels of stRuCtuRe of tRibologiCAl CoAtings
1
10-1
10-3
10-6
10-9
m
dm
mm
µm
nm
1800 1850 1900 1950 2000 2050
SCA
LE (
10-X
MET
ERS)
Nanotribology—Molecular tribologyMolecules, atoms, van der Waal’s forces, single crystals, strings
Unitribology—Machinery tribologyPerformance, efficiency, reliability, lifetime
Decitribology—Component tribologyTorque, forces, vibrations, clearance, alignment
Macrotribology—Contact tribologyHertz contact pressure, elastohydrodynamic lubrication, pitting, scuffing, scoring
Microtribology—Asperity tribologyFracture, elastic and plastic deformation, debris surface layers
The figure presents a 250-year snapshot of tribological process development from the perspective of scale. These decreases in scale have facilitated the use of tribological coatings in applications with the greatest potential for materials performance improvements. The current focus on nano- or molecular tribology has the potential to increase coatings performance by one order of magnitude. If developed, these advanced coatings, primarily ceramic or ceramic-matrix composites, could improve wear performance, provide better oxidation and corrosion resistance, and achieve extremely low surface friction properties.39

35
Coatings
High-Temperature and Thermal Barrier Coatings
Applying a coating with low thermal conductivity to a part surface can drastically lower the temperature of that part during operation. In addition to reducing the occurrence of thermally induced failure mechanisms, thermal barrier coatings reduce the onset of oxidation in metals that typically have high oxidation rates at higher temperatures. This results in longer part life, increased efficiency, and lower costs.
gAps And liMitAtions to oveRCoMe• Multifunctional coatings with high-temperature operating
capabilities and corrosion resistance are currently unable to meet all of the industry’s needs. Major improvements must be made to simultaneously improve thermal stability and corrosion resistance before multifunctional coatings can be more widely used.
• Thermal barrier coatings have adhesion problems and generally do not bond well to surfaces. Changes in the coating composition or the coating deposition process are necessary to better integrate coated parts into a system.
Market Impact
Historical Trends and Future Opportunities
MAXiMuM teMpeRAtuRe At whiCh high-teMpeRAtuRe CoAtings ReMAin stAble
1,600
1,400
1,200
1,000
800
600
400
200
01980s 2011 2020
TEM
PER
AT
UR
E (°
C)
In the 1980s, gas turbines benefited greatly from the introduction of high-temperature coatings with thermal stability as high as 1,000°C. Currently, state-of-the-art high-temperature coatings are stable at temperatures up to 1,200°C. Thermal stability is expected to increase to allow temperatures of 1,400°C in the next 10 years.
Thermal Stability
• 1980s: 1,000°C
• 2011: 1,200°C
• 2020: 1,400°C

36
R&D Priority Activities: Coatings
To overcome the gaps and limitations within the coatings breakthrough opportunities, the MSE community must focus their efforts on developing coatings with higher tolerance to high-wear and corrosive environments, advancing technologies that can detect coating defects, and pursuing other
R&D activities provided in the following table. The table divides the priority activities for each research initiative by the time frame in which they are estimated to impact U.S. energy sectors: near term (0–2 years), mid term (2–5 years), and long term (5–10 years).
NEAR TERM (0–2 yEARS)
Wear/Tribology• Leveragematerialssubstitutiontocreatemultifunctionalcoatingsthatareabletowithstandhigh-wearenvironments.
Crosscutting• Advanceresearchinsensing/healthmonitoringtodetectdefectsincoatingsandprognostictools.
• Improve understanding of microscale geometry on wetting angles.• Identify key materials for coatings in metal die-casting to withstand high temperatures, wear,
etc.• Develop high-emissivity coatings for building/roof applications.• Develop high-speed, low-cost processes for applying coatings.
MID TERM (2–5 yEARS)
Crosscutting• Developanon-vacuumcoatingapplicationprocess.• Identifykeymaterialsforcoatingswithhightemperaturestability,highelectricalconductivity,andoxidationresistance.
LONG TERM (5–10 yEARS)
Wear/Tribology• Develop self-lubricating coatings in high-wear applications.
Crosscutting• Develop self-healing/repairable coatings that can extend component life.• Advance techniques to improve the speed of deposition of physical vapor deposition
coatings by one order of magnitude.
*The experts identified the boldedactivities as high priority.

37
notes1 John Armor, “A History of Industrial Catalysts,” Catalysis Today 163, no.1
(2011): 3–9.
2 Prepared by Energetics Incorporated for the U.S. Department of Energy Industrial Technologies Program, “Manufacturing Energy and Carbon Footprint: Chemicals Sector,” last updated August 1, 2011, accessed August 29, 2011, http://www1.eere.energy.gov/industry/pdfs/chemicals_footprint.pdf. This energy consumption does not include feedstock energy and off-site electricity generation, transmission, and distribution losses.
3 Maarten Neelis et al., “Approximation of Theoretical Energy-Saving Potentials for the Petrochemical Industry Using Energy Balances for 68 Key Processes,” Energy 32, no. 7 (2007): 1,104–1,123. 104 TBtu is calculated by assuming a U.S. share of 19% of global non-selectivity losses, totaling 550 TBtu for 42 petrochemical processes cited. The 19% share assumption is based on a 2010 American Chemistry Council estimate of U.S. chemicals production as a share of global chemicals production.
4 Ibid. Calculation: 25% of total selectivity energy losses = 25% * 104 TBtu = 26 TBtu.
5 Ibid. Calculation: 25% of total emissions associated with selectivity losses = 8 MMTCO2 * 25% = 2 MMTCO2.
6 U.S. Census Bureau, “2009 Annual Survey of Manufactures,” December 3, 2010, accessed August 29, 2011, http://www.census.gov/manufacturing/asm/index.html. Calculation: $331 million = (26 TBtu/3,195 TBtu) * $40.7 billion.
7 P. Samuel, “GTL Technology—Challenges and opportunities in Catalysis,” Bulletin of the Catalysis Society of India 2, no. 5, (2003): 82–99.
8 World Bank Global Gas Flaring Reduction Partnership, “Estimated Flared Volumes from Satellite Data, 2006–2010,” last updated March 23, 2011, accessed August 29, 2011, http://web.worldbank.org/WBSITE/EXTERNAL/TOPICS/EXTOGMC/EXTGGFR/0contentMDK:22137498~pagePK:64168445~piPK:64168309~theSitePK:578069,00.html.
9 U.S. Energy Information Administration (EIA), Monthly Energy Review, June 2011 (Washington, DC: EIA, 2011), Table 4.3. Calculation: 8 TBtu = (0.21 bcm/683 bcm) * 24,800 TBtu.
10 Ibid. Calculation: 0.4 MMTCO2 = (0.21 bcm/683 bcm) * 1,285 MMTCO2.
11 Michael Farina for GE Energy, Flare Gas Reduction: Recent Global Trends and Policy Considerations, (GE, 2010), 7. Assuming price of $2/MBtu of natural gas, 1 bcm of natural gas is equivalent to $72 million. Calculation: $15 million = (0.21 bcm/2.1 bcm) * $152 million.
12 Neelis et al., “Approximation of Theoretical Energy-Saving Potentials for the Petrochemical Industry,” 1,104–1,123; “Ethylene Oxide Catalysts – Hybrid & High Performance Catalysts,” CRI Catalysts, accessed June 13, 2011, http://www.cricatalyst.com/home/content/cri_catalyst/catalysts/ethylene_oxide/; Nexant Chem Systems, PERP Report, Ethylene Oxide / Ethylene Glycol (White Plains, Ny: Nexant, Inc., 2006); Sven Panke, Martin Held, and Marcel Wubbolts, “Trends and Innovations in Industrial Biocatalysis for the Production of Fine Chemicals,” Current Opinion in Biotechnology 15, no. 4 (2004): 272–279.
13 Uwe Bornscheuer, “Trends and Challenges in Enzyme Technology,” in Advances in Biochemical Engineering/Biotechnology, 100 (Berlin: Springer, 2005) 181–203; Christian Wandrey, Andreas Liese, and David Kihumbu, “Industrial Biocatalysis: Past, Present, and Future,” Organic Process Research & Development 4, no. 4 (2000): 286–290.
14 Neelis et al., “Approximation of Theoretical Energy-Saving Potentials for the Petrochemical Industry,” 1,104–1,123; “Ethylene Oxide Catalysts – Hybrid & High Performance Catalysts,” CRI Catalysts, accessed June 13, 2011, http://www.cricatalyst.com/home/content/cri_catalyst/catalysts/ethylene_oxide/; Nexant Chem Systems, PERP Report, Ethylene Oxide / Ethylene Glycol (White Plains, Ny: Nexant, Inc., 2006); Sven Panke, Martin Held, and Marcel Wubbolts, “Trends and Innovations in Industrial Biocatalysis for the Production of Fine Chemicals,” Current Opinion in Biotechnology 15, no. 4 (2004): 272–279; William H. Scouten and Gene Petersen, New Biocatalysts: Essential Tools for a Sustainable 21st Century Chemical Industry (Washington, DC: Council
for Chemical Research, 2000).
15 U.S. Energy Information Administration (EIA), Monthly Energy Review, May 2011 (Washington, DC: EIA, 2011), Table 2.6, http://www.eia.gov/totalenergy/data/monthly/pdf/sec2_13.pdf.
16 Solar Energy Industries Association and GTM Research, U.S. Solar Market Insight™ 2010 Year in Review: Executive Summary, (Washington, DC: SEIA/GTM Research, April 2011), www.seia.org/galleries/pdf/SMI-yIR-2010-ES.pdf.
17 Calculation: 396 TBtu = 1% * 39,579 TBtu.
18 U.S. Energy Information Administration (EIA), Monthly Energy Review, May 2011 (Washington, DC: EIA, 2011), Table 12.6, http://www.eia.gov/totalenergy/data/monthly/pdf/sec12_9.pdf; Ibid, Table 2.6, http://www.eia.gov/totalenergy/data/monthly/pdf/sec2_13.pdf. Calculation: 23 MMT = 1% * (39,579 TBtu / (39,579 TBtu - 13 TBtu)) 2,271 MMT. (CO2 emissions are for the electric power sector; solar technologies do not produce emissions when generating electricity.)
19 U.S. Energy Information Administration (EIA), Electric Power Annual (Washington, DC: EIA, April 2011), Table 8.1, http://www.eia.doe.gov/cneaf/electricity/epa/epat8p1.html; U.S. Energy Information Administration (EIA), Monthly Energy Review, May 2011 (Washington, DC: EIA, 2011), Table 2.6, http://www.eia.gov/totalenergy/data/monthly/pdf/sec2_13.pdf. Calculation: $402 million = 1% (39,579 TBtu / (39,579 TBtu - 13 TBtu)) * $40.2 billion in fuels purchased by major investor-owned utilities. (Based on average fuel costs for non-solar production; solar technologies do not incur fuel costs while generating electricity.)
20 National Renewable Energy Laboratory, “Best Research-Cell Efficiencies,” revised June 2011, accessed June 13, 2011, www.nrel.gov/pv/thin_film/docs/kaz_best_research_cells.ppt.
21 Ibid.
22 International Energy Agency (IEA), Technology Roadmap—Concentrating Solar Power (Paris, France: OECD/IEA, 2010), http://www.iea.org/papers/2010/csp_roadmap.pdf.
23 Note: It was the consensus of the experts that MSE advances have a greater opportunity to improve gas-separating membranes than liquid-separating membranes. As a result, liquid-separating membranes have not been included in this report.
24 U.S. Energy Information Administration (EIA), Monthly Energy Review, May 2011 (Washington, DC: EIA, 2011), Table 2.6, http://www.eia.gov/totalenergy/data/monthly/pdf/sec2_13.pdf.
25 Ibid.
26 The Minerals, Metals, & Materials Society (TMS) in support of the U.S. Department of Energy Industrial Technologies Program, Linking Transformational Materials and Processing for an Energy-Efficient and Low-Carbon Economy: Creating the Vision and Accelerating Realization (Washington, DC: TMS, 2010).
27 1,828 MMTCO2 are released from coal-fired power plants. Calculation: 180 MMT = 10% * 1,828 MMTCO2
28 Prepared by Energetics Incorporated for the U.S. Department of Energy, Industrial Technologies Program, “Manufacturing Energy and Carbon Footprint: Chemicals Sector,” last updated August 1, 2011, accessed August 29, 2011, http://www1.eere.energy.gov/industry/pdfs/chemicals_footprint.pdf. Calculation: 275 MMTCO2/4,519 TBtu = 0.061 MMTCO2/TBtu.
29 Ernst Worrell, Lynn Price, and Christina Galitsky, Emerging Energy-Efficient Technologies in Industry: Case Studies of Selected Technologies, (Berkeley, CA: Lawrence Berkeley National Laboratory, 2004), http://ies.lbl.gov/iespubs/54828.pdf.
30 Ibid.
31 U.S. Energy Information Administration (EIA), Monthly Energy Review, May 2011 (Washington, DC: EIA, 2011), Table 2.6, http://www.eia.gov/totalenergy/data/monthly/pdf/sec2_13.pdf.
32 Ibid. Table 2.1, http://www.eia.gov/totalenergy/data/monthly/pdf/sec2_3.pdf.

38
33 U.S. Energy Information Administration, Form EIA-860, “Annual Electric Generator Report,” http://www.eia.gov/cneaf/electricity/ page/capacity/existingunits2008.xls.
34 U.S. Energy Information Administration (EIA), Monthly Energy Review, May 2011 (Washington, DC: EIA, 2011), Table 2.1, http://www.eia.gov/totalenergy/data/monthly/pdf/sec2_3.pdf; EIA, Form EIA-860, “Annual Electric Generator Report,” http://www.eia.gov/cneaf/electricity/page/capacity/existingunits2008.xls. Calculations: 348 TBtu = 39,579 TBtu * (88%) * 1% (calculation assumes equal capacity factors of various generation Technologies); 22 MMTCO2 = 1% * (1,828 MMTCO2 + 399 MMTCO2).
35 U.S. Energy Information Administration (EIA), Electric Power Annual (Washington, DC: EIA, April 2011), Table 8.1, http://www.eia.doe.gov/cneaf/electricity/epa/epat8p1.html.
36 Gregory Ruschau and Mohammed A. Al-Anezi, for CC Technologies Laboratories, under a cooperative agreement with the Federal Highway Administration and NACE International, “Appendix S: Oil and Gas Exploration and Production,” in Corrosion Costs and Preventive Strategies in the United States, (Dublin, OH: CC Technologies Laboratories, September 2001), Si–S14, http://www.corrosioncost.com/pdf/oilgas.pdf.
37 Calculation: $1.1 billion = ($3.7 billion + $1.7 billion + $5.9 billion) * 10%.
38 J. Lin, et al., “Design Methodology for Optimized Die Coatings: The Case for Aluminum Pressure Die-Casting: Invited paper B7-1-1, ICMCTF, presented Monday May 2nd, 2005, San Diego,” Surface and Coatings Technology 201, no. 6 (2006): 2,930–2,941.
39 A. Matthews, S. Franklin, and K. Holmberg, “Tribological Coatings: Contact Mechanisms and Selection,” Journal of Physics D: Applied Physics 40, no. 18 (2007): 5,463–5,475.

39
Current and emerging energy systems are composed of different classes of materials that must work together to achieve desired system
structure and functionality. These components must be joined in a way that maintains the desired properties of each material and prevents defects (e.g., improper bonding and contamination from unclean parts) that can jeopardize system performance.
Materials science and engineering (MSE) advances have the potential to enable the integration of new materials and the effective interfacing of materials combinations as systems become more complex and service environments become more demanding. Ultimately, improvements in material properties and joining processes can reduce the cost, environmental impact, and energy requirements of energy generation, storage, and use across U.S. energy sectors, particularly in transportation technologies, electricity generation and storage, and the oil and gas industry.
The following pathways provide a guide for research and development (R&D) in the area of materials integration in clean energy systems:
• Next-Generation Batteries and Fuel Cells
• Joining Processes for Multi-Material Structures
• Composites with Structural Capabilities
neXt-geneRAtion bAtteRies And fuel CellsEnergy storage technologies such as next-generation batteries and fuel cells are key enablers of electric grid modernization and integral to the successful commercialization and adoption of electric vehicles. Increasing the energy density, power capacity, efficiency, life, and safety of these technologies and reducing their cost and weight can lead to the development of more cost-effective, efficient, and environmentally friendly energy storage products. As a result, these improved products can enable the widespread integration of renewable energy, reduce widespread power outages, provide substitutes for transmission and distribution upgrades, and make it possible for electric and fuel cell vehicles to travel farther between recharging/refueling.
Market Opportunity: Transportation
In 2008, the tank-to-wheel energy consumption of light-duty vehicles totaled 16,436 trillion British thermal units (TBtu).1 The U.S. transportation sector tank-to-wheel emissions totaled 1,790 million metric tons (MMT) of carbon dioxide (CO2) in 2008, of which 1,113 MMT of CO2 were emitted by light-duty vehicles.2
According to a study by the Massachusetts Institute of Technology (MIT), future battery-powered electric vehicles and fuel cell-powered hydrogen vehicles could decrease the energy consumed by light-duty vehicles because they can have lower well-to-wheel energy intensities than conventional vehicles. The study estimates that, in 2030, battery-powered vehicles could have well-to-wheel intensities of 2,715 Btu per mile3 and fuel cell vehicles could have well-to-wheel intensities of 2,075 Btu per mile.4 These numbers are 47% and 59% lower, respectively, than the well-to-wheel intensities of a 2006 Toyota Camry with a 2.5-liter engine, which served as the MIT study’s baseline.5
The MIT study estimates that future battery-powered electric vehicles could have well-to-wheel emissions of 186 grams of CO2 per mile in 2030,6 a 54% reduction compared to the 2006 Toyota Camry, which emits 405 grams of CO2 per mile.7 Future fuel cell vehicles could have well-to-wheel emissions of 144 grams of CO2 per mile8—a 64% reduction in CO2 emissions per mile over the study’s baseline.9
Market Opportunity: Electricity Generation
Total U.S. energy consumption for electricity generation by the electric power sector was 39,579 TBtu in 2010,10 with about two-thirds of this energy (27,028 TBtu) generated from fossil fuels, mostly coal (19,133 TBtu).11 Emphasis on cleaner energy and decreased reliance on fossil fuels and other nonrenewable sources has drawn greater attention to renewable sources for electricity generation. While beneficial from an environmental standpoint, the demand for renewables-generated power can present additional challenges for the electric grid. Energy storage technologies are well positioned to help offset the intermittent electricity generation from renewable sources and could play an integral role in their increased adoption. This would help displace some portion of the 27,028 TBtu of fossil fuels that are consumed by the electric power sector, as well as the 2,271 MMT of CO2 associated with this energy use.12
Breakthrough Opportunities
The MSE community can advance batteries and fuel cells by developing and improving technologies for short-duration stationary storage and conversion, long-duration stationary storage and conversion, and transportation applications. Addressing the gaps and limitations specific to each of these breakthrough opportunities will allow next-generation batteries and fuel cells to make significant contributions toward addressing energy, environmental, and economic needs.
iv. MAteRiAls integRAtion in CleAn eneRgy systeMs

40
Next-Generation Batteries and Fuel Cells
Short-Duration Stationary Storage and Conversion
Stationary electrical energy storage technologies used for short-duration storage (milliseconds to two hours) and conversion applications have the potential to alleviate momentary electricity interruptions and facilitate the integration of significant amounts of renewable energy. Such advances will help to ensure the availability of reliable and affordable electricity.
gAps And liMitAtions to oveRCoMe• Materials scientists have an inadequate understanding of solid
electrolyte interfaces, high ionic-conductivity electrolytes at room temperature, and low environmental impact materials.
Market Impact
Historical Trends and Future Opportunities
lithiuM-ion bAtteRy Cost And eneRgy density
3.5
3.0
2.5
2.0
1.5
1.0
0.5
0.01990 1995
3.2
2000 2005 2010 2015 2020
CO
ST (
$/W
h)
0.4
1.2
0.3 0.25
–––––––
250
200
150
100
50
01990 1995 2000 2005 2010 2015 2020
ENER
GY
DEN
SIT
Y (
Wh/
kg)
85
120
170 200
215
–––––––
The historical trends and future improvements in stationary storage technologies can be represented by advances in lithium-ion batteries in consumer electronics. Over the past 20 years, lithium-ion batteries in consumer electronic cells have drastically changed in cost and energy density. Energy density has increased from 85 watt-hours per kilogram (Wh/kg) to 200 Wh/kg, while cost has decreased from $3.2/Wh to $0.3/Wh. In the next 10 years, energy density is expected to increase to about 215 Wh/kg, and cost is expected to potentially decrease to $0.25/Wh.13
Specific Energy
• 1991: 85 Wh/kg
• 2010: 200 Wh/kg
• 2020: 215 Wh/kg
Cost
• 1991: $3.2/Wh
• 2010: $0.3/Wh
• 2020: $0.25/Wh

41
Next-Generation Batteries and Fuel Cells
Long-Duration Stationary Storage and Conversion
Stationary electrical energy storage will help ensure reliable and affordable electricity. Several long-duration storage and conversion applications (longer than two hours) can help the electric grid meet peak electricity demand, postpone or avoid upgrades to grid infrastructure, and facilitate the integration of significant amounts of renewable energy.
gAps And liMitAtions to oveRCoMe• Materials scientists have an inadequate understanding of solid
electrolyte interfaces, high ionic-conductivity electrolytes at room temperature, and low environmental impact materials.
• Available battery materials, even those capable of moderate performance, are cost-prohibitive and not amenable to simple large-scale processing. In particular, low-cost materials for large-scale energy storage and processing are not available.
Market Impact
Historical Trends and Future Opportunities
bAtteRy Cost of long-duRAtion eneRgy stoRAge
600
500
400
300
200
100
0~1960 2011 2020
BA
TT
ERY
CO
ST (
$/kW
h)
Battery cost, which is largely driven by manufacturing scale-up, process development, and improved use of active materials, is a key metric for measuring the improvement of long-duration storage technologies. Over the past 50 years, the average cost of long-duration energy storage technologies has dropped from about $500 per kilowatt hour (kWh) to $250/kWh. The target cost for long-term energy storage in the next 10 years is $150/kWh.14
Battery Cost ($/kWh)
• ~1960: $500/kWh
• 2011: $250/kWh
• 2020: $150/kWh

42
Next-Generation Batteries and Fuel Cells
Transportation
Advanced energy storage and conversion systems such as batteries and fuel cells can help define the future of transportation. Current electric vehicles range from mild hybrids to all-electric vehicles, and fuel cell vehicles are powered by hydrogen. While batteries and fuel cells used for public and private transportation require major materials science advances to lower cost, improve safety, and increase energy output and storage capacity, these technologies are gaining market share at the expense of traditional gasoline- and diesel-powered vehicles due, in part, to significant cost reductions.
gAps And liMitAtions to oveRCoMe• Lead-acid batteries have low specific energy, poor cold-
temperature performance, and short life cycles.
• Batteries such as lithium-polymer, nickel-metal hydride, and lithium-ion need to be more cost-effective to enable widespread adoption in the U.S. passenger vehicle sector at current petroleum prices.
• Nickel-metal hydrides have high self-discharge and heat generation at high temperatures, and suffer from hydrogen loss.
• Fuel cell vehicles require a new propulsion system and new infrastructure.
• The positive and negative electrodes on automotive lithium-ion batteries are currently cost-prohibitive and heavy.
Market Impact
Historical Trends and Future Opportunities
lARge-foRMAt lithiuM-ion Costs
1,000
900
800
700
600
500
4002010
Automotive Pack Cost Cell Cost
2011
925
2012 2013 2014 2015
CO
ST (
$/W
h)
780765
715 705 700
560 555
725
625 620570
Lithium-ion systems are representative of electric vehicle batteries. Over the next 5 years, the costs of both the automotive pack and the battery cell of these large-format storage technologies are expected to decrease. Cell costs are expected to decrease from $725/Wh to $555/Wh and automotive pack costs are expected to decrease from $925/Wh to $700/Wh.15
Cell Cost ($/Wh)
• 2010: $725/Wh
• 2015: $555/Wh
Automotive Pack Cost ($/Wh)
• 2010: $925/Wh
• 2015: $700/Wh

43
R&D Priority Activities: Next-Generation Batteries and Fuel Cells
To overcome the gaps and limitations within next-generation batteries and fuel cells breakthrough opportunities, the MSE community must focus their efforts on advancing high-speed processing techniques, developing new battery component materials, and
pursuing other R&D activities provided in the following table. The table divides the priority activities for each research initiative by the time frame in which they are estimated to impact U.S. energy sectors: near term (0–2 years), mid term (2–5 years), and long term (5–10 years).
NEAR TERM (0–2 yEARS)
Short-DurationStorageandConversion• Advancehigh-speedstackingforlithium-ionbatteriessothatprismaticcellsconsistingoflayersofelectrodescanbemanufacturedmorequickly.
• Developroll-to-rollvacuumdryingandadvancewatermanagementforlithium-ioncellassembly.
Long-DurationStorageandConversion• Developlow-costfabricationofredoxflowbatterysystems.
AllStationaryStorageandConversion(Short-andLong-Duration)• Developlow-cost,massfabricationofoxidemembranesforsodium-sulfurbatteries.• Develop effective, durable seals between dissimilar materials (e.g., steel alloys to ceramics)
in high-temperature electrochemical devices.• Reduce the cost of the balance-of-system (i.e., incorporate low-cost and reliable housing,
cooling mechanisms, controls, electronics, etc.).• Advance high-speed electrode quality assurance.
Transportation• Improvecellformationandgradingforlithium-ioncellstodecreasethefootprintandcapitalexpendituresassociatedwiththeneedtochargebatteriesaftertheyareassembled.
Crosscutting• Develophigh-speed,100%inspection,nondestructiveevaluationtechniquesforbatteryjoints(e.g.,aluminumandcopper),packs,andmodules.
• Develop thick electrodes (thicker than 100 micrometers) to increase the energy density of batteries.
• Conduct nondestructive evaluation and closed-loop feedback during the coating process.
MID TERM (2–5 yEARS)
Short-DurationStorageandConversion• Reduceoreliminatetheuseoforganicsolvents(e.g.,lithium-ionelectrodefabrication).
• Develop low-cost, high-efficiency heat exchangers and insulators for solid oxide fuel cells and high-temperature sodium batteries.
Long-DurationStorageandConversion• Develop low-cost optimized membranes and separators for redox flow batteries.• Develop redox chemistries with higher concentrations and increased stability.
Transportation• Identify materials (e.g., better dielectrics) for higher-voltage isolation in automotive
applications to reduce the mass of current bus and electric motors and to reduce waste heat.
Crosscutting• Developnewmetalorceramicsurfaceswithcontrolledporosityfordirectbondingofpolymersorelastomersthatcanimproveadhesion.
• Reducetheuseofinactivematerials,expandingbeyondthickelectrodes.• Identifyprocessesforfunctionalizingsurfacesforpolymerchemicalbonding.• Reduce heat treatment temperature of raw materials.

44
LONG TERM (5–10 yEARS)
Short-DurationStorageandConversion• Develop bipolar cell sealing and filling, primarily for lithium-ion batteries.
AllStationaryStorageandConversion(Short-andLong-Duration)• Identify next-generation manufacturing for flexible, all solid-state batteries.• Develop co-extruded electrode and electrolyte fabrication.
Crosscutting• Fabricate load-bearing/structural batteries.
*The experts identified the boldedactivities as high priority.
joining pRoCesses foR Multi-MAteRiAl stRuCtuResJoining processes, which use lasers, electron beams, adhesives, heat treatments, or chemical reactions to connect dissimilar materials, are a key enabler of the mass production and increased use of multi-material structures, particularly for use in extreme (e.g., high-temperature and corrosive) operating environments. Increasing the robustness, life, and strength of joining processes will preserve core materials properties and eliminate defects, improving the performance of multi-material systems and structures and potentially increasing the energy efficiency of U.S. energy sectors. Opportunities for these advances to enable reduced vehicle weight and more effective cladding for oil and gas extraction provide quantifiable justification for pursuing R&D of joining processes for multi-material structures.
Market Opportunity: Transportation
The U.S. transportation sector consumed 28,103 TBtu in 2008, which was 28% of total U.S. energy consumption.16 Advanced joining processes could join vehicle structures (e.g., frames and bodies) more seamlessly and enable the integration of lighter-weight materials with more desired properties, such as the ability to withstand high temperatures near the vehicle engine. A study from MIT estimates that for every 10% reduction in vehicle weight, fuel economy could increase by 6% for cars and 8% for light-duty trucks.17 Considering that the annual U.S. energy consumption of cars and light-duty trucks is above 16,000 TBtu,18 if joining processes could enable a 10% reduction in the weight of cars and light-duty trucks, such advances could save 1,060 TBtu of energy,19 72 MMT of CO2 emissions,20 and over $34 billion in fuel costs each year (assuming an estimated cost of motor gasoline of $3.98 per gallon or $31.84 per million Btu [MBtu]).21
Market Opportunity: Oil and Gas
A 2001 study from CC Technologies Laboratories, Inc. estimated that the annual cost of corrosion in the U.S. oil and gas sector is $1,372 million.22 Cladding, a joining process that bonds two or more material layers to form a composite,23 can reduce these corrosion costs by covering materials that are susceptible to corrosion with materials that have a higher resistance to corrosion.24 Using the 2001 estimated cost of corrosion for downhole tubing expenses ($463 million) as an example, a 10% reduction in downhole tubing corrosion costs would save $46.3 million each year.25 In addition, the increased corrosion resistance of downhole tubing from this cladding process could reduce the need to manufacture new downhole tubes, which would yield energy savings and reduce emissions.
Breakthrough Opportunities
The MSE community can advance joining processes for multi-material structures by developing and improving adhesive bonding, solid-state bonding, and design data and testing. Addressing the gaps and limitations specific to each of these breakthrough opportunities will allow joining processes for multi-material structures to make significant contributions toward addressing energy, environmental, and economic needs.

45
Joining Processes for Multi-Material Structures
Adhesive Bonding
Adhesive bonding joins new materials, such as composites, and dissimilar materials in one assembly using an adhesive substance that is typically made of natural or synthetic polymer. This technique is quick and affordable, provides good strength and fatigue resistance, and saves weight compared to alternative joining techniques, such as bolting using heavy metal joiners. For example, adhesively bonding polymer matrix composites to metals and dissimilar polymers is a key enabling technology for vehicle lightweighting.
gAps And liMitAtions to oveRCoMe• There are no current methods to predict bond life, nor are there
nondestructive evaluation methods to ensure a level of bond integrity. Current nondestructive evaluation methods can only detect the location of a bond line.
• Most polymer adhesives are unstable beyond 350°F.
• Surface insensitive adhesives cannot currently mitigate the need for expensive surface preparation of the materials being bonded.
• There is currently no industry-wide design database for adhesive joining that includes proper finite element modeling techniques.
Market Impact
Historical Trends and Future Opportunities
Adoption of Adhesive joining in the AutoMotive seCtoR
25,000
20,000
15,000
10,000
5,000
01980 2011 2020
AD
HES
IVE
JOIN
ING
(MIL
LIO
NS
OF
PO
UN
DS)
Adoption rate demonstrates the increased reliance on adhesives as a joining mechanism. Adhesives were adopted at the rate of 9,000 million (MM) lbs in 1980, with 18,500MM lbs of adhesive joining in use today. This value is expected to increase to 20,700MM lbs over the next 10 years.26
Adoption Rate
• 1980: 9,000MM lbs
• 2011: 18,500MM lbs
• 2020: 20,700MM lbs

46
Joining Processes for Multi-Material Structures
Solid-State Bonding
Solid-state bonding, including all variants of friction welding (e.g., direct drive, inertia, stir, and linear), resistance processing (e.g., upset, flash, and projection welding), thermo-compression welding, hot-press welding, diffusion bonding, and auto-vacuum welding, forms bonds between two nominally flat materials using material flow and elevated pressures and temperatures. The desired result is a strong, reliable interface without discontinuities or solidification-related microstructural changes. Solid-state bonding technologies can join a wide range of materials, including dissimilar materials combinations, at productivity levels that are appropriate for mass-produced structures.
gAps And liMitAtions to oveRCoMe• Nondestructive evaluation of solid-state welds is the single biggest
impediment to more broad-based applications of solid-state bonding.• In-process monitoring has not yet been developed to allow quality
assurance at high productivity levels.• Capital equipment costs are currently high, requiring the
development of new equipment configuration strategies.• The formation of deleterious intermetallic phases limits joint
performance.• Materials scientists lack understanding of the specific processing
features (e.g., joint design, upset, upset speed, and heating time) that are unique for each material system.
• Materials scientists have not addressed the role of secondary shielding to prevent contamination or oxidation.
Market Impact
Historical Trends and Future Opportunities
AveRAge stRength of MetAls
1990 1995 2000 2005 2010 2015 2020
AV
ERA
GE
STR
ENG
TH
O
F R
ESP
ECT
IVE
MET
ALS
+1% per year
+3% per
year
Over the past 10–20 years, the average strengths of aluminum, titanium, and stainless steels have increased by roughly 1% per year. The average strength of revolutionary compositions of amorphous and multi-phase metals is expected to increase by about 3% per year for the next 10 years. Solid-state bonding will need to continue to advance at a similar rate to take full advantage of these base metal improvements.27
Average Strength of Respective Metals
• 1990–2011: 1% per year
• 2011–2020: 3% per year

47
Joining Processes for Multi-Material Structures
Design Data and Testing
Design data and testing is required for the statistical analysis of material properties. Designers use these analyses to develop fail-safe design approaches and to approximate failure risk. Databases on dissimilar material properties for specific joining process are also necessary for designing structures. Materials scientists use design data and testing to establish the statistical variation of a given set of best practices for integrating dissimilar materials into a system using joining processes.
gAps And liMitAtions to oveRCoMe• Specific tests have not yet been defined that address both material
combinations and specific joining approaches.• Specific failure criteria that address static, fatigue, and crash modes
have not been developed for multi-material systems.• Methodologies for multi-material systems have not been defined to
allow the integration of failure criteria into vehicle designs.• Processing variations can potentially lead to wide variations in joint
performance. Approaches must be defined that assess process robustness and use the data gathered to create statistically based design guidelines.
• The feasibility of joining dissimilar metallic materials and metal-matrix composites by friction stir welding (FSW) has been demonstrated, but the mechanical property evaluation is limited. No reported studies have progressed to the level of design allowables.
• Localized stress-corrosion in dissimilar alloys of the same system (e.g., 2024 and 7050 aluminum), galvanic corrosion in strongly dissimilar systems (e.g., 2024 aluminum and Ti-6Al-4V [titanium-aluminum-vanadium]), and mismatching of the coefficient of thermal expansion in strongly dissimilar systems are challenges in testing multi-material systems.
Market Impact
Historical Trends and Future Opportunities
tRends in MAteRiAls pRopeRty dAtA ColleCtion
1950 1960 1970 1980 1990 2000 2010 2020
Materials Property Data
Modulus, Thermal Properties, Fatigue Issues, etc.
All materials properties,1% increase in quantity per year
Tensile Strength Data
Prior to 1970, there was an emphasis on studying tensile strength data. Since 1970, this emphasis has decreased and materials scientists have begun to study other materials properties, such as modulus, thermal, and fatigue characteristics. Since the 1980s, all materials properties data has increased in quantity by roughly 1% per year and is expected to increase at this rate for the next 10 years.28

48
R&D Priority Activities: Joining Processes for Multi-Material Structures
To overcome the gaps and limitations within the joining processes for multi-material structures breakthrough opportunities, the MSE community must focus their efforts on improving joining processes, advancing testing and nondestructive evaluation approaches, and pursuing
other R&D activities provided in the following table. The table divides the priority activities for each research initiative by the time frame in which they are estimated to impact U.S. energy sectors: near term (0–2 years), mid term (2–5 years), and long term (5–10 years).
NEAR TERM (0–2 yEARS)
AdhesiveBonding• Develop a manufacturing process and design guidelines for hybrid bonding that may include
combining adhesives with welding or mechanical fasteners, or using graded adhesives to combine mechanical properties more effectively.
Solid-StateBonding• Developlow-cost,flexible,mass-productionjoiningprocessesformulti-materialautomotivesheetandtubularstructures(e.g.,aluminumtosteel),anddevelopdesigndataandfatiguedataforeachjoiningprocess.
• Developjoiningprocessesforhigh-temperature,oxide-dispersion-strengthenedmaterialsinextremeenvironments.
• Develop process and equipment requirements for solid-state welding of similar and dissimilar material systems.
• Develop FSW for the re-racking of composites (e.g., aluminum to boron carbide) used in nuclear fuel storage pools to extend plant life.
• Develop automated finish machining of metal additive manufacturing.• Develop residual stress and distortion control for large-puddle metal additive manufacturing.• Automate nondestructive testing for friction joining and metal additive manufacturing
processes (e.g., FSW and linear friction welding [LFW]).• Automate friction joining processes (e.g., FSW and LFW).
DesignDataandTesting• Create specific testing protocols for dissimilar materials joints, based on material
combinations and assembly processes.• Define a failure criterion strategy for dissimilar materials joints that can be integrated into
vehicle structural analyses.
Crosscutting• Fabricate localized metal-matrix composites (MMCs) and reinforce ceramic matrix
composites (e.g., aluminum castings with ceramics) to reduce vehicle weight by 5%–7%.

49
MID TERM (2–5 yEARS)
AdhesiveBonding• Fabricatenewmetalorceramicsurfaceswithcontrolledporosityfordirectbondingofpolymersorelastomerstoimproveadhesionofmaterials.
• Developprocessesforproducingfunctionalsurfacesthatcanimprovetheintegrityofpolymerchemicalbonding.
• Developlow-cost(50%costreduction)surfaceadhesives(e.g.,prepolymers,epoxies,ultravioletcure,thermalcure,andlasercure)thatarenotsensitivetosubstratecontamination.
• Create highly conductive adhesives for photovoltaic bus connections.• Develop adhesives for the manufacture of heat exchangers.
Solid-StateBonding• Develop nondestructive evaluation strategies, including process monitoring and secondary
joint inspection, for solid-state joints.• Develop portable variants of solid-state technologies to enable multi-materials vehicle
construction.• Develop FSW of aluminum-aluminum, aluminum-magnesium, and nonferrous-ferrous (e.g.,
nickel-steel) for use in nuclear applications.• Create in-situ composites through FSW that contain particles (nano- and micro-scale
particles) capable of controlling weld properties.• Develop co-extrusion of dissimilar materials with significantly different flow stress at
extrusion temperatures.• Identify low-cost methods to incorporate titanium into heat exchangers, enabling increased
system performance, especially in corrosive environments.
DesignDataandTesting• Develop guidelines and a database for performance mechanisms (e.g., damage, fatigue,
failure, and repair of welds) and loading requirements of multi-material joints that are made by different joining methods and joint designs.
• Study process robustness to provide a statistical database for dissimilar joint performance.• Create numerical interfaces to facilitate the integration of defined failure criteria into
standardized structural performance models.
Crosscutting• Measureandanalyzepost-weldheattreatmentpropertiesandresidualstressesinsolid-stateFSWinrealtimeandafterprocessing(Solid-StateBonding,DesignDataandTesting).
• Developanintegratedcomputationalmaterialsengineeringprocessmodelforsolid-solidjoiningthatincorporatesresidualstress,diffusion,microstructureevolution,andmechanicalpropertiesandinterlayers(Solid-StateBonding,DesignDataandTesting).
• Develophigh-speedandreliablenondestructiveevaluationtechniquestoevaluatebondqualityinsimilaranddissimilarmaterials.
• Developlow-cost,mass-productionjoiningprocessesformulti-materialautomotivesheetandtubularstructures(e.g.,steelwithcomposites,aluminum,andmagnesium)(AdhesiveBonding,Solid-StateBonding).
• Join high-temperature materials to lower-temperature materials (e.g., ceramics to metals, metals to polymers, and refractories to metals) (Adhesive Bonding, Solid-State Bonding).
• Design a database for adhesive joining that includes proper finite element modeling techniques (Adhesive Bonding, Design Data and Testing).
• Develop processes, analysis methods, and fracture methodologies for friction-joined dissimilar materials.

50
CoMposites with stRuCtuRAl CApAbilitiesComposites can achieve properties that are superior to those of any of their individual components. Their high-strength and lightweight characteristics make them a preferred alternative to metals in certain structural components, including load-bearing structures composed of two or more materials. Decreasing the cost and weight of composites and increasing their stiffness, strength, and resilience can boost their implementation and will increase the energy efficiency of U.S. energy sectors. Opportunities in heat exchanger applications and vehicle lightweighting provide quantifiable justification for pursuing R&D of composites with structural capabilities.
Market Opportunity: Industrial Processes (Heat Exchangers)
According to a 2008 report from the U.S. Department of Energy, unrecovered waste heat accounts for 1,478 TBtu of the 8,400 TBtu consumed by select manufacturing processes each year.29 Composites integrated into heat exchangers could be used to reduce or recover this waste heat in the manufacturing sector, where heat is lost in streams of hot exhaust gases and liquids; through heat conduction, convection, and radiation from hot surfaces; and from heated product streams.30 Recovering the waste heat from these processes would have a total work potential—the maximum work that can be obtained by using the identified unrecovered waste heat to drive an engine—of 589 TBtu/year,31 which has the opportunity to reduce the emissions of the U.S. manufacturing sector by 34 MMT of CO2
32 and save $56 billion each year.33
Market Opportunity: Transportation
In 2008, the U.S. transportation sector consumed 28,103 TBtu—28% of total U.S. energy consumption.34 Compared to conventional materials, composite materials could reduce transportation energy use by decreasing vehicle weight. A study from MIT estimates that for every 10% reduction in vehicle weight, fuel economy could increase by 6% for cars and 8% for light-duty trucks.35 Considering that the annual U.S. energy consumption of cars and trucks is above 16,000 TBtu,36 if composites with structural capabilities could reduce the vehicle weight of cars and light-duty trucks by 10%, such advances could save 1,060 TBtu of energy,37 72 MMT of CO2 emissions,38 and $34 billion in fuel costs each year (assuming an estimated cost of motor gasoline of $3.98 per gallon or $31.84 per MBtu).39
Breakthrough Opportunities
The MSE community can advance composites with structural capabilities by developing or improving metal-matrix composites and nanocomposites, polymer composites and nanocomposites, and layered, sandwich, and infiltrated materials. Addressing the gaps and limitations specific to each of these breakthrough opportunities will allow composites with structural capabilities to make significant contributions toward addressing energy, environmental, and economic needs.
LONG TERM (5–10 yEARS)
AdhesiveBonding• Develop de-bondable adhesives for the end-of-life recycling of hybrid structures to mitigate
the loss of the embodied energy of component materials.
Solid-StateBonding• Integrate ceramics in extreme environments (e.g., silicon carbide joining) for energy
applications, including nuclear power and heat exchangers.• Identify metal-ceramic joining solutions (e.g., gradient interfaces) for forming robust bonds
that minimize residual stress.
*The experts identified the boldedactivities as high priority.

51
Composites with Structural Capabilities
Metal-Matrix Composites and Nanocomposites
Materials scientists have been historically interested in discontinuous metal-matrix composites (DMMCs) for their scientific merits and promise of commercialization. DMMCs are commercially available and can provide significant value from an energy perspective in nuclear and internal combustion engine (ICE) applications. Aluminum-boron (Al-B) or aluminum-boron-carbide DMMCs can extend nuclear plant life in fuel storage applications through re-racking. ICE applications can use DMMCs to replace cast-iron cylinder liners with a wear-resistant cylinder wall surface and to provide selective reinforcement to highly thermally loaded, high-stress areas (e.g., engine bore bridges), ultimately decreasing engine size and weight.40
gAps And liMitAtions to oveRCoMe• The current cost of DMMCs has prevented the widespread
penetration of structural MMCs into the marketplace and limited the number of MMC producers.
• Reactions (e.g., corrosion) between ceramic reinforcements and the metal matrix (e.g., aluminum-silicon-carbide [Al-SiC] composites) during both manufacture and use cause property degradation and variation.
• The uniform distribution of reinforcements, particularly at the nano-scale level, is difficult to achieve.
• There is a lack of statistically based design data that can be easily utilized by existing component design tools (e.g., finite element modeling).
Market Impact
Historical Trends and Future Opportunities
tRends in MetAl-MAtRiX CoMposites R&d And CoMMeRCiAlizAtion
1980 1990 2000 2010 2020
— Sp
ace s
huttl
e Al-B
tube
s
—– H
onda c
ylind
er sle
eves
— Fi
ber t
echn
ology an
d plan
ts by
BP, Tex
tron,
3M
— Pus
h for M
MC nano
techn
ology
— Lo
tus Elise
brak
es de
velope
d
— A
l-B ca
rbide
for n
uclea
r shie
lding
— F1
6 MMC ve
ntal f
in an
d acc
ess d
oors
In the 1970s and 1980s, MMC R&D focused on structural MMCs. In the 1990s, this work led to investments from large corporations in product development activities and large-scale production infrastructure. The majority of this effort was abandoned from 2000 to 2010 due to a shift to smaller, niche markets. In the next 10 years, commercial activity in MMCs will increase with the demand for and development of nanotechnology.

52
Composites with Structural Capabilities
Polymer Composites and Nanocomposites
Polymer composites, which contain a polymer matrix and a reinforcement of a different material (e.g., fibers and particulates), offer a unique combination of properties that are not possible with individual constituents. The most common polymer matrix types are made of epoxy resins, a class of thermoset polymers that react with curatives or hardeners to produce a solid matrix. Epoxy resins offer high strength, low shrinkage, good adhesion to substrates, low toxicity, and chemical resistance. Carbon fiber is a common fiber used in structural polymer composites with an epoxy matrix.41
gAps And liMitAtions to oveRCoMe• Cured polymer composites are prone to irreversible damage, such as
stress concentrations and delamination, when cut or bolted.
• There is no nondestructive evaluation method that can confirm a perfect bond between polymer composites and other joined materials.
Market Impact
Historical Trends and Future Opportunities
MARket segMent vAlue of fibeR-ReinfoRCed polyMeR CoMposites
1990 1995 2000 2005 2010 2015 2020
MA
RK
ET S
EGM
ENT
VA
LUE
+5% per year
The market value of fiber-reinforced polymer composites has advanced at an average rate of 5% per year over the past 20 years. The value of polymer nanocomposite technologies is expected to increase at this rate for the next 10 years.
Market Segment Value
• 1990–2011: 5% per year
• 2011–2020: 5% per year

53
Composites with Structural Capabilities
Layered, Sandwich, and Infiltrated Materials
Layered, sandwich, and infiltrated materials offer significant opportunities for improving the performance of engineered structures. Cored sandwich materials, which have a face sheet of one material and an internal core of another material, offer improved strength and modulus relative to density and can use high-temperature materials to improve process efficiency (e.g., incorporating high-temperature refractory metals to enable step changes in efficiency in solar thermal and industrial processes).
Gaps and Limitations to overcome• As wind turbine efficiency increases with size, sandwich materials used
in both the blades and tower experience increased stress. Sandwich materials require increased strength and more cost-effective integration to continue decreasing costs.42
• Due to the advantages of sandwich materials strength-to-density, these materials could contribute to vehicle lightweighting. However, manufacturing and joining techniques are not advanced enough to cost-effectively integrate into vehicle platforms.43
Market Impact
Historical Trends and Future Opportunities
moduLus vs. density of traditionaL monoLithic materiaLs and modern sandwich structures
Plot of modulus vs. density of traditionally manufactured monolithic materials (shaded areas), and with modern aluminum lattice-cored sandwich structures showing improvement in modulus vs. density performance44
Many classes of monolithic materials have been developed for structural applications; however, their modulus-to-density ratio is clustered around similar values and follows similar trends. Over the next 10 years, advances in structure and composition of aluminum lattice-cored sandwich structures will allow this class of composites to make incremental increases in modulus-to-density ratios, resulting in stiffer, lighter sandwich structures.

54
R&D Priority Activities: Composites with Structural Capabilities
To overcome the gaps and limitations within the composites with structural capabilities breakthrough opportunities, the MSE community must focus their efforts on developing new manufacturing and fabrication processes, advancing nondestructive evaluation techniques, and pursuing other R&D
activities provided in the following table. The table divides the priority activities for each research initiative by the time frame in which they are estimated to impact U.S. energy sectors: near term (0–2 years), mid term (2–5 years), and long term (5–10 years).
NEAR TERM (0–2 yEARS)
Layered/Sandwich/InfiltratedMaterials• Identifyanddeployjoiningandoxidation-protectionapproachesthatcouldbeusedtointegraterefractorymetalplates,foils,orsheetsastheouterfaceofsandwichstructures.
• Create modulus or plasticity gradients for robust, damage-tolerant, and wear-resistant materials.
• Determine fundamental failure mechanisms, behavior at interfaces, testing methods, and finite element analysis modeling of composites and layered materials.
Crosscutting• Conduct nondestructive evaluation of polymer composite or sandwich materials.
MID TERM (2–5 yEARS)
Metal-MatrixCompositesandNanocomposites• Developlow-cost,in-situfabricationofmetal-matrixnanocomposites,includingcastingandpowdermetallurgytechniques.
• Identify new approaches to manufacture cost-effective metallic fillers for structured sandwich materials, and develop supporting engineering data.
PolymerCompositesandNanocomposites• Establishmanufacturingprocessesanddesigncriteriatoenablelow-cost,high-volumecontinuousfiberpolymercompositesfortransportationlightweighting.
• Discoverhigh-performancepolymersorpolymercompositeswithhigherthermalgradientsand/orlowercreepatelevatedtemperaturestosubstituteformetals.
• Identify low-cost and robust nondestructive evaluation methods for measuring the state of cure.
• Develop ultra-low-wear polymers and composites for bushings and bearings that can replace metals, reduce or eliminate maintenance or downtime, and eliminate the need for lubricants.
• Identify methods to incorporate sensors into polymers for damage detection.
Crosscutting• Identifyout-of-autoclavecuringtechnologies(e.g.,selectiveheatingbymicrowaveorradiofrequency,andcoldprocessingbyelectronbeamcuring)toreducecuringtimes.
• Conducthigh-temperatureevaluationofMMCs,metal-matrixnanocomposites,andlayeredmaterials.
• Develop processes for evaluating and recycling metal/polymer matrix composites that can be used for structural applications (Metal-Matrix Composites and Nanocomposites, Polymer Composites and Nanocomposites).
LONG TERM (5–10 yEARS)
Layered/Sandwich/InfiltratedMaterials• Conduct modeling and experiments to identify foams with high strength-to-weight and
modulus-to-weight ratios.
Crosscutting• Develop bio-synthesis and bio-processing routes that mimic biological processes and can
achieve equal or better properties with decreased energy and emissions, with the ultimate goal of replacing petroleum feedstocks.
*The experts identified the boldedactivities as high priority.

55
notes1 To properly compare the energy and emissions efficiency of different
vehicles, it is important to consider their well-to-wheel efficiencies—the energy and emissions associated with fuel use over the vehicle lifetime. The well-to-wheel energy and emissions consist of two components: 1) The well-to-tank energy and emissions, which includes the energy and emissions associated with fuel production (such as refining) and the energy and emissions associated with transporting the fuel from its primary source to the vehicle tank, and 2) the tank-to-wheel energy and emissions associated with fuel use by the vehicles; Oak Ridge National Laboratory, Transportation Energy Data Book 29th Edition, Transportation Energy Use by Mode 2007–2008 (Washington, DC: U.S. Department of Energy, July 2010), Table 2.6, http://cta.ornl.gov/data/tedb29/Spreadsheets/Table2_06.xls.
2 Oak Ridge National Laboratory, Transportation Energy Data Book 29th Edition, Transportation Energy Use by Mode 2007–2008, (Washington, DC: U.S. Department of Energy, July 2010), Table 11.7, http://cta.ornl.gov/data/tedb29/Spreadsheets/Table11_07.xls.
3 Matthew A. Kromer and John B. Heywood, Electric Powertrains: Opportunities and Challenges in the U.S. Light-Duty Vehicle Fleet, (Cambridge, MA: Sloan Automotive Laboratory, Laboratory for Energy and the Environment, Massachusetts Institute of Technology, May 2007), 115, Table 50, http://web.mit.edu/sloan-auto-lab/research/beforeh2/files/kromer_electric_powertrains.pdf.
4 Ibid.
5 Ibid.
6 Kromer and Heywood, Electric Powertrains: Opportunities and Challenges in the U.S. Light-Duty Vehicle Fleet, 115, Table 50.
7 Calculation: Percentage change between 186 grams of greenhouse gas emissions per mile and 405 grams of greenhouse gas emissions per mile = 54%.
8 Kromer and Heywood, Electric Powertrains: Opportunities and Challenges in the U.S. Light-Duty Vehicle Fleet, 115, Table 50.
9 Note that the tank-to-wheel section of battery-powered and fuel cell vehicles does not result in CO2 emissions. The MIT study made several assumptions to arrive at the 2030 estimates for batteries and fuel cells, including improvements in technology, fuel mix of electricity generation, and generation pathways for hydrogen. These assumptions have a direct impact on the estimated energy and CO2 emissions of future battery and fuel cell vehicles.
10 U.S. Energy Information Administration (EIA), Monthly Energy Review, May 2011 (Washington, DC: EIA, 2011), Table 2.6, http://www.eia.gov/totalenergy/data/monthly/pdf/sec2_13.pdf.
11 Ibid.
12 U.S. Energy Information Administration (EIA), Monthly Energy Review, May 2011 (Washington, DC: EIA, 2011), Table 12.6, http://www.eia.gov/totalenergy/data/monthly/pdf/sec12_9.pdf.
13 M. Armand and J.M. Tarascon, “Building Better Batteries,” Nature 45, no. 17 (2008): 652–657; F. Cheng et al., “Functional Materials for Rechargeable Batteries,” Advanced Materials 23, no. 4 (2011): 1,695–1,715; M. Stanley Whittingham, “Materials Challenges Facing Electrical Energy Storage,” MRS Bulletin 33, no. 4 (2008): 411–419; J.M. Tarascon, M. Armand, “Issues and Challenges Facing Rechargeable Lithium Batteries,” Nature 414, no. 6,861 (2001): 359–367; A.A. Shah, M.J. Watt-Smith, and F.C. Walsh, “A Dynamic Performance Model for Redox-Flow Batteries Involving Soluble Species,” Electrochemica Acta 53, no. 27 (2008): 8,087–8,100; Z. yang et al., “Electrochemical Energy Storage for Green Grid,” Chemical Reviews 111, no. 5 (2011): 3,577–3,613; C.P. de Leon et al., “Redox Flow Cells for Energy Conversion,” Journal of Power Sources 160, no. 1 (2006): 716–732; Susan Schoenung and William Hassenzahi, Long- vs. Short-Term Energy Storage Technologies Analysis: A Life-Cycle Cost Study (Albuquerque, NM: Sandia National Laboratories, 2003) http://prod.sandia.gov/techlib/access-control.cgi/2003/032783.pdf; Energy Self-Reliant States, “Li-ion Pricing and Energy Density, 1991–2005,” adapted from Buchman (2005), accessed June 13, 2011, http://energyselfreliantstates.org/sites/energyselfreliantstates.org/files/lithium-ion-pricing-history.png.
14 M. Armand and J.M. Tarascon, “Building Better Batteries,” Nature 45, no. 17 (2008): 652–657; F. Cheng et al., “Functional Materials for Rechargeable Batteries,” Advanced Materials 23, no. 4 (2011): 1,695–1,715; M. Stanley Whittingham, “Materials Challenges Facing Electrical Energy Storage,” MRS Bulletin 33, no. 4 (2008): 411–419; J.M. Tarascon, M. Armand, “Issues and Challenges Facing Rechargeable Lithium Batteries,” Nature 414, no. 6861 (2001): 359–367; A.A. Shah, M.J. Watt-Smith, and F.C. Walsh, “A Dynamic Performance Model for Redox-Flow Batteries Involving Soluble Species,” Electrochemica Acta 53, no. 27 (2008): 8,087–8,100; Z. yang et al., “Electrochemical Energy Storage for Green Grid,” Chemical Reviews 111, no. 5 (2011): 3,577–3,613; C.P. de Leon et al., “Redox Flow Cells for Energy Conversion,” Journal of Power Sources 160, no. 1 (2006): 716–732; Susan Schoenung and William Hassenzahi, Long- vs. Short-Term Energy Storage Technologies Analysis: A Life-Cycle Cost Study (Albuquerque, NM: Sandia National Laboratories, 2003) http://prod.sandia.gov/techlib/access-control.cgi/2003/032783.pdf.
15 Lux Research Inc., “Projected Large-Format Li-Ion Costs,” chart in Charles Murray, “Auto Industry Headed for EV Battery Glut,” Design News, August 16, 2010, http://www.designnews.com/document.asp?doc_id=229273.
16 Oak Ridge National Laboratory, Transportation Energy Data Book 29th Edition, Transportation Energy Use by Mode 2007–2008 (Washington, DC: U.S. Department of Energy, July 2010), Table 2.6, http://cta.ornl.gov/data/tedb29/Spreadsheets/Table2_06.xls
17 Lynette Cheah, John Heywood, and Randolph Kirchain, “The Energy Impact of U.S. Passenger Vehicle Fuel Economy Standards,” (presentation, IEEE International Symposium on Sustainable Systems and Technology, Washington, DC, May 17–19, 2010), http://web.mit.edu/sloan-auto-lab/research/beforeh2/files/IEEE-ISSST-cheah.pdf. (Note that the study assumed that powertrains are resized to maintain same acceleration performance when vehicle weight is reduced. Fuel consumption [or economy] refers to adjusted figures, which are revised upward [or downward] to better reflect actual, on-road figures, rather than dynamometer test results obtained in the laboratory); Lynette Cheah et al., “Factor of Two: Halving the Fuel Consumption of New U.S. Automobiles by 2035,” in Reducing Climate Impacts in the Transportation Sector, edited by Daniel Sperling and James S. Cannon (New york: Springer, 2008), web.mit.edu/sloan-auto-lab/research/beforeh2/files/cheah_factorTwo.pdf.
18 Oak Ridge National Laboratory, Transportation Energy Data Book 29th Edition, Transportation Energy Use by Mode 2007–2008 (Washington, DC: U.S. Department of Energy, July 2010), Table 2.6, http://cta.ornl.gov/data/tedb29/Spreadsheets/Table2_06.xls.
19 Oak Ridge National Laboratory, Transportation Energy Data Book 29th Edition, Transportation Energy Use by Mode 2007–2008, Table 2.6, (Washington, DC: U.S. Department of Energy, July 2010) http://cta.ornl.gov/data/tedb29/Spreadsheets/Table2_06.xls. In 2008, cars consumed 8,831 TBtu and light-duty trucks consumed 7,572 TBtu. A 6% increase in car fuel economy results in a 5.66% decrease in fuel consumption. An 8% increase in light-duty truck fuel economy results in a 7.41% decrease in fuel consumption. Calculation of energy savings for cars = 500 TBtu = 8,831 TBtu * 5.66%; Calculation of energy savings in light-duty trucks = 561 TBtu = 7,572 * 7.41%; 500 TBtu + 561 TBtu = 1,061 TBtu.
20 Oak Ridge National Laboratory, Transportation Energy Data Book 29th Edition, Transportation Energy Use by Mode 2007–2008 (Washington, DC: U.S. Department of Energy, July 2010), Table 11.7, http://cta.ornl.gov/data/tedb29/Spreadsheets/Table11_07.xls. Calculation, assuming car CO2 emissions make up 54% of total car and truck emissions, based on the fraction of energy consumed by cars compared to light trucks: 54% = 8,831 TBtu/(8,831 TBtu + 7,572 TBtu). Then 34 MMTCO2 = 1,113.3 MMTCO2 * 5.66% * 54%; 38 MMTCO2 = 1,113 * 7.41% * 46%; 34 MMTCO2+ 38 MMTCO2 = 72 MMTCO2.
21 Oak Ridge National Laboratory, Transportation Energy Data Book 29th Edition, Transportation Energy Use by Mode 2007–2008, (Washington, DC: U.S. Department of Energy, July 2010), Table 2.6, http://cta.ornl.gov/data/tedb29/Spreadsheets/Table2_06.xls; U.S. Energy Information Administration (EIA), Monthly Energy Review, June 2011 (Washington, DC: EIA, 2011), Table 9.4, http://www.eia.gov/totalenergy/data/monthly/pdf/sec9_6.pdf; EIA, Annual Energy Review 2009, (Washington,

56
DC: EIA, August 2010), Appendix A, Table A1, http://www.eia.gov/totalenergy/data/annual/pdf/sec13_1.pdf; EIA, “Oil Crude and Petroleum Products Explained: Data and Statistics,” last updated July 5, 2011, accessed July 13, 2011, http://www.eia.gov/energyexplained/index.cfm?page=oil_home#tab2. Note that the price of motor gasoline is used in this example for simplicity purposes. Using diesel in these examples would yield different results because of differences in prices and heat content. Cost of motor gasoline based on $3.98 per gallon or $31.84 per MBtu, including taxes, (data from EIA, Monthly Energy Review, May 2011), energy content for motor gasoline of 5.253 MBtu per barrel (EIA, Annual Energy Review 2009), barrel to gallon conversion for petroleum products of 42 gallons per barrel (EIA, “Oil Crude and Petroleum Products Explained: Data and Statistics”).
22 Ruschau and Al-Anezi, “Appendix S: Oil and Gas Exploration and Production,” in Corrosion Costs and Preventive Strategies in the United States, Si–S14.
23 U.S. Environmental Protection Agency (EPA), Aluminum, Copper, And Nonferrous Metals Forming and Metal Powders Pretreatment Standards: A Guidance Manual (Washington, DC: EPA, 1989), http://www.epa.gov/nepis/Pubs/20001NNP.pdf
24 NACE International, “Metal Cladding,” accessed July 11, 2011, http://events.nace.org/library/corrosion/MetalCoatings/Cladding.asp.
25 Ruschau and Al-Anezi, “Appendix S: Oil and Gas Exploration and Production,” in Corrosion Costs and Preventive Strategies in the United States, Si–S14.
26 Skeist Incorporated, Adhesives VIII (Whippany, NJ: Skeist Incorporated, 2006).
27 R.S. Mishra and M.W. Mahoney, eds., Friction Stir Welding and Processing, (Materials Park, OH: ASM International, 2007).
28 Ibid.
29 BCS Incorporated for the U.S. Department of Energy (DOE) Industrial Technologies Program (ITP), Waste Heat Recovery: Technology and Opportunities in U.S. Industry, (Washington, DC: DOE ITP, 2008), 53, http://www1.eere.energy.gov/industry/intensiveprocesses/pdfs/waste_heat_recovery.pdf.
30 Ibid, x.
31 BCS Incorporated for the U.S. Department of Energy (DOE) Industrial Technologies Program (ITP), Waste Heat Recovery: Technology and Opportunities in U.S. Industry, (Washington, DC: DOE ITP, 2008), 53, http://www1.eere.energy.gov/industry/intensiveprocesses/pdfs/waste_heat_recovery.pdf.
32 U.S. Department of Energy, Industrial Technologies Program, 2010 Manufacturing Energy and Carbon Footprints—All Manufacturing (NAICS 31-33). Prepared by Energetics Incorporated, Columbia, MD. http://www1.eere.energy.gov/industry/pdfs/mfg_footprint.pdf. In 2006, the U.S. manufacturing sector consumed 21,972 TBtu and emitted 1,260 MMT of energy-related CO2. Using that information, it can be estimated that for every TBtu, the U.S. manufacturing sector emitted 0.057346 MMTCO2 (1,260 MMTCO2/21,972 TBtu = 0.057346 MMTCO2/TBtu). Calculation: 0.057346 MMTCO2/TBtu * 589 TBtu = 34 MMTCO2.
33 U.S. Department of Energy, Energy Information Administration, 2006 Manufacturing Energy Consumption Survey (Washington, DC: U.S. Department of Energy, June 2009), Table 724, http://www.eia.gov/emeu/mecs/mecs2006/2006tables.html. In 2006, the U.S Department of Energy’s Energy Information Administration reported that average prices of purchased energy sources for the manufacturing sector were $9.49 per MBtu. Calculation: $9.49 per MBtu * 589 TBtu = $5.6 billion.
34 Oak Ridge National Laboratory, Transportation Energy Data Book 29th Edition, Transportation Energy Use by Mode 2007–2008 (Washington, DC: U.S. Department of Energy, July 2010), Table 2.6, http://cta.ornl.gov/data/tedb29/Spreadsheets/Table2_06.xls.
35 Lynette Cheah, John Heywood, and Randolph Kirchain, “The Energy Impact of U.S. Passenger Vehicle Fuel Economy Standards,” (presentation, IEEE International Symposium on Sustainable Systems and Technology, Washington, DC, May 17–19, 2010), http://web.mit.edu/sloan-auto-lab/research/beforeh2/files/IEEE-ISSST-cheah.pdf. (Note that the study assumed that powertrains are resized to maintain
same acceleration performance when vehicle weight is reduced. Fuel consumption [or economy] refer to adjusted figures, which are revised upwards [or downwards] to better reflect actual, on-road figures, rather than dynamometer test results obtained in the laboratory); Lynette Cheah et al., “Factor of Two: Halving the Fuel Consumption of New U.S. Automobiles by 2035,” in Reducing Climate Impacts in the Transportation Sector, edited by Daniel Sperling and James S. Cannon (New york: Springer, 2008), web.mit.edu/sloan-auto-lab/research/beforeh2/files/cheah_factorTwo.pdf.
36 Oak Ridge National Laboratory, Transportation Energy Data Book 29th Edition, Transportation Energy Use by Mode 2007–2008 (Washington, DC: U.S. Department of Energy, July 2010), Table 2.6, http://cta.ornl.gov/data/tedb29/Spreadsheets/Table2_06.xls.
37 Oak Ridge National Laboratory, Transportation Energy Data Book 29th Edition, Transportation Energy Use by Mode 2007–2008 (Washington, DC: U.S. Department of Energy, July 2010), Table 2.6, http://cta.ornl.gov/data/tedb29/Spreadsheets/Table2_06.xls. In 2008, cars consumed 8,831 TBtu and light-duty trucks consumed 7,572 TBtu. A 6% increase in car fuel economy results in a 5.66% decrease in fuel consumption. An 8% increase in light-duty truck fuel economy results in a 7.41% decrease in fuel consumption. Calculation of energy savings for cars: 500 TBtu = 8,831 TBtu * 5.66%; Calculation of energy savings in light-duty trucks: 561 TBtu = 7,572 * 7.41%; 500 TBtu + 561 TBtu = 1,061 TBtu.
38 Ibid, Table 11.7, http://cta.ornl.gov/data/tedb29/Spreadsheets/Table11_07.xls; Assuming car CO2 emissions make up 54% of total car and truck emissions, based on the fraction of energy consumed by cars compared to light trucks: 54% = 8,831 TBtu/(8,831 TBtu + 7,572 TBtu). Then 34 MMTCO2 = 1,113.3 MMTCO2 * 5.66% * 54%; 38 MMTCO2 = 1,113 MMTCO2 * 7.41% * 46%; 34 MMTCO2 + 38 MMTCO2 = 72 MMTCO2.
39 Oak Ridge National Laboratory, Transportation Energy Data Book 29th Edition, Transportation Energy Use by Mode 2007–2008 (Washington, DC: U.S. Department of Energy, July 2010), Table 2.6, http://cta.ornl.gov/data/tedb29/Spreadsheets/Table2_06.xls; U.S. Energy Information Administration (EIA), Monthly Energy Review, June 2011 (Washington, DC: EIA, 2011), Table 9.4, http://www.eia.gov/totalenergy/data/monthly/pdf/sec9_6.pdf; U.S. EIA, Annual Energy Review 2009 (Washington, DC: EIA, August 2010), Appendix A, Table A1, http://www.eia.gov/totalenergy/data/annual/pdf/sec13_1.pdf; U.S. EIA, “Oil Crude and Petroleum Products Explained: Data and Statistics,” last updated July 5, 2001, accessed July 13, 2011, http://www.eia.gov/energyexplained/index.cfm?page=oil_home#tab2. Cost of motor gasoline based on $3.98 per gallon or $31.84 per MBtu, including taxes (EIA, Monthly Energy Review, May 2011), energy content for motor gasoline of 5.253 MBtu per barrel (EIA, Annual Energy Review 2009), and a barrel to gallon conversion for petroleum products of 42 gallons per barrel (EIA, “Oil Crude and Petroleum Products Explained: Data and Statistics”).
40 Aluminum Metal Matrix Composites Consortium, Aluminum Metal Matrix Composites Technology Roadmap (Ann Arbor, MI: Technologies Research Corporation, 2002); BDM Federal, Inc., Metal Matrix Composites Sector Study: An Assessment of the MMC Technology Base, Applications, and Marketplace, (McLean, VA: BDM Federal, 1993); Karl Kainer, “Basics of Metal Matrix Composites,” in Metal Matrix Composites: Custom-made Materials for Automotive and Aerospace Engineering, ed. Karl Kainer (Hoboken, NJ: John Wiley & Sons, 2006) 1–54.
41 EPRI Center for Materials Production, Industry Segment Profile: Composites (Palo Alto, CA: EPRI, 2000); ASM International, ASM Handbook Vol. 21: Composites (Material Park, OH: ASM International, 2001).
42 Ole Thybo Thomsen, “Sandwich Materials for Wind Turbine Blades—Present and Future,” Journal of Sandwich Structures and Materials 11, no. 1 (2009): 7–26.
43 D. Mohr and G. Straza, “Development of Formable All-Metal Sandwich Sheets for Automotive Applications,” Advanced Engineering Materials 7, no. 4 (2005): 243–246.
44 Mike Ashby, “Hybrid Materials to Expand the Boundaries of Material-Property Space,” Journal of the American Ceramic Society 94, Issue Supplement s1 (2011): s13–s14.
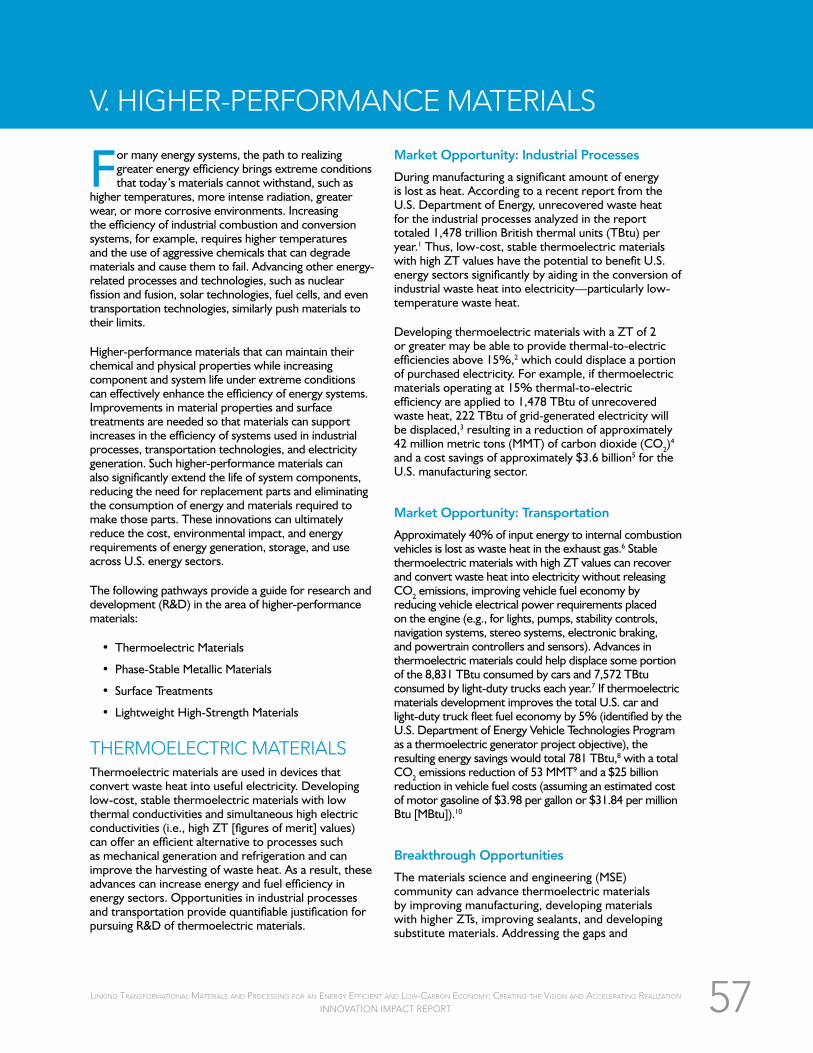
57
For many energy systems, the path to realizing greater energy efficiency brings extreme conditions that today’s materials cannot withstand, such as
higher temperatures, more intense radiation, greater wear, or more corrosive environments. Increasing the efficiency of industrial combustion and conversion systems, for example, requires higher temperatures and the use of aggressive chemicals that can degrade materials and cause them to fail. Advancing other energy-related processes and technologies, such as nuclear fission and fusion, solar technologies, fuel cells, and even transportation technologies, similarly push materials to their limits.
Higher-performance materials that can maintain their chemical and physical properties while increasing component and system life under extreme conditions can effectively enhance the efficiency of energy systems. Improvements in material properties and surface treatments are needed so that materials can support increases in the efficiency of systems used in industrial processes, transportation technologies, and electricity generation. Such higher-performance materials can also significantly extend the life of system components, reducing the need for replacement parts and eliminating the consumption of energy and materials required to make those parts. These innovations can ultimately reduce the cost, environmental impact, and energy requirements of energy generation, storage, and use across U.S. energy sectors.
The following pathways provide a guide for research and development (R&D) in the area of higher-performance materials:
• Thermoelectric Materials
• Phase-Stable Metallic Materials
• Surface Treatments
• Lightweight High-Strength Materials
theRMoeleCtRiC MAteRiAlsThermoelectric materials are used in devices that convert waste heat into useful electricity. Developing low-cost, stable thermoelectric materials with low thermal conductivities and simultaneous high electric conductivities (i.e., high ZT [figures of merit] values) can offer an efficient alternative to processes such as mechanical generation and refrigeration and can improve the harvesting of waste heat. As a result, these advances can increase energy and fuel efficiency in energy sectors. Opportunities in industrial processes and transportation provide quantifiable justification for pursuing R&D of thermoelectric materials.
Market Opportunity: Industrial Processes
During manufacturing a significant amount of energy is lost as heat. According to a recent report from the U.S. Department of Energy, unrecovered waste heat for the industrial processes analyzed in the report totaled 1,478 trillion British thermal units (TBtu) per year.1 Thus, low-cost, stable thermoelectric materials with high ZT values have the potential to benefit U.S. energy sectors significantly by aiding in the conversion of industrial waste heat into electricity—particularly low-temperature waste heat.
Developing thermoelectric materials with a ZT of 2 or greater may be able to provide thermal-to-electric efficiencies above 15%,2 which could displace a portion of purchased electricity. For example, if thermoelectric materials operating at 15% thermal-to-electric efficiency are applied to 1,478 TBtu of unrecovered waste heat, 222 TBtu of grid-generated electricity will be displaced,3 resulting in a reduction of approximately 42 million metric tons (MMT) of carbon dioxide (CO2)
4 and a cost savings of approximately $3.6 billion5 for the U.S. manufacturing sector.
Market Opportunity: Transportation
Approximately 40% of input energy to internal combustion vehicles is lost as waste heat in the exhaust gas.6 Stable thermoelectric materials with high ZT values can recover and convert waste heat into electricity without releasing CO2 emissions, improving vehicle fuel economy by reducing vehicle electrical power requirements placed on the engine (e.g., for lights, pumps, stability controls, navigation systems, stereo systems, electronic braking, and powertrain controllers and sensors). Advances in thermoelectric materials could help displace some portion of the 8,831 TBtu consumed by cars and 7,572 TBtu consumed by light-duty trucks each year.7 If thermoelectric materials development improves the total U.S. car and light-duty truck fleet fuel economy by 5% (identified by the U.S. Department of Energy Vehicle Technologies Program as a thermoelectric generator project objective), the resulting energy savings would total 781 TBtu,8 with a total CO2 emissions reduction of 53 MMT9 and a $25 billion reduction in vehicle fuel costs (assuming an estimated cost of motor gasoline of $3.98 per gallon or $31.84 per million Btu [MBtu]).10
Breakthrough Opportunities
The materials science and engineering (MSE) community can advance thermoelectric materials by improving manufacturing, developing materials with higher ZTs, improving sealants, and developing substitute materials. Addressing the gaps and
v. higheR-peRfoRMAnCe MAteRiAls
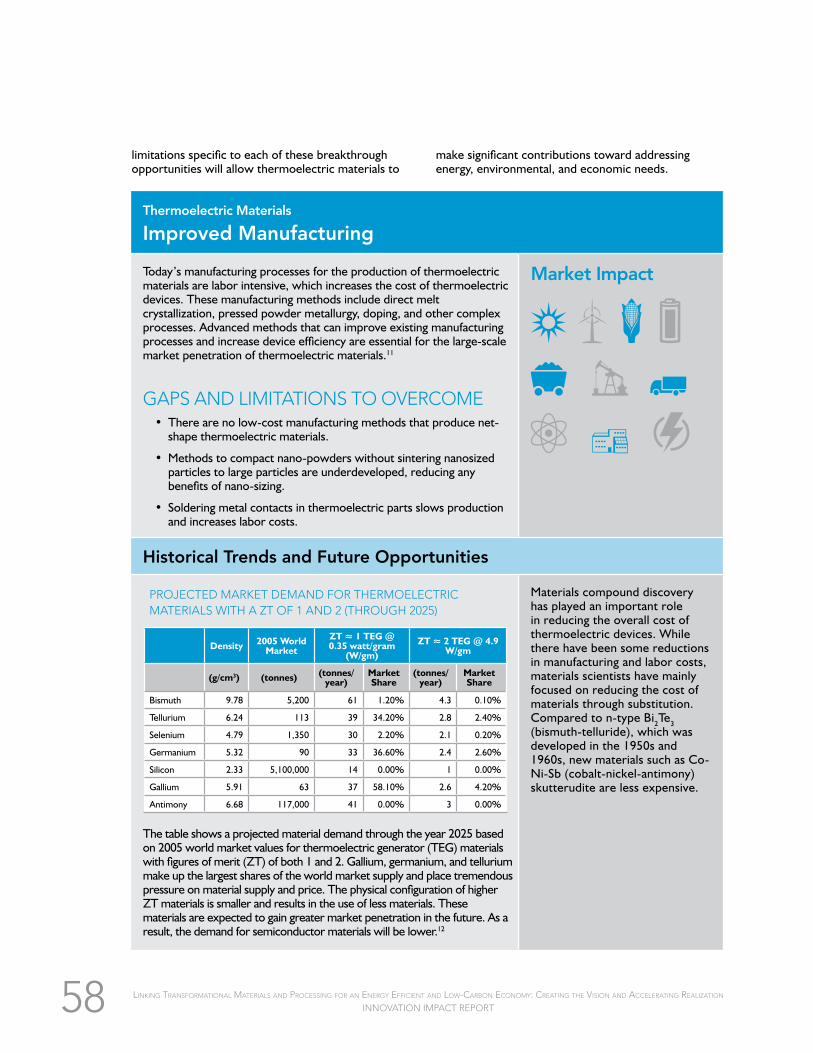
58
limitations specific to each of these breakthrough opportunities will allow thermoelectric materials to
make significant contributions toward addressing energy, environmental, and economic needs.
Thermoelectric Materials
Improved Manufacturing
Today’s manufacturing processes for the production of thermoelectric materials are labor intensive, which increases the cost of thermoelectric devices. These manufacturing methods include direct melt crystallization, pressed powder metallurgy, doping, and other complex processes. Advanced methods that can improve existing manufacturing processes and increase device efficiency are essential for the large-scale market penetration of thermoelectric materials.11
gAps And liMitAtions to oveRCoMe• There are no low-cost manufacturing methods that produce net-
shape thermoelectric materials.
• Methods to compact nano-powders without sintering nanosized particles to large particles are underdeveloped, reducing any benefits of nano-sizing.
• Soldering metal contacts in thermoelectric parts slows production and increases labor costs.
Market Impact
Historical Trends and Future Opportunities
The table shows a projected material demand through the year 2025 based on 2005 world market values for thermoelectric generator (TEG) materials with figures of merit (ZT) of both 1 and 2. Gallium, germanium, and tellurium make up the largest shares of the world market supply and place tremendous pressure on material supply and price. The physical configuration of higher ZT materials is smaller and results in the use of less materials. These materials are expected to gain greater market penetration in the future. As a result, the demand for semiconductor materials will be lower.12
Materials compound discovery has played an important role in reducing the overall cost of thermoelectric devices. While there have been some reductions in manufacturing and labor costs, materials scientists have mainly focused on reducing the cost of materials through substitution. Compared to n-type Bi2Te3 (bismuth-telluride), which was developed in the 1950s and 1960s, new materials such as Co-Ni-Sb (cobalt-nickel-antimony) skutterudite are less expensive.
pRojeCted MARket deMAnd foR theRMoeleCtRiC MAteRiAls with A zt of 1 And 2 (thRough 2025)
Density 2005WorldMarket
ZT≈[email protected]/gram
(W/gm)
ZT≈[email protected]/gm
(g/cm3) (tonnes) (tonnes/year)
MarketShare
(tonnes/year)
MarketShare
Bismuth 9.78 5,200 61 1.20% 4.3 0.10%
Tellurium 6.24 113 39 34.20% 2.8 2.40%
Selenium 4.79 1,350 30 2.20% 2.1 0.20%
Germanium 5.32 90 33 36.60% 2.4 2.60%
Silicon 2.33 5,100,000 14 0.00% 1 0.00%
Gallium 5.91 63 37 58.10% 2.6 4.20%
Antimony 6.68 117,000 41 0.00% 3 0.00%

59
Thermoelectric Materials
Higher Figure of Merit (ZT)
The efficacy of thermoelectric devices is measured by a dimensionless variable called the “figure of merit,” or “ZT.” Thermoelectric materials with high electrical conductivity, a high Seebeck coefficient, and low thermal conductivity have greater thermodynamic efficiencies and ZTs. Increasing the ZTs of these materials will improve the efficiency of waste heat harvesting, offering widespread opportunities to increase efficiency.
gAps And liMitAtions to oveRCoMe• The process of doping with p-type semiconductor materials
hinders the reliable and reproducable construction of thermoelectrics with high conversion efficiencies due to the self compensation of native defects.
• The current toxicity of thermoelectrics reduces their potential for large-scale use.
• Current materials and structures lack high ZT performance, and therefore produce low energy yields or require high production volumes to be affordable.
Market Impact
Historical Trends and Future Opportunities
zt of CoMMeRCiAlly AvAilAble theRMoeleCtRiC MAteRiAls
2.0
1.5
1.0
0.5
0.01990 2011 Future
FIG
UR
E O
F M
ERIT
(Z
T)
The current ZT of commercial thermoelectrics is equal to about 1 and has improved little over the past 20 years.13 Further advances in thermoelectric technologies and processing techniques have the potential to increase the ZT to about 1.8 due to new methods of raw material purification and advances in nanomanufacturing techniques.14
Figure of Merit (ZT)
• 1990: 1
• 2011: 1
• Future: 1.8

60
Thermoelectric Materials
Sealants
Sealants are used on thermoelectric generators to prevent moisture from degrading the performance of the thermoelectric element. Some thermoelectric materials have only demonstrated durability for space applications operating in vacuum environments; the long-term durability of these materials in air and at high temperatures has not been demonstrated. To enable the use of thermoelectric materials in automotive and industrial applications, thermoelectric elements will require coatings to protect them from oxidation at operating temperatures of 600°C and higher. In addition, these sealants must also survive thermal cycling, which requires excellent adhesion and a coefficient of thermal expansion that matches that of the materials the sealant is intended to protect.15
gAps And liMitAtions to oveRCoMe• Sealants require high thermal stability at around 1,000°C to be
reliable in commercial applications.
• Effective sealants of thermoelectric generators cannot guarantee long life at high temperatures or resist thermal cycling.
• There is insufficient fundamental understanding of the mechanisms and kinetics of the degradation of thermoelectric materials from elements in the atmosphere.
• Oxidation barriers with high-temperature capabilities for thermoelectric materials do not have the necessary thermomechanical durability.
Market Impact
Historical Trends and Future Opportunities
teMpeRAtuRes At whiCh theRMoeleCtRiC seAlAnts ARe theRMAlly stAble
1,200
1,000
800
600
400
200
0Past Present Future
TEM
PER
AT
UR
E (°
C)
Typical epoxy-based sealants, an earlier form of thermoelectric sealants, are limited to temperature operation lower than 300°C. Current thermoelectric materials presenting a ZT greater than 1 oxidize in the presence of air and moisture at 600°C; today’s sealants are effective up to this temperature limit. Future advancements in thermoelectric sealants must enable their use in harsh environments, such as in engines and industrial processes, at approximately 1,000°C.16
Thermal Stability (°C)
• Past: 300°C
• Present: 600°C
• Future: 1,000°C

61
Thermoelectric Materials
Substitute Materials
Common thermoelectric materials, such as bismuth telluride, contain toxic materials that are environmentally hazardous and difficult to recycle. Substitute materials, such as oxides and skutterudite thermoelectrics, consist of more environmentally friendly materials with high thermoelectric performance potential. Oxide thermoelectrics are composed of a superlattice structure that exhibits good electrical conductivity and low thermal conductivity. With further advances, their ZTs have the potential to improve to the level of common thermoelectrics. Because oxide thermoelectrics are less susceptible to oxidation, they may be suited for high-temperature operating environments.
gAps And liMitAtions to oveRCoMe• Few p-type materials devices are currently available, and synthesis
of p-type materials with the desired properties is challenging.17
• Materials design and property prediction capabilities do not yet allow scientists to narrow the list of potential thermoelectric materials.
Market Impact
Historical Trends and Future Opportunities
figuRes of MeRit foR n-type And p-type theRMoeleCtRiCs
1.4
1.2
1.0
0.8
0.6
0.4
0.2
0.0
2000
N-type P-type
2011 2020
FIG
UR
E O
F M
ERIT
(Z
T)
The ability for oxide thermoelectrics to substitute for telluride-type thermoelectric materials depends on improvements in ZT for low-temperature applications. Current n-type oxide thermoelectrics carry a ZT of 0.4, which has increased from 0.3 in the past 10–20 years. This value is expected to increase to 1.0 over the next 10 years. Ten to 20 years ago, the ZT of p-type oxide thermoelectrics was 0.8. Their current ZT of 1.0 is expected to increase to about 1.2 over the next 10 years.18
ZT of N-type
• 2000: 0.3
• 2011: 0.4
• 2020: 1
ZT of P-type
• 2000: 0.8
• 2011: 1
• 2020: 1.2

62
R&D Priority Activities: Thermoelectric Materials
To overcome the gaps and limitations within the thermoelectric materials breakthrough opportunities, the MSE community must focus their efforts on improving the ZT of current thermoelectrics, identifying substitute materials, improving processing techniques, and pursuing
other R&D activities provided in the following table. The table divides the priority activities for each research initiative by the time frame in which they are estimated to impact U.S. energy sectors: near term (0–2 years), mid term (2–5 years), and long term (5–10 years).
NEAR TERM (0–2 yEARS)
Sealants• Demonstrate effective sealing techniques (e.g., welding) on the generator level to operate
thermoelectric elements in argon or in a vacuum at 600°C.• Develop a fundamental understanding of the mechanisms of degradation of thermoelectric
materials in a vacuum and in air.• Develop an oxidation-protective coating for thermally stable thermoelectric materials.
SubstituteMaterials• Develop new synthetic routes for the purification of low-cost, low-purity raw materials to
develop low-cost, high-purity materials.• Consolidate the multiple steps involved in manufacturing substitute materials.
Crosscutting• Developarangeofthermoelectricpolymerstoenablewide-scaleapplicationofweight-optimizedcomponentsforuseindefense,automotive,andcommercialapplications.
MID TERM (2–5 yEARS)
HigherFigureofMerit(ZT)• Develophighlyconductivethermoelectricmaterialscompatiblewithadditivemanufacturingsystemstoenablecorrosion-resistant,highlyfunctionalpolymerdesignsformultifunctionalcomponentswithstructurallyintegratedpowerandcommunicationcircuits.
Sealants• Develop a cost-effective process to create a thermally stable, sealed generator at 600°C.• Demonstrate effective encapsulation of thermally stable thermoelectric materials in
isothermal, thermal-gradient, and thermo-cycling conditions.• Develop a cost-effective oxidation barrier coating process for thermoelectric materials.
SubstituteMaterials• Develop new low-cost thermoelectric materials with higher ZTs.• Advance new compacting processes in response to advances in nano-manufacturing.
LONG TERM (5–10 yEARS)
HigherFigureofMerit(ZT)• Developcapacitancematerialscompatiblewithadditivemanufacturingmethodstoenablestructurallyintegratedelectricalenergystoragesystems.
Sealants• Developanoxidationbarriercoatingforthermoelectricmaterialsoperatingat1,000°C.
• Demonstrate effective sealing techniques at the generator level to operate thermoelectric elements in argon or vacuums at 1,000°C.
SubstituteMaterials• Develop low-cost thermoelectric materials based on abundant, easily accessible materials
(e.g., oxides).
*The experts identified the boldedactivities as high priority.

63
phAse-stAble MetAlliC MAteRiAlsIncreasing the efficiency of electricity generation requires materials that can withstand harsh conditions, such as temperatures greater than 650°C, radiation, and the presence of aggressive substances, including sulfur, hydrogen, chlorine, and water. It is critical to use advanced techniques to develop phase-stable metallic materials that retain their strength, ductility, and dimensional stability when exposed to these conditions. The opportunity for these advances to ensure that electricity demand is met in an efficient, cost-effective, and environmentally friendly way provides quantifiable justification for pursuing R&D of phase-stable metallic materials.
Market Opportunity: Electricity Generation
In 2010, the total U.S. energy consumption for electricity generation by the electric power sector was 39,579 TBtu,19 40% of total U.S. energy consumption.20 Approximately 88% of this electricity was generated using steam turbine engines (61% of generating capacity) or gas turbine engines (27% of generating capacity).21 Incorporating
advanced phase-stable metallic materials capable of withstanding elevated inlet temperatures and harsh operating environments into the design of these turbines could greatly improve the efficiency of U.S. electricity generation. For example, a 1% reduction in fuel consumed by U.S. power-generating gas and steam turbines would save 348 TBtu of energy,22 $400 million in fuel costs23 to major investor-owned electric utilities (which represent only a portion of U.S. power producers), and 22 MMT of CO2 emissions from coal and natural gas combustion.24
Breakthrough Opportunities
The MSE community can advance phase-stable metallic materials by developing and improving next-generation steels, next-generation nickel-cobalt (Ni-Co), irradiation-resistant materials, and next-generation zirconium (Zr) cladding. Addressing the gaps and limitations specific to each of these breakthrough opportunities will allow phase-stable metallic materials to make significant contributions toward addressing energy, environmental, and economic needs.

64
Phase-Stable Metallic Materials
Next-Generation Steels
Steel is composed of iron and property-altering alloying elements. Next-generation steels must contain alloying elements that allow the steel to be phase-stable in extreme high-temperature environments. Some of the most promising steel compositions for use in demanding operating conditions are 9-chromium martensitic alloys, which have higher thermal conductivity and lower thermal expansion than their austenitic counterparts.
gAps And liMitAtions to oveRCoMe• Today’s steels cannot withstand the temperature that alternate
alloys can endure in steam turbine applications (about 1,400°F).
• Current steels are unable to safely reach operating lives of 250,000 hours in high-temperature and high-pressure environments.
Market Impact
Historical Trends and Future Opportunities
teMpeRAtuRe At whiCh steels ARe theRMAlly stAble
1,250
1,200
1,150
1,100
1,050
1,000
9501990 2011 2020
TEM
PER
AT
UR
E (°
F)
In the past 20 years, the use of new 9-chromium steels has increased the temperature stability of steels from about 1,065°F to 1,115°F. Further improvements to this steel in the next 5–10 years are expected to increase thermal stability to 1,200°F.
Thermal Stability (°F)
• 1990: 1,065°F
• 2011: 1,115°F
• 2020: 1,200°F

65
Phase-Stable Metallic Materials
Next-Generation Nickel-Cobalt
Nickel-based alloys are classified as superalloys due to their ability to maintain strength and resist creep, corrosion, and oxidation at high temperatures. Adding cobalt to nickel-based alloys helps promote the growth of nickel-aluminum and nickel-titanium intermetallics, which have an ordered austenitic or face-centered cubic crystal structure also known as the gamma-prime phase. This addition of cobalt improves the ability for nickel-based alloys to maintain their strength and resist degradation in high-temperature, high-pressure environments, such as those in steam turbines in coal-fired power plants.
gAps And liMitAtions to oveRCoMe• Because nickel-cobalt (Ni-Co) alloy ingots are resistant to
deformation at high temperatures, they are not well suited for hot-work processing.
• High levels of cobalt are not desired in alloys for nuclear applications because cobalt can damage pressurized water reactors if released from the structure.
• Nickel-based superalloys can fracture at high temperatures in high-pressure steam turbines.
Market Impact
Historical Trends and Future Opportunities
teMpeRAtuRe At whiCh niCkel-CobAlt Alloys ARe theRMAlly stAble
1,450
1,400
1,350
1,300
1,250
1,200
1,150
1,100
1,0501990 2011 Future
TEM
PER
AT
UR
E (°
F)
Over the past 20 years, Ni-Co alloys have increased their thermal stability from 1,200°F to 1,400°F. Future advances in Ni-Co alloys have the potential to raise the operating temperature to approximately 1,425°F, while still remaining phase-stable.
Thermal Stability (°F)
• 1990: 1,200°F
• 2011: 1,400°F
• Future: 1,425°F

66
Phase-Stable Metallic Materials
Irradiation-Resistant Materials
Irradiation-resistant materials—often stainless steel hard facings—are strong, stiff materials that are able to resist deformation and dimensional swelling when exposed to radiation. Therefore, these materials are commonly used in nuclear reactors to increase the overall efficiency of nuclear electricity generation and increase the lifetime and uptime of a plant. They are also easy to recycle and dispose of when they reach the end of their useful life.
gAps And liMitAtions to oveRCoMe• Corrosion in the reactor causes cobalt from irradiation-resistant
hard facings to enter the cooling stream, potentially discharging the poisonous compound into nearby water supplies.
• Irradiation-resistant hard facings also contain chromium and molybdenum to raise the corrosion and oxidation resistance of stainless steels. Lowering or altering the amount of these alloys to reduce the risk of introducing them into the nuclear reactor cooling stream may result in adverse effects. Materials scientists must find a balance between the need for high alloy content to resist corrosion and the need to avoid cooling stream contamination.
Market Impact
Historical Trends and Future Opportunities
nuCleAR ReACtoR uptiMe And lifetiMe
90
80
70
60
50
40
30
20
10
0
LIFE
TIM
E (Y
EAR
S)
100908070605040302010
0
1970s 2011 2020 1980s 2011 2020
UP
TIM
E (%
)
Reactor uptime and lifetime are key metrics that reflect the benefits of increased irradiation resistance. The removal of impurities from irradiation-resistant materials has increased reactor uptime from 60% to 92% since the 1970s.25
Changing the alloy composition (e.g., decreasing chromium and molybdenum concentrations) has also increased reactor lifetime from 20 to 60 years since the 1980s.26 In the next 10 years, uptime is expected to increase to 94% and lifetime is expected to increase to 80 years.
Uptime• 1970s: 60%• 2011: 92%• 2020: 94%
Lifetime • 1980s: 20 years• 2011: 60 years• 2020: 80 years
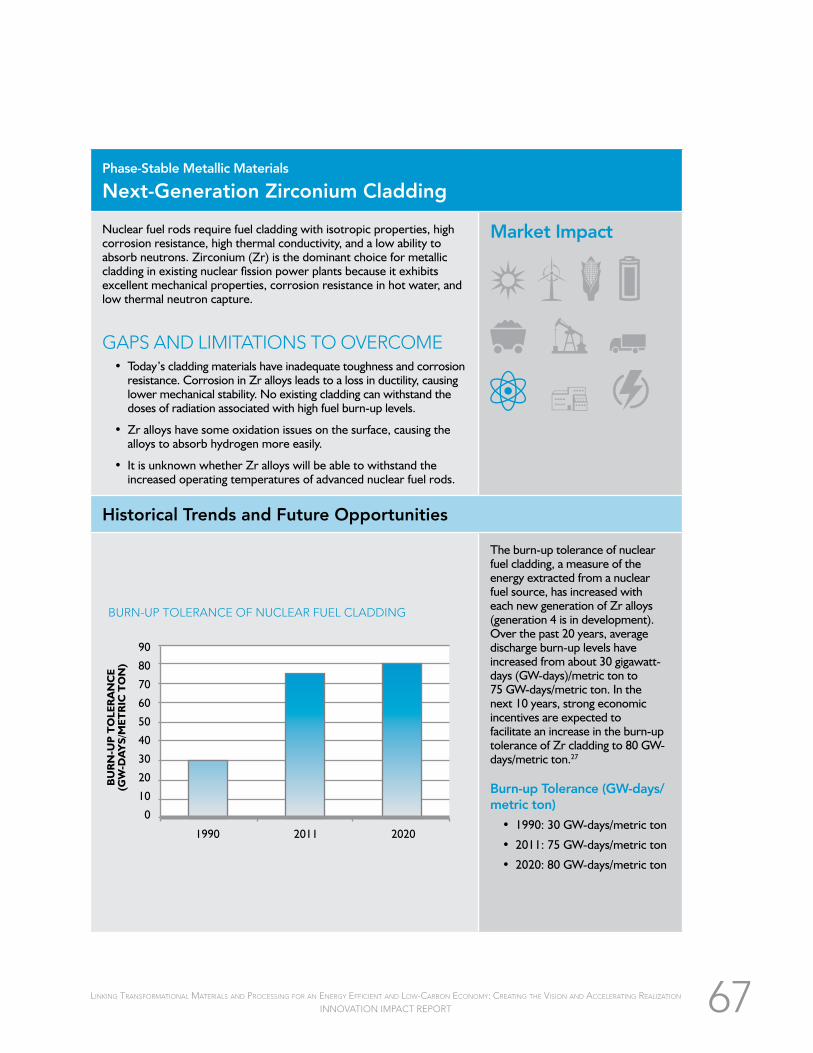
67
Phase-Stable Metallic Materials
Next-Generation Zirconium Cladding
Nuclear fuel rods require fuel cladding with isotropic properties, high corrosion resistance, high thermal conductivity, and a low ability to absorb neutrons. Zirconium (Zr) is the dominant choice for metallic cladding in existing nuclear fission power plants because it exhibits excellent mechanical properties, corrosion resistance in hot water, and low thermal neutron capture.
gAps And liMitAtions to oveRCoMe• Today’s cladding materials have inadequate toughness and corrosion
resistance. Corrosion in Zr alloys leads to a loss in ductility, causing lower mechanical stability. No existing cladding can withstand the doses of radiation associated with high fuel burn-up levels.
• Zr alloys have some oxidation issues on the surface, causing the alloys to absorb hydrogen more easily.
• It is unknown whether Zr alloys will be able to withstand the increased operating temperatures of advanced nuclear fuel rods.
Market Impact
Historical Trends and Future Opportunities
buRn-up toleRAnCe of nuCleAR fuel ClAdding
90
80
70
60
50
40
30
20
10
0
1990 2011 2020
BU
RN
-UP
TO
LER
AN
CE
(GW
-DA
YS/
MET
RIC
TO
N)
The burn-up tolerance of nuclear fuel cladding, a measure of the energy extracted from a nuclear fuel source, has increased with each new generation of Zr alloys (generation 4 is in development). Over the past 20 years, average discharge burn-up levels have increased from about 30 gigawatt-days (GW-days)/metric ton to 75 GW-days/metric ton. In the next 10 years, strong economic incentives are expected to facilitate an increase in the burn-up tolerance of Zr cladding to 80 GW-days/metric ton.27
Burn-up Tolerance (GW-days/metric ton)
• 1990: 30 GW-days/metric ton
• 2011: 75 GW-days/metric ton
• 2020: 80 GW-days/metric ton

68
R&D Priority Activities: Phase-Stable Metallic Materials
To overcome the gaps and limitations within the phase-stable metallic materials breakthrough opportunities, the MSE community must focus their efforts on developing new alloys, improving materials data availability, and pursuing other R&D activities
provided in the following table. The table divides the priority activities for each research initiative by the time frame in which they are estimated to impact U.S. energy sectors: near term (0–2 years), mid term (2–5 years), and long term (5–10 years).
NEAR TERM (0–2 yEARS)
Next-GenerationSteels• Createhigh-strength,low-alloysteelforultra-deep-welldrilling.
Next-GenerationNickel-Cobalt• Develop low-cost nickel superalloys for well completion and oil production activities.• Gather long-term performance data (e.g., gamma prime coarsening in nickel-based
superalloys) to improve understanding of how alloys developed for aerospace can transfer to stationary uses.
Next-GenerationZirconiumCladding• Developcorrosion-resistantZralloyswithreducedhydrogenpickup.
Crosscutting• Conduct technology transfer of microwave heat treatment systems developed for
radioactive waste handling.
MID TERM (2–5 yEARS)
Next-GenerationSteels• Developstress-corrosion-cracking-resistantstainlesssteelvariants(e.g.,AISI304and316steels)forreactorapplications.
• Develop1,200°Fsteelsforuseinpowerplantsteamturbines.
Crosscutting• Developirradiation-resistantpressurevesselsteels(e.g.,A508andA533steels)(Next-GenerationSteelsandIrradiation-ResistantMaterials).
• Createphysics-basedmodelstopredictcomponentlifetimeinpowerplants.• Develop high-strength titanium for long, low-pressure turbine blades.
LONG TERM (5–10 yEARS)
Next-GenerationZirconiumCladding• Identifyalternatefuelcladdingmaterials(e.g.,siliconcarbidemetal-matrixcomposites).
Crosscutting• Developoxidation-andcorrosion-resistantrefractoryalloysfornext-generationgasturbines.
• Developamaterialsdatabasetoenablemoreaccuratecomputationaldesign. » First principles, molecular dynamics data, and modeling are still under development and
are needed to assess minor element additions to improve alloys.• Usenewphasediagramstocreatemoreaccuratethermomechanicalprocessingandheattreatingofsteels.
• Develop metallic glasses and high-entropy alloys for coatings and functional materials.• Create activation-resistant alloys for nuclear applications (i.e., extract niobium and other
elements, tailor for nuclear-specific application and recycling).
*The experts identified the boldedactivities as high priority.

69
suRfACe tReAtMentsSurface treatments, such as thermal spraying and laser deposition, can enhance the damage tolerance of materials, protect materials from harsh service environments, and repair surface fatigue, which increases the service life of products and reduces the need to manufacture new parts. Improving the strength and tolerance of surface treatments for both new and restored parts in demanding service environments can extend the life and robustness of substrate materials. Opportunities to restore or remanufacture parts in transportation and electricity generation sectors provide quantifiable justification for pursuing R&D of surface treatments.
Market Opportunity: Transportation
Remanufacturing parts can reduce energy consumption to only 2%–25% of the energy required to manufacture new parts.28 Given this potential for energy savings, surface treatments that extend material life have significant potential to benefit the U.S. transportation sector. According to a recent study from the International Academy for Production Engineering, 17 MBtu of energy is consumed while manufacturing one new diesel engine, while only 10% of that energy—1.8 MBtu—is required to remanufacture the engine.29 Advanced surface treatments of ferrous- and aluminum-based vehicle engine components can reduce this energy consumption while also reducing emissions and overall vehicle cost. Remanufacturing 1 million engines instead of manufacturing new engines could result in 15 TBtu in energy savings,30 with a total CO2 emissions reduction of nearly 1 MMT.31 In addition, this growth of the remanufacturing industry would create skilled labor jobs throughout the United States.
Market Opportunity: Electricity Generation
In 2010, the total U.S. energy consumption for electricity generation by the electric power sector was 39,579 TBtu,32 40% of total U.S. energy consumption.33 Approximately 88% of this electricity is generated using steam turbine engines (61% of generating capacity), or gas turbine engines (27% of generating capacity).34 Surface treatments can be used to improve the tolerance of steam and gas turbine blades to wear, corrosion, and fatigue, extending turbine life, increasing the efficiency of the turbine in comparison to turbines with untreated surfaces, and decreasing downtime in the electricity generating process. More energy-efficient gas and steam turbines can decrease the consumption of natural gas and coal for electricity generation, reducing emissions and fuel costs. For example, a 1% reduction in fuel consumption as a result of surface treatments in both U.S. power-generating gas and steam turbines used by the electric power sector could save 348 TBtu of energy,35 $400 million in fuel costs to major investor-owned utilities (which represent only a portion of electric power producers),36 and 22 MMT of CO2 emissions from coal and natural gas combustion.37
Breakthrough Opportunities
The MSE community can advance surface treatment materials by focusing on part restoration and surface processing. Addressing the gaps and limitations specific to each of these breakthrough opportunities will allow surface treatments to make significant contributions toward addressing energy, environmental, and economic needs.

70
Surface Treatments
Part Restoration
Surface treatment materials for part restoration enable the remanufacturing of used system components, avoiding the need for the costly manufacturing of new components. Thermal spraying, the most common surface restoration technique, was developed in the 1950s and can be applied to a substrate through chemical, physical, or electroplating deposition techniques. Laser cladding techniques were introduced in the early 2000s; the two techniques are now being combined into laser-assisted thermal spray hybrid techniques to address diffusion bonding surface issues.
gAps And liMitAtions to oveRCoMe• Current laser cladding techniques are time-intensive and expensive,
leaving the techniques greatly underdeveloped.
• Many companies do not have access to testing facilities that ensure proper surface adhesion/bonding.
Market Impact
Historical Trends and Future Opportunities
1950s 2011 2020
INCREASE IN AMOUNT OF REMANUFACTURING
50% 25%
1950s 2011 2020
IMPROVEMENT IN MECHANICAL DURABILITY OF RESTORED PARTS
5x 5x
Advances in part restoration treatment can be measured by mechanical durability, which includes hardness, density, adhesive and cohesive strength, and wear and corrosion resistance. Mechanical durability has improved by 5x since the 1950s and is expected to improve by 5x over the next 10 years.38
Remanufacturing avoids a portion of the cost of manufacturing new parts. Remanufacturing has increased by 50% since the 1950s and is expected to increase by 25% over the next 10 years.39
Mechanical Durability
• 1950s–2011: 5x improvement
• 2011–2020: 5x improvement
Amount of Remanufacturing
• 1950s–2011: 50% increase
• 2011–2020: 25% increase

71
Surface Treatments
Surface Processing
Surface treatments are applied to new parts to improve resistance to wear, corrosion, high temperatures, and fatigue, and ultimately to increase part life. Techniques for applying surface treatments include shot-peening, thermal sprays, and laser technologies. First-generation thermal sprays were developed in the 1950s, and laser cladding techniques were introduced in the early 2000s. The newest hybrid approaches combine laser processing with thermal spray to create diffusion bonds between the coating and substrates that increase bond strength and fatigue resistance.
gAps And liMitAtions to oveRCoMe• Current laser cladding surface processing techniques have slow
processing rates and are too expensive, leaving the techniques greatly underdeveloped.
• Many companies do not have access to testing facilities necessary to ensure proper surface adhesion/bonding of parts.
Market Impact
Historical Trends and Future Opportunities
1950s 2011 2020
IMPROVEMENT IN MECHANICAL DURABILITY OF SURFACE-TREATED PARTS
5x 5x
Historical performance of surface processing treatments can be measured by mechanical durability, which includes hardness, density, adhesive and cohesive strength, and wear and corrosion resistance. These durability trends follow the same historical improvement as part restoration surface treatments. Mechanical durability has improved by 5x since the 1950s and is expected to improve by 5x over the next 10 years.40
Mechanical Durability
• 1950s–2011: 5x improvement
• 2011–2020: 5x improvement

72
R&D Priority Activities: Surface Treatments
To overcome the gaps and limitations within the surface treatments breakthrough opportunities, the MSE community must focus their efforts on identifying new surface treatment materials, advancing processing techniques, and pursuing other R&D activities provided
in the following table. The table divides the priority activities for each research initiative by the time frame in which they are estimated to impact U.S. energy sectors: near term (0–2 years), mid term (2–5 years), and long term (5–10 years).
NEAR TERM (0–2 yEARS)
PartRestoration• Createausertestfacilityforremanufacturedpartstesting.
SurfaceProcessing• Identify coatings that are resistant to hot corrosion (i.e., oxidation assisted by salts) for use in
engines.
Crosscutting• Developlower-costcoatingmaterialsthatarevalidatedforuseandhaveappropriatecost-performancespecifications,ratherthanoverdesigningcoatingsashappenstoday.
MID TERM (2–5 yEARS)
PartRestoration• Develop resurfacing technologies for corrosion-resistant alloys.• Identify testing technologies for reconfigured parts that accurately predict long-term
performance.
SurfaceProcessing• Developlow-costlaserhybridprocessingthatcanmetallurgicallybondsurfacelayers.
• Conducthighlyaccuratenon-planarorlarger-scalesurfacetreatingwithoutdamagingsubstrates(e.g.,laser,high-densityinfrared,high-precisionhybriddeposition).
• Develop non-chromate coatings for corrosion resistance.• Create powder-metallurgy coating technology for valves, pumps, and bearings (e.g., for
cobalt-free bearings that require wear-resistant coatings).• Develop coatings for steam turbines that are capable of operating at temperatures above
1,400°F and resist erosion from oxidation products often formed in boiler tubes during shutdown.
Crosscutting• Achieve better interface modeling of microstructures, starting by focusing on specific surface
treatments (e.g., thermal barrier coatings).
LONG TERM (5–10 yEARS)
SurfaceProcessing• Developceramicsforgasturbineparts(e.g.,airfoils).• Developultra-high-temperature(~1,600°F)thermalbarriercoatingsforoxy-combustionturbines.
» Develop new materials/coatings. » Reduce or lower oxygen penetration to base materials. » Ensure low thermal conductivity to protect base metal strength. » Tailor architecture to whole system.
Crosscutting• Create thermomechanical processing of surfaces for crack removal and life extension.
*The experts identified the boldedactivities as high priority.

73
lightweight high-stRength MAteRiAlsDecreasing the weight of a system component can reduce system load and increase efficiency but can also compromise the strength of the material. Advanced lightweight high-strength materials, such as composites, aluminum, magnesium, titanium, certain steel alloys, hybrid materials, and polymer-based materials, can reduce component weight without sacrificing robustness. Increasing the tolerance of these lightweight high-strength materials to wear and corrosion, reducing their cost, and streamlining manufacturing processes can increase their use in demanding energy applications. As a result, these advances can improve the energy and fuel efficiency of energy sectors. Opportunities to restore or remanufacture parts in transportation and electricity generation sectors provide quantifiable justification for pursuing R&D of lightweight high-strength materials.
Market Opportunity: Transportation
Because vehicles consume 70%–90% of their lifetime energy consumption during use,41 the development of advanced lightweight high-strength materials has significant potential to benefit the U.S. transportation sector. A systems approach to vehicle weight reduction can optimize the use of lightweight high-strength materials, including magnesium, carbon-
fiber composites, polymers, aluminum, and gradient materials, in vehicle design. By using this approach, automotive designers can develop lighter-weight vehicle designs that can increase fuel efficiency, reduce emissions, and decrease fuel costs while using smaller engines to achieve the same level of performance. A study from the Massachusetts Institute of Technology estimates that for every 10% reduction in vehicle weight, fuel economy could increase by 6% for cars and 8% for light-duty trucks.42 Considering that the annual U.S. energy consumption of cars and light-duty trucks is above 16,000 TBtu,43 reducing the vehicle weight of cars and light-duty trucks by 10% with lightweight high-strength materials could save 1,060 TBtu of energy,44 72 MMT of CO2 emissions,45 and $34 billion in fuel costs each year (assuming an estimated cost of motor gasoline of $3.98 per gallon or $31.84 per MBtu).46
Breakthrough Opportunities
The MSE community can advance lightweight high-strength materials by focusing on low-cost processing and synthesis and hybrid materials. Addressing the gaps and limitations specific to each of these breakthrough opportunities will allow lightweight high-strength materials to make significant contributions toward addressing energy, environmental, and economic needs.

74
Lightweight High-Strength Materials
Processing and Synthesis
Lightweight high-strength materials, such as composites, aluminum, magnesium, titanium, high-strength steel alloys, hybrid materials, and polymer-based materials, are limited by costly and energy-intensive synthesis processes. For example, lightweight high-strength steels used in automotive applications (e.g., transformation-induced plasticity steel [TRIP] and twinning-induced plasticity steel [TWIP]) require complex, costly heat treatments.47 To bring down the cost of these and other synthesis processes for lightweight high-strength materials, materials scientists must develop more efficient processes with fewer steps and reduced energy requirements.
gAps And liMitAtions to oveRCoMe• Current processing and synthesis of lightweight alloys produces
materials with inadequate wear and corrosion properties.
• No low-cost synthesis, processing, or manufacturing technologies exist for titanium, magnesium, and composites that can meet targeted costs and weight reductions as well as desired materials properties.
Market Impact
Historical Trends and Future Opportunities
oveRAll peRfoRMAnCe of lightweight high-stRength MAteRiAls
1990 1995 2000 2005 2010 2015 2020
OV
ERA
LL P
ERFO
RM
AN
CE
+10% per decade
Advances in the processing techniques of lightweight high-strength materials can be measured by overall performance improvements, which include advances in microstructural control, specific strength and stiffness, and fatigue resistance.48 Performance of lightweight high-strength materials has improved at about 10% per decade for the past 20 years. This trend is expected to continue over the next 10 years.49
Overall Performance
• 1990–2011: 10% improvement per decade
• 2011–2020: 10% improvement

75
Lightweight High-Strength Materials
Hybrid Materials
Hybrid materials vary in structure and/or composition throughout a component, which causes a gradient or change in properties throughout the material. This variation is achieved by combining dissimilar materials via novel co-processing. These processes involve a combination of depositing powder metals onto a substrate with incremental changes in the powder composition, layering dissimilar materials in a single step (no secondary manufacturing), and using other structural marriage processes of advanced alloys in sheet, plate, or extruded form. Composites that have anisotropic properties and may be cast using a fiber preform that is infiltrated with resin—a type of co-casting—are also considered hybrid materials. Fiber metal laminate is a new class of metallic materials that combines metals, fibers, and matrix resins.
gAps And liMitAtions to oveRCoMe• Few integration strategies exist for dissimilar materials systems, such
as automotive body structures. Interfacial properties of composites including dissimilar materials are unknown.
• Many of these processes are newly patented and have unknown impacts on the field of gradient materials.
Market Impact
Historical Trends and Future Opportunities
hybRid MAteRiAl weight ReduCtion
100
75
50
25
02011 2020
BA
SELI
NE
HY
BR
ID M
AT
ERIA
L W
EIG
HT
(201
1 W
EIG
HT
= 1
00%
)
-25% Weight
Hybrid materials are a relatively new technology. Major advancements in hybrid materials over the next 10 years are expected to yield a 25% decrease in weight and an increase in overall performance of specific strength, specific stiffness, and fatigue resistance.50
Overall Performance
• 2020: 25% weight reduction

76
R&D Priority Activities: Lightweight High-Strength Materials
To overcome the gaps and limitations within the lightweight high-strength materials breakthrough opportunities, the MSE community must focus their efforts on improving processing techniques, identifying new alloy designs, and pursuing other R&D activities
provided in the following table. The table divides the priority activities for each research initiative by the time frame in which they are estimated to impact U.S. energy sectors: near term (0–2 years), mid term (2–5 years), and long term (5–10 years).
NEAR TERM (0–2 yEARS)
ProcessingandSynthesis• Developlow-cost,improvedprocessingmethodsofaluminum-,magnesium-,andmetal-basedcompositesforcasting.
HybridMaterials• Improvewearresistanceviaagradient-typeapproachorsurfacetreatmentofaluminum,magnesium,andotherlightweight,high-strengthmaterials.
• Identifytoptransportationopportunitiesforcustomoptimizedhybrid/gradientmetallicsystems.
MID TERM (2–5 yEARS)
ProcessingandSynthesis• Improve machining processes for titanium alloys.
GradientMaterials• Developnewalloydesignswithhigheralloyretentionforbetterrecyclability.• Improvedamagedetectiontechniquesfordefectsandmechanicalreliabilityofalltypesofmaterialsystems.
• Increasecorrosionresistanceofaluminumormagnesiumviasurfacetreatmentand/oralloyingapproaches.
• Develop steels with higher strength and elongation (TWIP and TRIP) to improve the strength-ductility trade-off.
Crosscutting• Improve thermal/diffusion modeling for designing hybrid/gradient materials.
LONG TERM (5–10 yEARS)
Crosscutting• Develop secondary manufacturing processes for gradient material components.• Develop next-generation polymers for use in cars.
*The experts identified the boldedactivities as high priority.

77
notes1 BCS Incorporated for the U.S. Department of Energy (DOE) Industrial
Technologies Program (ITP), Waste Heat Recovery: Technology and Opportunities in U.S. Industry, (Washington, DC: DOE ITP, 2008), 53, http://www1.eere.energy.gov/industry/intensiveprocesses/pdfs/waste_heat_recovery.pdf. The calculation of unrecovered waste heat uses a reference temperature of 77°F (25°C).
2 Pacific Northwest National Laboratory and BCS Incorporated for the U.S. Department of Energy (DOE) Industrial Technologies Program (ITP), Engineering Scoping Study of Thermoelectric Generator Systems for Industrial Waste Heat Recovery, (Washington, DC: DOE, November 2006), http://www1.eere.energy.gov/industry/imf/pdfs/teg_final_report_13.pdf.
3 BCS Incorporated for the U.S. Department of Energy (DOE) Industrial Technologies Program (ITP), Waste Heat Recovery: Technology and Opportunities in U.S. Industry, (Washington, DC: DOE ITP, 2008), 53, http://www1.eere.energy.gov/industry/intensiveprocesses/pdfs/waste_heat_recovery.pdf. Calculation: 222 TBtu = 1,478 TBtu * 15%.
4 Prepared by Energetics Incorporated for the Industrial Technologies Program, “Energy and Carbon Footprint: All Manufacturing Sectors,” 2010, accessed August 29, 2011, http://www1.eere.energy.gov/industry/pdfs/mfg_footprint.pdf. Calculation: 42 MMTCO2 = (222 TBtu/2,850 TBtu) * 544 MMTCO2; calculation assumes offsite electricity is displaced, as compared to onsite generated electricity.
5 U.S. Census Bureau, “2009 Annual Survey of Manufactures,” December 3, 2010, accessed August 29, 2011, http://factfinder.census.gov/servlet/IBQTable?_bm=y&-ds_name=AM0931GS101. Calculation: $3.6 billion = (222 TBtu/2,850 TBtu) * $46 billion.
6 U.S. Department of Energy (DOE) Vehicular Thermoelectric Generator (TEG) Project Objectives (presentation by John W. Fairbanks, Vehicular Thermoelectrics: A New Green Technology, DOE Thermoelectric Applications Workshop, Coronado, CA, January 3–8, 2011).
7 Oak Ridge National Laboratory, Transportation Energy Data Book 29th Edition, Transportation Energy Use by Mode 2007–2008, (Washington, DC: U.S. Department of Energy, July 2010), Table 2.6, http://cta.ornl.gov/data/tedb29/Spreadsheets/Table2_06.xls.
8 Ibid. A 5% increase in fuel economy results in a 4.76% decrease in fuel consumption. Calculation: 781 TBtu = (8,831 TBtu + 7,572 TBtu) * 4.76%.
9 Oak Ridge National Laboratory, Transportation Energy Data Book 29th Edition, Transportation Energy Use by Mode 2007–2008 (Washington, DC: U.S. Department of Energy, July 2010), Table 11.7, http://cta.ornl.gov/data/tedb29/Spreadsheets/Table11_07.xls. Calculation: 53 MMTCO2 = 1,113 MMTCO2 * 4.76%.
10 Oak Ridge National Laboratory, Transportation Energy Data Book 29th Edition, Transportation Energy Use by Mode 2007–2008, (Washington, DC: U.S. Department of Energy, July 2010), Table 2.6, http://cta.ornl.gov/data/tedb29/Spreadsheets/Table2_06.xls; U.S. Energy Information Administration (EIA), Monthly Energy Review, June 2011 (Washington, DC: EIA, 2011), Table 9.4, http://www.eia.gov/totalenergy/data/monthly/pdf/sec9_6.pdf; U.S. EIA, Annual Energy Review 2009 (Washington, DC: EIA, August 2010), Appendix A, Table A1 http://www.eia.gov/totalenergy/data/annual/pdf/sec13_1.pdf; EIA, “Oil Crude and Petroleum Products Explained: Data and Statistics,” last updated July 5, 2001, accessed July 13, 2011, http://www.eia.gov/energyexplained/index.cfm?page=oil_home#tab2U.S. Note that the price of motor gasoline is used in this example for simplicity purposes. Using diesel in these examples would yield different results because of differences in prices and heat content. Cost of motor gasoline based on $3.98 per gallon or $31.84 per MBtu, including taxes, (EIA, Monthly Energy Review, May 2011), energy content for motor gasoline of 5.253 MBtu per barrel (EIA, Annual Energy Review 2009), barrel to gallon conversion for petroleum products of 42 gallons per barrel (EIA, “Oil Crude and Petroleum Products Explained: Data and Statistics”). Calculation: $25 billion = $522 billion * 4.76%.
11 A. J. Minnich et al., “Bulk Nanostructured Thermoelectric Materials: Current Research and Future Prospects,” Energy & Environmental Science 2, no. 5 (2009): 466; Kunihito Koumoto et al., “Oxide Thermoelectric Materials: A Nanostructuring Approach,” Annual Review of Materials Research 40 (2010): 363; Christopher J. Vineis et al., “Nanostructured Thermoelectrics: Big Efficiency Gains from Small Features,” Advanced
Materials 22, no. 36 (2010): 3,970; Holger Kleinke, “New Bulk Materials for Thermoelectric Power Generation: Clathrates and Complex Antimonides,” Chemistry of Materials 22, no. 3 (2010): 604.
12 Pacific Northwest National Laboratory and BCS Incorporated for the U.S. Department of Energy (DOE) Industrial Technologies Program (ITP), Engineering Scoping Study of Thermoelectric Generator Systems for Industrial Waste Heat Recovery, (Washington, DC: DOE, November 2006), http://www1.eere.energy.gov/industry/imf/pdfs/teg_final_report_13.pdf.
13 Ibid.
14 Ibid.
15 Corning Incorporated, (PowerPoint presentation, U.S. Department of Energy, first meeting, May 23, 2011).
16 Ibid.; E. Godlewska et al., “Protective Coating to Suppress Degradation of CoSb3 Thermoelectric at Elevated Temperatures,” Ceramic Materials 62, no. 4 (2010): 490–495; Jong-Ah Paik et al., “Aerogels as a Sublimation Suppression Layer for Thermoelectric Power System,” (presentation, Materials Research Society 2005 Spring Meeting, San Francisco, CA, March 28–April 1, 2005).
17 The Minerals, Metals, & Materials Society (TMS) in support of the U.S. Department of Energy (DOE) Industrial Technologies Program, Linking Transformational Materials and Processing For an Energy-Efficient and Low-Carbon Economy: Creating the Vision and Accelerating Realization (Washington, DC: TMS, 2010), 18.
18 Koumoto et al., “Oxide Thermoelectric Materials: A Nanostructuring Approach,” Annual Review of Materials Research, 40 (2010); E. Godlewska et al., “Protective Coating to Suppress Degradation of CoSb3 Thermoelectric at Elevated Temperatures,” Ceramic Materials 62, no. 4 (2010): 490–495.
19 U.S. Energy Information Administration (EIA), Monthly Energy Review, May 2011 (Washington, DC: EIA, 2011), Table 2.6, http://www.eia.gov/totalenergy/data/monthly/pdf/sec2_13.pdf.
20 Ibid, Table 2.1, http://www.eia.gov/totalenergy/data/monthly/pdf/sec2_3.pdf.
21 U.S. Energy Information Administration, Form EIA-860, “Annual Electric Generator Report,” http://www.eia.gov/cneaf/electricity/ page/capacity/existingunits2008.xls.
22 U.S. Energy Information Administration (EIA), Monthly Energy Review, May 2011 (Washington, DC: EIA, May 2011), Table 2.1, http://www.eia.gov/totalenergy/data/monthly/pdf/sec2_3.pdf; EIA, Form EIA-860, “Annual Electric Generator Report,” http://www.eia.gov/cneaf/electricity/page/capacity/existingunits2008.xls. Calculation: 348 TBtu = 39,579 * (88%) * 1%; calculation assumes equal capacity factors of various generation technologies.
23 U.S. Energy Information Administration (EIA), Electric Power Annual (Washington, DC: EIA, April 2011), Table 8.1, http://www.eia.doe.gov/cneaf/electricity/epa/epat8p1.html.
24 U.S. Energy Information Administration (EIA), Monthly Energy Review, May 2011 (Washington, DC: EIA, 2011), Table 12.1, http://www.eia.gov/totalenergy/data/monthly/pdf/sec12_9.pdf. Calculation: 22 MMTCO2 = 1% * (1,828 MMTCO2 + 399 MMTCO2).
25 Nuclear Energy Institute, “Resources & Stats: U.S. Nuclear Power Plants,” 2011, accessed August 30, 2011, http://www.nei.org/resourcesandstats/nuclear_statistics/usnuclearpowerplants/.
26 Ibid.
27 “Rosa yang et al., “Fuel R&D to Improve Fuel Reliability,” Journal of Nuclear Science and Technology 43, no. 9 (2006): 951–959.
28 John Sutherland et al., “A Comparison of Manufacturing and Remanufacturing Energy Intensities with Application to Diesel Engine Production,” CIRP Annals - Manufacturing Technology 57, no. 1 (2008), 5–8; Timothy Gutowski et al., “Remanufacturing and Energy Savings,” Environmental Science and Technology 45 (2011), 4,540–4,547.
29 Sutherland et al., “A Comparison of Manufacturing and Remanufacturing Energy Intensities,” 5–8.
30 Calculation: (17 MBtu – 1.8 MBtu) * 1,000,000 = 15.2 TBtu.

78
31 Calculated by examining energy consumption and CO2 emissions in the transportation equipment industry (NAICS 336) based on Energy and Carbon Footprints, Department of Energy, Industrial Technologies Program, http://www1.eere.energy.gov/industry/pdfs/transport_footprint.pdf.
32 U.S. Energy Information Administration (EIA), Monthly Energy Review, May 2011 (Washington, DC: EIA, 2011), Table 2.6, http://www.eia.gov/totalenergy/data/monthly/pdf/sec2_13.pdf.
33 U.S. Energy Information Administration (EIA), Monthly Energy Review, May 2011 (Washington, DC: EIA, 2011), Table 2.1, http://www.eia.gov/totalenergy/data/monthly/pdf/sec2_3.pdf.
34 U.S. Energy Information Administration, Form EIA-860, “Annual Electric Generator Report,” http://www.eia.gov/cneaf/electricity/ page/capacity/existingunits2008.xls.
35 Calculation for natural gas consumption: 108 TBtu = 39,579 * (27.3%) *1% (calculation assumes equal capacity factors of various generation technologies); calculation for coal consumption: 240 TBtu = 39,579 TBtu * 60.7% * 1% (calculation assumes equal capacity factors of various generation technologies); 348 TBtu = 108 TBtu + 240 TBtu.
36 U.S. Energy Information Administration (EIA), Electric Power Annual (Washington, DC: EIA, April 2011) Table 8.1, http://www.eia.doe.gov/cneaf/electricity/epa/epat8p1.html.
37 U.S. Energy Information Administration (EIA), Monthly Energy Review, May 2011 (Washington, DC: EIA, 2011), Table 12.1, http://www.eia.gov/totalenergy/data/monthly/pdf/sec12_9.pdf; Calculation for natural gas: 4 MMTCO2 = 1% * 399 MMTCO2; Calculation for coal: 18 MMTCO2 = 1% * 1,828 MMTCO2; 22 MMTCO2 = 4 MMTCO2 + 18 MMTCO2.
38 A.S. Khanna et al., “Hard Coatings Based on Thermal Spray and Laser Cladding,” International Journal of Refractory Metals and Hard Materials 27, no. 2 (2009): 485–491; Matthew Bray, Andrew Cockburn, and William O’Neill, “The Laser-Assisted Cold Spray Process and Deposit Characterization” Surface and Coatings Technology 203, no. 19 (2009): 2,851–2,857; Anders Hjörnhede and Anders Nylund, “Adhesion Testing of Thermally Sprayed and Laser Deposited Coatings,” Surface and Coatings Technology 184, no. 2–3 (2004): 208–218; S. Sampath et al., “Role of Thermal Spray Processing Method on the Microstructure, Residual Stress and Properties of Coatings: An Integrated Study for Ni–5 wt.%Al Bond Coats,” Materials Science and Engineering: A 364, no. 1–2 (2004): 216.
39 A. Boustini, “Remanufacturing and Energy Savings” (master’s thesis, MIT, 2010); Energetics Incorporated, A Roadmap for Recycling End-of-Life Vehicles of the Future (Washington, DC: U.S. Department of Energy Office of Advanced Automotive Technologies/Argonne National Laboratory, 2001); Kenneth Peattie and M. Seitz, “Meeting the Closed-Loop Challenge: The Core of Remanufacturing,” California Management Review 46, no. 2 (2004): 74–89; Vanessa Smith and Gregory Keoleian, “The Value of Remanufactured Engines: Life-Cycle Environmental and Economic Perspectives,” Journal of Industrial Ecology 8, no. 1–2 (2004): 193–221; Robert Lund, Remanufacturing: The Experience of the United States and Implications for Developing Countries (Washington, DC: World Bank, 1984); William Hauser and Robert Lund, Remanufacturing: Operating Practices and Strategies (Brookline, MA: Boston University, 2008): 2.
40 A.S. Khanna et al., “Hard Coatings Based on Thermal Spray and Laser Cladding,” International Journal of Refractory Metals and Hard Materials 27, no. 2 (2009): 485–491; Matthew Bray, Andrew Cockburn, and William O’Neill, “The Laser-Assisted Cold Spray Process and Deposit Characterization” Surface and Coatings Technology 203, no. 19 (2009): 2,851–2,857; Anders Hjörnhede and Anders Nylund, “Adhesion Testing of Thermally Sprayed and Laser Deposited Coatings,” Surface and Coatings Technology 184, no. 2–3 (2004): 208–218; S. Sampath et al., “Role of Thermal Spray Processing Method on the Microstructure, Residual Stress and Properties of Coatings: An Integrated Study for Ni–5 wt.%Al Bond Coats,” Materials Science and Engineering: A 364, no. 1–2 (2004): 216.
41 John L. Sullivan and Elisa Cobas-Flores, Full Vehicle LCA’s: A Review (Warrendale, PA: SAE International, 2001).
42 Lynette Cheah, John Heywood, and Randolph Kirchain, “The Energy Impact of U.S. Passenger Vehicle Fuel Economy Standards,” (presentation, IEEE International Symposium on Sustainable Systems and Technology, Washington, DC, May 17–19, 2010), http://web.mit.edu/sloan-auto-lab/research/beforeh2/files/IEEE-ISSST-cheah.pdf. (Note that the study
assumed that powertrains are resized to maintain same acceleration performance when vehicle weight is reduced. Fuel consumption [or economy] refer to adjusted figures, which are revised upward [or downward] to better reflect actual, on-road figures, rather than dynamometer test results obtained in the laboratory); Lynette Cheah et al., “Factor of Two: Halving the Fuel Consumption of New U.S. Automobiles by 2035,” in Reducing Climate Impacts in the Transportation Sector, edited by Daniel Sperling and James S. Cannon (New york: Springer, 2008), web.mit.edu/sloan-auto-lab/research/beforeh2/files/cheah_factorTwo.pdf.
43 Oak Ridge National Laboratory, Transportation Energy Data Book 29th Edition, Transportation Energy Use by Mode 2007–2008 (Washington, DC: U.S. Department of Energy, July 2010), Table 2.6, http://cta.ornl.gov/data/tedb29/Spreadsheets/Table2_06.xls.
44 Ibid. A 6% increase in fuel economy results in a 5.66% decrease in car fuel consumption. An 8% increase in light-duty truck fuel economy results in a 7.41% decrease in fuel consumption. In 2008, cars consumed 8,831 TBtu and light-duty trucks consumed 7,572 TBtu. Calculation of energy savings for cars: 500 TBtu = 8,831 TBtu * 5.66%; Calculation of energy savings in light-duty trucks: 561 TBtu = 7,572 * 7.41%; 500 TBtu + 561 TBtu = 1,061 TBtu.
45 Ibid, Table 11.7, http://cta.ornl.gov/data/tedb29/Spreadsheets/Table11_07.xls. In 2008, light-duty vehicles alone produced 1,113 MMT of CO2. Calculation, assuming car CO2 emissions make up 54% of total car and truck emissions, based on the fraction of energy consumed by cars compared to light-duty trucks: 54% = 8,831 TBtu/(8,831 TBtu + 7,572 TBtu). Then 34 MMTCO2 = 1,113.3 MMTCO2 * 5.66% * 54%; 38 MMTCO2 = 1,113 * 7.41% * 46%; 34 MMTCO2 + 38 MMTCO2 = 72 MMTCO2.
46 Ibid, Table 2.6, http://cta.ornl.gov/data/tedb29/Spreadsheets/Table2_06.xls; U.S. Energy Information Administration (EIA), Monthly Energy Review, June 2011 (Washington, DC: EIA, 2011), Table 9.4, http://www.eia.gov/totalenergy/data/monthly/pdf/sec9_6.pdf; EIA, Annual Energy Review 2009, (Washington, DC: EIA, August 2010), Appendix A, Table A1, http://www.eia.gov/totalenergy/data/annual/pdf/sec13_1.pdf; EIA, “Oil Crude and Petroleum Products Explained: Data and Statistics,” last updated July 5, 2011, accessed July 13, 2011, http://www.eia.gov/energyexplained/index.cfm?page=oil_home#tab2. Note that the price of motor gasoline is used in this example for simplicity purposes. Using diesel in these examples would yield different results because of differences in prices and heat content. Cost of motor gasoline based on $3.98 per gallon or $31.84 per MBtu, including taxes, (data from EIA, Monthly Energy Review, May 2011), energy content for motor gasoline of 5.253 MBtu per barrel (EIA, Annual Energy Review 2009), and a barrel to gallon conversion for petroleum products of 42 gallons per barrel (EIA, “Oil Crude and Petroleum Products Explained: Data and Statistics”).
47 David Matlock and John Speer, “Third Generation of AHSS: Microstructure Design Concepts,” in Microstructure and Texture in Steels, ed. A. Haldar, S. Suwas, and D. Bhattacharjee (Springer, 2009) 185–208; U.S. Department of Energy, EERE Vehicle Technologies Program, “Materials Technologies: Goals, Strategies, and Top Accomplishments,” DOE/GO-102010-3111, August 2010, http://www1.eere.energy.gov/vehiclesandfuels/pdfs/materials_tech_goals.pdf.
48 J. Liu and M. Heinimann, “ALCOA Aerospace Technology Portfolio: Solutions to meet the Challenges of Current and Future Applications” (presented at the AeroMat 2010 Conference and Exposition, Bellevue, WA, June 22, 2010).
49 B. C. De Cooman, Kwang-geun Chin, and Jinkyung Kim, “High Mn TWIP Steels for Automotive Applications,” in New Trends and Developments in Automotive System Engineering, ed. Marcello Chiaberge (n.p.: InTech, 2011), 101–128, http://www.intechopen.com/source/pdfs/13349/InTech-High_mn_twip_steels_for_automotive_applications.pdf.
50 J. Liu and M. Heinimann, “ALCOA Aerospace Technology Portfolio: Solutions to meet the Challenges of Current and Future Applications” (presented at the AeroMat 2010 Conference and Exposition, Bellevue, WA, June 22, 2010); M. Heinimann et al., “ALCOA Advanced Hybrid Structures: Innovative Solutions for Future Aircraft Structures” (presented at the 2nd International IIR Conference: Composite & Lightweight Structures in Aircraft, Munich, Germany, May 6, 2008).

79
It is fundamentally energy-intensive to manufacture materials such as steel and aluminum. Producing lower-volume materials, such as titanium and
composites, can be even more energy-intensive due to the need for specialized processing techniques, increased mining and extraction energy requirements, and the complex chemistries and compositions of the final material. In addition to requiring a substantial amount of energy, the manufacturing of materials wastes resources during the production process and does not typically consider waste at the end of a product’s life.
New paradigm materials manufacturing processes are needed to make the manufacturing of materials more sustainable. Minimizing the loss of both energy and materials in manufacturing processes is critical to improving process efficiency and cost-effectiveness. Increasing process yields, combining and streamlining steps, and recovering and recycling materials and energy will help minimize material and energy waste streams and produce higher-quality materials. Ultimately, these process innovations can reduce the cost, environmental impact, and energy requirements of energy generation, storage, and use across U.S. energy sectors.
The following pathways provide a guide for research and development (R&D) in the area of new paradigm materials manufacturing processes:
• Net-Shape Processing
• Additive Manufacturing
• Low-Cost Composites Manufacturing
• Energy-Efficient Metals Production
net-shApe pRoCessingNet-shape processing improves the manufacturing of hard-to-form materials. Techniques like thixocasting, rheo-casting, power metallurgy, net-shape forging, and laser processing can reduce material waste, thereby reducing energy requirements within processes such as melting, casting, and rolling. These techniques can also eliminate or reduce the number of processing steps, such as melting and remelting steps, and can achieve downstream savings in lightweight transportation manufacturing by producing metal components and composites with better materials properties. As a result, these improvements can increase efficiency and reduce costs in the energy sector. Opportunities in industrial processes and transportation sectors provide quantifiable justification for pursuing R&D of net-shape processing.
Market Opportunity: Industrial Processes
Industrial materials manufacturing uses a significant amount of energy. In 2006, the iron and steel industry consumed 1,481 trillion British thermal units (TBtu) of primary energy (excluding feedstocks) and emitted 62 million metric tons (MMT) of carbon dioxide (CO2) using this energy. Similarly, the aluminum industry consumed 603 TBtu of primary energy (excluding feedstocks) and emitted 36 MMT of CO2 using this energy.1
Near net-shape casting/strip casting is a net-shape processing technique that integrates casting and hot rolling into one step, reducing the need to reheat metal before rolling it.2 Using this technique could greatly reduce the amount of energy consumed by these materials industries, as well as the associated CO2 emissions and costs. For example, according to a 2004 Lawrence Berkeley National Laboratory study, using near net-shape casting/strip casting in the iron and steel sector has the potential to save 400 TBtu of primary energy per year in 2025 (100% market penetration). These calculations are based on the assumption that in 2025 the iron and steel sector will consume 1,578 TBtu.3 Assuming the fuel saved is natural gas, this reduction in energy use equates to a potential savings of 16.7 MMT of CO2 per year and $2.041 billion in energy cost savings (for a 400 TBtu reduction in 2025), and a potential savings of 6.7 MMT of CO2 per year and $810 million in energy cost savings per year (for a 160 TBtu reduction in 2025).4
Market Opportunity: Transportation
Reducing vehicle weight is an important component of improving fuel economy. According to a study by the Massachusetts Institute of Technology (MIT), for every 10% reduction in vehicle weight, fuel economy could increase by 6% for cars and 8% for light-duty trucks.5 Net-shape processing techniques can help to reduce the cost of processing metals, enabling the use of high-performance, lightweight metals in vehicles. For example, hot stamping of steel enables the production of complex, lightweight, strong components without the need for costly secondary processing and machining. Such advances in metals and materials processing could help displace some portion of the 8,831 TBtu consumed by cars and 7,572 TBtu consumed by light-duty trucks each year. 6 For example, if the weight of all vehicles in the U.S. car and light-duty truck fleet was reduced by 10%, the resulting energy savings would total 1,060 TBtu annually,7 with a 72 MMT annual reduction in CO2 emissions8 and a $34 billion reduction in fuel costs.9
vi. new pARAdigM MAteRiAls MAnufACtuRing pRoCesses

80
Breakthrough Opportunities
The materials science and engineering (MSE) community can advance net-shape processing by focusing on improving solid-state forming, powder metallurgy, and casting. Addressing the gaps and
limitations specific to each of these breakthrough opportunities will allow net-shape processing to make significant contributions toward addressing energy, environmental, and economic needs.

81
Net-Shape Processing
Solid-State Forming
Solid-state forming is the shaping of wrought and worked materials into a net shape via processes such as stamping, forging, and sheet/bulk forming. Property control and heat treating can also be incorporated into solid-state forming, such as in hot stamping of steel, where quenching takes place in a die. The shape is largely produced when the material is warm and more formable and then quenched to a hard state, which would not be easily formed.
Complex, high-property components are often made by machining or assemblies, but are much more efficiently produced by controlling the state of the material and the process. Processes that enable more complex, efficient components include superplastic forming, hydroforming, hot gas forming, electromagnetic forming, hybrid electromagnetic forming, impulse forming, and advanced variants of current technologies such as blank-holder control in stamping and the applications of servo-presses. Advanced forming of materials in their desired microstructural state, as is the case in cold forging and impulse forming, also improves efficiency.
gAps And liMitAtions to oveRCoMe• There are few facilities that are equipped for advanced solid-state
forming.
• Dies are needed for each new component. This adds cost and lead time to the net-shape process, favoring machined or assembled components.
• Many high strength-to-weight materials, such as magnesium, are particularly difficult to form via solid-state forming.
• Due to shortcomings in computational design, materials scientists are largely unable to tailor microstructures to needed specifications.
Market Impact
Historical Trends and Future Opportunities
futuRe buy-to-fly RAtio foR solid-stAte-foRMed pARts
Past Present Future
BU
Y-T
O-F
LY R
AT
IO
The historical improvement of solid-state forming is best measured by the “buy-to-fly” ratio, which is the mass of material that is required to machine a part compared to the mass of material in the finished part. In the past, little secondary machining was needed, therefore little material was wasted. Today, high-speed machining is more prevalent and more material is wasted, which increases the buy-to-fly ratio. Advanced solid-state forming will enable the manufacture of parts without the need for additional machining, leading to an expected drop in the buy-to-fly ratio in the future.

82
Net-Shape Processing
Powder Metallurgy
Powder metallurgy is the process of taking fine powders and bonding them into solid shapes via elevated temperatures and pressures. While extrusion, casting, and forging techniques involve solid-liquid phase changes during processing, powder metallurgy is more flexible because there is no need for phase control. Near net-shape processing of powders often generates parts that do not need secondary processing or machining, unlike other unfinished materials, such as metal ingots, that require such processing. Due to these processing advantages, there is currently interest in using powder metallurgy to combine dissimilar metals, known as functionally graded materials. Laser powder deposition and solid-state powder dynamic compaction are two energy-efficient and near-net manufacturing processes that will be used in the development and fabrication of functionally graded materials.
gAps And liMitAtions to oveRCoMe• Net-shape powder processing is hindered by batch processing and
requires advances in continuous processing.
• Due to shortcomings in computational design, materials scientists are unable to tailor microstructures to needed specifications.
Market Impact
Historical Trends and Future Opportunities
eneRgy effiCienCy of powdeR MetAlluRgy
1990 2000 2010 2020 2030
OV
ERA
LL E
NER
GY
EFF
ICIE
NC
Y
+20%Improvement
in EnergyEfficiency
The energy efficiency of powder metallurgy has been relatively stable over the past 20 years. Over the next 10 years, it is expected to improve by about 20% due to decreases in the costs of new powder metallurgy technologies and high-performance powder materials, as well as the movement from batch to continuous processing. After a rapid increase in energy efficiency over the span of a few years, the rate of change of energy efficiency is expected to level off.10
Energy Efficiency
• 1990–2011: Minimal
• 2011–2020: 20%

83
Net-Shape Processing
Casting
Casting is the process of pouring a liquid material into a mold and allowing it to solidify. Sand casting processes use silica (SiO2) sand grains bonded with wet clay to surround a removable pattern. Investment casting, which is ideally used in the precision manufacture of turbine blades, golf club heads, and medical prostheses, uses a mold that is melted away, enabling manufacturing of parts with high complexity. In permanent mold and pressure die casting processes, a liquid is poured into a metallic cavity to solidify into a net-shape casting, and the mold can be reused to create additional parts. These parts have excellent surface finishes and dimensional accuracies, but have limited complexity and shape, and high costs for the molds and dies.11
gAps And liMitAtions to oveRCoMe• Today’s casting uses large amounts of material to reduce surface
defects and eliminate warping.
• Due to shortcomings in computational design, materials scientists are largely unable to tailor microstructures to needed specifications.
• Entrapped gases in some casting processes result in undesirable porosity of parts. This effect can result from poor atmosphere control, improper venting, or turbulent flow of the liquid metal/slurry in the mold.
Market Impact
Historical Trends and Future Opportunities
eneRgy ConsuMption in the MetAl CAsting industRy
340
330
320
310
300
290
280
270
260
250
1998 2011 2016
ENER
GY
CO
NSU
MP
TIO
N
(Tbt
u/ye
ar)
Metalcasting is one of the most energy-intensive industries in the United States. Through advanced melting technologies, scrap reduction, and innovative casting processes, the metalcasting industry has and will continue to reduce energy consumption. In 1998, energy consumption in the metalcasting industry was 328 TBtu/year. Today, energy consumption is approximately 304 TBtu/year, and will effectively decrease at a rate of 5 TBtu/year to about 279 TBtu/year in the year 2016.12
Energy Consumption (TBtu/year)
• 1998: 328 TBtu/year
• 2011: 304 TBtu/year
• 2016: 279 TBtu/year

84
R&D Priority Activities: Net-Shape Processing
To overcome the gaps and limitations within the net-shape processing breakthrough opportunities, the MSE community must focus their efforts on developing new processing capabilities, advancing joining methods, and pursuing other R&D activities
provided in the following table. The table divides the priority activities for each research initiative by the time frame in which they are estimated to impact U.S. energy sectors: near term (0–2 years), mid term (2–5 years), and long term (5–10 years).
NEAR TERM (0–2 yEARS)
Solid-StateForming• Adopt an alloy-to-part single melt approach to replace the master alloy/heat approach that is
currently used by many cast alloys.
Casting• Improve casting integrity using modeling techniques to boost production and limit rejects.
Crosscutting• Useinnovativejoiningmethodstoimprovedimensionalcontrolandenableforgedandformedcomponentstoreplacemachinedcomponentsandassemblies(fitsalltimerangesbecausethisisanongoingeffort).
MID TERM (2–5 yEARS)
Solid-StateForming• Increaseclosed-loop,spring-backcontrolandstrain-distributioncontrolforhigh-strengthsheetmetalcomponents.
• Improveroom-temperatureformabilityofmagnesium-,titanium-,andaluminum-sheetmetalsbycontrollingcrystallographictexture.
PowderMetallurgy• Developnewnanomaterials(e.g.,toolingandbearings)usingsparkplasmasinteringtechniques.
• Developaprocessfordirectconsolidationoftitaniumpowderintotubularandstructuralshapes.
Casting• Developandcommercializeaprocessforhigh-property,thin-walled,complexlightmetalcastings.
• Developametalcastingtechniquethatusesahighmagneticfieldtoachievewroughtpropertiesandimprovedyield.
Crosscutting• Developmulti-materialprocessingtechniques.• Useinnovativejoiningmethodstoimprovedimensionalcontrolandenableforgedandformedcomponentstoreplacemachinedcomponentsandassemblies(fitsalltimerangesbecausethisisanongoingeffort).
LONG TERM (5–10 yEARS)
Solid-StateForming• Developprocessesthatsimultaneouslyimprovebothshapeandmaterialproperties(e.g.,variationsofhotstamping,peenforming,andtemperature-controlledstamping).
Casting• Develop sand-casting pattern techniques to replace additive manufacturing investment
casting techniques.
Crosscutting• Useinnovativejoiningmethodstoimprovedimensionalcontrolandenableforgedandformedcomponentstoreplacemachinedcomponentsandassemblies(fitsalltimerangesbecausethisisanongoingeffort).
*The experts identified the boldedactivities as high priority.

85
Additive MAnufACtuRingAdditive manufacturing is a group of processes that builds up parts by adding material, often in layers. These processes enable the modification of a particular area of a part that requires a specific dimensional tolerance instead of modifying the entire part, helping to reduce energy-intensive finishing and heat treatment operations. As a result, these niche processes can improve hard-to-form, high-value products, such as tooling, medical devices, hip and joint implants, thermoelectric materials, and solar panels, and can aid in the repair and remanufacture of products. Implementing additive manufacturing can increase efficiency and reduce costs in the energy sectors. The opportunity to aid in the repair and remanufacturing of automotive parts provides quantifiable justification for pursuing R&D of additive manufacturing.
Market Opportunity: Transportation
Repairing and remanufacturing is one way that the automotive industry can reduce energy use and prevent the waste of end-of-life vehicle parts. Additive manufacturing can be used to remanufacture vehicle parts, which consumes 2%–25% of the energy required
for the manufacture of new parts.13 Capturing these savings by increasing the use of remanufactured parts could have substantial energy and emissions reduction benefits. For example, the manufacture of a new diesel engine requires 17 million Btu (MBtu) and the remanufacture of a similar engine requires only 10% of that energy (1.8 MBtu).14 If one million engines were remanufactured instead of manufacturing new engines, an estimated 15 TBtu of energy15 and 0.9 MMT of CO2 emissions could be saved each year.16 Additional savings could result from using additive manufacturing in the remanufacture of other vehicle parts.
Breakthrough Opportunities
The MSE community can advance additive manufacturing by focusing on improving metals manufacturing, polymers manufacturing, direct writing methods, and multifunctional manufacturing. Addressing the gaps and limitations specific to each of these breakthrough opportunities will allow additive manufacturing to make significant contributions toward addressing energy, environmental, and economic needs.

86
Additive Manufacturing
Metals Manufacturing
The design flexibility of metals additive manufacturing can improve the quality of complex, lightweight parts. Direct metal laser sintering (DMLS) is an additive manufacturing technology that uses a 3-D computer-aided design drawing as a blueprint for precisely melting metal powders together with a laser beam. Another type of additive manufacturing for metal parts is electron beam melting (EBM), which melts metal powder together one layer at a time with an electron beam inside a vacuum. In contrast to DMLS, EBM produces parts that are denser and void-free.
gAps And liMitAtions to oveRCoMe• While additive manufacturing techniques like EBM and DMLS
produce higher-quality products than milling techniques, the processes are slow and extremely expensive for metal parts production.
Market Impact
Historical Trends and Future Opportunities
buy-to-fly RAtio foR MetAl pARts
30
25
20
15
10
5
01990 2011 2020
BU
Y-T
O-F
LY R
AT
IO (
X:1
)
Metal additive manufacturing technologies have improved the buy-to-fly ratio of metal parts, which is defined as the mass of material that is required to machine a part compared to the mass of material in the finished part. Machining improvements have changed the buy-to-fly ratio from 25:1 to 20:1 in the past 20 years. In the next 10 years, this ratio is expected to reach 2:1.17
Buy-to-Fly Ratio
• 1990: 25:1
• 2011: 20:1
• 2020: 2:1

87
Additive Manufacturing
Polymer Manufacturing
Polymer additive manufacturing (also known as direct digital manufacturing [DDM] of polymers) can create new parts quickly, usually within a few hours to one day. Fused deposition modeling (FDM) is an additive manufacturing technology that uses 3-D computer-aided design drawing as a blueprint for creating thermoplastic parts. FDM technology has a precise extrusion head that deposits layers upon layers of thermoplastic resin to create a 3-D polymer part. Stereolithography (SL), another polymer manufacturing technology, produces thermoset polymer cross-sections by focusing an ultraviolet laser into a batch of photo-reactive resin.
gAps And liMitAtions to oveRCoMe• FDM and SL processes require expensive machines that need major
improvements to compete with conventional injection molding costs and production rates.
• Material options are limited and need to incorporate nanotechnologies to provide a wider range of design options.
• Designers are not yet optimizing parts based on the full capabilities of these systems to improve affordability and performance.
• Specialized software designed to optimize known product applications is underdeveloped.
Market Impact
Historical Trends and Future Opportunities
diReCt digitAl MAnufACtuRing MARket vAlue
6
5
4
3
2
1
0
4540353025201510
50
––––––––
2000
Total AM Market ($ Billions) DDM ($ Billions)
2005 2010 2015 2020
MA
RK
ET V
ALU
E ($
BIL
LIO
NS) D
DM
PER
CEN
T O
F MA
RK
ET
DDM (% of Market)
0.8 1.3
40%
5
2
0.61%
8.3%
19.6%
0.0664 0.25480.0006
From 2003 to 2010, DDM has grown from 3.9% of the total additive manufacturing (AM) market to 19.6% of the market, according to Wohlers Report 2011. In the next 10 years, DDM has the potential to capture a significant percentage of the total additive manufacturing market.
The total value of the AM market has grown from $601.1 million in 2000 to $1.325 billion today. By 2020, the AM market is projected to reach $5.2 billion, according to Wohlers Associates, Inc.18

88
Additive Manufacturing
Direct Writing
Direct writing in additive manufacturing is an advanced printing method that enables the production of thermal coatings, dielectric materials, and laser-printed electronics at relatively low cost. This process is a large-scale production technique that allows the user to manufacture at the nanoscopic level. One example of direct writing is aerosol printing, which can be used to print nanoparticle inks such as silver, gold, or platinum in solar arrays.
gAps And liMitAtions to oveRCoMe• Aerosol printing technologies and other deposition techniques have
poor control of ink aggregation and size.
Market Impact
Historical Trends and Future Opportunities
pRoduCtivity of diReCt wRiting teChniques
2004 2008 2012 2016 2020
PR
OD
UC
IVIT
Y (
PAR
TS/
HO
UR
)
+10% per year
When first used in 2004, direct writing technologies were slow, single-point delivery systems with poorly characterized materials. Since 2004, the rate of productivity of these technologies (parts/hour) has grown 10% per year due to advances in manufacturing and deposition techniques and improved deposition materials. This rate of improvement is expected to continue over the next 10 years.
Productivity (parts/hour)
• 2004–2011: 10% increase per year
• 2011–2020: 10% increase per year

89
Additive Manufacturing
Multifunctional Manufacturing
Multifunctional additive manufacturing is the use of several manufacturing techniques to combine one or more materials into a single component that serves a number of functions, such as providing increased strength, corrosion resistance, and electrical conductivity. This process can increase the service life and efficiency of system components and may decrease part count and weight. Multifunctional manufacturing enables a single component to have a high grade of functional integration, positioning additive manufacturing to help meet the requirements of next-generation multifunctional structures and devices.19
gAps And liMitAtions to oveRCoMe• Current multifunctional additive manufacturing methods are still in
their infancy. These methods are currently slow and expensive, and will require major improvements to achieve regular and repeatable part production.
• Today’s solar and thermoelectric materials are processed in batches rather than in a continuous manner. Low-cost processing of photovoltaics does not currently exist.
Market Impact
Historical Trends and Future Opportunities
degRees of funCtionAlity AvAilAble thRough Additive MAnufACtuRing
12
10
8
6
4
2
02000 2011 2020
DEG
REE
S O
F FU
NC
TIO
NA
LIT
Y
Improvements in multifunctional additive manufacturing can be measured by the maximum degree of functionality of a component. Materials scientists have only recently started to focus on the multifunctionality of materials to reduce system size, cost, and energy requirements. In the next 10 years, several macro- and micro-level design approaches will converge to increase embedded multifunctionality. As a result, the degree of functionality is expected to increase from 2 to 10 over the next 10 years.20
Degree of Functionality
• 2000: 1
• 2011: 2
• 2020: 10

90
R&D Priority Activities: Additive Manufacturing
To overcome the gaps and limitations within the additive manufacturing breakthrough opportunities, the MSE community must focus their efforts on developing new processing techniques, advancing analytical capabilities, and pursuing other R&D activities provided in the
following table. The table divides the priority activities for each research initiative by the time frame in which they are estimated to impact U.S. energy sectors: near term (0–2 years), mid term (2–5 years), and long term (5–10 years).
NEAR TERM (0–2 yEARS)
MetalsManufacturing• Developandadvanceautomatedsparkplasmasinteringtechniquesfortheproductionofmetal-matrixcomposites(e.g.,siliconcarbide,siliconnitride,tungstencarbide).
• Developclosed-loophardware/softwaretoprovideTi-6Al-4V(titanium-aluminum-vanadium)material/parttraceabilityforqualitystandards,thusimprovingyieldnumbers.
PolymerManufacturing• Developfamiliesofpolymercompoundswithnano-fillersthatarecompatiblewithadditivemanufacturingprocessestocreateawidespectrumofmaterialproperties.
• Establish design rules to educate users on design optimization of additive manufacturing processes.
• Increase machine throughput while maintaining or increasing system accuracy.
DirectWriting• Developnewinksandslurriesfordirectwritingsystems(fitsalltimerangesbecausethisisanongoingeffort).
MultifunctionalManufacturing• Develop intricate microstructural designs using additive manufacturing to create
multifunctional materials and embedded sensors with two or more functions.
Crosscutting• Setupadditivemanufacturingstationsorareasforregionaleconomiczonestolowershippingcosts.

91
MID TERM (2–5 yEARS)
MetalsManufacturing• Developacontinuousprocessfortitaniummetalproduction,preferablyinpowderform.
PolymerManufacturing• Developmethodstoincreasethroughputofadditivemanufacturingsystemswhileincreasingaccuracyandin-situprocessmonitoring.
• Advance fused deposition modeling to create reinforced polymer materials for enhanced material properties.
• Identify new processing methods to increase isotropic material properties.
DirectWriting• Developnewinksandslurriesfordirectwritingsystems(e.g.,silverandcopperinks)(fitsalltimerangesbecausethisisanongoingeffort).
• Develop low-cost (e.g., printed) thermoelectric generators to exploit low-grade heat sources.
MultifunctionalManufacturing• Createanalternativefileformatto“.stl”toenablemulti-materialfabricationinamonolithicpiece;lessenergy-intensivematerialsmaybeusedfunctionallyinplaceofasingleenergy-intensivematerial.
Crosscutting• Developlargerchambersormulti-headsfordirectmetaldepositionprocesses(MetalsManufacturingandMultifunctionalManufacturing).
• Developasystemforsensingandcontrollingsurfacequalityandresidualstresses.• Develop new manufacturing techniques for specific energy photovoltaic applications (e.g.,
copper-indium-gallium) (Direct Writing and Multifunctional Manufacturing).• Develop advanced additive manufacturing techniques for hybrid materials such as metal-
ceramic, metal-metal, metal-polymer (Metals Manufacturing, Polymer Manufacturing, and Multifunctional Manufacturing).
LONG TERM (5–10 yEARS)
PolymerManufacturing• Develop new finite element analysis predictive software that provides methods to analyze
and optimize unique internal structures enabled by additive manufacturing.
DirectWriting• Developlarge-scaleprintedenergystoragebatteriesandcapacitors(e.g.,onesthatmaybeusedforwindfarms).
• Developnewinksandslurriesfordirectwritingsystems(fitsalltimerangesbecausethisisanongoingeffort).
Crosscutting• Createaresidualstressanalyticalmodelingsystemfornon-vacuum-basedadditivemanufacturedsystems;thiswillhelppredictresidualstressordistortionofdirectpartstoincreaseyieldnumbersandincreasepartrobustness.
• Developadditivesystemtechniquestointegrateadditivemanufacturingsystemsseamlessly.
*The experts identified the boldedactivities as high priority.

92
low-Cost CoMposites MAnufACtuRingComposite materials can provide reductions in weight, increased strength, and other performance benefits that can improve the efficiency of end products. However, the cost to produce these high-performance materials currently makes them prohibitive for use in many applications. Implementing process improvements that reduce steps and increase production yield can help to reduce the cost of processing metallic and non-metallic composites. As a result, these improvements can enable the increased use of composites to reduce energy use, emissions, and costs in energy sectors. Opportunities in transportation and wind power sectors provide quantifiable justification for pursuing R&D of composites manufacturing.
Market Opportunity: Transportation
In 2008, the U.S. transportation sector was responsible for approximately 28% (28,103 TBtu) of total U.S. primary energy consumption.21 The same year, light-duty vehicles alone produced 1,113 MMT of CO2.
22 Incorporating low-cost composites into vehicle design could help the automotive industry improve fuel economy and reduce tailpipe emissions without drastically increasing costs. An MIT study estimated that a 10% reduction in vehicle weight could increase fuel economy by 6% for cars and 8% for light-duty trucks,23 which could save drivers $34 billion in fuel costs each year.24 In addition, a 10% reduction in the weight of all vehicles in the U.S. car and light-duty truck fleet could result in a 1,060 TBtu annual reduction in energy25 and a 72 MMT reduction in CO2 emissions.26
Market Opportunity: Wind Power
The U.S. electric power sector produced 40% of total U.S. energy-related CO2 emissions in 2010 (2,271 MMT),27 and major investor-owned utilities, which represent only a portion of U.S. power producers, spent $40.2 billion on fuel in 2009.28 Wind power represented a 2.3% share of 2010 U.S. electricity net generation (generating 94,647 million kilowatt-hours [kWh] of electricity).29
The use of carbon fiber composites to increase wind-turbine blade lengths can increase the overall efficiency, and therefore lower the cost, of wind power production. Rotor power grows with the square of the diameter of the turbine’s blades, while the volume of material, and therefore its mass and cost, increases with the cube of the diameter.30 As a result, low-cost composites could allow increases in turbine blade length, while significantly reducing weight penalties. Low-cost composite materials that allow for the cost-effective design of wind turbines could help wind power gain an even larger share in the U.S. electricity generation sector, reducing fossil fuel consumption, emissions, and costs. For example, if wind power gained an additional 1% market share of U.S. electric power sector production, it could displace 396 TBtu of electricity generation from other sources,31 decrease CO2 emissions by 23 MMT,32 and reduce fuel costs of major investor-owned utilities (which represent only a portion of U.S. power producers) by $412 million per year.33
Breakthrough Opportunities
The MSE community can advance low-cost composites manufacturing by focusing on improving fibers manufacturing and developing advanced composite matrices. Addressing the gaps and limitations specific to each of these breakthrough opportunities will allow low-cost composites manufacturing to make significant contributions toward addressing energy, environmental, and economic needs.

93
Low-Cost Composites Manufacturing
Fibers Manufacturing
Carbon fibers require less energy to manufacture and have fewer problems with corrosion than the metals they replace. They can also be used to reduce the number of parts in a system, decreasing system complexity. To be used more broadly in energy systems, materials scientists must work to reduce the manufacturing costs and energy inputs of fibers manufacturing.
gAps And liMitAtions to oveRCoMe• Radical changes in the carbonization step of the carbon fiber
production process are required to lower energy input. Lowering the cost of carbon fiber will be dependent on this factor.
Market Impact
Historical Trends and Future Opportunities
eneRgy RequiReMents And Costs of CARbon fibeR fAbRiCAtion
12
10
8
6
4
2
0
FAB
RIC
AT
ION
CO
ST (
$/lb
)
0.35
0.30
0.25
0.20
0.15
0.10
0.05
0.00Past 2011 2026 Past 2011 2026
FAB
RIC
AT
ION
EN
ERG
Y (
MB
tu/lb
)
Since the inception of using polyacrylonitrile (PAN) to replace rayon as a raw material for the manufacture of carbon fiber, there has been little-to-no improvement in carbon fiber fabrication cost and energy requirements. With major advancements in the next 15 years, the energy input of carbon fiber manufacturing can potentially drop from 0.30 MBtu/pound (MBtu/lb) to 0.05 MBtu/lb, and the cost is expected to drop from $10/lb to $5/lb.
Fabrication Energy
• Past/Present: 0.30 MBtu/lb
• 2026: 0.05 MBtu/lb
Fabrication Cost
• Past/Present: $10/lb
• 2026: $5/lb

94
Low-Cost Composites Manufacturing
Composite Matrix Manufacturing
Composites, which contain a matrix and a reinforcement of a different material (e.g., fibers and particulates), offer a unique combination of properties (e.g., strength, rigidity, weight) that is not possible with individual materials. While polymer-matrix composites are ideal for carbon fibers, metal- and ceramic-matrix composite (MMC/CMC) systems are excellent materials for use in high-performance cutting tools, one of many useful applications. The advancement of MMC and CMC manufacturing methods have led to lower-cost, higher-quality cutting tools with complex compositions and greatly extended tooling life.
gAps And liMitAtions to oveRCoMe• Advanced MMCs, which have the ability to handle far more tooling
cycles than today’s current tooling standards, are not yet widely accepted by industry.
• CMCs offer great promise for use in mechanical seals but lack the ability to carry large amounts of deformation.
Market Impact
Historical Trends and Future Opportunities
industRiAl tooling CyCles of Cutting tools
30,000
25,000
20,000
15,000
10,000
5,000
01990 2011 2020
TO
OLI
NG
CY
CLE
S
For the past 20 years, cutting tools have had an industry standard of about 4,000 cycles before replacement. State-of-the-art MMCs and CMCs are beginning to demonstrate an ability to reach nearly 25,000 tooling cycles. In the next 10 years, these advanced cutting tools have the potential to become the new standard for tooling life, allowing industry to abandon the current tooling life of 4,000 cycles.
Tooling Cycles
• 1990: 4,000 cycles
• 2011: 4,000 cycles
• 2020: 25,000 cycles
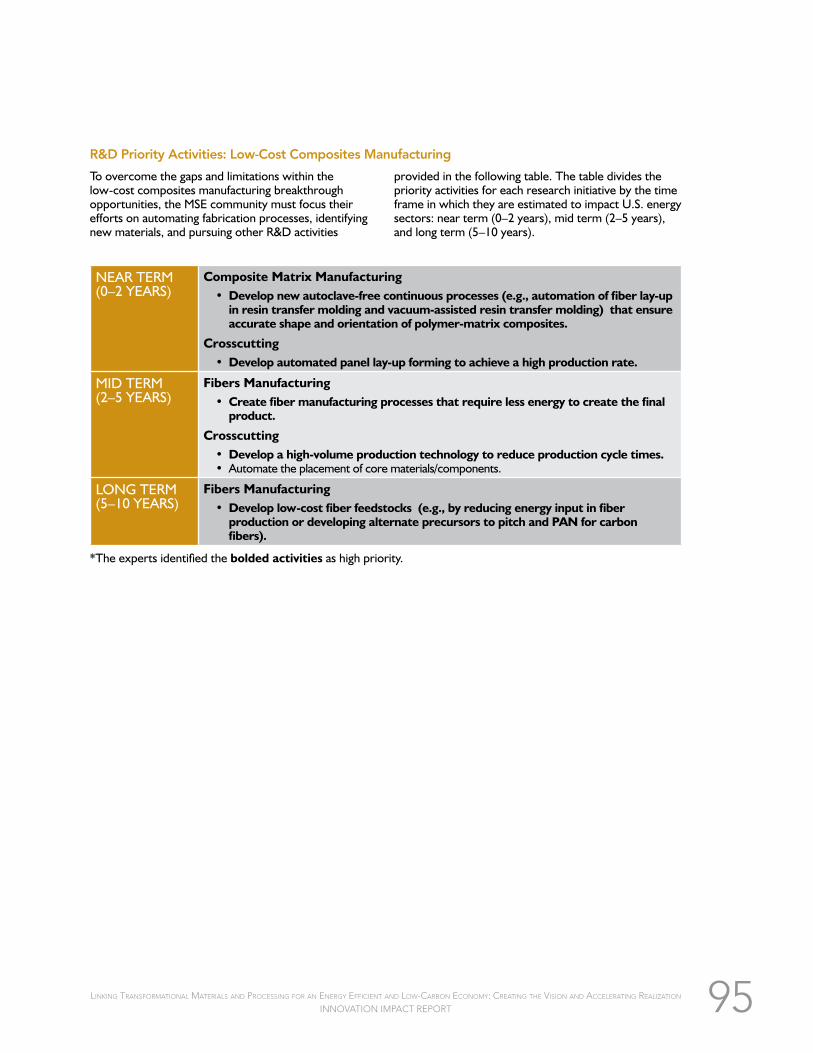
95
R&D Priority Activities: Low-Cost Composites Manufacturing
To overcome the gaps and limitations within the low-cost composites manufacturing breakthrough opportunities, the MSE community must focus their efforts on automating fabrication processes, identifying new materials, and pursuing other R&D activities
provided in the following table. The table divides the priority activities for each research initiative by the time frame in which they are estimated to impact U.S. energy sectors: near term (0–2 years), mid term (2–5 years), and long term (5–10 years).
NEAR TERM (0–2 yEARS)
CompositeMatrixManufacturing• Developnewautoclave-freecontinuousprocesses(e.g.,automationoffiberlay-upinresintransfermoldingandvacuum-assistedresintransfermolding)thatensureaccurateshapeandorientationofpolymer-matrixcomposites.
Crosscutting• Developautomatedpanellay-upformingtoachieveahighproductionrate.
MID TERM (2–5 yEARS)
FibersManufacturing• Createfibermanufacturingprocessesthatrequirelessenergytocreatethefinalproduct.
Crosscutting• Developahigh-volumeproductiontechnologytoreduceproductioncycletimes.• Automate the placement of core materials/components.
LONG TERM (5–10 yEARS)
FibersManufacturing• Developlow-costfiberfeedstocks(e.g.,byreducingenergyinputinfiberproductionordevelopingalternateprecursorstopitchandPANforcarbonfibers).
*The experts identified the boldedactivities as high priority.

96
eneRgy-effiCient MetAls pRoduCtionImproving the energy efficiency of metals production can help to reduce the costs and emissions associated with metals processing. Eliminating processing steps, reducing reheating needs, reducing equipment, and increasing production yields can help to reduce energy usage, equipment and tooling costs, and operation and maintenance costs.34 As a result, energy-efficient metals production can increase efficiency and reduce costs in the energy sectors. Opportunities in transportation and industrial processes provide quantifiable justification for pursuing R&D of energy-efficient metals production.
Market Opportunity: Transportation
Using lightweight materials in vehicles is integral to improving vehicle fuel economy. Material advances and cost reductions in the primary production of lightweight metals can help to enable the use of high-performance, lightweight metals like aluminum, magnesium, titanium, and multi-material structures in vehicles. Such advances in metals production processes could help displace a portion of the annual 8,831 TBtu of energy consumed by cars and 7,572 TBtu of energy consumed by light-duty trucks.35 For example, if the weight of vehicles in the whole U.S. car and light-duty truck fleet was reduced by 10%, the resulting energy savings would total 1,060 TBtu annually,36 with a 72 MMT annual reduction in CO2 emissions37 and a $34 billion reduction in fuel costs.38
Market Opportunity: Industrial Processes
Manufacturing metals uses a significant amount of energy; in 2006, the iron and steel industry consumed 1,481 TBtu of primary energy (excluding feedstocks) and emitted 62 MMT of CO2. The aluminum industry consumed 603 TBtu of primary energy (excluding feedstocks) and emitted 36 MMT of CO2.
39 Process improvements such as using new materials for anodes and cathodes and insulating materials for furnaces and reactors can help to increase efficiency, as can direct reduction technologies that produce titanium in continuous processing, instead of batch processing. Developing new technologies for manufacturing steel and aluminum, such as direct reduction of iron ores, continuous casting of steel, and carbothermic reduction of aluminum, can also aid in efficiency improvements. A 10% reduction in the estimated energy consumption of the U.S. steel manufacturing sector would result in 148 TBtu in energy savings,40 a 6.2 MMT reduction in CO2 emissions,41 and $489 million in savings for the steel manufacturing sector.42 Similarly, a 10% reduction in the energy consumption of the aluminum manufacturing sector would result in 60 TBtu in energy savings,43 a 3.6 MMT reduction in CO2 emissions, and $175 million in savings for the aluminum sector.44
Breakthrough Opportunities
The MSE community can advance energy-efficient metals production by improving steel production, aluminum production, recycling technologies, and titanium production. Addressing the gaps and limitations specific to each of these breakthrough opportunities will allow energy-efficient metals production to make significant contributions toward addressing energy, environmental, and economic needs.

97
Energy-Efficient Metals Production
Steel Production
Steel is a widely accepted, low-cost material that is used in many parts of the economy, notably transportation and industrial structures. It consists of iron with small amounts of other elements that alter its properties. Losses of steel product can occur during steel manufacturing processes, including surface grinding, oxide inclusions, and vacuum arc remelting constrictions and excursions. Advancing these processing techniques can provide a greater yield of steel ingots.
gAps And liMitAtions to oveRCoMe• There are currently no available multi-sensor, integrated spectrum
devices or software for solid, liquid, and gas process control, such as metal ion sensors for molten metal processing.
Market Impact
Historical Trends and Future Opportunities
eneRgy intensity of noRth AMeRiCAn steel pRoduCtion
18
16
14
12
10
8
6
4
2
0
1990 2011 Future
PR
OD
UC
T E
NER
GY
INT
ENSI
TY
(MB
tu/t
on)
The North American steel industry has continually reduced its energy intensity, minimizing the industry’s footprint on the environment. Since 1990, energy intensities to make one ton of steel have been reduced by 30 percent, from 16 MBtu/ton to approximately 12 MBtu/ton. As a result of advances in today’s steelmaking processes, the industry is approaching the limits defined by the laws of physics. Little improvement is expected in the future without major processing advancements.45
Product Energy Intensity
• 1990: 16 MBtu/ton
• 2011: 12 MBtu/ton
• Future: Minimal improvement

98
Energy-Efficient Metals Production
Aluminum Production
Aluminum is the most abundant metal in the earth’s crust. It is lightweight, strong, and versatile, and has excellent corrosion resistance and electrical/thermal conductivities. Aluminum is extracted from aluminum oxide by electrolysis—a process that requires high levels of electrical energy with moderately high losses of materials within an aluminum electrolysis cell. Advancing these processes may lower the energy input of aluminum production and increase the product yield.
gAps And liMitAtions to oveRCoMe• There are currently no available multi-sensor, integrated spectrum
devices or software for solid, liquid, and gas process control, such as metal ion sensors for molten metal processing.
• Carbothermic reduction, an alternative method of aluminum production that uses carbon as a reducing agent during a high-temperature chemical reaction, currently has many limitations, including the inability to attain the high temperatures required, materials of construction constraints, high carbon electrode consumption, inefficient separation of aluminum from carbon, and excessive losses of aluminum.
Market Impact
Historical Trends and Future Opportunities
eneRgy intensity of AluMinuM pRoduCtion
18
16
14
12
10
8
6
4
2
0
1990 2011 2020
PR
OD
UC
T E
NER
GY
INT
ENSI
TY
(kW
h/kg
)
The energy consumption of aluminum production has decreased from about 16.1 kWh/kilogram (kg) to 14.5 kWh/kg over the past 20 years. With additional improvements, this level is expected to drop to about 10 kWh/kg in the next 10 years.46
Product Energy Consumption
• 1990: 16.1 kWh/kg
• 2011: 14.5 kWh/kg
• 2020: 10 kWh/kg

99
Energy-Efficient Metals Production
Recycling
Metals recycling technologies have the potential to reduce energy input and produce fewer emissions than creating new metal products. This reduction in energy input through refinement of manufacturing processes can lead to significant economic savings, reduced waste output, and increased metal yield due to fewer oxidative losses.
gAps And liMitAtions to oveRCoMe• Current recycling processes are incapable of converting dirty, low-
grade materials to high-grade, pure materials. Systems to remove physical contaminants are ineffective and current elemental removal systems (e.g., selective separations) are inefficient.
• Recycling processes rely on inefficient combustion heating in thermal processing. There is a need for low-temperature recycling processes.
Market Impact
Historical Trends and Future Opportunities
eneRgy ConsuMption foR AluMinuM ReCyCling
3.500
3,000
2,500
2,000
1,500
1,000
500
01990 2011 2020
REC
YC
LIN
G E
NER
GY
CO
NSU
MP
TIO
N (
Btu
/lb)
Aluminum is one of the easiest metals to recycle and is much cheaper to recycle than mining and refining additional bauxite ores for new aluminum production. Over the past 20 years, energy input for recycling aluminum has dropped from 3,000 Btu/lb to 1,500 Btu/lb. Additional refinements in recycling are expected to lower energy consumption to 1,000 Btu/lb in the next 10 years.47
Recycling Energy Consumption
• 1990: 3,000 Btu/lb
• 2011: 1,500 Btu/lb
• 2020: 1,000 Btu/lb

100
Energy-Efficient Metals Production
Titanium Processing
Titanium processing, which requires reduction, chlorination, and melting, is energy-intensive due to titanium’s high melting point and sensitivity to environmental influences. Titanium naturally forms an oxide layer when exposed to atmospheric conditions, which causes loss of titanium product. Improving titanium processing will produce a greater yield of titanium and require less energy input. Titanium powder has become of growing interest to industry because it is relatively easy to use for processing titanium parts as opposed to starting with titanium ingots. Lately, it has been used extensively in manufacturing cookware and kitchenware, as well as critical aerospace components.
gAps And liMitAtions to oveRCoMe• There are currently no available multi-sensor, integrated spectrum
devices or software for solid, liquid, and gas process control, such as metal ion sensors for molten metal processing.
• Altering any processing techniques would require changes to avert titanium’s exposure to atmospheric conditions and may reduce the energy efficiency of the process.
Market Impact
Historical Trends and Future Opportunities
Cost of titAniuM powdeR
100908070605040302010
01990 2011 2020
PO
WD
ER C
OST
($/
lb)
The cost of titanium powder has nearly doubled over the past 20 years to approximately $90/lb. With major advances in titanium powder processing, it is possible that this cost may drop to $25/lb in the next 10 years.48
Powder Cost
• 1990: $50/lb
• 2011: $90/lb
• 2020: $25/lb

101
R&D Priority Activities: Energy-Efficient Metals Production
To overcome the gaps and limitations within the energy-efficient metals production breakthrough opportunities, the MSE community must focus their efforts on advancing existing processes, inventing new approaches to metals production, and pursuing other R&D activities
provided in the following table. The table divides the priority activities for each research initiative by the time frame in which they are estimated to impact U.S. energy sectors: near term (0–2 years), mid term (2–5 years), and long term (5–10 years).
NEAR TERM (0–2 yEARS)
AluminumProduction• Improveinstrumentationforaluminumreductioncells,leadingtobetterprocesscontrol.
Crosscutting• Integrate thermal cycling to reduce energy loss from reheating.
MID TERM (2–5 yEARS)
AluminumProduction• Developnewelectrodematerialsforaluminumreductioncells.
TitaniumProcessing• Developacontinuousprocessfortitaniummetalproduction,preferablyinpowderform.
• Developatitaniummoltenmetaldeliverysystem(i.e.,closed-coupledgasatomization)thatcanlowerthecostofproductionviaahigh-performancecontinuousprocess.
Crosscutting• Improve refractory development for aluminum and iron production (i.e., improve
production, reduce heat input, reduce contamination) (Aluminum Production, Steel Production).
LONG TERM (5–10 yEARS)
SteelProduction• Developaprocessforthedirectreductionofironoreusinganelectrolytichydrogenorothernon-carbon-reductionprocess.
AluminumProduction• Developnovelelectrochemistryprocessesfortheproductionofaluminumand/ormagnesium(e.g.,lower-temperatureionicliquids).
Recycling• Identify alternative recycling strategies for all major manufacturing/construction materials to
minimize energy requirements and greenhouse gas emissions.
TitaniumProcessing• Developacontinuouscastingprocessforhigh-endalloys(e.g.,titaniumandnickel).
• Develop beta titanium alloy systems that take advantage of powder processing (e.g., laser-additive manufacturing, hot isostatic pressing, and near net-shape manufacturing).
Crosscutting• Advancescalingofmeltfacilitiestoincreaseproductyield.• Developalow-cost,high-propertymagnesiumsystemforhigh-volumecastingorsheetproduction.
• Optimizetheyield,use,andscaleofvacuum-arcremeltingandelectroslagmeltingofhigh-endmetals(e.g.,iron,nickel,titanium);high-endalloysusuallyneedmultiplemeltingcycles(SteelProduction,TitaniumProcessing).
*The experts identified the boldedactivities as high priority.

102
notes1 Prepared by Energetics Incorporated for the Industrial Technologies
Program, “Energy and Carbon Footprint: Iron and Steel,” 2010, accessed August 29, 2011, http://www1.eere.energy.gov/industry/pdfs/steel_footprint.pdf.
2 Ernst Worrell, Lynn Price, and Christina Galitsky, Emerging Energy-Efficient Technologies in Industry: Case Studies of Selected Technologies, (Berkeley, CA: Lawrence Berkeley National Laboratory, 2004), http://ies.lbl.gov/iespubs/54828.pdf.
3 Ibid.
4 Prepared by Energetics Incorporated for the U.S. Department of Energy, Industrial Technologies Program 2010, “Manufacturing Energy and Carbon Footprints: Iron and Steel,” http://www1.eere.energy.gov/industry/pdfs/steel_footprint.pdf. To estimate the carbon emissions associated with 400 TBtu and 160 TBtu in annual energy savings identified by the Lawrence Berkeley National Laboratory (LBNL) report, it is necessary to estimate an emissions factor for the industry. If in 2006, 1,481 TBtu of energy consumed by the sector resulted in 62 million MMT of CO2, then it could be estimated that each TBtu produces 0.041864 MMT of CO2/TBtu.Calculations: 0.041866 MMTCO2/TBtu * 400 TBtu = 16.70 MMTCO2; 0.041866 MMTCO2/TBtu * 160 TBtu = 6.70 MMTCO2; U.S. Energy Information Administration (EIA), Monthly Energy Review, June 2011 (Washington, DC: EIA, 2011), Table 9.11, http://www.eia.gov/totalenergy/data/monthly/pdf/sec9_17.pdf; EIA, Monthly Energy Review, June 2011 (Washington, DC: EIA, 2011), Table A4, http://www.eia.gov/totalenergy/data/monthly/pdf/sec13_4.pdf. To convert the energy savings identified by LBNL into energy cost savings, it is necessary to know which fuel is being saved by the near net shape/strip casting process. If for example, the reheating energy being displaced was in the form of natural gas, energy cost savings could be estimated by the following: Using the April 2011 average price of natural gas for industrial consumers of $5.23 per thousand cubic feet ($5.10 per MBtu), the 400 TBtu technical savings potential identified by LBNL could be approximated as $2,041 million in energy cost savings, and the 160 TBtu savings estimated by LBNL at 40% market penetration could be approximated as $810 million in energy cost savings per year. Calculations: $5.23 per thousand cubic feet converted into $5.10 per MBtu using a heat contents of natural gas of 1,025 Btu per cubic foot; 400 Tbtu * $5.10 per MBtu = $2,041 million in savings. 160 Tbtu * $5.10 per MBtu = $810 million in savings.
5 Lynette Cheah, John Heywood, and Randolph Kirchain, “The Energy Impact of U.S. Passenger Vehicle Fuel Economy Standards,” (presentation, IEEE International Symposium on Sustainable Systems and Technology, Washington, DC, May 17–19, 2010), http://web.mit.edu/sloan-auto-lab/research/beforeh2/files/IEEE-ISSST-cheah.pdf (Note that the study assumed that powertrains are resized to maintain same acceleration performance when vehicle weight is reduced. Fuel consumption [or economy] refer to adjusted figures, which are revised upward [or downward] to better reflect actual, on-road figures, rather than dynamometer test results obtained in the laboratory); Lynette Cheah et al., “Factor of Two: Halving the Fuel Consumption of New U.S. Automobiles by 2035,” in Reducing Climate Impacts in the Transportation Sector, edited by Daniel Sperling and James S. Cannon (New york: Springer, 2008), web.mit.edu/sloan-auto-lab/research/beforeh2/files/cheah_factorTwo.pdf.
6 Oak Ridge National Laboratory, Transportation Energy Data Book 29th Edition, Transportation Energy Use by Mode 2007–2008 (Washington, DC: U.S. Department of Energy, July 2010), Table 2.6, http://cta.ornl.gov/data/tedb29/Spreadsheets/Table2_06.xls.
7 Lynette Cheah, John Heywood, and Randolph Kirchain, “The Energy Impact of U.S. Passenger Vehicle Fuel Economy Standards,” (presentation, IEEE International Symposium on Sustainable Systems and Technology, Washington, DC, May 17–19,); Oak Ridge National Laboratory, Transportation Energy Data Book 29th Edition, Transportation Energy Use by Mode 2007–2008 (Washington, DC: U.S. Department of Energy, July 2010), Table 2.6, http://cta.ornl.gov/data/tedb29/Spreadsheets/Table2_06.xls. Assumes for every 10% weight reduction, fuel economy could increase by 6% for cars and 8% for light-duty trucks. A 6% increase in car fuel economy results in a 5.66% decrease in fuel consumption. An 8% increase in light-duty truck fuel economy results in a 7.41% decrease in fuel consumption. Calculations: Energy
savings for cars = 500 TBtu = 8,831 TBtu * 5.66%; energy savings in light-duty trucks = 606 TBtu = 7,572 * 7.41%; 500 TBtu + 561 TBtu = 1,061 TBtu.
8 Oak Ridge National Laboratory, Transportation Energy Data Book 29th Edition, Transportation Energy Use by Mode 2007–2008 (Washington, DC: U.S. Department of Energy, July 2010), Table 11.7, http://cta.ornl.gov/data/tedb29/Spreadsheets/Table11_07.xls. In 2008, light-duty vehicles alone produced 1,113 MMT of CO2. Calculations, assuming car CO2 emissions make up 54% of total car and truck emissions, based on the fraction of energy consumed by cars compared to light trucks: 54% = 8,831 TBtu/(8,831 TBtu + 7,572 TBtu); 34 MMTCO2 = 1,113.3 MMTCO2 * 5.66% * 54%; 38 MMTCO2 = 1,113 * 7.41% * 46%; 34 MMTCO2 + 38 MMTCO2 = 72 MMTCO2.
9 Oak Ridge National Laboratory, Transportation Energy Data Book 29th Edition, Transportation Energy Use by Mode 2007–2008 (Washington, DC: U.S. Department of Energy, July 2010), Table 2.6, http://cta.ornl.gov/data/tedb29/Spreadsheets/Table2_06.xls; U.S. Energy Information Administration (EIA), Monthly Energy Review, June 2011, (Washington, DC: EIA, 2011), Table 9.4, http://www.eia.gov/totalenergy/data/monthly/pdf/sec9_6.pdf; EIA, Annual Energy Review 2009 (Washington, DC: EIA, August 2010), Appendix A, Table A1, http://www.eia.gov/totalenergy/data/annual/pdf/sec13_1.pdf; EIA, “Oil Crude and Petroleum Products Explained: Data and Statistics,” last updated July 5, 2011, accessed July 13, 2011, http://www.eia.gov/energyexplained/index.cfm?page=oil_home#tab2. Note that the price of motor gasoline is used in this example for simplicity purposes. Using diesel in these examples would yield different results because of differences in prices and heat content.Cost of motor gasoline based on $3.98 per gallon or $31.84 per MBtu, including taxes, (EIA, Monthly Energy Review, May 2011), energy content for motor gasoline of 5.253 MBtu per barrel (EIA, Annual Energy Review 2009), barrel to gallon conversion for petroleum products of 42 gallons per barrel (EIA, “Oil Crude and Petroleum Products Explained: Data and Statistics”). Calculations: $15.9 billion = $281.2 billion * 5.66%; $17.9 billion = $241.08 billion * 7.41%.
10 Bernard Williams, “Powder Metallurgy, A Global Market Review,” Market Review: IPMD 14th Edition 2010–2011 (Shrewsbury, UK: IPMD, 2011); P. Beiss, R. Ruthardt, H. Warlimont (eds.) Powder Metallurgy Data (Berlin, Heidelberg: Springer, 2003), 1.1–1.3; y. Xiong et al., “A Streamlined Life Cycle Assessment on the Fabrication of WC–Co Cermets,” Journal of Cleaner Production 16, no. 10 (2008): 1,118–1,126.
11 Donald R. Askeland and Pradeep P. Phulé, The Science and Engineering of Materials, Fifth Edition (Toronto, Ontario: Thomson, 2006).
12 U.S. Department of Energy (DOE), Office of Energy Efficiency and Renewable Energy (EERE), Industrial Technologies Program (ITP), “Metalcasting E-SMARRT: Energy-Saving Melting and Revert Reduction Technology,” n.d., http://www.e-smarrt.org/; DOE EERE ITP, “Energy-Saving Melting and Revert Reduction Technology,” unpublished slide presentation.
13 John Sutherland et al., “A Comparison of Manufacturing and Remanufacturing Energy Intensities with Application to Diesel Engine Production,” CIRP Annals—Manufacturing Technology 57, no. 1 (2008), 5–8.
14 Ibid.
15 Ibid.
16 Sutherland et al., “A Comparison of Manufacturing and Remanufacturing Energy Intensities,” 5–8; Prepared by Energetics Incorporated for the U.S. Department of Energy Industrial Technologies Program, “Energy and Carbon Footprint: Transportation Equipment,” 2010, accessed August 29, 2011, www1.eere.energy.gov/industry/pdfs/transport_footprint.pdf. Estimates an emission factor for the transportation equipment industry by examining energy consumption and CO2 emissions in the transportation equipment industry (NAICS 336) from the energy footprints. Calculation: 54 MMTCO2 per 904 TBtu of energy consumption = 0.05862 MMTCO2 per TBtu. Therefore, 15 TBtu savings are equivalent to 0.05862 MMTCO2 * 15 trillion Btu = 0.9 MMTCO2.
17 David Bourell, Ming Leu, and David Rosen, eds., Roadmap for Additive

103
Manufacturing: Identifying the Future of Freeform Processing (Austin, TX: University of Texas at Austin, 2009), http://nextbigfuture.com/2009/10/roadmap-for-additive-manufacturing.html.
18 Terry Wohlers, Wohlers Report 2011: Additive Manufacturing and 3D Printing State of the Industry (Fort Collins, CO: Wohlers Associates, 2011).
19 L.D. Nayer, “Additive Manufacturing of Multifunctional Devices AMMD” (presentation at the Innovation for SME Partnering Event, Brussels, Belgium, May 17, 2011), http://www.cornet-era.net/portal/pics/3_innovation_for_sme/Partnering_Event_May_17_2011_Brussels/17_ammd.pdf; Joseph Beaman et al., Additive/Subtractive Manufacturing Research and Development in Europe: Final Report, (Baltimore, MD: World Technology Evaluation Center, Inc., 2004); M. Hedges et al., “New Method for Head-Up Display Realization by Mean of Chip On Board and Aerosol Jet Process” (presentation, Electronic System-Integration Technology Conference, Berlin, Germany, September 13–16, 2010); R. Plourde, “Aerosol Jet® Direct Write Technology, A Manufacturing Tool for Printed Electronics,” PowerPoint presentation, http://www.isa.org/Content/Microsites530/Computer_Tech__Division/Home528/Passive_Wireless_Sensor_Workshop/Papers_Presentations/S7-P3_OptomecAJ.pdf.
20 B. P. Rice, A. Morgan, and K. Han, “Development of Multifunctional Materials for Additive Manufacturing” (presented at the Direct Part Manufacturing Workshop of the Midwest Society for the Advancement of Material and Process Engineering, Dayton, OH, March 29–30, 2011), http://www.midwestsampe.org/content/files/events/dpmworkshop/polymers/Polymers%20Rice.pdf; P. Dessert, “Additive Manufacturing of Nano-Materials: Cornerstone for the New Manufacturing Paradigm” (presented at the Rapid 2010 and 3-D Imaging Conferences & Exposition, Society of Manufacturing Engineers, Anaheim, CA, May, 2010); B. Zheng et al., “Powder Additive Processing with Laser Engineered Net Shaping (LENSÒ),” in Powder Metallurgy Research Trends, ed. Lotte Smit and Julia Van Dijk (Hauppauge, NY: Nova Science Publishers, 2009): 125–190.
21 Oak Ridge National Laboratory, Transportation Energy Data Book 29th Edition, Transportation Energy Use by Mode 2007–2008 (Washington, DC: U.S. Department of Energy, July 2010), Table 2.6, http://cta.ornl.gov/data/tedb29/Spreadsheets/Table2_06.xls.
22 Ibid, Table 11.7, http://cta.ornl.gov/data/tedb29/Spreadsheets/Table11_07.xls.
23 Lynette Cheah, John Heywood, and Randolph Kirchain, “The Energy Impact of U.S. Passenger Vehicle Fuel Economy Standards,” (presentation, IEEE International Symposium on Sustainable Systems and Technology, Washington, DC, May 17–19, 2010), http://web.mit.edu/sloan-auto-lab/research/beforeh2/files/IEEE-ISSST-cheah.pdf (Note that the study assumed that powertrains are resized to maintain the same acceleration performance when vehicle weight is reduced. Fuel consumption [or economy] refers to adjusted figures, which are revised upward [or downward] to better reflect actual, on-road figures, rather than dynamometer test results obtained in the laboratory); Lynette Cheah et al., “Factor of Two: Halving the Fuel Consumption of New U.S. Automobiles by 2035,” in Reducing Climate Impacts in the Transportation Sector, edited by Daniel Sperling and James S. Cannon (New York: Springer, 2008), web.mit.edu/sloan-auto-lab/research/beforeh2/files/cheah_factorTwo.pdf.
24 Oak Ridge National Laboratory, Transportation Energy Data Book 29th Edition, Transportation Energy Use by Mode 2007–2008, (Washington, DC: U.S. Department of Energy, July 2010), Table 2.6, http://cta.ornl.gov/data/tedb29/Spreadsheets/Table2_06.xls; U.S. Energy Information Administration (EIA), Monthly Energy Review, June 2011 (Washington, DC: EIA, 2011), Table 9.4, http://www.eia.gov/totalenergy/data/monthly/pdf/sec9_6.pdf; EIA, Annual Energy Review 2009, (Washington, DC: EIA, August 2010), Appendix A, Table A1, http://www.eia.gov/totalenergy/data/annual/pdf/sec13_1.pdf; EIA, “Oil Crude and Petroleum Products Explained: Data and Statistics,” last updated July 5, 2011, accessed July 13, 2011, http://www.eia.gov/energyexplained/index.cfm?page=oil_home#tab2. Note that the price of motor gasoline is used in this example for simplicity purposes. Using diesel in these examples would yield different results because of differences in prices and heat content).Cost of motor gasoline based on $3.98 per gallon or $31.84 per MBtu, including taxes, (data from EIA, Monthly Energy Review, May 2011), energy content for motor gasoline of 5.253
MBtu per barrel (EIA, Annual Energy Review 2009), barrel to gallon conversion for petroleum products of 42 gallons per barrel (EIA, “Oil Crude and Petroleum Products Explained: Data and Statistics”). Calculations: $15.9 billion = $281.2 billion * 5.66%; $17.9 billion = $241.08 billion * 7.41%.
25 Oak Ridge National Laboratory, Transportation Energy Data Book 29th Edition, Transportation Energy Use by Mode 2007–2008 (Washington, DC: U.S. Department of Energy, July 2010), Table 2.6, http://cta.ornl.gov/data/tedb29/Spreadsheets/Table2_06.xls. In 2008, cars consumed 8,831 TBtu and light-duty trucks consumed 7,572 TBtu, A 6% increase in car fuel economy results in a 5.66% decrease in fuel consumption. An 8% increase in light-duty truck fuel economy results in a 7.41% decrease in fuel consumption. Calculations: Energy savings for cars = 500 TBtu = 8,831 TBtu * 5.66%; Energy savings for light-duty trucks = 561 TBtu = 7,572 * 7.41%; 500 TBtu + 561 TBtu = 1,061 TBtu.
26 Oak Ridge National Laboratory, Transportation Energy Data Book 29th Edition, Transportation Energy Use by Mode 2007–2008 (Washington, DC: U.S. Department of Energy, July 2010), Table 11.7, http://cta.ornl.gov/data/tedb29/Spreadsheets/Table11_07.xls. Calculations, assuming car CO2 emissions make up 54% of total car and truck emissions, based on the fraction of energy consumed by cars compared to light trucks: 54% = 8,831 TBtu/(8,831 TBtu + 7,572 TBtu). Then 34 MMTCO2 = 1,113.3 MMTCO2 * 5.66% * 54%; 38 MMTCO2 = 1,113 * 7.41% * 46%; 34 MMTCO2 + 38 MMTCO2 = 72 MMTCO2.
27 U.S. Energy Information Administration, (EIA), Monthly Energy Review, May 2011 (Washington, DC: EIA, 2011), Table 12.6, http://www.eia.gov/totalenergy/data/monthly/pdf/sec12_9.pdf.
28 U.S. Energy Information Administration (EIA), Electric Power Annual (Washington, DC: EIA, April 2011), Table 8.1, http://www.eia.doe.gov/cneaf/electricity/epa/epat8p1.html.
29 U.S. Energy Information Administration (EIA), Monthly Energy Review, May 2011 (Washington, DC: EIA, 2011), Table 7.2a, http://www.eia.gov/totalenergy/data/monthly/pdf/sec7_5.pdf.
30 U.S. Department of Energy (DOE) Office of Energy Efficiency and Renewable Energy (EERE), “20% Wind Energy by 2030: Increasing Wind Energy’s Contribution to U.S. Electricity Supply,” DOE/GO-102008-2567, (Washington, DC: DOE, July 2008), http://www1.eere.energy.gov/windandhydro/pdfs/41869.pdf.
31 U.S. Energy Information Administration, Monthly Energy Review May 2011 (Washington, DC: U.S. Energy Information Administration, May 2011), Table 2.6, http://www.eia.gov/totalenergy/data/monthly/pdf/sec2_13.pdf. In 2010, the total U.S. energy consumption for electricity generation was 39,579 TBtu. Calculation: 396 TBtu = 1% * 39,579 TBtu.
32 U.S. Energy Information Administration (EIA), Monthly Energy Review, May 2011, Table 12.6 (Washington, DC: EIA, 2011), http://www.eia.gov/totalenergy/data/monthly/pdf/sec12_9.pdf; Ibid, Table 2.6, http://www.eia.gov/totalenergy/data/monthly/pdf/sec2_13.pdf. Calculation: 23 MMT = 1% * (39,579 TBtu/(39,579 TBtu - 924 TBtu)) * 2,271 MMT. (Based on average CO2 emissions for non-wind production; wind technologies do not produce emissions when generating electricity.)
33 U.S. Energy Information Administration (EIA), Electric Power Annual (Washington, DC: EIA, April 2011), Table 8.1, http://www.eia.doe.gov/cneaf/electricity/epa/epat8p1.html; U.S Energy Information Administration (EIA), Monthly Energy Review, May 2011, Table 2.6, http://www.eia.gov/totalenergy/data/monthly/pdf/sec2_13.pdf. Calculation: $412 million = 1% * (39,579 TBtu/(39,579 TBtu - 924 TBtu)) * $40.2 billion in fuels purchased by major investor-owned utilities. (Based on average fuel costs for non-wind production; wind technologies do not incur fuel costs when generating electricity.)
34 Workshop discussion, New Paradigm Materials Manufacturing Processes—Energy Efficient Metals Production Impact Team Workshop, Warrendale, PA, June 20–21, 2011.
35 Oak Ridge National Laboratory, Transportation Energy Data Book 29th Edition, Transportation Energy Use by Mode 2007–2008 (Washington, DC: U.S. Department of Energy, July 2010), Table 2.6, http://cta.ornl.gov/data/tedb29/Spreadsheets/Table2_06.xls.
36 Lynette Cheah, John Heywood, and Randolph Kirchain, “The Energy Impact of U.S. Passenger Vehicle Fuel Economy Standards,” (presentation, IEEE International Symposium on Sustainable Systems

104
and Technology, Washington, DC, May 17–19; Oak Ridge National Laboratory, Transportation Energy Data Book 29th Edition, Transportation Energy Use by Mode 2007–2008, Table 2.6, (Washington, DC: U.S. Department of Energy, July 2010) http://cta.ornl.gov/data/tedb29/Spreadsheets/Table2_06.xls.. In 2008, cars consumed 8,831 TBtu and light-duty trucks consumed 7,572 TBtu. Assumes for every 10% weight reduction, fuel economy could increase by 6% for cars and 8% for light-duty trucks. A 6% increase in car fuel economy results in a 5.66% decrease in fuel consumption. An 8% increase in light-duty truck fuel economy results in a 7.41% decrease in fuel consumption. Calculations: Energy savings for cars = 500 TBtu = 8,831 TBtu * 5.66%; energy savings for light-duty trucks = 561 TBtu = 7,572 * 7.41%; 500 TBtu + 561 TBtu = 1,061 TBtu.
37 Oak Ridge National Laboratory, Transportation Energy Data Book 29th Edition, Transportation Energy Use by Mode 2007–2008 (Washington, DC: U.S. Department of Energy, July 2010), Table 11.7, http://cta.ornl.gov/data/tedb29/Spreadsheets/Table11_07.xls. Assumes car CO2 emissions make up 54% of total car and truck emissions, based on the fraction of energy consumed by cars compared to light-duty trucks. Calculation: 54% = 8,831 TBtu/(8,831 TBtu + 7,572 TBtu); 34 MMTCO2 = 1,113.3 MMTCO2 * 5.66% * 54%; 38 MMTCO2 = 1,113 * 7.41% * 46%; 34 MMTCO2 + 38 MMTCO2 = 72 MMTCO2.
38 Oak Ridge National Laboratory, Transportation Energy Data Book 29th Edition, Transportation Energy Use by Mode 2007–2008, (Washington, DC: U.S. Department of Energy, July 2010), Table 2.6, http://cta.ornl.gov/data/tedb29/Spreadsheets/Table2_06.xls; U.S Energy Information Administration (EIA), Monthly Energy Review, June 2011 (Washington, DC: EIA, 2011), Table 9.4, http://www.eia.gov/totalenergy/data/monthly/pdf/sec9_6.pdf; EIA, Annual Energy Review 2009 (Washington, DC: EIA, August 2010), Appendix A, Table A1 http://www.eia.gov/totalenergy/data/annual/pdf/sec13_1.pdf; EIA, “Oil Crude and Petroleum Products Explained: Data and Statistics,” last updated July 5, 2001, accessed July 13, 2011, http://www.eia.gov/energyexplained/index.cfm?page=oil_home#tab2. Note that the price of motor gasoline is used in this example for simplicity purposes. Using diesel in these examples would yield different results because of differences in prices and heat content.Cost of motor gasoline based on $3.98 per gallon or $31.84 per MBtu, including taxes, (EIA, Monthly Energy Review, May 2011), energy content for motor gasoline of 5.253 MBtu per barrel (EIA, Annual Energy Review 2009), barrel to gallon conversion for petroleum products of 42 gallons per barrel (EIA, “Oil Crude and Petroleum Products Explained: Data and Statistics”). Calculations: $15.9 billion = $281.2 billion * 5.66%; $17.9 billion = $241.08 billion * 7.41%.
39 Prepared by Energetics Incorporated for the U.S. Department of Energy, Industrial Technologies Program, “Manufacturing Energy and Carbon Footprints: Iron and Steel,” http://www1.eere.energy.gov/industry/pdfs/steel_footprint.pdf.
40 Ibid.
41 Ibid.
42 U.S. Census Bureau, “Annual Survey of Manufactures: Statistics for Industry Groups and Industries,” accessed August 30, 2011, http://www.census.gov/manufacturing/asm/index.html. Calculations: $4.89 billion * 10% = 489 million; 1.75 billion * 10% = 175 million.
43 Prepared by Energetics Incorporated for the U.S. Department of Energy, Industrial Technologies Program, “Manufacturing Energy and Carbon Footprints: Iron and Steel,” http://www1.eere.energy.gov/industry/pdfs/steel_footprint.pdf.
44 U.S. Census Bureau, “Annual Survey of Manufactures: Statistics for Industry Groups and Industries,” accessed August 30, 2011, http://www.census.gov/manufacturing/asm/index.html. Calculations: $4.89 billion * 10% = 489 million; 1.75 billion * 10% = 175 million.
45 Steel Recycling Institute, “The North American Steel Industry Reduces Energy Intensity,” 2011, accessed August 30, 2011, http://www.recycle-steel.org/Sustainability/Energy%20Reduction.aspx.
46 International Aluminum Institute, “Energy Use: Primary Aluminum,” 2011, accessed August 30, 2011, http://www.world-aluminium.org/Sustainability/Environmental+Issues/Energy+use.
47 The Aluminum Association, “State Grant Supports Study of Aluminum Energy Efficiency,” May 1, 2007, accessed August 30, 2011, http://www.aluminum.org/AM/Template.cfm?Section=New_Can_Stock_%28Class%29_Scrap_Receipts&TEMPLATE=/ CM/ContentDisplay.cfm&CONTENTID=24688.
48 C.A. Lavender, V.S. Moxson, and V.A. Duz, Cost-Effective Production of Powder Metallurgy Titanium Components for High-Volume Commercial Applications (Washington, DC: DOE, October 2010), http://www.pnl.gov/main/publications/external/technical_reports/PNNL-19932.pdf.

105
Realizing materials science and engineering (MSE) innovation requires an integrated approach that can simultaneously propel research and
development (R&D) in Functional Surface Technologies, Materials Integration in Clean Energy Systems, Higher-Performance Materials, and New Paradigm Materials Manufacturing Processes. Computer-aided simulation tools that are guided, validated, and verified by critical experiments can systematically accelerate the research priorities discussed in the past four chapters to maximize the impact that MSE can have on meeting the nation’s energy and carbon reduction needs.
Materials and process development tools are critical to understanding the nature of materials, simulating system performance, and preventing detrimental defects and faults. Radical advances in collaborative databases and predictive modeling tools have allowed computational systems to not only model experimentally proven phenomena, but also simulate theoretical interactions that can direct laboratory work in the hypothesis stage. Computational modeling holds promise to transform MSE from an empirical, time-consuming, and costly endeavor into a more rapid materials design and development cycle based on the iterative interaction between computational and experimental tools.
The following pathways provide a guide for the R&D of tools that can accelerate materials and process innovation:
• Collaborative Databases
• Predictive Modeling of Material Performance
• Process Modeling Codes
• Integrated Computational Materials Engineering
CollAboRAtive dAtAbAsesCollaborative materials databases include images and quantitative data that characterize the structure and properties of functional and structural materials (e.g., microstructure, conductivity, strength, diffusion, corrosion resistance, and viscosity). Increasing the comprehensiveness and usability of these databases can enable codes and models to simulate relevant materials and processes more accurately and can greatly accelerate the exchange of critical information and data needed for materials and process design. As a result, these advances can increase the efficiency and reduce the cost of test models and the resultant materials design and implementation, leading to economic and energy savings in nearly every energy sector.
Breakthrough Opportunities
The MSE community can advance collaborative databases by developing and improving both structural and functional materials databases. Addressing the gaps and limitations specific to each of these breakthrough opportunities will allow collaborative databases to make significant contributions toward addressing energy, environmental, and economic needs.
vii. MAteRiAls And pRoCess developMent ACCeleRAtion tools

106
Collaborative Databases
Structural Materials Databases
Structural materials databases contain images and information about the structure and properties of various materials, including microstructure, strength, modulus, and thermal/electrical conductivity. These databases help materials scientists make informed decisions when selecting materials for a given application and provide critical input and validation for predictive computational models. This streamlined process greatly reduces trial and error, resulting in cost, time, and energy savings.
Historically, structural information about materials was recorded in only two dimensions, and eventually developed into data for 3-D analysis. Today, 4-D data adds a new level of accuracy by describing how material properties change over a given period of time. This analysis is especially applicable to the study of microstructural data.
The Materials Genome Initiative is a new, multi-stakeholder effort to develop an infrastructure to accelerate advanced materials discovery and deployment in the United States. Over the last several decades there has been significant federal investment in new experimental processes and techniques for designing advanced materials. This focused initiative will better leverage existing federal investments through the use of computational capabilities, data management, and an integrated approach to MSE.1
gAps And liMitAtions to oveRCoMe• Newer data, particularly microstructural data, must be highly
detailed to be comprehensive. This data requires massive storage that breaches the allowable limits of digital space. Therefore, the data is also difficult to transfer through current technology because of the bandwidth required (e.g., hours of upload/download to move from machine to machine, site to site). Data sharing and transfer may be a greater limitation than data storage.
Highly Impacted Materials and Processing Innovation Areas
Functional Surface Technologies
• Coatings
Materials Integration in Clean Energy Systems
• Joining Processes for Multi-Material Structures
• Composites with Structural Capabilities
Higher-Performance Materials• Phase-Stable Metallic Materials• Surface Treatments• Lightweight High-Strength
Materials
New Paradigm Materials Manufacturing Processes
• Net-Shape Processing• Additive Manufacturing• Energy-Efficient Metals
Production
Historical Trends and Future Opportunities
evolution of stRuCtuRAl MAteRiAls dAtAbAses
1990 2000 2010
TIM
ELIN
E
STR
UC
TU
RA
L M
AT
ERIA
LS D
ATA
BA
SE
2020
— 2-
D—
3-D
— M
ateria
ls Gen
ome Init
iative
— Fa
r gre
ater 3
-D an
d 4-D
data
avail
abilit
y
— H
igher
reso
lution d
ata
— C
ollabo
ration p
latform
via
M
ateria
ls Gen
ome Init
iative
— 4-
D
The key metrics of today’s structural materials databases are population and resolution. Property data from approximately 10 years ago has not changed significantly, but the advancement of microstructural data requires updating with higher resolution. An increase in the population of 3-D and 4-D data is expected in the next 10 years.
Additionally, the Materials Genome Initiative will help enable a data exchange system that will allow researchers to index, search, and compare data to allow greater integration and collaboration.

107
Collaborative Databases
Functional Materials Databases
Functional materials databases hold extensive property data of materials and relevant systems such as solar photovoltaics, thermoelectrics, and fuel cells. Functional materials (sometimes known as “smart materials”) are different from structural materials because load bearing and/or mechanical stability are typically not their primary function and environmental forces such as temperature and pressure may change their physical and chemical properties. The desired outcome may be energy capture, higher product yield, or improved system efficiency.
gAps And liMitAtions to oveRCoMe• Currently there are no comprehensive systematic functional
materials databases, but rather “islands” of databases with limited accessibility. Most of these are only published papers.
Highly Impacted Materials and Processing Innovation Areas
Functional Surface Technologies
• Catalysts• Solar Materials• Gas-Separating Membranes
Materials Integration in Clean Energy Systems
• Next-Generation Batteries and Fuel Cells
Higher-Performance Materials• Thermoelectric Materials
New Paradigm Materials Manufacturing Processes
• Additive Manufacturing
Historical Trends and Future Opportunities
nuMbeR of jouRnAls RefeRenCing “funCtionAl MAteRiAls” And otheR keywoRds
140120100
80604020
01992 1994 20101996 1998 2000 2002 2004 2006 2008
CIT
AT
ION
IN E
AC
H Y
EAR
700600500400300200100
01992 1994 20101996 1998 2000 2002 2004 2006 2008
CIT
AT
ION
IN E
AC
H Y
EAR
Functional MaterialsSOFC
Photovoltaics
Semiconductors
Steel
Supplemental Search Term
Supplemental Search Term
These results are based on a search with the phrase “computational modeling” as opposed to “databases,” as the latter implies a definition of the word that is too broad. A search of “steel” is used as a tool for comparison with a common structural material.
Functional materials databases significantly lag behind structural materials databases. The historical progression of functional materials databases may be represented by the number of citations that reference specific functional materials. Even though the future improvements in functional materials databases are expected to be minimal, they will be valuable as functional materials continue to make breakthroughs in materials properties and performance over the next 10 years.

108
R&D Priority Activities: Collaborative Databases
To overcome the gaps and limitations within the collaborative databases breakthrough opportunities, the MSE community must focus their efforts on expanding and improving the quality of data in databases, establishing database infrastructures and interfaces, and pursuing
other R&D activities provided in the following table. The table divides the priority activities for each research initiative by the time frame in which they are estimated to impact U.S. energy sectors: near term (0–2 years), mid term (2–5 years), and long term (5–10 years).
NEAR TERM (0–2 yEARS)
StructuralMaterialsDatabases• Establishfundamentaldatabasesforepoxyresindesignandotherpolymersandforadvancedmetallicsandcompositessystems.
• Addtopology/structuretodatabasesandincludeasearchfunction.
FunctionalMaterialsDatabases• Establishadatabasefornanoparticlesynthesisthatmaybeusedforcatalysis-basedwork.
Crosscutting• Link/condense existing materials databases for ease of access, reduced overlap, and
increased gap identification.
MID TERM (2–5 yEARS)
StructuralMaterialsDatabases• Establish a database/infrastructure for lightweight high-strength materials and advanced
metallics and composites.
FunctionalMaterialsDatabases• Establishbasicdatabases/infrastructureforphotovoltaics,thermoelectrics,andfuelcells.
• Enhancecoatingsandsubstratesdatabasesintendedfordescriptiveandpredictivemodeling.
Crosscutting• Integrate and input ab-initio and density functional theory output data into CALPHAD
(CALculation of PHAse Diagrams) for the prediction of life-limited phases of alloy design models.
LONG TERM (5–10 yEARS)
StructuralMaterialsDatabases• Integrate pressure/volume/bulk modulus data into CALPHAD databases.
FunctionalMaterialsDatabases• Establish a database/infrastructure for electrolyte materials.• Establish a database/infrastructure for solid oxide fuel cell materials and membranes.
Crosscutting• Establish more accurate low-temperature data for thermodynamic and kinetic models to
assist with solving solid-state precipitation and life-limiting issues.
*The experts identified the boldedactivities as high priority.

109
pRediCtive Modeling of MAteRiAl peRfoRMAnCeComputer-assisted predictive modeling enables materials scientists to simulate the performance characteristics of materials in different operating environments and conditions. Prior to the use of predictive modeling, materials scientists observed materials after they failed, which is referred to as descriptive modeling. Improving predictive modeling of materials deformation, fracture and fatigue, and degradation can help prevent failure by facilitating the development of materials capable of resisting the mechanical and/or thermal loading, corrosion, oxidation, and wear/tribological effects of a given application. As a result, these advances can ensure that materials scientists select materials with properties that can withstand the operating conditions of a particular application, reducing the number of physical test models required and lowering the cost of manufacturing products.
Breakthrough Opportunities
The MSE community can advance predictive modeling of materials performance in the following areas: deformation and texture evolution, fracture and fatigue, and materials degradation. Addressing the gaps and limitations specific to each of these breakthrough opportunities will allow predictive modeling of materials performance to make significant contributions toward addressing energy, environmental, and economic needs.

110
Predictive Modeling of Material Performance
Deformation and Texture
Deformation of materials through thermodynamic, mechanical, and other influences can be computationally modeled, which is more efficient and cost-effective than using descriptive trial and error techniques. Some of the predictive modeling techniques used for deformation and texture of parts are finite element analysis, phase field modeling, atomistic modeling, and multi-scale and multi-physics modeling. Deformation and texture predictive modeling can improve the safety, efficiency, lifetime, and speed of market readiness of system components.
gAps And liMitAtions to oveRCoMe• Predictive modeling techniques depend on the integration and
accuracy of materials databases, which must be expanded and corrected to produce valid deformation results.
• The accuracy of model validation can be decreased by outdated data.
Highly Impacted Materials and Processing Innovation Areas
Materials Integration in Clean Energy Systems
• Joining Processes for Multi-Material Structures
• Composites with Structural Capabilities
Higher-Performance Materials• Phase-Stable Metallic Materials• Surface Treatments• Lightweight High-Strength
Materials
New Paradigm Materials Manufacturing Processes
• Net-Shape Processing• Energy-Efficient Metals
Production
Historical Trends and Future Opportunities
peRCentAge of teChniCAl pApeRs on Modeling thAt AddRess MiCRostRuCtuRe And defoRMAtion
4.5
4.0
3.5
3.0
2.5
2.0
1.5
1.0
0.5
0.0
<1980
1981
–199
0
1991
–200
0
2001
–201
2
% O
F M
OD
ELIN
G P
AP
ERS
INC
LUD
ING
"D
EFO
RM
AT
ION
"
1.731.85
3.41
4.020.7
0.6
0.5
0.4
0.3
0.2
0.1
0.0
<1980
1981
–199
0
1991
–200
0
2001
–201
2
% O
F M
OD
ELIN
G P
AP
ERS
INC
LUD
ING
"M
ICR
OST
RU
CT
UR
AL"
0.160.20
0.49
0.63
76.19 166.89820.13
2,343.88
<1980 1981–1990 1991–2000 2001–2012
TOTAL SCIENCE & TECHNOLOGY PAPERS (IN THOUSANDS)
Over the past 60 years, descriptive techniques for understanding deformation and texture have advanced into predictive techniques. The number of references to research involving computational modeling and simulation of deformation and microstructural effects shows that the field has been rapidly growing over the last few decades. The graphs represent the percentage of science and technology papers that contain the search terms “deformation” and “microstructural.” Over the next 10 years, there is expected to be an exponential increase in the number of references to deformation and texture modeling codes in response to more accurate predictive models.2

111
Predictive Modeling of Material Performance
Fracture and Fatigue
Predictive modeling of materials fracture and fatigue involves the probabilistic science and behavior of defects and accelerated void coalescence. By properly simulating voids in a model, the ability to predict fatigue life and failure locations becomes more accurate and reliable. A cutting-edge predictive mechanistic framework enhances scientists’ understanding of failure mechanisms, and therefore awards them the tools to build efficient, optimized parts. The computational modeling of fracture and fatigue in metals has made a dramatic transition from descriptive to predictive over the past decade.
gAps And liMitAtions to oveRCoMe• Numerical approaches in predictive modeling codes need major
improvements so modeling codes can accurately simulate voids to predict fatigue failure locations.
• Fracture models need extensive and accurate validation from experiments.
Highly Impacted Materials and Processing Innovation Areas
Functional Surface Technologies
• Gas-Separating Membranes
Materials Integration in Clean Energy Systems
• Joining Processes for Multi-Material Structures
• Composites with Structural Capabilities
Higher-Performance Materials• Phase-Stable Metallic Materials• Surface Treatments • Lightweight High-Strength
Materials
New Paradigm Materials Manufacturing Processes
• Additive Manufacturing
Historical Trends and Future Opportunities
MiCRoMeChAniCs fAtigue nuCleAtion siMulAtion
2002 2009 20102007 20082005 20062003 2004
TIM
ELIN
E
MICROMECHANICS FATIGUE NUCLEATION SIMULATION
2011
— C
ast A
l
— N
i—
Wro
ught
Al
— St
eel
— T
i, Cast
Mg
In the area of fatigue modeling, a major improvement in predictive capability has involved addressing the early stages of high-cycle fatigue, including crack nucleation and microstructurally short crack growth.
In 2003, micromechanical modeling of plasticity-based damage at fatigue nucleants (e.g., pores and inclusions in cast automotive aluminum alloys) demonstrated nucleation-controlled high-cycle fatigue life.3 Since 2003, additional predictive simulations of micromechanics fatigue nucleation have been applied to nickel (Ni), titanium (Ti), magnesium (Mg), wrought aluminum (Al), and steel. Future predictive simulations will focus on developing more accurate codes and simulating other advanced metal alloy systems.

112
Predictive Modeling of Material Performance
Materials Degradation
Predictive modeling of materials degradation enables materials scientists to quantify the approximate lifetime of a part in response to influences such as wear and corrosion. Uncertainty quantification can determine the accuracy of degradation modeling, allowing materials scientists to determine the margin of error of a degradation prediction. Accurate data and predictive degradation modeling can significantly reduce the amount of test time required to develop and certify nuclear fuels, which typically takes 20 years from inception to certification.
gAps And liMitAtions to oveRCoMe• Corrosion models and irradiation-damage models currently lack
coupling with accurate and extensive databases to provide improved materials lifetime predictions.
• Uncertainty quantification methods must be improved to allow predictive models to simulate reactor irradiation conditions if linked with appropriate component physics experiments.
Highly Impacted Materials and Processing Innovation Areas
Functional Surface Technologies
• Catalysts • Solar Materials• Coatings
Materials Integration in Clean Energy Systems
• Next-Generation Batteries and Fuel Cells
• Joining Processes for Multi-Material Structures
• Composites with Structural Capabilities
Higher-Performance Materials• Phase-Stable Metallic Materials• Surface Treatments• Lightweight High-Strength
Materials
Historical Trends and Future Opportunities
nuMbeR of yeARs of seRviCe life thAt CAn be pRediCted viA Modeling
90
80
70
60
50
40
30
20
10
0
1960s 2011 2020
LIFE
TIM
E P
RED
ICT
ION
(Y
EAR
S)
A key metric for measuring the historical advances of materials degradation modeling is the maximum number of years of a part’s lifetime that scientists can accurately predict. In the 1960s, maximum predictable lifetime for a part was 40 years. With materials degradation modeling codes, today’s lifetime prediction has increased to 60 years. In the next 10 years, scientists may be able to predict the lifetime of a part up to 80 years.
Lifetime Prediction
• 1960s: 40 years
• 2011: 60 years
• 2020: 80 years

113
R&D Priority Activities: Predictive Modeling of Material Performance
To overcome the gaps and limitations within the predictive modeling of materials performance breakthrough opportunities, the MSE community must focus their efforts on creating new methodologies, advancing computational codes, and pursuing other R&D
activities provided in the following table. The table divides the priority activities for each research initiative by the time frame in which they are estimated to impact U.S. energy sectors: near term (0–2 years), mid term (2–5 years), and long term (5–10 years).
NEAR TERM (0–2 yEARS)
Crosscutting• Createastatisticalrepresentationofmicrostructuralevolutionincodesforthepredictionofmaterialperformance.
MID TERM (2–5 yEARS)
FractureandFatigue• Develop robust methodologies for combining phenomenological material models with
crystal plasticity results (e.g., room-temperature-, warm-, and hot-forming of magnesium sheet alloys).
• Incorporate fracture into component simulations under impact conditions.• Develop reliable fracture models (e.g., cohesive zone) that can be validated by experiments.
MaterialsDegradation• Developacoatings“degradationpredictor”forenergytechnologies.
Crosscutting• Developpracticalandcomputationallyefficientapproachesincouplingmultiphysicsandmulti-scalemodelingofmaterialsperformance.
• Establishprobabilisticstrategiesforextendingpartlifethataccountformicrostructuralvariances.
• Integrate and input ab-initio and density functional theory output data into CALPHAD for the prediction of life-limited phases of alloy design models.
• Integrate codes for the interaction of coatings and substrates.
LONG TERM (5–10 yEARS)
MaterialsDegradation• ImprovethecouplingofCALPHAD-typedatabasesintocorrosionmodelsandirradiation-damagemodels.
*The experts identified the boldedactivities as high priority.
pRoCess Modeling CodesProcess modeling codes are used in the predictive modeling of material processes to optimize process efficiency and to determine the properties of resulting materials and components. Simulating processes like stamping, forging, or gas-pressure forming before using them to manufacture materials provides insight into ways to optimize processes, such as improving heat balance or the loading of furnaces for heat treatment. Using process modeling codes to improve materials processes prior to manufacture can drastically increase the efficiency and lower the costs of materials manufacturing processes.
Breakthrough Opportunities
The MSE community can advance process modeling codes by focusing on microstructural evolution and materials performance, materials/compound discovery, and process manufacturing and component performance. Addressing the gaps and limitations specific to each of these breakthrough opportunities will identify a path forward for maximizing the economic, environmental, and energy benefits of process modeling codes in energy markets.

114
Process Modeling Codes
Microstructural Evolution and Materials Performance
Evolution of microstructure can be modeled with modeling codes that use principles from thermodynamics and kinetics, as well as data from forging, casting, and other processes to predict how microstructure will evolve and affect materials performance. Using process modeling codes to understand the evolution of microstructure during the synthesis of materials accelerates the development of products and reduces costs. The development of thermodynamic and kinetic databases for practical materials, such as thermoelectric materials with high figures of merit (ZT) and copper iridium gallium selenide (CIGS) photovoltaics, is an important precursor to modeling microstructural evolution in materials during processing and service.4
gAps And liMitAtions to oveRCoMe• There is currently a lack of composition- and temperature-
dependent property data, especially at low temperatures.
• There is a lack of data on interfacial energies of materials microstructures.
Highly Impacted Materials and Processing Innovation Areas
Functional Surface Technologies• Coatings
Materials Integration in Clean Energy Systems
• Joining Processes for Multi-Material Structures
• Composites with Structural Capabilities
Higher-Performance Materials• Thermoelectric Materials• Phase-Stable Metallic Materials• Surface Treatments• Lightweight High-Strength
Materials
New Paradigm Materials Manufacturing Processes
• Net-Shape Processing• Additive Manufacturing• Low-Cost Composites
Manufacturing• Energy-Efficient Metals
Production
Historical Trends and Future Opportunities
publiCAtions And CitAtions thAt inClude the seARCh teRM “theRMo-CAlC”
1,400
1,200
1,000
800
600
400
200
0
CIT
AT
ION
S IN
EA
CH
YEA
R
80
70
60
50
40
30
20
10
01992 1996 2000 2004 2008 2012
PU
BLI
SHED
ITEM
S IN
EA
CH
YEA
R
––––––
1992 1996 2000 2004 2008 2012
––––––
Process modeling codes for microstructural evolution are relatively scarce and have improved little in the past 20 years. However, a more appropriate representation of the historical improvement of these process modeling codes is the number of publications and citations that use the thermodynamics, diffusion, and kinetics software called “Thermo-Calc.” There has been a dramatic increase in the number of publications and citations that discuss microstructural evolution codes and databases since the 1990s. The number of publications and citations is expected to increase exponentially over the next 10 years.5

115
Process Modeling Codes
Materials/Compound Discovery
Process modeling codes captured in atomic-scale calculations aim to enable materials scientists to predict materials properties and crystal structures, validate other codes, and discover new materials and compounds. The use of fundamental codes can lead to the identification of previously unknown trends and correlations and can be expanded to give way to new compound predictions.
gAps And liMitAtions to oveRCoMe• The prediction of new compounds can be impeded by the difficulty
of predicting the correct crystal structure.
• Scientists lack robust kinetics codes for building new compounds and structures.
Highly Impacted Materials and Processing Innovation Areas
Functional Surface Technologies
• Catalysts
Materials Integration in Clean Energy Systems
• Next-Generation Batteries and Fuel Cells
Higher-Performance Materials• Thermoelectric Materials• Phase-Stable Metallic Materials
New Paradigm Materials Manufacturing Processes
• Additive Manufacturing
Historical Trends and Future Opportunities
CoMpounds disCoveRed fRoM density funCtionAl theoRy CAlCulAtions
1,000,000
100,000
10,000
1,000
100
10
01990 20102000 2020
CO
MP
OU
ND
S D
ISC
OV
ERED
Discovery of new compounds has increased exponentially with the growth of atomic-scale calculations such as density functional theory (DFT). The number of new compound discoveries will continue to increase over the next 10 years with the improvement of kinetic codes and methods of predicting crystal structures are improved.6
Compounds Discovered
• 1990s: 1–2
• 2000: Hundreds
• 2011: Thousands
• 2020: Millions

116
Process Modeling Codes
Process Manufacturing and Component Performance
Materials scientists can model manufacturing processes using finite element simulation technology, including stamping, forging, or gas-pressure forming, and can model component performance through crash impact, noise, and vibration simulations. The use of such codes can significantly lower manufacturing costs and the need to conduct laboratory tests.
gAps And liMitAtions to oveRCoMe
• There is a lack of physics-based constitutive material models for finite element simulations, particularly for metals. The finite element programs have advanced considerably, but the materials models used in the software are lacking.
Highly Impacted Materials and Processing Innovation Areas
Functional Surface Technologies• Solar Materials
Materials Integration in Clean Energy Systems
• Next-Generation Batteries and Fuel Cells• Joining Processes for Multi-Material
Structures• Composites with Structural Capabilities
Higher-Performance Materials• Thermoelectric Materials• Phase-Stable Metallic Materials• Surface Treatments • Lightweight High-Strength Materials
New Paradigm Materials Manufacturing Processes
• Net-Shape Processing• Additive Manufacturing• Low-Cost Composites Manufacturing• Energy-Efficient Metals Production
Historical Trends and Future Opportunities
nuMbeR of fit pARAMeteRs RequiRed of MAteRiAls Models
16
14
12
10
8
6
4
2
01990 2000 20202010
MA
TER
IAL
MO
DEL
"FIT
" PA
RA
MET
ERS
~15
~12
~9
~0
Improvement of material constitutive models can be measured by the elimination of fit parameters. This metric indicates the ability for the material model to accurately predict the physical response of the material in simple experiments and complex forming processes. Around 2000, a crystal plasticity model required about 15 fitting parameters. Remaining parameters must be generated through fits to experimental data. In the next 10 years, materials scientists are expected to be able to predict these material properties from physics-based models, thereby entirely eliminating the need for data fitting.7
Material Model Fit Parameters
• 1990: ~15• 2000: ~12• 2010: ~9• 2020: ~0
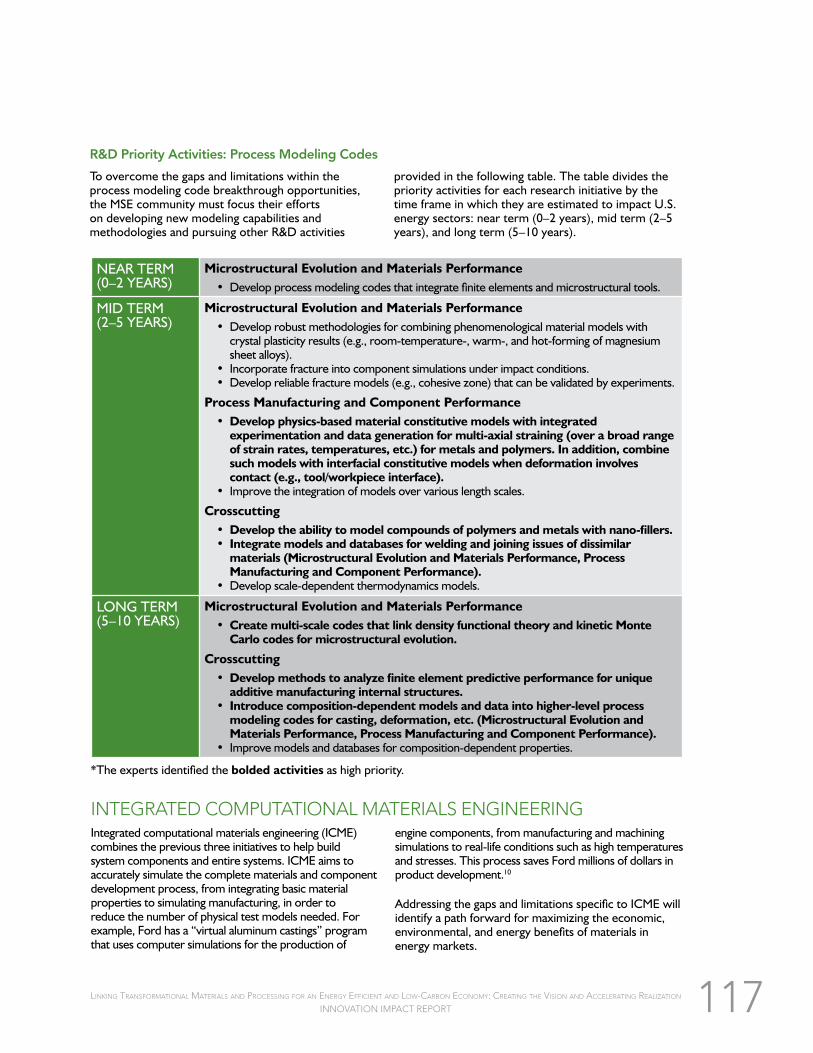
117
R&D Priority Activities: Process Modeling Codes
To overcome the gaps and limitations within the process modeling code breakthrough opportunities, the MSE community must focus their efforts on developing new modeling capabilities and methodologies and pursuing other R&D activities
provided in the following table. The table divides the priority activities for each research initiative by the time frame in which they are estimated to impact U.S. energy sectors: near term (0–2 years), mid term (2–5 years), and long term (5–10 years).
NEAR TERM (0–2 yEARS)
MicrostructuralEvolutionandMaterialsPerformance• Develop process modeling codes that integrate finite elements and microstructural tools.
MID TERM (2–5 yEARS)
MicrostructuralEvolutionandMaterialsPerformance• Develop robust methodologies for combining phenomenological material models with
crystal plasticity results (e.g., room-temperature-, warm-, and hot-forming of magnesium sheet alloys).
• Incorporate fracture into component simulations under impact conditions.• Develop reliable fracture models (e.g., cohesive zone) that can be validated by experiments.
ProcessManufacturingandComponentPerformance• Developphysics-basedmaterialconstitutivemodelswithintegratedexperimentationanddatagenerationformulti-axialstraining(overabroadrangeofstrainrates,temperatures,etc.)formetalsandpolymers.Inaddition,combinesuchmodelswithinterfacialconstitutivemodelswhendeformationinvolvescontact(e.g.,tool/workpieceinterface).
• Improve the integration of models over various length scales.
Crosscutting• Developtheabilitytomodelcompoundsofpolymersandmetalswithnano-fillers.• Integratemodelsanddatabasesforweldingandjoiningissuesofdissimilarmaterials(MicrostructuralEvolutionandMaterialsPerformance,ProcessManufacturingandComponentPerformance).
• Develop scale-dependent thermodynamics models.
LONG TERM (5–10 yEARS)
MicrostructuralEvolutionandMaterialsPerformance• Createmulti-scalecodesthatlinkdensityfunctionaltheoryandkineticMonteCarlocodesformicrostructuralevolution.
Crosscutting• Developmethodstoanalyzefiniteelementpredictiveperformanceforuniqueadditivemanufacturinginternalstructures.
• Introducecomposition-dependentmodelsanddataintohigher-levelprocessmodelingcodesforcasting,deformation,etc.(MicrostructuralEvolutionandMaterialsPerformance,ProcessManufacturingandComponentPerformance).
• Improve models and databases for composition-dependent properties.
*The experts identified the boldedactivities as high priority.
integRAted CoMputAtionAl MAteRiAls engineeRingIntegrated computational materials engineering (ICME) combines the previous three initiatives to help build system components and entire systems. ICME aims to accurately simulate the complete materials and component development process, from integrating basic material properties to simulating manufacturing, in order to reduce the number of physical test models needed. For example, Ford has a “virtual aluminum castings” program that uses computer simulations for the production of
engine components, from manufacturing and machining simulations to real-life conditions such as high temperatures and stresses. This process saves Ford millions of dollars in product development.10
Addressing the gaps and limitations specific to ICME will identify a path forward for maximizing the economic, environmental, and energy benefits of materials in energy markets.

118
Integrated Computational Materials Engineering
ICME Platforms
ICME platforms integrate materials information that is captured in computational tools with engineering product performance analysis and manufacturing process simulations.8 ICME enables researchers and engineers to model materials-related processes (e.g., oxidation, joining, welding, and brazing) and component production across the entire manufacturing cycle. It also allows materials scientists to model accelerated degradation of materials during their use.
Gaps and Limitations to overcome• It is only possible to predict materials properties such as phase
constitution, chemistry, and reactivity for a limited number of systems compared with the full range of possible combinations of compositions.
• Computational modeling has not yet been able to provide a thorough understanding of the relationships among materials history, microstructure, and properties. In addition, materials scientists’ ability to control microstructures is underdeveloped.
Highly Impacted Materials and Processing Innovation Areas
Functional Surface Technologies• Catalysts• Coatings
Materials Integration in Clean Energy Systems•Next-Generation Batteries and Fuel
Cells• Joining Processes for Multi-Material
Structures• Composites with Structural
Capabilities
Higher-Performance Materials• Phase-Stable Metallic Materials• Surface Treatments• Lightweight High-Strength Materials
New Paradigm Materials Manufacturing Processes•Net-Shape Processing• Additive Manufacturing• Energy-EfficientMetalsProduction
Historical Trends and Future Opportunities
computationaL materiaLs QuaLification acceLeration
Jan
99Ja
n 00
Jan
01Ja
n 02
Jan
03Ja
n 04
Jan
05Ja
n 06
Jan
07Ja
n 08
Jan
09Ja
n 10
Jan
11Ja
n 12
Jan
13Ja
n 14
Technology Readiness Level (TRL)
TRL3–4
TRL2
TRL1
TRL5–6: firstcomponent rig test
TRL6: systemintegration
TRL7: first landinggear field service
test flightMMPDS handbook update issued
Additional property data developed10th multi-ton full-scale ingot produced
Aerospace Materials Spec. issued
Static property data developed
3rd multi-ton full-scale ingot produced1st multi-ton full-scale ingot producedPrototype static properties demonstratedDesign goals established
Material Development Milestones
M54
S53
5 designiterations
1 designiteration
estimated
ICME modeling platforms have the abilitytoacceleratethequalificationofmaterials and products. The development timeline of QuesTek’s landing gear steels is a documented example. The Ferrium S53took8.5yearsfrompapertoflightqualification,withfivedesigniterations.The high-toughness Ferrium M54 for carrier-based planes (for use by the Naval Air Systems Command) is on schedule to qualifyforflightin5yearswithasingledesign iteration.9
Thefiguretotheleftisaflightqualificationtimeline showing the faster development time of the M54 system.

119
R&D Priority Activities: Integrated Computational Materials Engineering
To overcome the gaps and limitations of ICME, the MSE community must focus their efforts on expanding ICME capabilities and usability and pursuing other R&D activities provided in the following table. The table divides the
priority activities for ICME by the time frame in which they are estimated to impact U.S. energy sectors: near term (0–2 years), mid term (2–5 years), and long term (5–10 years).
NEAR TERM (0–2 yEARS)
• Developahigh-profileICMEexampletoshowitsapplicabilitytoenergyproblems(e.g.,fuelcells,batteries,heatexchangers,orwindturbines).
MID TERM (2–5 yEARS)
• Advanceandacceleratethequalificationofhigh-temperaturealloys.• Introducematerialsdesignfornoveljoinability(e.g.,automobileindustryspotwelding).
• Advancematerialsdesignforadditivemanufacturingofmagnesiumandtransformation-inducedplasticitysteels.
• Integratemodelsanddatabasesforweldingandjoiningissuesofdissimilarmaterials.
• Developinversemethodologiesformaterialsdesign.• Develop simulation-based design of nano-dispersion-enhanced thermoelectric materials.• Integrate the “I” with “CME”.
» Prove that ICME offers value beyond the archival literature with key case studies, specifically within the energy sector.
» Develop procedures for simulating an entire material within an overall component materials design and development cycle (not just one or two phases in a material).
• Develop a data infrastructure for next-generation steels, nickel-cobalt, and zirconium.
LONG TERM (5–10 yEARS)
• Developconcurrentdesignofamaterialanditsapplicablecomponentwithinanenergyapplicationarea.
• Develop a few web-based ICME platforms that will be available from anywhere there is an internet connection.
*The experts identified the boldedactivities as high priority.

120
notes1 National Science and Technology Council (NSTC), “Materials Genome
Initiative for Global Competitiveness,” (Washington, DC: NSTC, 2011).
2 Search conducted using Thomson Reuters Web of KnowledgeSM research platform, 2011, http://portal.isiknowledge.com/.
3 D. L. McDowell et al., “Microstructure-Based Fatigue Modeling of Cast A356-T6 Alloy,” Engineering Fracture Mechanics 70, no. 1 (2003): 49–80; J. B. Jordon et al., “Microstructural Inclusion Influence on Fatigue of a Cast A356 Aluminum Alloy,” Metallurgical and Materials Transactions A 41, no. 2 (2010): 356–363; M. M. Shenoy, R. S. Kumar, and D. L. McDowell, “Modeling Effects of Nonmetallic Inclusions on LCF in DS Nickel-Base Superalloys,” International Journal of Fatigue 27, no. 2 (2005): 113–127; C.-H. Goh, D. L. McDowell, and R. W. Neu, “Plasticity in Polycrystalline Fretting Fatigue Contacts,” Journal of the Mechanics and Physics of Solids 54, no. 2 (2006): 340–367; H. El Kadiri et al., “Identification and Modeling of Fatigue Crack Growth Mechanisms in a Die-Cast AM50 Magnesium Alloy,” Acta Materialia 54, no. 19 (2006): 5,061–5,076; L. Wang et al., “Three-Dimensional Finite Element Analysis Using Crystal Plasticity for a Parameter Study of Fatigue Crack Incubation in a 7075 Aluminum Alloy,” International Journal of Fatigue 31, no. 4 (2009): 659–667; Rajesh Prasannavenkatesan et al., “3D Modeling of Subsurface Fatigue Crack Nucleation Potency of Primary Inclusions in Heat Treated and Shot Peened Martensitic Gear Steels,” International Journal of Fatigue 31, no. 7 (2009): 1,176–1,189; M. F. Horstemeyer et al., “Nanostructurally Small Cracks: A Review on Atomistic Modeling of Fatigue,” International Journal of Fatigue 32, no. 9 (2010): 1,473–1,502.
4 Jean Claude Tedenac, R.M. Marin-Ayral, Didier Ravot, and F. Gascoin, “Chemical Thermodynamic in Thermoelectric Materials,” Advances in Electronic Ceramics II, eds. Shashank Priya, Anke Weidenkaff, and David P. Norton (Hoboken, NJ: John Wiley & Sons, Inc., 2010); Carelyn Campbell, “In Search of Rapid Processing Routes for CIGS Photovoltaic Absorber Materials” (presented at the 2010 Minerals, Metals and Materials Society Annual Meeting and Exhibition, Warrendale, PA, February 14–18, 2010.)
5 Internet search conducted using ISI Web of Knowledge. Thompson Reuters, “ISI Web of Knowledge” accessed June 22, 2011, http://www.webofknowledge.com.
6 C. Fischer et al., “Predicting Crystal Structure: Merging Data Mining with Quantum Mechanics,” Nature Materials 5, no. 8 (2006): 641–646; Anubhav Jain et al., “A High-Throughput Infrastructure for Density Functional Theory Calculations,” Computational Materials Science 50 (2011): 2,295–2,310; J. S. Hummelshøj et al., “Density Functional Theory Based Screening of Ternary Alkali-Transition Metal Borohydrides—A Computational Material Design Project,” Journal of Chemical Physics 131, no. 1 (2009); Jeff Greeley and Jens K. Nørskov, “Combinatorial Density Functional Theory-Based Screening of Surface Alloys for the Oxygen Reduction Reaction,” Journal of Physical Chemistry C 113, no. 12 (2009): 4,932–4,939; Jeff Greeley and Manos Mavrikakis, “Alloy Catalysts Designed from First Principles,” Nature Materials 3, no. 11 (2004): 810–815; A. Liu and M. Cohen, “Prediction of New Low Compressibility Solids,” Science 245, no. 4920 (1989): 841–842.
7 Dierk Raabe et al., “Crystal Plasticity Modeling at Small Scales and at Large Scales” (presentation, GeoMat, Aachen, Germany, June 7–10, 2010); Gerard Paul M. Leyson et al., “Quantitative Prediction of Solute Strengthening in Aluminum Alloys,” Nature Materials 9, September (2010): 750–755; Aaron Beaber and William Gerberich, “Strength from Modeling,” Nature Materials 9, September (2010): 698–699.
8 Committee on Integrated Computational Materials Engineering, National Research Council, Integrated Computational Materials Engineering: A Transformational Discipline for Improved Competitiveness and National Security (Washington, DC: National Academies Press, 2008).
9 C.J. Kuehmann and G. B. Olson, “ICME: Success Stories and Cultural Barriers,” Integrated Computational Materials Engineering, ed. S. Arnold and T. Wong (Materials Park, OH: ASM International, forthcoming 2011); Charles J. Kuehmann, Herng-Jeng Jou, and Chris Kern, “From Concept to Flight: An Example of Computational Design and Qualification for Aerospace Structural Alloys,” (paper presented at the 1st World Congress on Integrated Computational Materials Engineering, Seven Springs, PA, July 10–14, 2011).
10 Committee on Integrated Computational Materials Engineering, National Research Council, Integrated Computational Materials Engineering: A Transformational Discipline for Improved Competitiveness and National Security (Washington, DC: National Academies Press, 2008).

121
The previously published Vision Report of the Energy Materials Blue Ribbon Panel and Opportunity Analysis for Materials Science and Engineering have
culminated in the identification of a set of important areas for materials science and engineering (MSE) product and process innovation. The innovations outlined in this Innovation Impact Report identify materials and processing breakthroughs that can radically reduce the cost, environmental impact, and energy requirements of energy generation, storage, and use across the United States. If realized, these MSE advances have the opportunity to significantly impact the United States’ progress toward enhanced sustainability and economic growth.
viii. the pAth foRwARd
As a next step, it is important to identify key pathways that integrate the research and development priority activities in this report into a coherent approach that leverages the highest-value opportunities and addresses the most critical needs. Especially important will be the advancement and use of materials and process development acceleration tools to decrease the time and cost of translating materials and process discoveries into real-world commercial applications.

122
ACRonyMs And AbbReviAtions
°C degrees Celsius
°F degrees Fahrenheit
AISI American Iron and Steel Institute
Al aluminum
AM additive manufacturing
bcm billion cubic meters
Bi bismuth
Btu British thermal units
CALPHAD CALculation of PHAse Diagrams
CdTe cadmium telluride
cermet ceramic-metal composite material
CIGS copper indium gallium selenide
CMC ceramic-matrix composites
Co cobalt
CO2 carbon dioxide
CSP concentrated solar power
DDM direct digital manufacturing
DFT density functional theory
DMLS direct metal laser sintering
DMMC discontinuous metal-matrix composite
EBM electron beam melting
FDM fused deposition modeling
FSW friction stir welding
FT Fischer-Tropsch
GW-days gigawatt-days
ICE internal combustion engine
ICME Integrated Computational Materials Engineering
IIT innovation impact team
kg kilogram
kWh kilowatt-hour
LBNL Lawrence Berkeley National Laboratory
iX. AppendiX
lbs pounds
LFW linear friction welding
MBtu million British thermal units
Mg magnesium
MIT Massachusetts Institute of Technology
MMC metal matrix composites
MMT million metric tons
MSE materials science and engineering
Ni nickel
nm nanometer
PAN polyacrylonitrile
PV photovoltaics
R&D research and development
Sb antimony
SiC silicon carbide
SL stereolithography
SOFC solid oxide fuel cell
TBtu trillion British thermal units
TEG thermoelectric generator
Ti titanium
TMS The Minerals, Metals, & Materials Society
TRIP transformation-induced plasticity
TWIP twinning-induced plasticity
V vanadium
Wh watt-hour
ZT figures of merit
Zr zirconium

123
ContRibutoRs
Functional Surface Technologies
Brajendra Mishra (Team Leader) Colorado School of MinesDarryl P. Butt Boise State UniversityNarenda Dahotre University of North TexasMike Dugger Sandia National LaboratoriesJeganathan Karthikeyan ASB IndustriesBryan Morreale National Energy Technology Laboratory/U.S. Department of EnergyRick Schroden Dow ChemicalEric Wachsman University of Maryland
Materials Integration in Clean Energy Systems
Diana Lados (Team Leader) WPI-iMdcKevin Anderson Mercury MarineGreg Blackman DuPontClaus Daniel Oak Ridge National Laboratory/University of Tennessee, KnoxvilleIan Donaldson GKN Sinter MetalsWilliam Fallon Sikorsky Aircraft CorporationJerry Gould Edison Welding InstituteEd Herderick Edison Welding InstituteMenachem Kimchi Edison Welding InstituteStephen Mashl Bodycote HIPRajiv Mishra University of North TexasKevin Slattery BoeingMichael Wixom A123 SystemsGary yang Pacific Northwest National Laboratory
Higher-Performance Materials
John Lewandowski (Team Leader) Case Western Reserve UniversityScott Boyce Dow ChemicalMike Burke WestinghouseIvan Cornejo Corning Inc.Jeff Hawk National Energy Technology Laboratory/U.S. Department of EnergyChaitanya Narula Oak Ridge National LaboratoryDan Sordelet Caterpillar, Inc.Steven Zinkle Oak Ridge National Laboratory

124
New Paradigm Materials Manufacturing Processes
Ray Peterson (Team Leader) Aleris Inc.Craig Blue Oak Ridge National LaboratoryGlenn Daehn Ohio State UniversityDavid Dietrich BoeingBryan Dods GE EnergyJames Evans University of California, BerkeleyPaul Jablonski National Energy Technology Laboratory/U.S. Department of EnergyEnrique Lavernia University of California, DavisBill Macy StratsysJim Sears South Dakota School of Mines
Materials and Process Development Acceleration Tools
George Spanos (Team Leader) TMSJonah Erlebacher Johns Hopkins UniversityAndrew Geltmacher Naval Research LabLou Hector General MotorsSurya Kalidindi Drexel UniversityZi-Kui Liu Pennsylvania State UniversityPaul Mason Thermo-Calc SoftwareGary Mushock ASM InternationalGreg B. Olsen Northwestern UniversityPatrice Turchi Lawrence Livermore National Laboratory
Support Group
Ross Brindle Nexight GroupWarren Hunt TMSMauricio Justiniano Energetics IncorporatedJared Kosters Nexight GroupSarah Lichtner Nexight GroupLarry Mueller CTD Innovation Consulting, LLCRidah Sabouni Energetics Incorporated

