innovation, intellectual property, and influence in china
TRANSCRIPT
Innovation, Intellectual Property, and Influence in China
Lily Fang (INSEAD)Josh Lerner (Harvard and NBER)
Chaopeng Wu (Xia Men University)

Patent Filings Since 1883
Source: World Intellectual Property Indicators, World Intellectual Property Organization, 2017.

From World’s Factory to Innovation Powerhouse?
China: – Top patent filing country in the world since 2012– Some individual firms are top patent filers:
• ZTE and Huawei largest patent filers in the world in 2016, ahead of Qualcomm.
The 13th five-year plan:– Innovation is the central focus.
Sources:-Five-year plan: http://www.china-un.org/eng/zt/China123456/; KPMG, “China’s 13th Five Year Plan: Overview,” March 2016, https://assets.kpmg.com/content/dam/kpmg/cn/pdf/en/2016/10/13fyp-opportunities-analysis-for-chinese-and-foreign-businesses.pdf. -Filing data: World Intellectual Property Office, http://www.wipo.int/pressroom/en/articles/2017/article_0002.html.
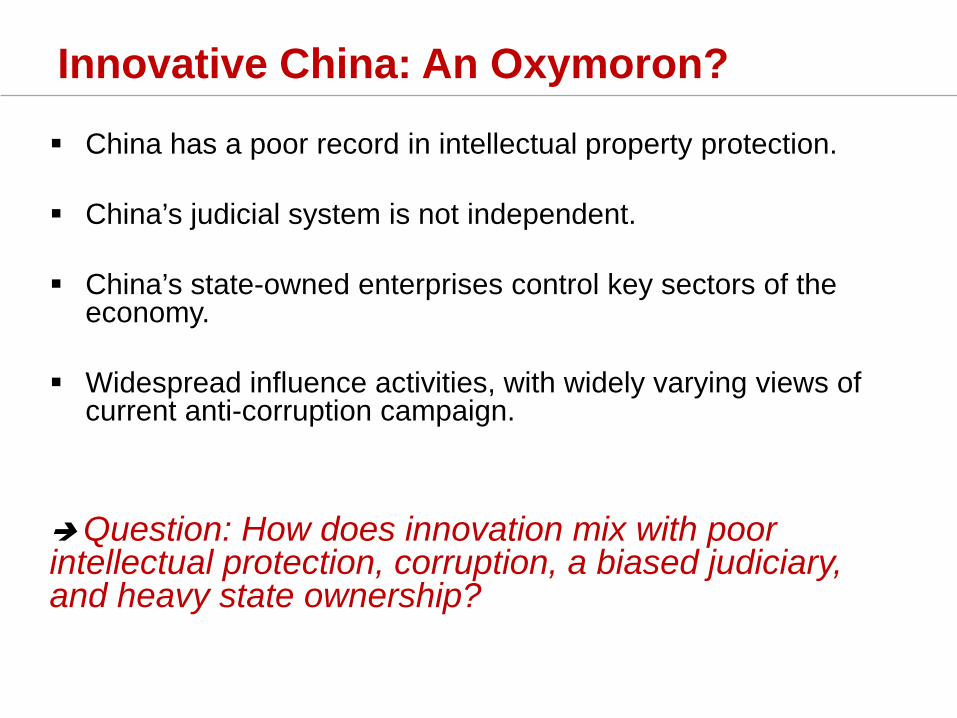
Innovative China: An Oxymoron?
China has a poor record in intellectual property protection.
China’s judicial system is not independent.
China’s state-owned enterprises control key sectors of the economy.
Widespread influence activities, with widely varying views of current anti-corruption campaign.
Question: How does innovation mix with poor intellectual protection, corruption, a biased judiciary, and heavy state ownership?


A Bigger Question: Is China an Exception?
The law-finance-growth view: Legal and financial institutions important for growth – La Porta, Lopez-de-Silanes, Shleifer, Vishny (1998), (2000); King
and Levine (1993); Rajan and Zingales (1998))
China seems an exception– Allen, Qian and Qian (2005): Poor institutions, yet astounding
growth in the private sector– Other mechanisms as substitutes for institutions
We re-examine the importance of institutions by focusing on innovation
6

Paper 1: Empirical Questions
How does intellectual property rights (IPR) protection affect innovation within China?– Hypothesis: Local IPP enforcement positively affect R&D and innovation
Where does innovation take place in China? State-owned enterprises (SOEs) or private sector?– Hypothesis: Private firms are more innovative than SOEs when IPR protection
is strong
What is the interaction effect of IPR protection and state ownership on innovation?– Hypothesis: SOEs are less likely to be expropriated. The innovation advantage
of private firms over SOEs will be larger in high-quality IPP enforcement regions.
Will address causality concerns by focusing on “difference in difference” analyses of privatizations.

IPR Laws in China
Within China, the letter of the law on IPR is the same nationwide (and adheres to international conventions).
Officially, IPR has been protected in China since 1980 when it became a member of the World Intellectual Property Organization.
China patterned its IPR law on the Berne Convention for the Protection of Literary and Artistic Works and the Agreement on Trade-Related Aspects of Intellectual Property Rights (TRIPS).
But local enforcement differs, depending on local government official’s idiosyncratic characteristic (e.g., reform minded).

IPR Protection is a Local Issue
Limited forum shopping in China: Chinese IP Law stipulates that plaintiffs can only sue in the province of domicile or where IP violation occurred.
80% of plaintiffs and defendants in IP disputes are from the same province:– Reflects clustering.– Keller (AER, 2002), etc.: Technology spillovers are local.

Local IPR Protection Measure Measuring IPR protection and relating it to innovation is challenging:
– Many obvious candidates of IPR protection measures suffer from endogeneity concerns:
• Measures based on of IP laws, news stories, or the density of IP legal professionals and cases lead to concerns that the quality of such institutions evolve endogenously.
• A higher plaintiff win rate could indicate more severe IPR infringements rather than better protection, and more frequent media mentions could also reflect more IPR violations.
• Measures based on legal provisions is infeasible as no variation in the letter of the law.
Use instead a survey-based prefecture-level IPR index published by the Chinese Academy of Social Sciences:– Between 2002 and 2011, the CASS published an annual Urban
Competitiveness Report based on detailed surveys of 66 prefectures. – The report contains separate rankings of the prefectures along many
dimensions, including IPR protection. – The annual survey based on over 6,000 responses, or roughly 100 per
prefecture surveyed. • Follows “Competitiveness of Cities” report published by the World Economic
Forum.


Local IPR Protection Measure (2) Specifically, it asks the respondents to rate from 5 (best) to 1 (worse) three
areas relating to local IPR enforcement: – The length of time it takes for courts to resolve IP disputes,– The cost of resolving the dispute as a percentage of the value of the IP under dispute,– The fairness of court decisions.
The responses to each of the three questions from each prefecture are aggregated as follows: Prefecture Response = −2 ∗ 𝑤𝑤1 + −1 ∗ 𝑤𝑤2 +0 ∗ 𝑤𝑤3 + 1 ∗ 𝑤𝑤4 + 2 ∗ 𝑤𝑤5 (1)
Aggregated as follows: 𝑃𝑃𝑃𝑃𝑃𝑃𝑃𝑃𝑃𝑃𝑃𝑃𝑃𝑃𝑃𝑃𝑃𝑃𝑃𝑃 𝐼𝐼𝑃𝑃𝐼𝐼 𝑆𝑆𝑃𝑃𝑆𝑆𝑃𝑃𝑃𝑃 =𝑃𝑃𝑃𝑃𝑃𝑃𝑃𝑃𝑃𝑃𝑃𝑃𝑃𝑃𝑃𝑃𝑃𝑃𝑃𝑃 𝐴𝐴𝐴𝐴𝑃𝑃𝑃𝑃𝐴𝐴𝐴𝐴𝑃𝑃 𝑅𝑅𝑃𝑃𝑅𝑅𝑅𝑅𝑅𝑅𝑅𝑅𝑅𝑅𝑃𝑃
𝑀𝑀𝐴𝐴𝑀𝑀(𝑃𝑃𝑃𝑃𝑃𝑃𝑃𝑃𝑃𝑃𝑃𝑃𝑃𝑃𝑃𝑃𝑃𝑃𝑃𝑃 𝐴𝐴𝐴𝐴𝑃𝑃𝑃𝑃𝐴𝐴𝐴𝐴𝑃𝑃 𝑅𝑅𝑃𝑃𝑅𝑅𝑅𝑅𝑅𝑅𝑅𝑅𝑅𝑅𝑃𝑃)(2)
After 2011, CASS continued to publish annual Urban Competitiveness Reports, but used a different methodology:
– Focus on period through 2011.– Results robust if we extend the sample through 2013.

IPR Measure – Geographic Distribution
Note: Will include provincial fixed effects.

Time Trends in IPR Measure
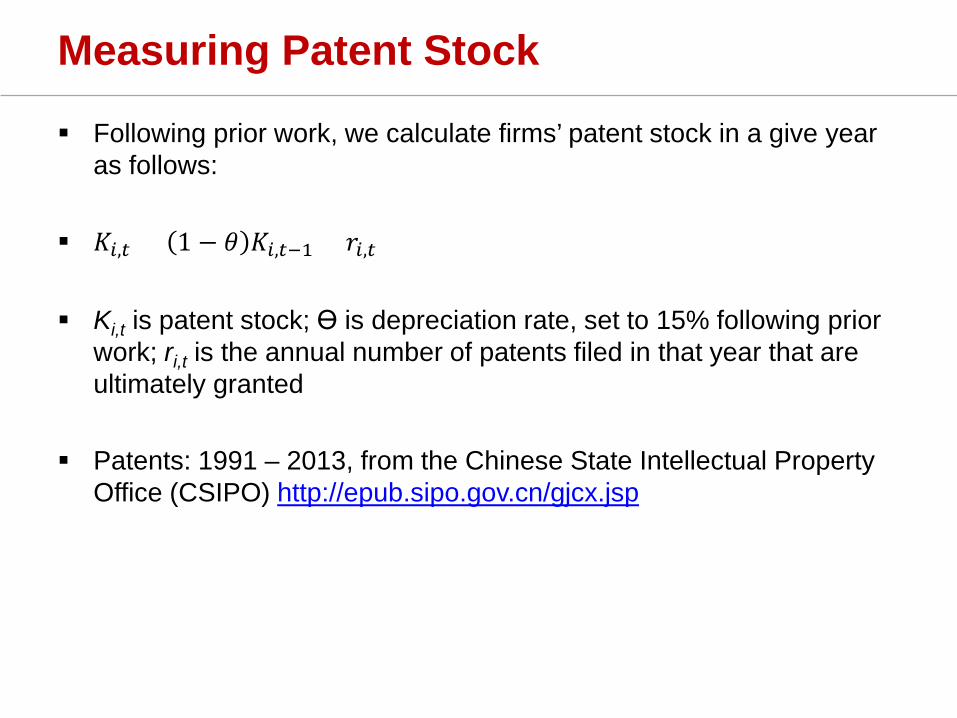
Measuring Patent Stock
Following prior work, we calculate firms’ patent stock in a give year as follows:
𝐾𝐾𝑖𝑖,𝑃𝑃 = 1 − 𝜃𝜃 𝐾𝐾𝑖𝑖,𝑃𝑃−1 + 𝑃𝑃𝑖𝑖,𝑃𝑃
Ki,t is patent stock; ϴ is depreciation rate, set to 15% following prior work; ri,t is the annual number of patents filed in that year that are ultimately granted
Patents: 1991 – 2013, from the Chinese State Intellectual Property Office (CSIPO) http://epub.sipo.gov.cn/gjcx.jsp

Measures of Patent Stock

Privatizations in China
China experienced the largest wave of SOE privatization in history (Gan (2009)).
Large-scale SOE privatizations began in the mid-1990s, as part of broad economic reforms outlined in the 9th and 10th Five Year Plans– Between 1995 and 2005, firms with an aggregate 11.4 trillion
RMB in assets were privatized in China– Two-thirds of China’s SOE and state assets.

Motivations for Privatizations
These privatizations appear to be part of China’s overall economic reform:– Rather than driven by the desire to enhance innovation.
We searched the key words “privatization” and “innovation” in all official provincial (“Daily”) newspapers between 2000 and 2013:– Two clearly distinct waves of policy focus. – “Privatization” enjoyed a surge in media mentions before 2005
and then subsided after that. – Surge in the media mentions of “innovation” after 2011. – Between 2000 and 2013, we found only 55 articles that jointly
mention the key words “privatization” and “innovation,” all of which appeared in the years between 2011 and 2013.

Media Mentions

Databases to Identify Privatizations
CSMAR/WIND:– Dataset fashioned on CRSP and COMPUSTAT databases in the
U.S.– This database covers Chinese publicly listed firms.
Chinese Industrial Enterprises Database:– Longitudinal micro-level database compiled by the National
Bureau of Statistics of China (NBSC) based on annual surveys of industrial firms (manufacturing, mining, and construction).
– Must have more than five million RMB in annual sales. – Comprehensive source of information on unlisted firms. – But many firms do not have a complete time series (size issues),
and linking records across years can be problematic.

Identifying Privatizations
In CSMAR, since 2001, Chinese listed firms are required to report their ownership (equity) structure.
– We define a company as state-owned if its largest ultimate shareholder is a government entity.
– Otherwise, we define the company as a private enterprise.– We identify SOE privatizations by comparing changes of ownership status between
two consecutive years. – On average, the state’s ownership was 43.1% of firms’ equity in our SOE sample; after
the privatization, the average state ownership was 23.0%.
Only identify privatizations from the Chinese Industrial Enterprises Database, if records can be confidently matched:
– Detailed equity ownership information in the “Financial Information” section of the database
– A firm is considered to have gone through a privatization if this ratio goes from above 50% state-owned to below 50% in a subsequent year.
– When this detailed information is not available, “Capital Holding Situation” lets firms self-identify as either SOEs or other.
– If switch in adjoining years, privatization.• Results robust to using public firms only.

Privatizations by Year

Few Observable Differences in Year Before and After Privatization
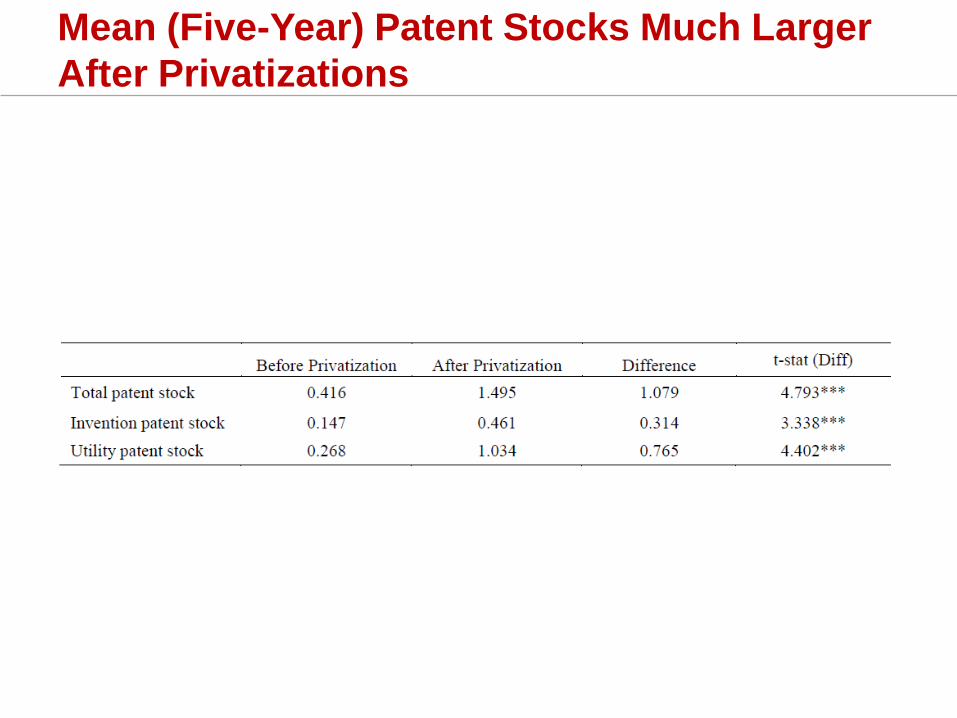
Mean (Five-Year) Patent Stocks Much Larger After Privatizations

Central Question
What is the interactive effect of ownership type and IPR protection on innovation?
Are private firms more sensitive to IPR protection than SOEs? – If so, we should find that the increase in post-
privatization innovation should be stronger in regions with stronger IPR protection than in regions with weaker protection.
– Examine in univariate and regression analyses.
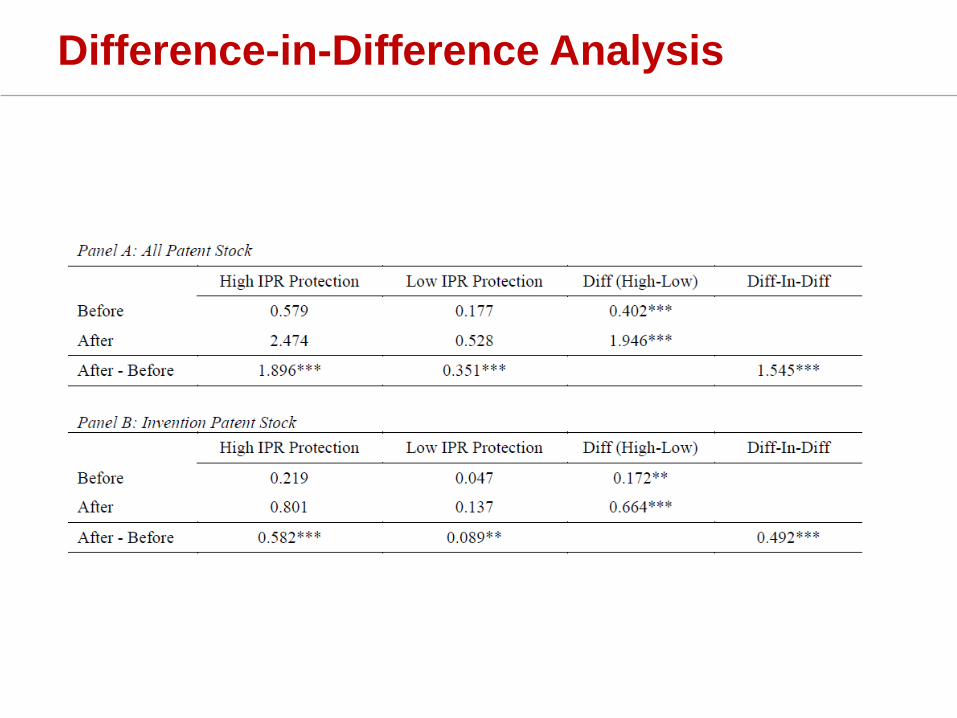
Difference-in-Difference Analysis

Regression Analysis
Firm-year observations of firms that have undergone a privatization between 2000 and 2011.
For each privatization, we use five years of data before and five years of data after as observations.
log (𝑃𝑃𝑃𝑃𝑃𝑃𝑃𝑃𝑃𝑃𝑃𝑃_𝑆𝑆𝑃𝑃𝑆𝑆𝑃𝑃𝑆𝑆𝑖𝑖,𝑃𝑃 + 1) = 𝑃𝑃 + 𝑏𝑏1𝑃𝑃𝑃𝑃𝑆𝑆𝑃𝑃𝑖𝑖,𝑃𝑃 + 𝑏𝑏2𝐼𝐼𝑃𝑃𝐼𝐼𝑖𝑖,𝑃𝑃−1 + 𝑏𝑏3𝑃𝑃𝑃𝑃𝑆𝑆𝑃𝑃𝑖𝑖,𝑃𝑃 ×𝐼𝐼𝑃𝑃𝐼𝐼𝑖𝑖,𝑃𝑃−1 + 𝐶𝐶𝑆𝑆𝑃𝑃𝑃𝑃𝑃𝑃𝑆𝑆𝐶𝐶𝐶𝐶𝑖𝑖,𝑃𝑃−1 + 𝜀𝜀𝑖𝑖𝑃𝑃
Key variables:– The dependent variable is the (natural logarithm) of a firm’s patent stock in the year t
plus one.– POST takes on the value of one for years after privatization, and zero otherwise.– IPR is the measure of the IPR score in the prefecture where the firm is located in year
t-1. – Control variables:
• Firm level characteristics measured at the end of year t-1: size (expressed as the logarithm of assets measured in RMB), intangible assets (as a fraction of total assets), return on assets (defined as net income divided by total assets), leverage (defined as total debt divided by total assets), and age
• Province-level controls include GDP growth from years t-1 to t, university density in year t-1 (measured as number of four-year universities per 100,000 population), and the increase in government R&D subsidies (calculated as the increase in the amount of government R&D subsidy from years t-1 to t divided by the provincial GDP in year t-1).
• We also include industry and province fixed effects. In one specification, we also include firm fixed effects.

Key Coefficients

Magnitudes are Large
Model 2:– Look at the median IPR value of 0.65 between
2002 and 2006 (the peak of the privatization wave).
• The average post-privatization increase in patent stock is just 0.01 (-0.138 + 0.225*0.65).
– With a one standard deviation increase in IPR score (0.179):
• the post-privatization effect quadruples to 0.048. • This value represents 40% of the mean value of the
dependent variable, the logarithm of patent stock.– Even larger with firm fixed effects.

Looking at Nationalizations
We would expect to see the opposite pattern in the (relatively rare) incidences of nationalizations:– If combination of private ownership and strong IPR protection is
conducive to innovation, we should find that the reduction of innovation would be particularly severe when a firm become nationalized in a region with high IPR protection
Estimate the same type of regression as in Table 6 on a sample of nationalization events:– Expect the interaction between nationalization and IPR protection to be
negative.
We collected nationalizations in the same way as privatizations: – 252 cases of nationalizations in our sample (218 cases involving
unlisted firms and 34 cases involving listed firms).

Key Coefficients

IV Regressions We also use IV regression to check the
robustness of our results:– Look at historical roots of property rights in province.
Instruments:– Christian College: number of Christian colleges
founded by missionaries by 1920 in a province.– British Settlement: dummy variable indicating whether
the province had a British settlement in the Qing dynasty.
Both instruments should be related to the notion of property rights in the population, but unrelated to the current provincial government’s enforcement of IPR rights.

Key Coefficients

Patent Quality?
Our results so far indicates that private firms in recent years are more innovative and their innovation is strongly affected by local IPR protection
Concern: we use patent counts: what about patent quality?– Do private firms “window dress” to attract investors?
To examine patent quality, we collected, for the 331 firms in our sample with the most Chinese patents, global patent application and citation data
We examine the following measures:– Citation per patent family– IPC groups per patent (scope proxy)– Patents active in US, Japan, and European patent offices

Looking at Patent QualityPanel A: Entire sample: Patents published between 1990 - 2014
Private SOE t-stat (diff)Citation per patent 0.76 0.47 2.74 ***IPC groups 1.81 1.66 3.15 ***Patent active in US 6.1% 4.2% 2.40 **Patent active in Japan 1.6% 1.9% -0.90Patent active in EPO 0.6% 0.9% -1.21Patent active in WIPO 1.4% 0.5% 3.15 ***
Panel B: Period 1 -- Patents published between 1990 - 2005Private SOE t-stat (diff)
Citation per patent 2.89 1.17 4.06 ***IPC groups 1.89 1.77 1.04Patent active in US 17.6% 9.9% 2.81 ***Patent active in Japan 5.6% 3.8% 1.20Patent active in EPO 0.3% 0.5% -0.52Patent active in WIPO 0.00% 0.00% .
Panel C: Period 2 -- Patents published between 2006 - 2014Private SOE t-stat (diff)
Citation per patent 0.30 0.19 2.17 **IPC groups 1.80 1.61 3.31 ***Patent active in US 3.6% 2.0% 2.76 ***Patent active in Japan 0.7% 1.2% -1.84 **Patent active in EPO 0.6% 1.0% -1.31Patent active in WIPO 1.8% 0.7% 2.72 ***
Private firms have higher quality patents,Especially after 2006

Conclusions
Within China, IPR protection is positively associated with innovation:– Privatizations address concerns about reverse causality.
While in earlier years SOEs obtained more patents, since 2006, private firms have been more innovative, and the gaps are larger in provinces with high IPR protection
When SOEs privatized, innovation goes up, but the increase is larger in provinces with high IPR protection
Institutions do matter in China; private sectors firms particularly sensitive to institutional quality. Important policy implications for China’s future growth strategy
Paper 2: The role of subsidies
Examines subsidization of innovative expenditures in China:– At least 22% of total R&D spending in 2015.
• $161B private funding vs. $46 billion in government subsidies, according to 2016 China Statistical Yearbook.
• Likely to be far more extensive: e.g., in 2015, the Chinese government allocated $383 billion for venture capital funding.
Focuses on changes in fund allocations and consequences after shock of 2012 anti-corruption campaign:– As well as associated regional leadership rotations.

Subsidies and R&D in China
Each level of China’s government has technology bureaus.– These offer numerous subsidy programs, e.g.:
• Development and testing of new products• Major R&D projects• Commercialization of new technologies• Patent application fees and associated costs.
Firms decide whether they want to apply for subsidies from various governments:– But all applications need the approval of lower-
level (provincial and local) technology bureaus.

Subsidies and R&D in China (2)
This approval process means that local (municipal and provincial) technology bureau officials play an important gate keeper role:– Strong incentive for firms to cultivate good
relationships with these officials.– Officials may reward those that cultivate them most
assiduously. But officials’ future prospects may also depend on
local economic performance:– Li and Zhou [2005].– Creates incentives to reward most promising firms.
Chronology of anti-corruption campaign
Largest organized anti-graft effort in the history of Communist rule in China: 2012: Increasing media discussions of corruption and
its deleterious impacts. November 2012: During 18th National Congress, both
outgoing General Secretary Hu Jintao and incoming party leader Xi Jinping repeatedly emphasize that corruption is a threat to the party's survival.
December 2012: Abrupt sacking of Sichuan Deputy Party Secretary Li Chuncheng.
2013: Central inspection teams dispatched. 2014-15: Fall of “big four tigers.” Also many “flies”:
over 100K indictments by Nov. 2015.

Share of articles with “anti-corruption” in the title in official Chinese newspapers
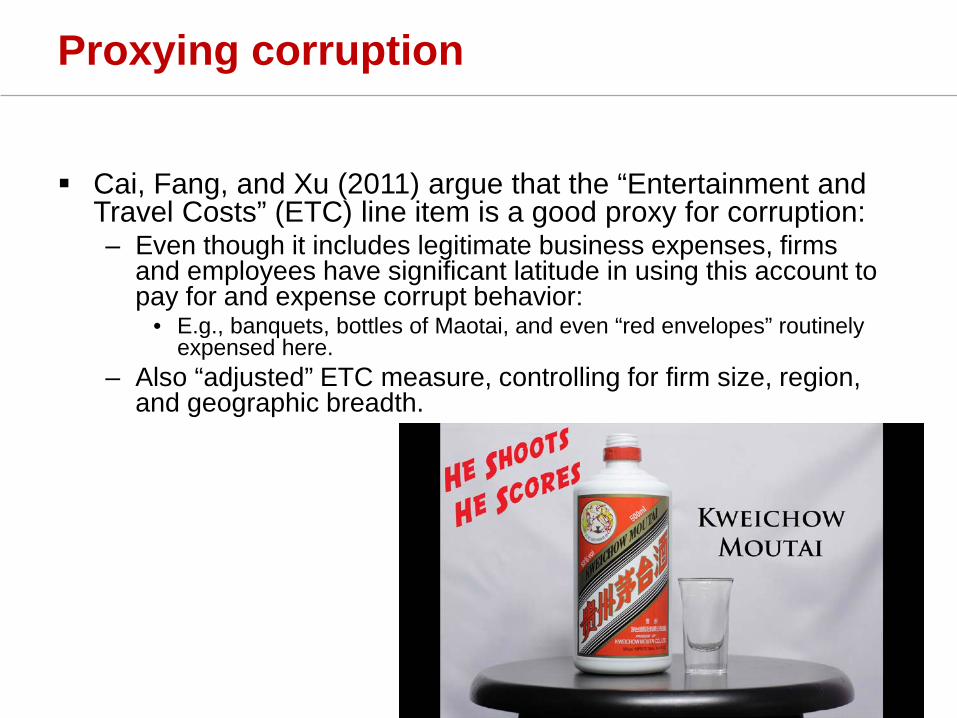
Proxying corruption
Cai, Fang, and Xu (2011) argue that the “Entertainment and Travel Costs” (ETC) line item is a good proxy for corruption:– Even though it includes legitimate business expenses, firms
and employees have significant latitude in using this account to pay for and expense corrupt behavior:
• E.g., banquets, bottles of Maotai, and even “red envelopes” routinely expensed here.
– Also “adjusted” ETC measure, controlling for firm size, region, and geographic breadth.

The sample
All “technology-focused” A shares:– That is, listed on Shanghai and Shenzhen exchanges.– Primarily excluding agriculture, services, and
transportation.– Focus on period from 2007 to 2014, as clarification of R&D
accounting in 2006. Sample consists of 1,251 firms and 7,299 firm-year
observations:– R&D expenditures and subsidies.– ETC and AETC.– Patenting.– Ownership (SOE or not, etc.).– Politically-connected CEO.
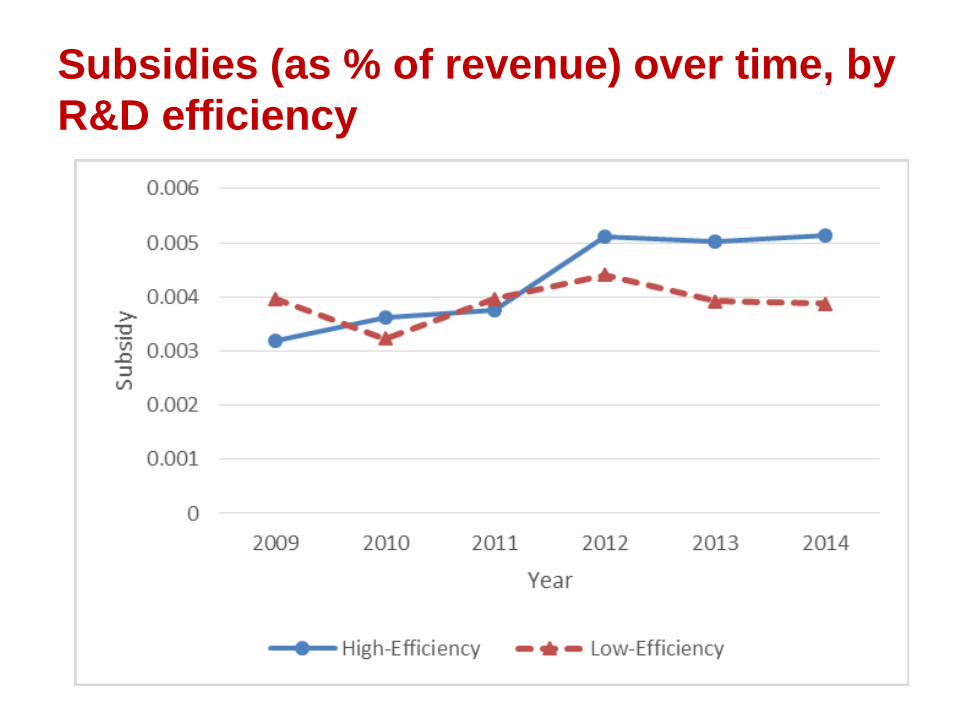
Subsidies (as % of revenue) over time, by R&D efficiency
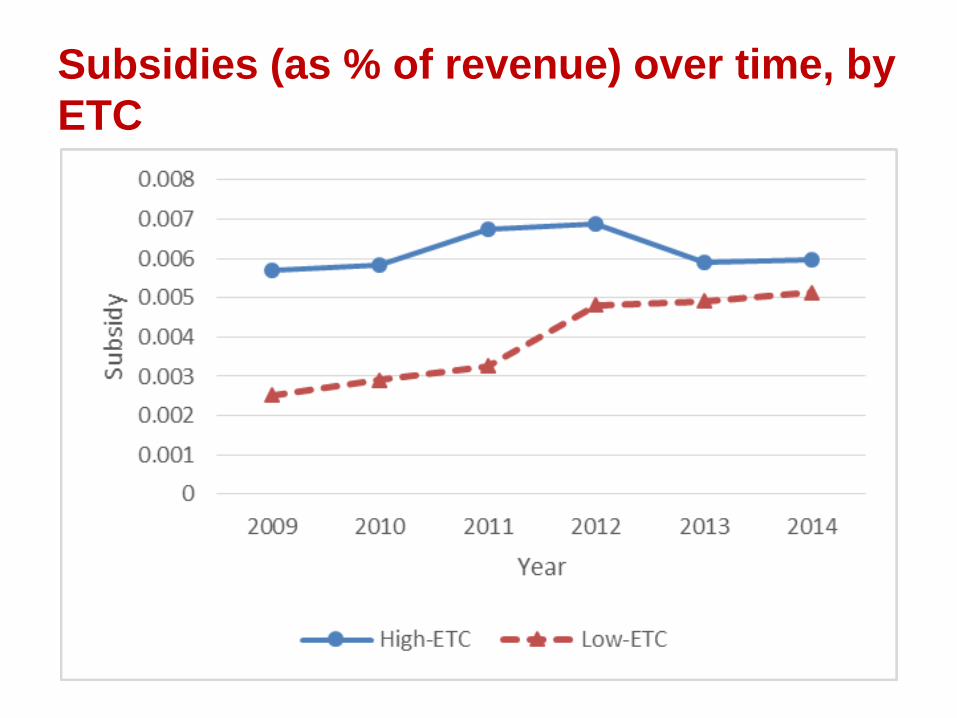
Subsidies (as % of revenue) over time, by ETC
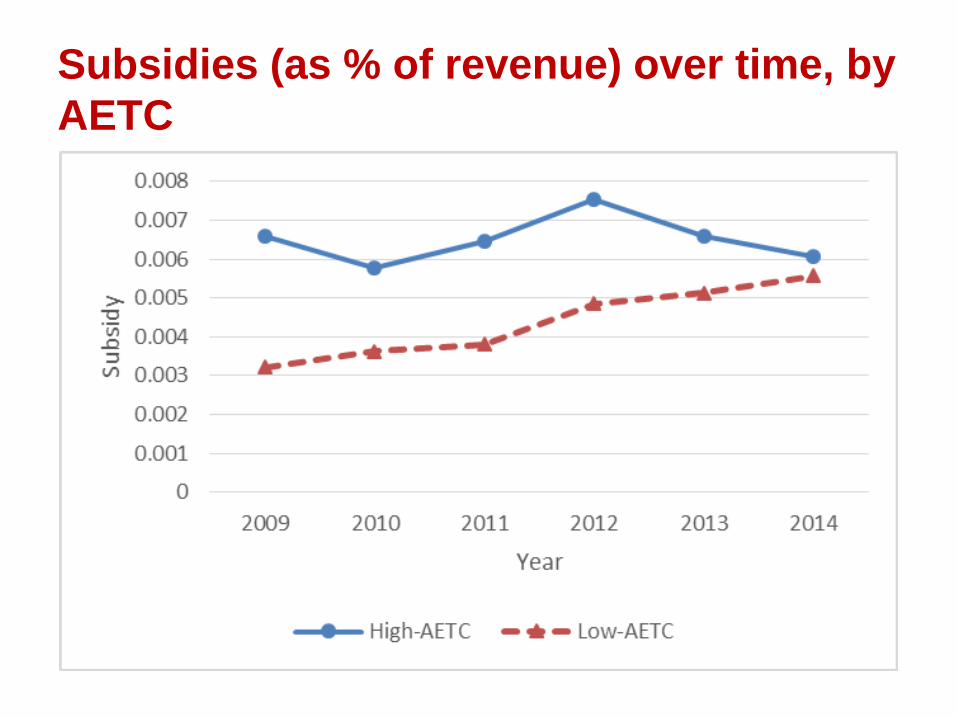
Subsidies (as % of revenue) over time, by AETC
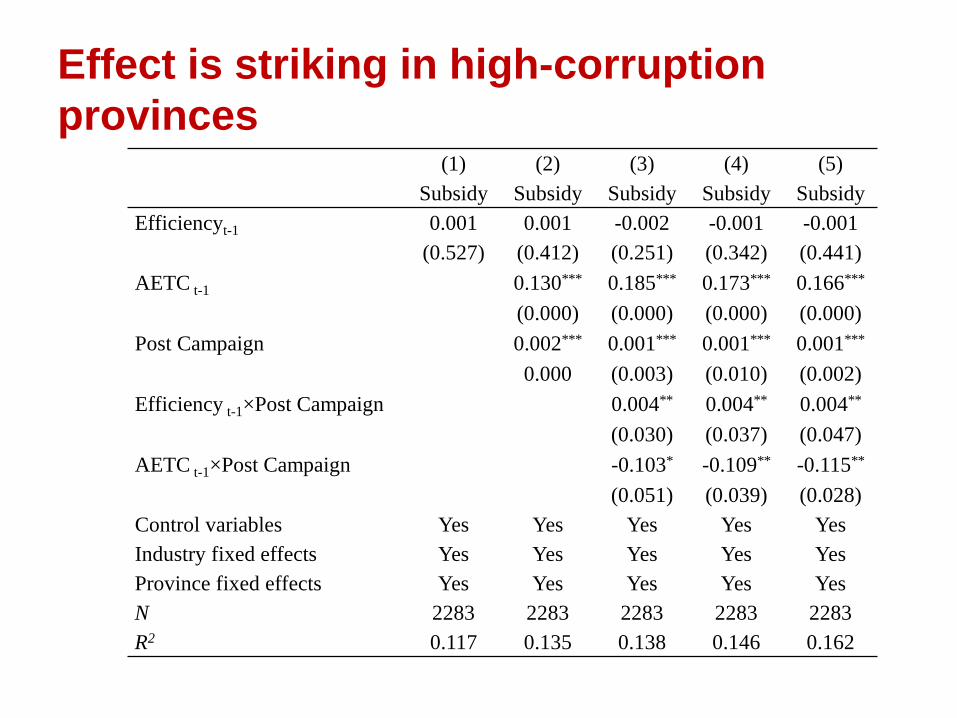
Effect is striking in high-corruption provinces
(1) (2) (3) (4) (5)Subsidy Subsidy Subsidy Subsidy Subsidy
Efficiencyt-1 0.001 0.001 -0.002 -0.001 -0.001(0.527) (0.412) (0.251) (0.342) (0.441)
AETC t-1 0.130*** 0.185*** 0.173*** 0.166***
(0.000) (0.000) (0.000) (0.000)Post Campaign 0.002*** 0.001*** 0.001*** 0.001***
0.000 (0.003) (0.010) (0.002)Efficiency t-1×Post Campaign 0.004** 0.004** 0.004**
(0.030) (0.037) (0.047)AETC t-1×Post Campaign -0.103* -0.109** -0.115**
(0.051) (0.039) (0.028)Control variables Yes Yes Yes Yes YesIndustry fixed effects Yes Yes Yes Yes YesProvince fixed effects Yes Yes Yes Yes YesN 2283 2283 2283 2283 2283R2 0.117 0.135 0.138 0.146 0.162

But missing in low-corruption provinces(1) (2) (3) (4) (5)
Subsidy Subsidy Subsidy Subsidy SubsidyEfficiencyt-1 0.003*** 0.003*** 0.004*** 0.004** 0.004**
(0.006) (0.003) (0.007) (0.010) (0.016)AETC t-1 0.223*** 0.257* 0.252* 0.246*
(0.005) (0.072) (0.076) (0.084)Post Campaign 0.0004 0.001** 0.0004 0.001
(0.256) (0.043) (0.120) (0.200)Efficiency t-1×Post Campaign -0.001 -0.001 -0.001
(0.514) (0.536) (0.471)AETC t-1×Post Campaign -0.056 -0.052 -0.071
(0.653) (0.679) (0.564)Control variables Yes Yes Yes Yes YesIndustry fixed effects Yes Yes Yes Yes YesProvince fixed effects Yes Yes Yes Yes YesN 1963 1963 1963 1963 1963R2 0.083 0.111 0.112 0.114 0.133

Focusing on departures
Now undertake difference-in-difference analysis of R&D subsidy around the departures of provincial technology bureaus:– Staffing changes identified form websites of the
provincial bureaus, as well as news reports. Identified 46 cases of departures, 2010 to 2013.
– Earliest year 2010 to ensure three years of pre-trend.– Some departures explicitly identified as due to
corruption; many not.• In any case, leads to a degradation of “guanxi” for corporate
executives. Affects 1,418 firm-years (19% of sample).
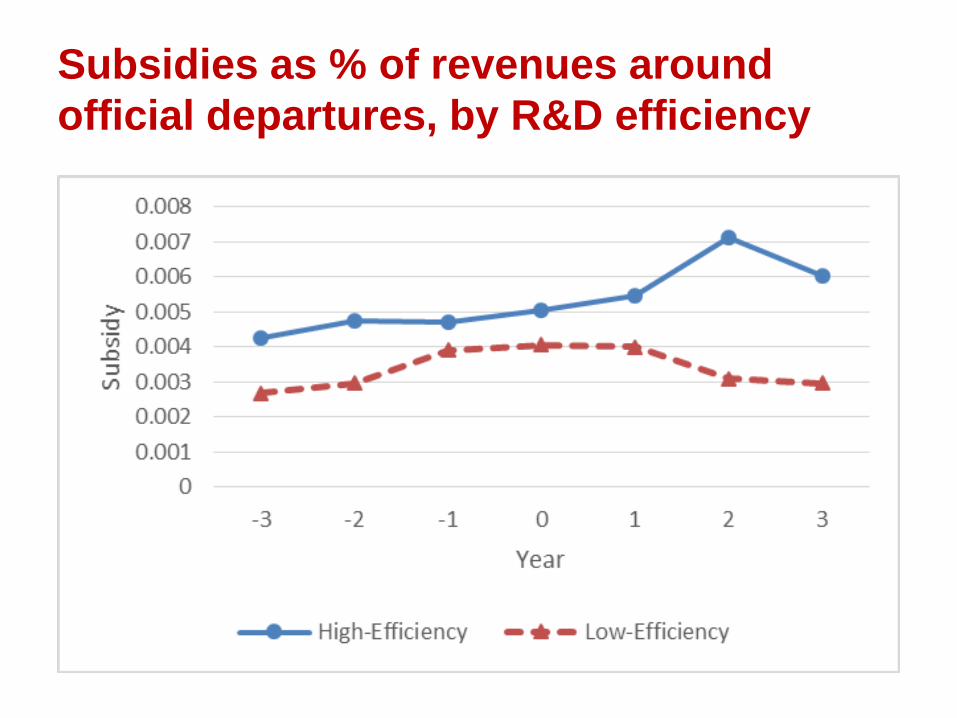
Subsidies as % of revenues around official departures, by R&D efficiency

Subsidies as % of revenues around official departures, by ETC

Subsidies as % of revenues around official departures, by AETC

Strongest for corruption-related departures
Normal Departures Corruption-related Departures(1) (2) (3) (4) (5) (6)
Efficiencyt-1 0.003*** 0.003*** 0.00002 0.002*** 0.002*** -0.001(0.002) (0.001) (0.978) (0.001) (0.001) (0.310)
AETC t-1 0.203*** 0.192*** 0.129*** 0.190*** 0.183*** 0.070**
(0.000) (0.000) (0.000) (0.000) (0.000) (0.000)Post Departure 0.0002 0.0002 0.0003 -0.001 -0.001 0.0003
(0.531) (0.503) (0.299) (0.223) (0.371) (0.772)Efficiency t-1×Post Departure -0.001 -0.002 -0.002 -0.001 -0.001 -0.002
(0.332) (0.219) (0.146) (0.786) (0.859) (0.680)AETC t-1×Post Departure -0.079** -0.076** -0.099*** -0.287*** -0.318*** -0.455***
(0.041) (0.048) (0.002) 0.000 0.000 0.000 SOE t-1 -0.002*** -0.001*** -0.004*** -0.002*** -0.001*** -0.004***
(0.000) (0.005) (0.000) (0.000) (0.004) 0.000 Political Connection t-1 0.000 0.00003 -0.0001 -0.00003 0.00002 -0.0001
(0.902) (0.925) (0.905) (0.911) (0.936) (0.850)ROA t-1 -0.009*** -0.009*** -0.009*** -0.008***
(0.000) (0.000) (0.000) (0.000)
Tobin’s Q t-1 0.0003*** -0.0001 0.000*** -0.0001
(0.001) (0.568) (0.001) (0.426)Leverage t-1 -0.005*** -0.00002 -0.005*** -0.0003
(0.000) (0.987) (0.000) (0.801)Constant 0.003*** 0.004*** 0.005 0.003*** 0.004*** 0.014
(0.000) (0.000) (0.647) (0.000) (0.000) (0.301)Industry fixed effects Yes Yes Yes Yes Yes YesProvince fixed effects Yes Yes Yes Yes Yes YesFirm fixed effects No No Yes No No YesN 4246 4246 4246 4246 4246 4246R2 0.118 0.135 0.696 0.122 0.139 0.697

Do these changes matter?
Estimate an innovation production function, using normalized patents and citations.– Focus on changes in function around:
• Anti-corruption reforms.• Departures from provincial technology bureaus.
– Looking at changing relationship between subsidies and subsequent innovation.

Subsidies and future patents/citations, relative to anti-corruption campaign
(1) (2) (1) (2)Patent
Apps./SalesPatent
Apps./SalesCitations/Patent
Citations/ Patent
Patent/Sales t-1 0.726*** 0.723***
(0.000) (0.000)Citations/Patent t-1 0.417*** 0.387***
(0.000) (0.000)Subsidy t-1 0.093*** 0.064*** 10.012*** 4.057*
(0.000) (0.002) (0.001) (0.055)Post-2012 0.0002 0.651**
(0.413) (0.014)Subsidy t-1×Post-2012 0.077* 3.788*
(0.070) (0.081)Constant 0.002*** 0.002*** 0.940*** 0.616***
(0.000) (0.000) (0.000) (0.000)N 6048 6048 6048 6048R2 0.569 0.569 0.157 0.185

Subsidies and future patents/citations, relative to departures
(1) (5) (1) (2)Patent
App./SalesPatent App./Sales Citations/Patent
Citations/ Patent
Pat. Apps. or Cites t-1 0.726*** 0.724*** 0.417*** 0.416***
(0.000) (0.000) (0.000) (0.000)
Subsidy t-1 0.093*** 0.068*** 10.012*** 8.013***
(0.000) (0.000) (0.001) (0.007)
Post Departure -0.00003 0.038(0.914) (0.585)
Subsidy t-1×Post Depart. 0.096** 3.874***
(0.019) (0.003)
Constant 0.002*** 0.002*** 0.940*** 0.921***
(0.000) (0.000) (0.000) (0.000)
N 6048 6048 6048 6048
R2 0.569 0.569 0.157 0.157

Conclusions
Anti-corruption campaign appears to have led to better allocation of innovative funding.– Departures of provincial technology officials
appears to have been an important channel. Stronger association between subsidies
and subsequent innovation.