innovative approaches to literacy grant … approaches to literacy grant program 2016 executive...
TRANSCRIPT
INNOVATIVE APPROACHES TO LITERACY GRANT PROGRAM
2016 Executive Summary and Evaluation of Findings Report
Prepared by
Deidre Marshall, District Curriculum Director
Marla Martin, Program Evaluator
This report was prepared for the U.S. Department of Education under the Innovative Approaches to Literacy Program grant # S215G140067. The views expressed herein are those of the evaluator. No official endorsement by the U.S. Department of Education is intended or should be inferred. The mention of trade names, commercial products or organizations in this report does not imply endorsements by the U.S. government. This publication also contains URLs for information created and maintained by private organizations. This information is provided for the reader’s convenience. The U.S. Department of Education is not responsible for controlling or guaranteeing the accuracy, relevance, timeliness or completeness of this information. Further, the inclusion of information or URL does not reflect the importance of the organization, nor is it intended to endorse any views expressed, or products or services offered.
1 of 180
Executive Summary for the IAL Grant
Earlimart School District
Goal #1: To improve English Language Arts proficiency for 2,030 Pre-K through 8th grade
students.
Outcome: Earlimart students will make significant improvements in ELA test scores.
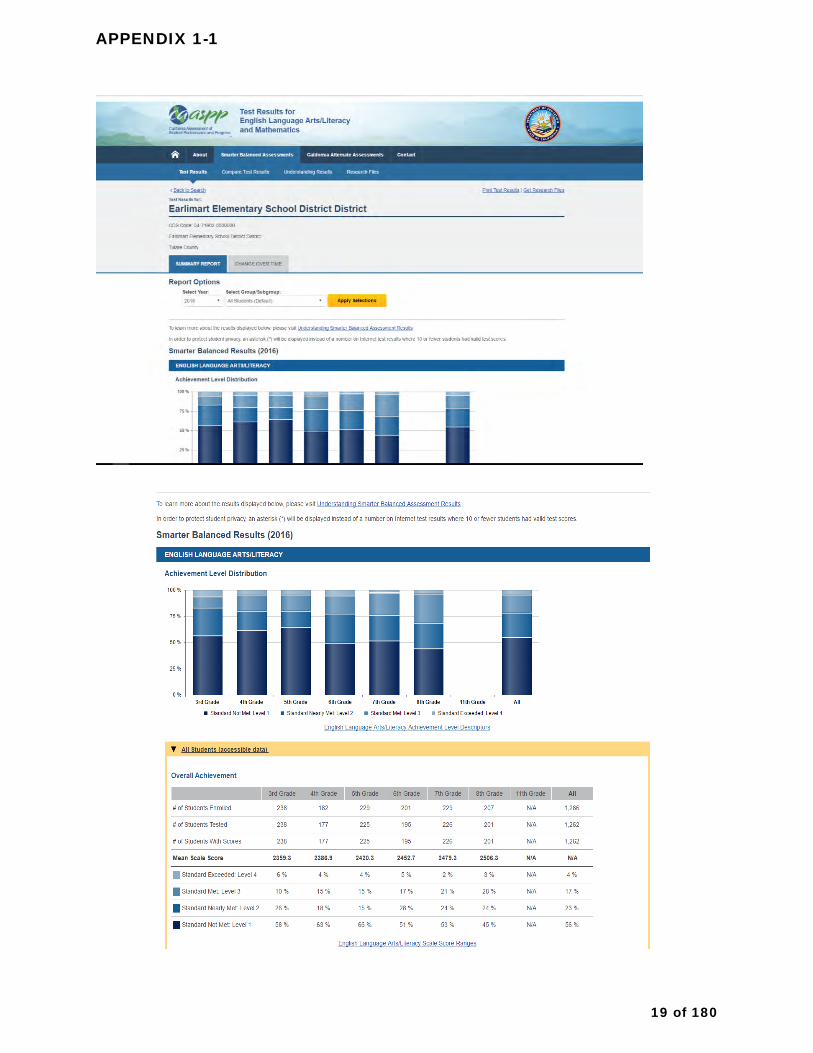
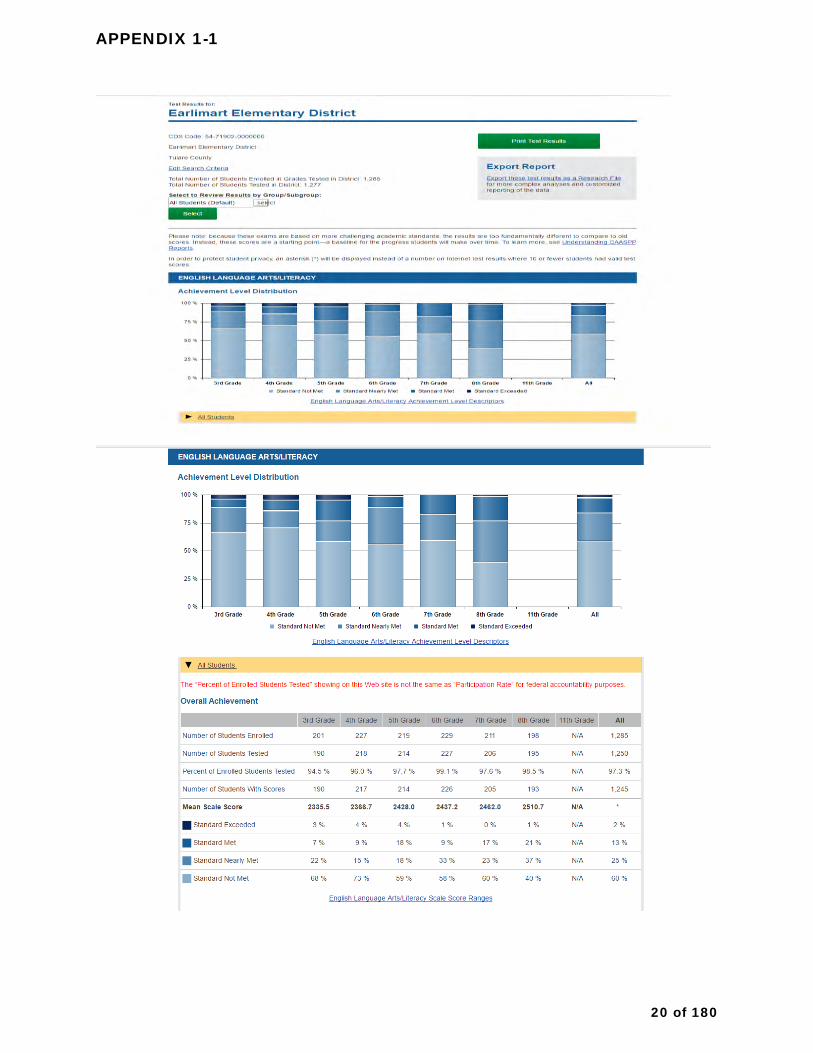
We were very successful in meeting this goal. District-wide, we grew 5 percentage points in
English/Language Arts on the CAASPP test. In terms of the specific grades that we were
monitoring for the grant, we grew 6 points in 3rd grade and a whopping 9 points in 8th grade. In
comparison with the state of California, 3rd graders statewide grew 5 points and 8th graders
grew 3 points. Our district’s growth in 3rd grade matched that of the state and our growth in 8th
grade tripled the state’s growth. Additionally, our EL subgroup, which makes up 77% of our
students, is among the top scorers in Tulare County and is above the state average. Our data is
included in Appendix 1-1.
The support that we got from this grant in meeting this goal included:
For Tier 1 regular classroom instruction
1. Project Read: Prior to us receiving this grant, our district did not have systematic
phonics instruction. Project Read provides systematic instruction for our K-3rd grade
students and it covers the grade level Common Core Reading Foundations Skills. It also
covers phonological awareness, a crucial part of a balanced literacy program. We
purchased the program as well as supplies to help teachers to implement it. Teachers
use the data from the unit assessments to deploy groups and to differentiate
instruction. Our district’s policy is to ensure that every student passes each Project
Read assessment. If a student fails one assessment, he or she must receive specific
support to boost his or her knowledge of the skills taught in that unit. If a student fails
two consecutive assessments, he or she is referred to the Student Study Team. Our
district policy on Project Read and the Student Study Team in included in Appendix 1-2
and our 3-year DIBELS data is included in Appendix 1-3. DIBELS measures phonics and
early reading skills, and an analysis of that data shows a marked improvement when we
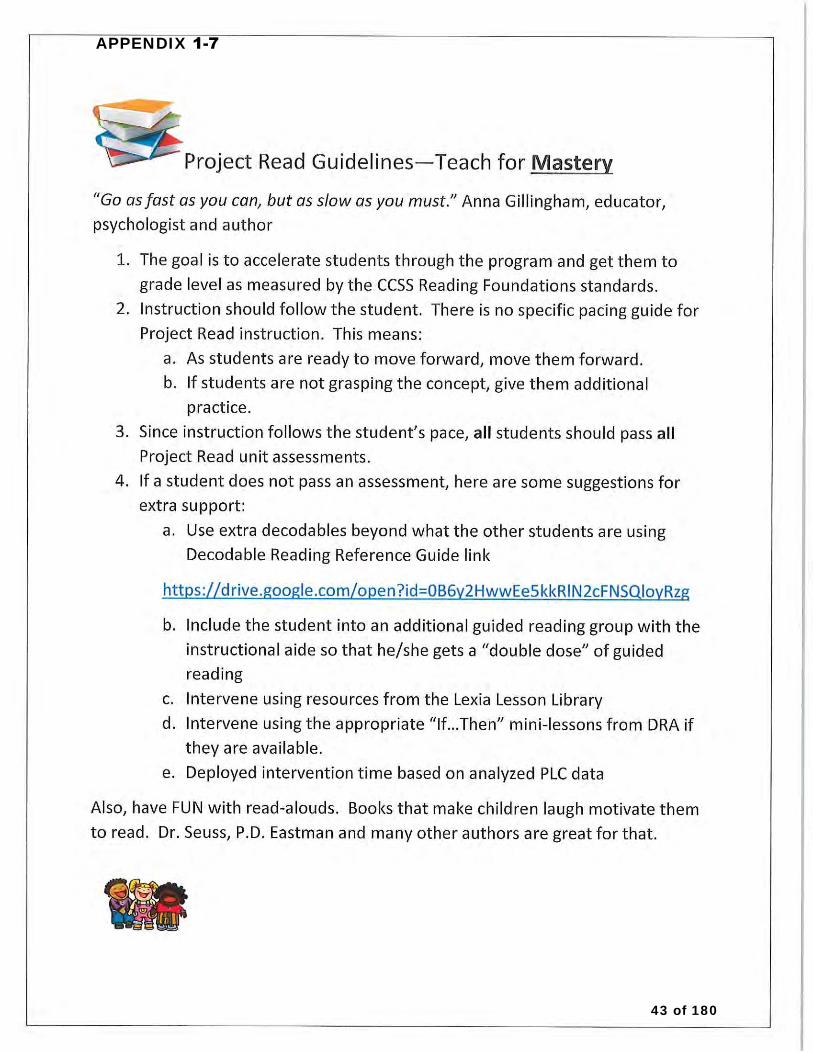
began to use Project Read. The guidelines for Project Read instruction are in Appendix
1-7.
2. Superkids: We use Superkids as a set of decodable books to support Project Read
instruction. They are one of several decodable book sets that we purchased and now
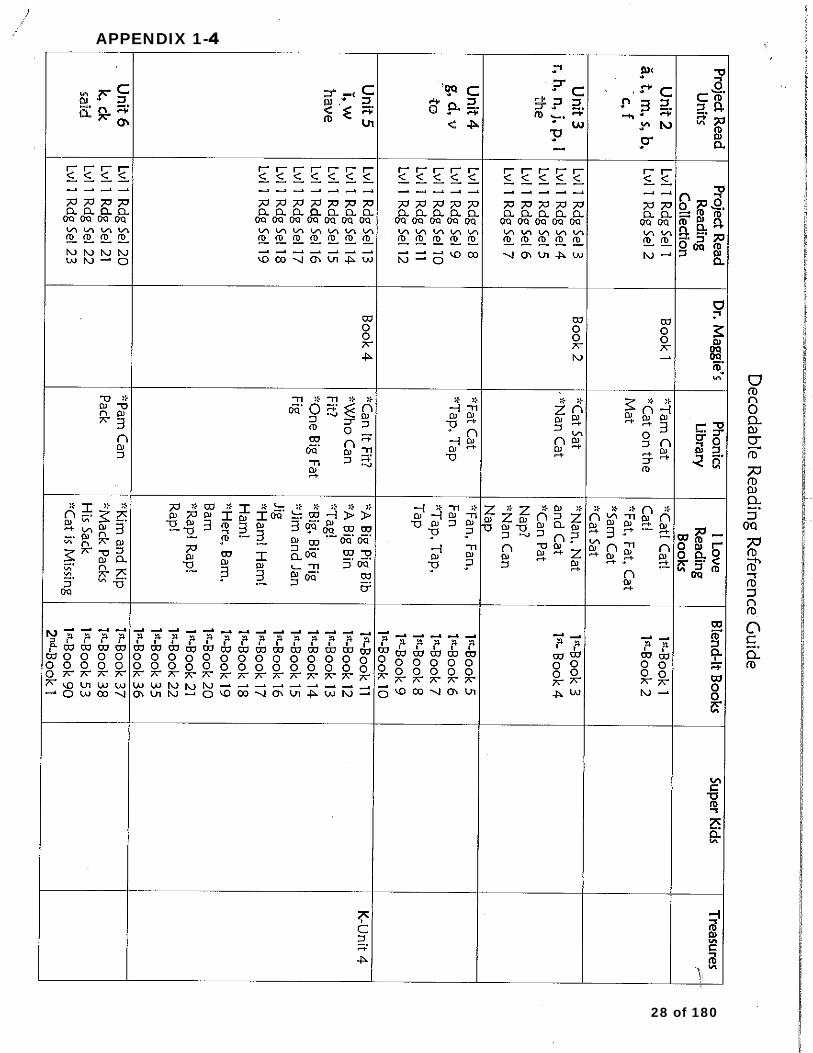
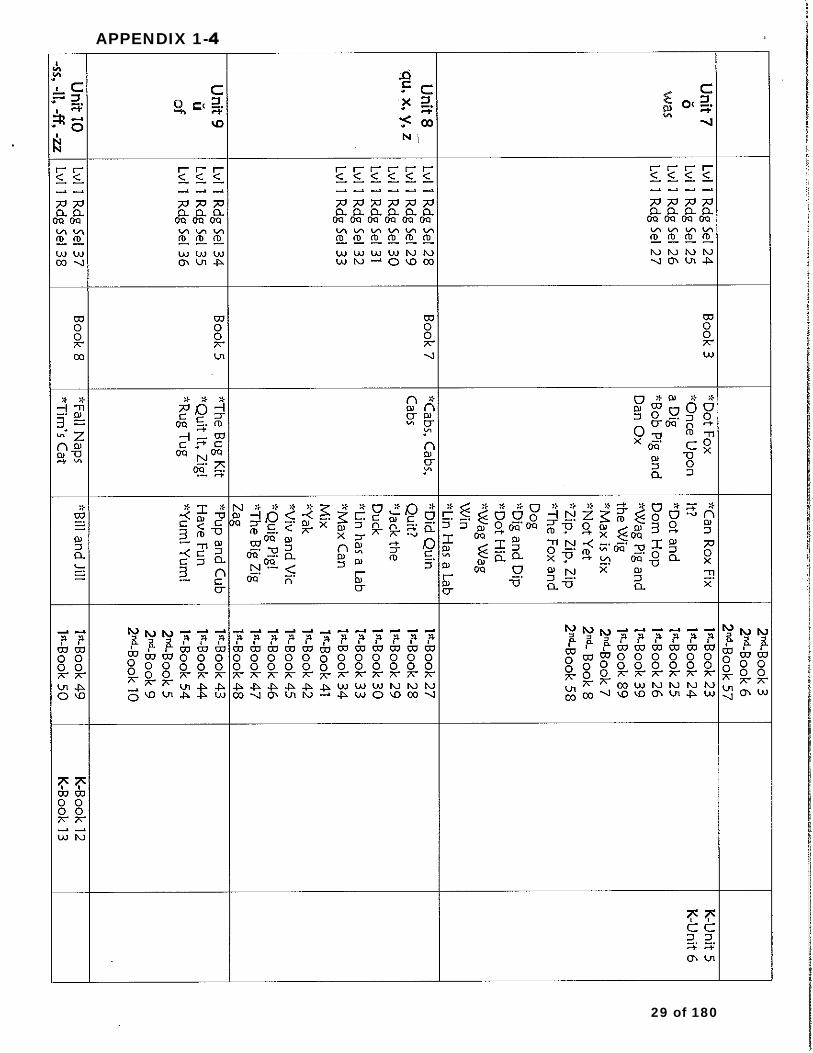
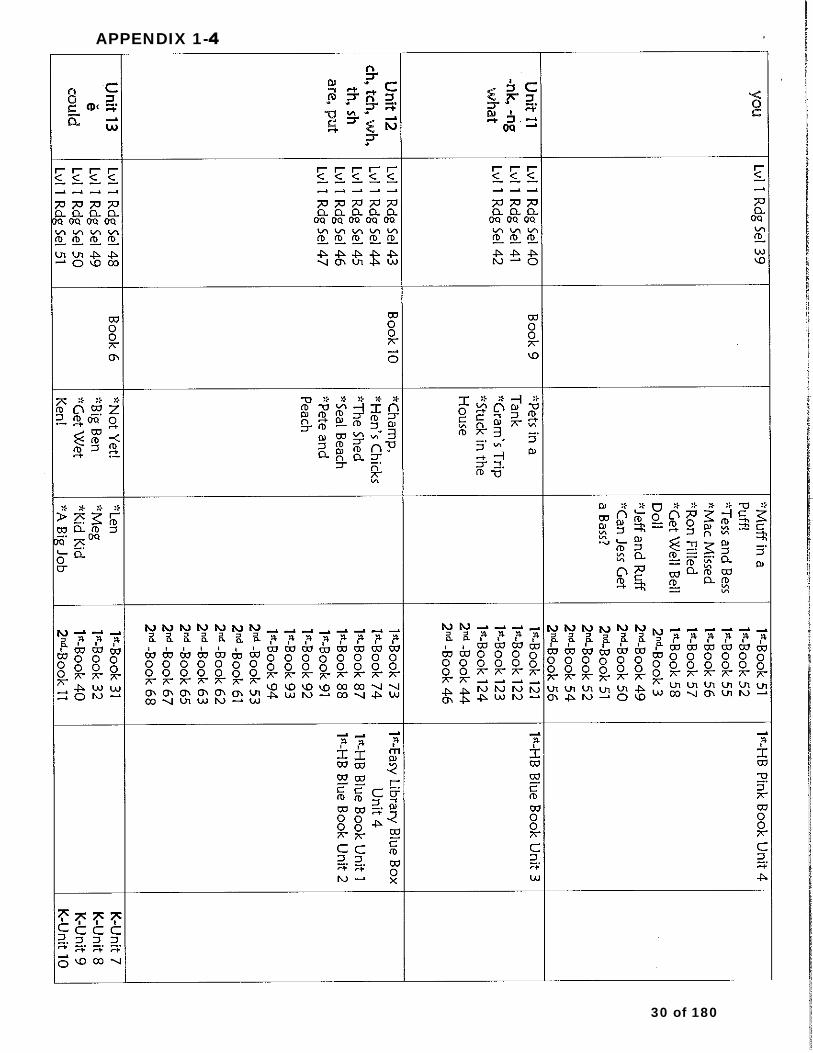
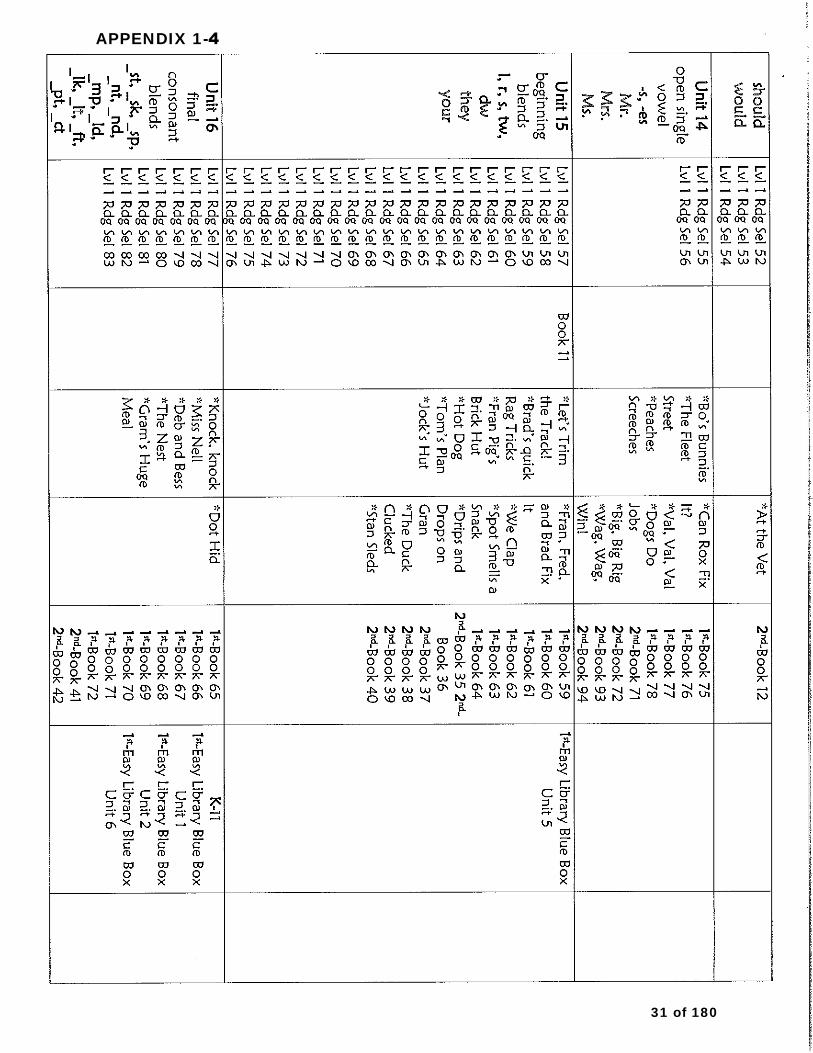
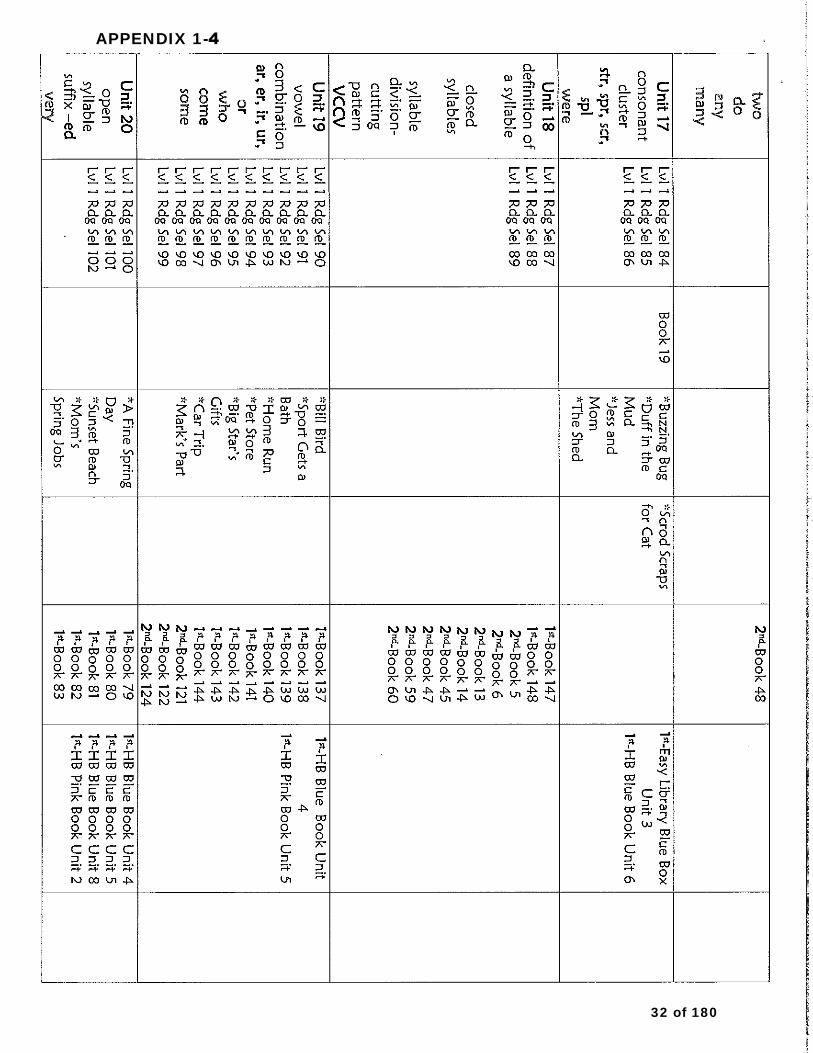
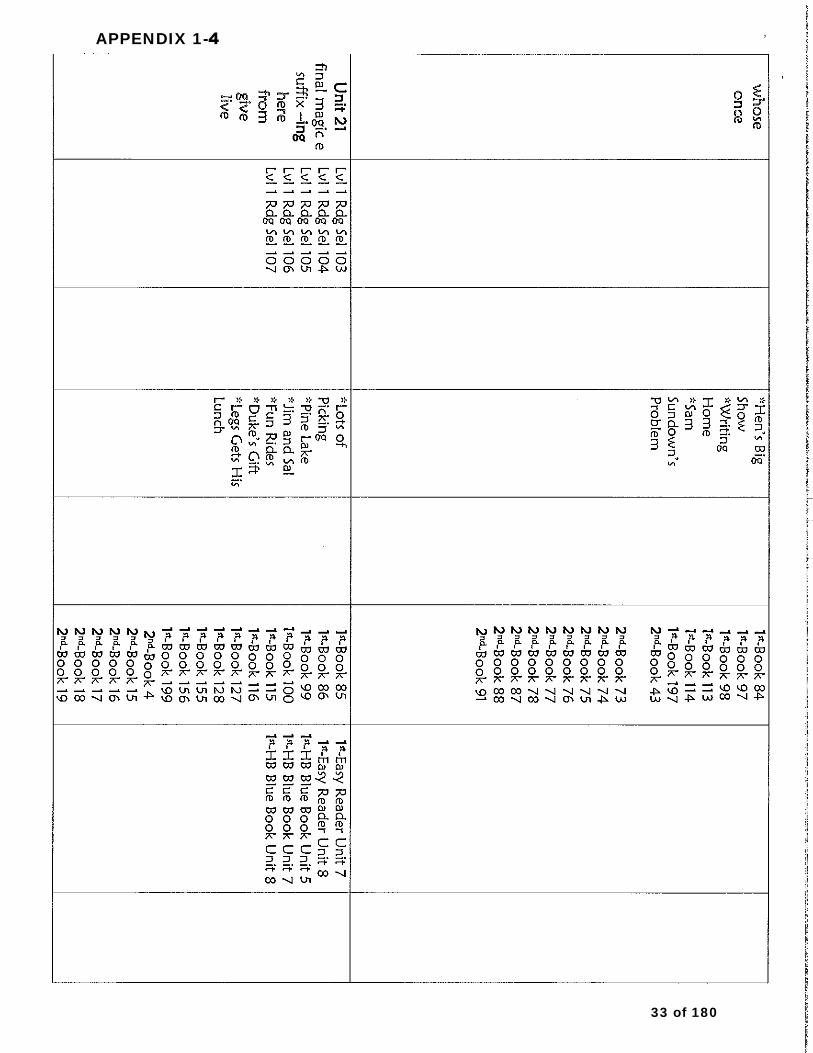
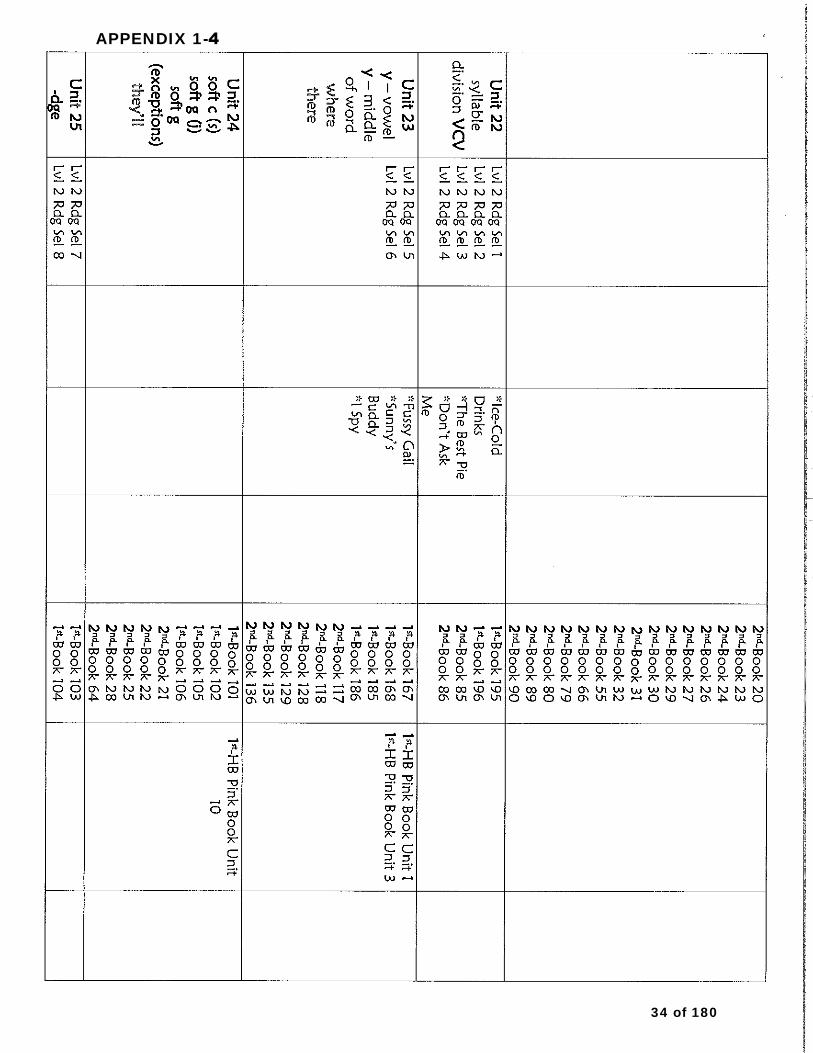
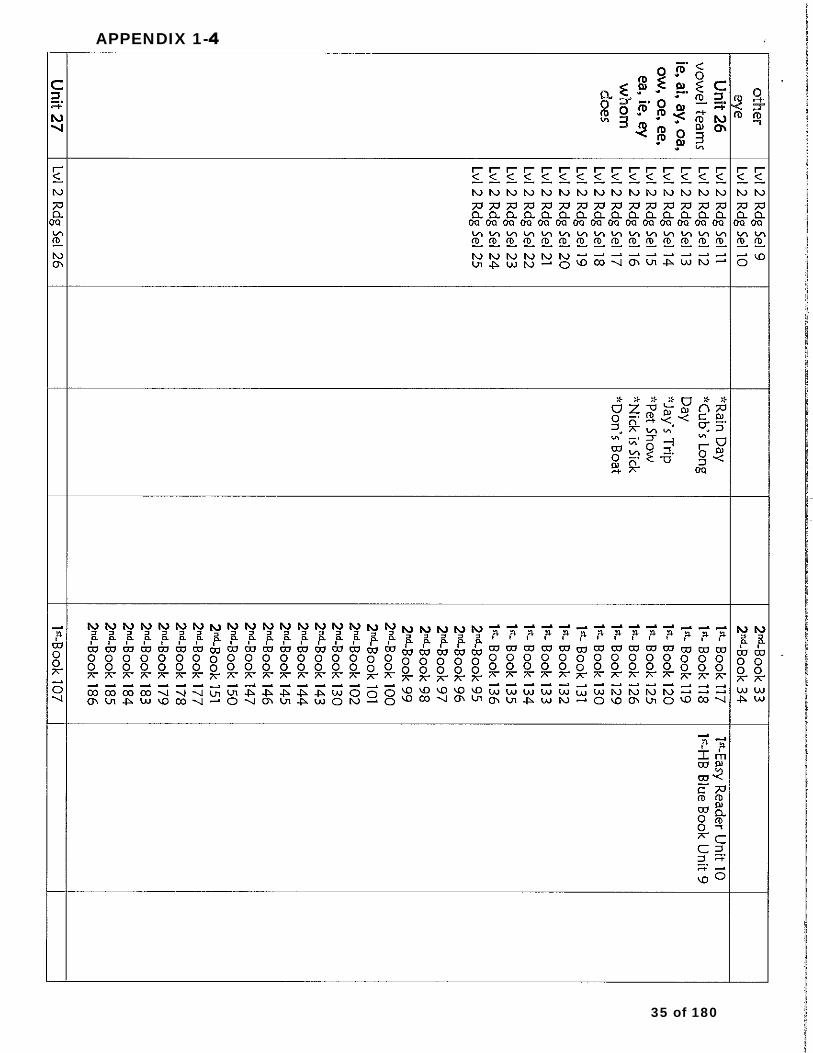
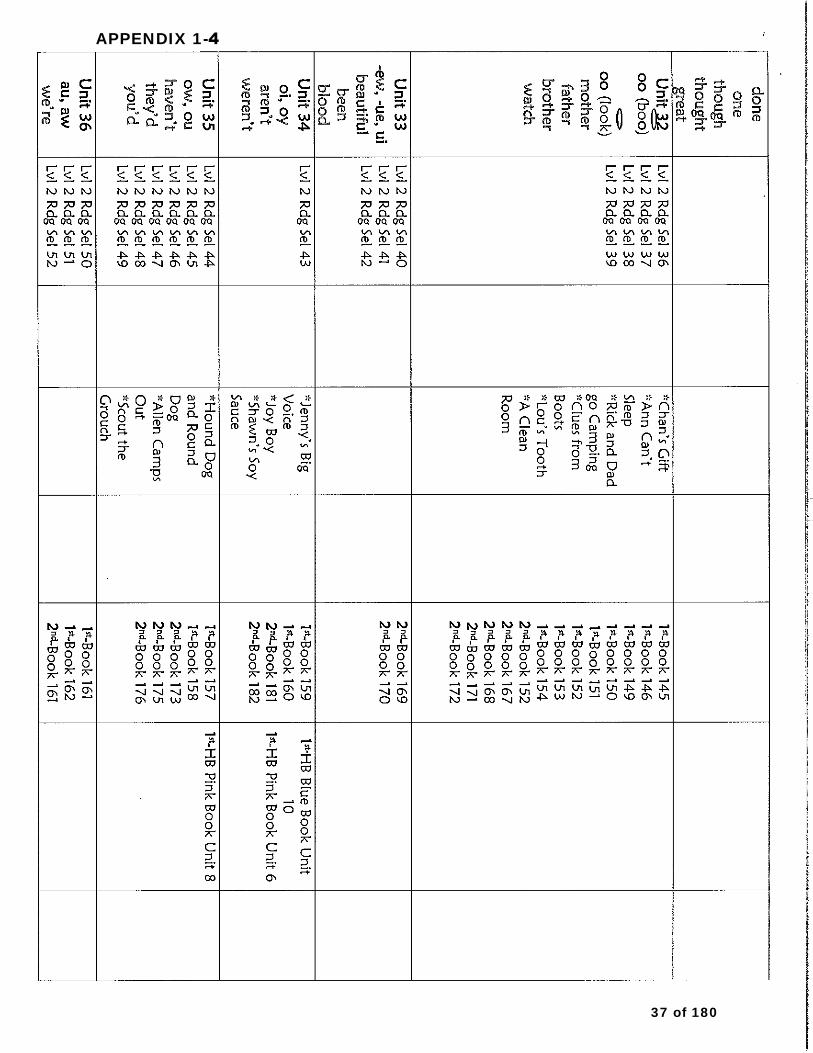
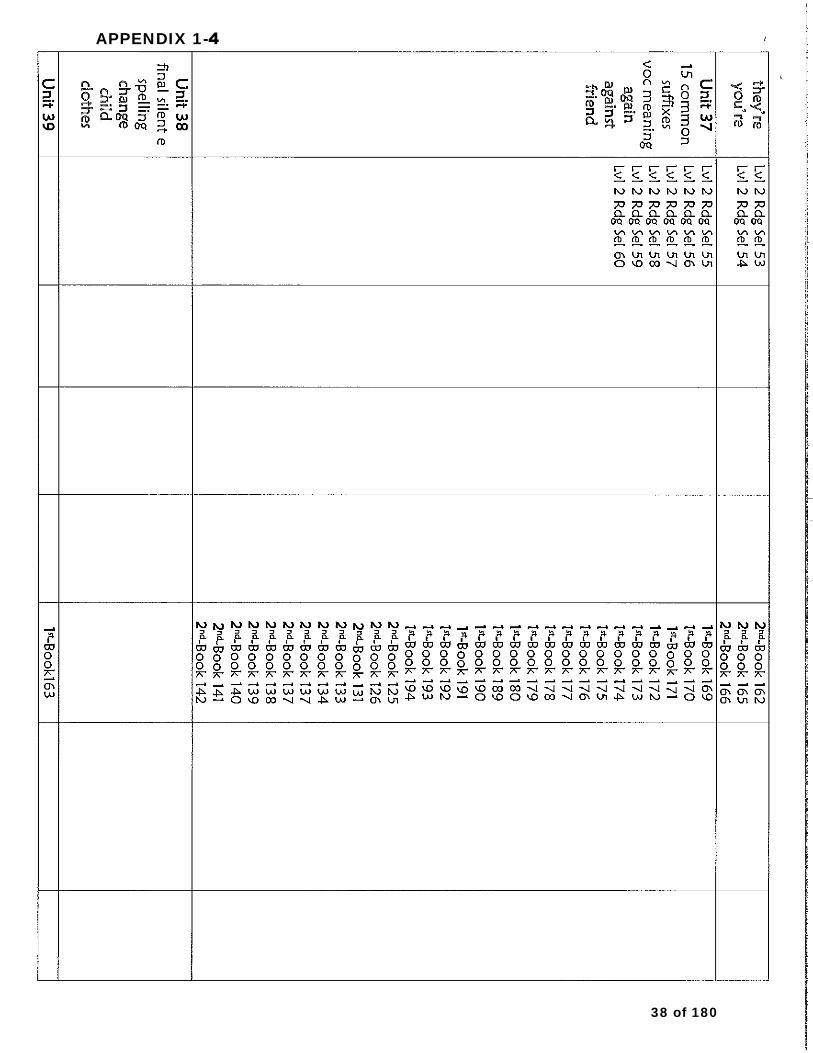
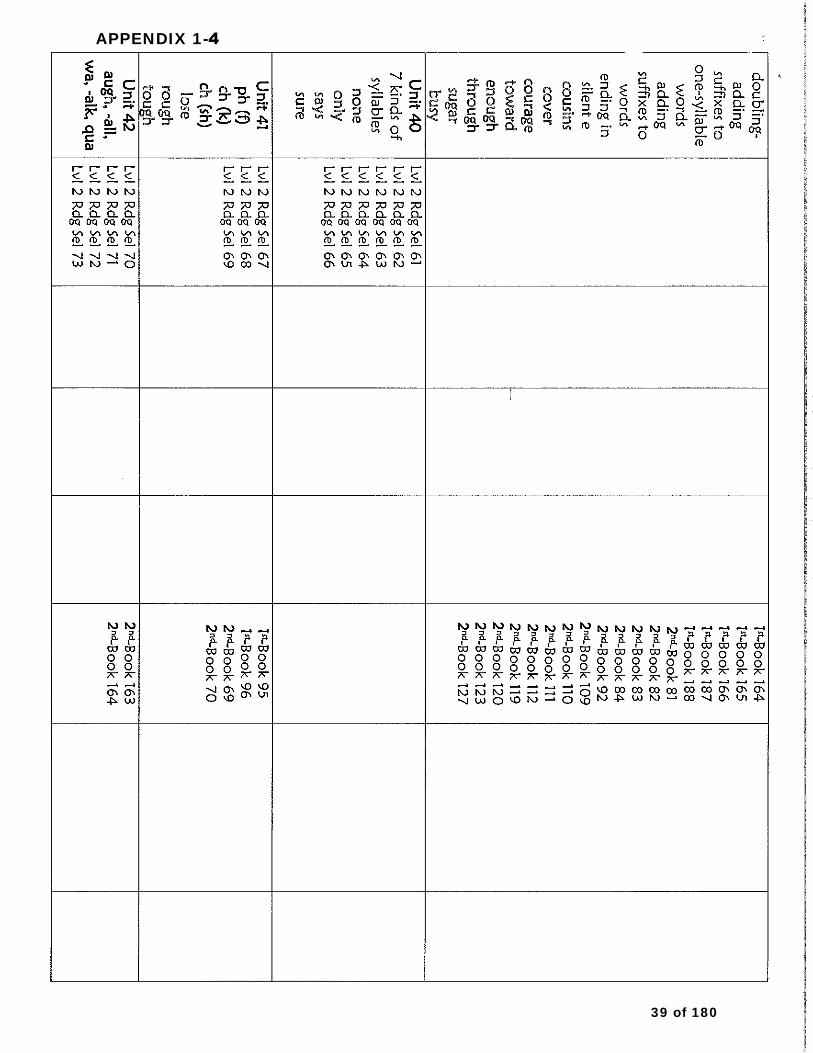
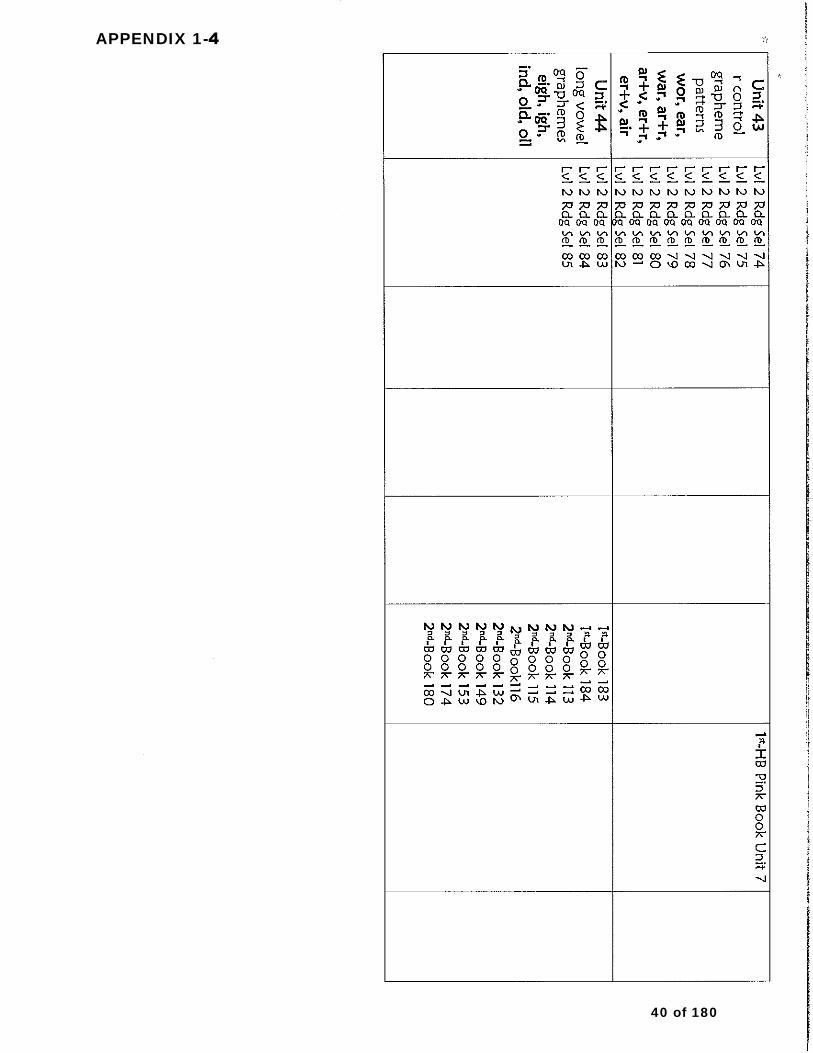
use for this purpose. We developed a Decodable Reading Reference Guide that aligns
decodable reading books with the skills that are taught in the Project Read units. The
Decodable Reading Reference Guide is included in Appendix 1-4.
2 of 180
3. Fast ForWord: We purchased Fast ForWord, a computer-based program that has a
phonics and phonological awareness component. We used it for a year for our K-2nd
grade students, but we did not see an appreciable difference between it and its lower
priced (and familiar) rival, Lexia. With all of the new programs being started, we wanted
to make sure that teachers were not spread too thin by learning too many new
programs at once.
4. Renaissance Learning: Renaissance Learning is the parent company of Star Reading and
Accelerated Reader and the district has purchased these programs for our K-8th grade
students for many years. The problem was that each site had their own account and the
data could not be monitored at the district level. With the money from the grant, we
created a district account and the Star Reading data is now used as an additional
measurement to see if students are ready to exit guided reading. Previously, teachers
exited students from guided reading based solely on the guided reading data. They now
have to use multiple measures to ensure that students are ready to decrease that
support. Our district policy is in Appendix 1-5.
5. Developmental Reading Assessment (DRA2): We purchased and trained teachers on
DRA2, a much more thorough and diagnostic assessment than the Rigby assessments
that we used previously. The DRA2 gives teachers information on their students’
strengths and weaknesses as readers, not just an overall book level. Teachers are able
to use this information to develop instructional focus areas for students and for
grouping. The DRA2 also gives teachers guidance on next steps and provides mini-
lessons to help them to address the students’ focus areas. Vital information is also
available on students’ reading behaviors at different stages, so that teachers are able to
see when a student is transitioning from one reading stage to another. This not only
gives teachers data on student progress, it builds capacity and helps them to become
better and more knowledgeable reading teachers. The target student population for
this assessment is K-5th graders, and 6-8th grade students who are more than 3 years
below grade level.
6. Guided Reading: Our district has done small group reading instruction for many years,
but all of the elements of guided reading have not been in place. We enlisted the
support of consultants from the Tulare County Office of Education (TCOE) to train the
teachers in the elements of guided reading, including the error analysis that is the heart
and soul of creating individualized instruction. That training is ongoing. We also
purchased many books for guided reading, including Literacy Footprints that provides
teacher supports such as lesson plan templates, word work suggestions, etc.
For Tier 2 intervention
1. Sound Partners: Sound Partners is an intensive, one-on-one phonics intervention that
students receive 4 days a week for a half-hour from a paraprofessional. We are using it
for students who have failed two consecutive Project Read assessments, after they have
received other in-class interventions. See Appendix 2.
3 of 180
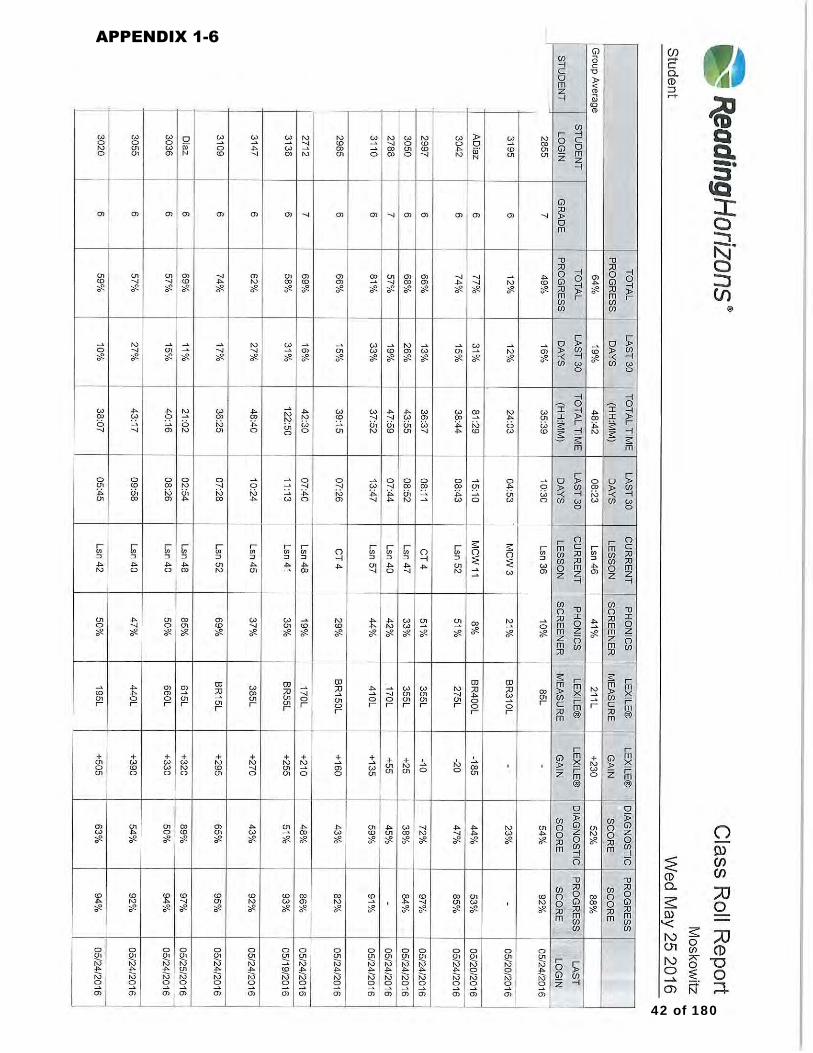
2. Reading Horizons: Reading Horizons is a phonics-based intervention program for our 6th
and 7th grade lowest-functioning readers who do not qualify for Read 180. These
students receive this instruction in addition to their regular English/Language Arts
classes. They have shown growth over the past year. Data from the program is
available in Appendix 1-6.
District Match
We have a district match in our grant for Read 180. We are using Read 180 for our 4th through
8th grade students who qualify based on the Reading Inventory that is embedded in the Read
180 program. Fourth and fifth grade struggling readers who do not qualify for Read 180 receive
Project Read support from a paraprofessional and guided reading support from their classroom
teacher.
When a district adopts the guided reading model, the question always arises, “What are the
other students doing while the teacher teaches a small group?” Our district struggled with that
for quite some time and now we have turned to the Daily 5 to answer that question. The
components of the Daily 5 are Read to Self, Read to Someone, Listen to Reading, Work on
Writing and Word Work. All of these elements promote reading and will allow students to
practice what they have learned from their teachers during reading instruction.
Goal #1 Appendix:
1. CAASPP ELA overall and growth data
2. District Policy on Project Read and Student Study Team
3. DIBELS 2-year comparison data
4. Decodable Reading Reference Guide
5. Guided Reading Exit Policy
6. Reading Horizons sample data
7. Project Read Guidelines
Goal #2: Provide comprehensive literacy services to parents of English Learners to improve school readiness and engage non-English speaking parents in the day-to-day life of their child’s school.
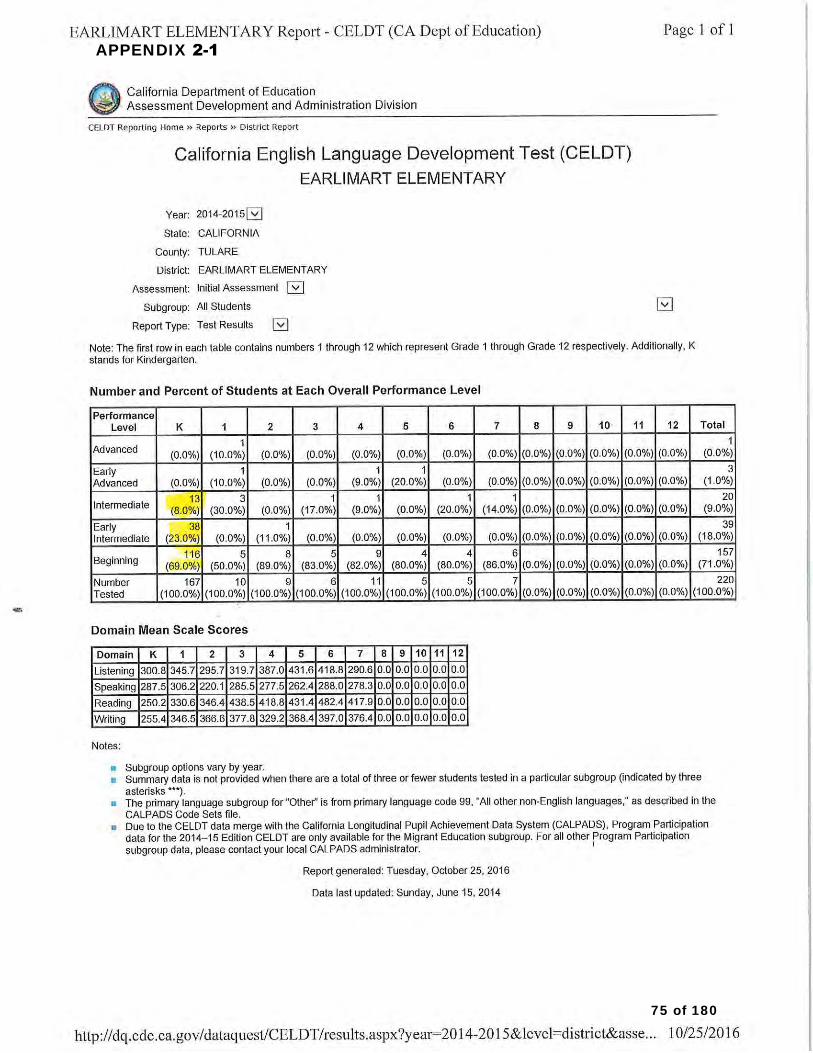
OUTCOME: At-home reading activities and school readiness will increase significantly among preschool-aged children in Earlimart.
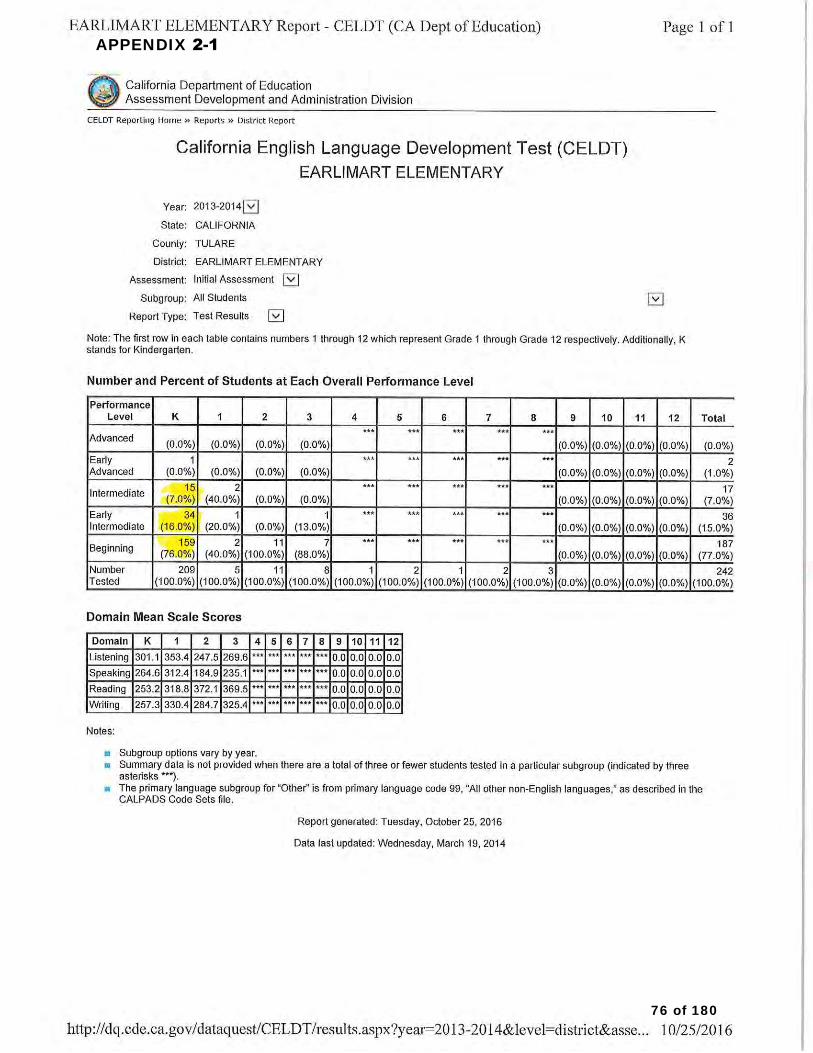
Based on the increase in our CELDT scores from the 2013-2014 year to the 2015-2016 year, we have met this goal. We netted a 15% overall increase in Kindergarten CELDT scores: there was a 1% gain in level 3 students, a 7% gain in level 2 students and a 7% decrease in level 1 students from the previous year. The current year’s scores have not been released yet. The initial CELDT scores are included in Appendix 2-1.
4 of 180
The support that we got from this grant in meeting this goal included: 1. Latino Family Literacy Project: We have had 75 parents attend the Latino Family
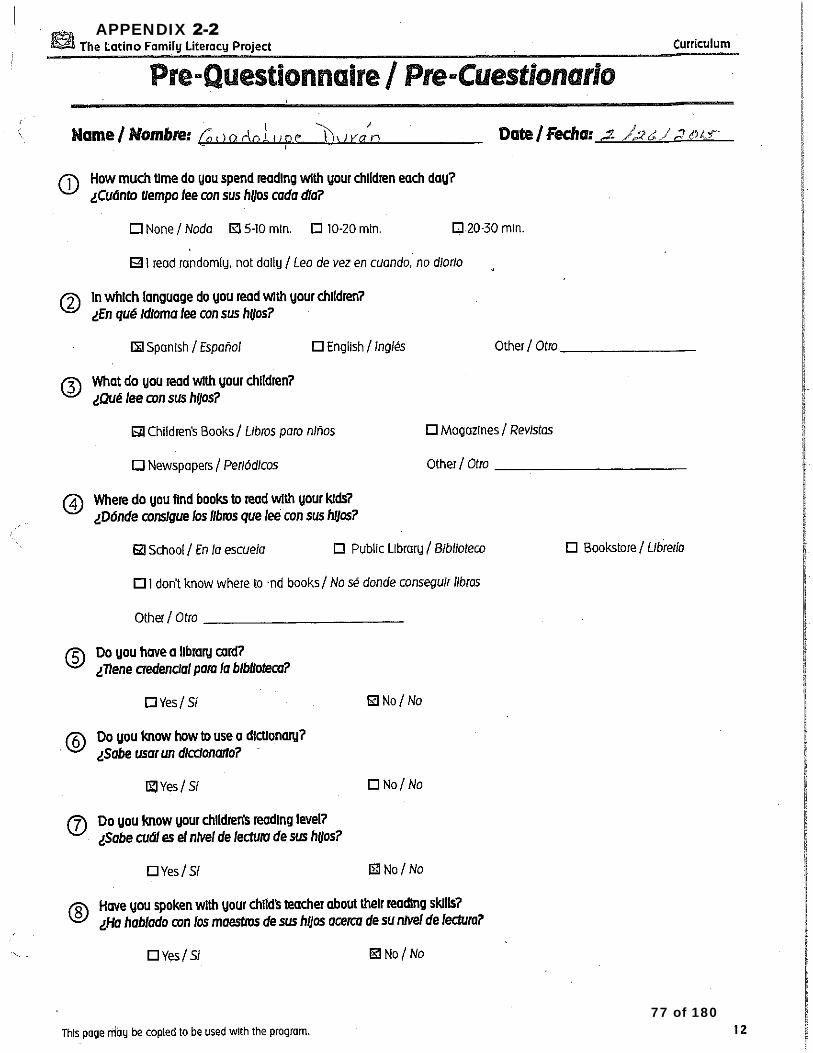
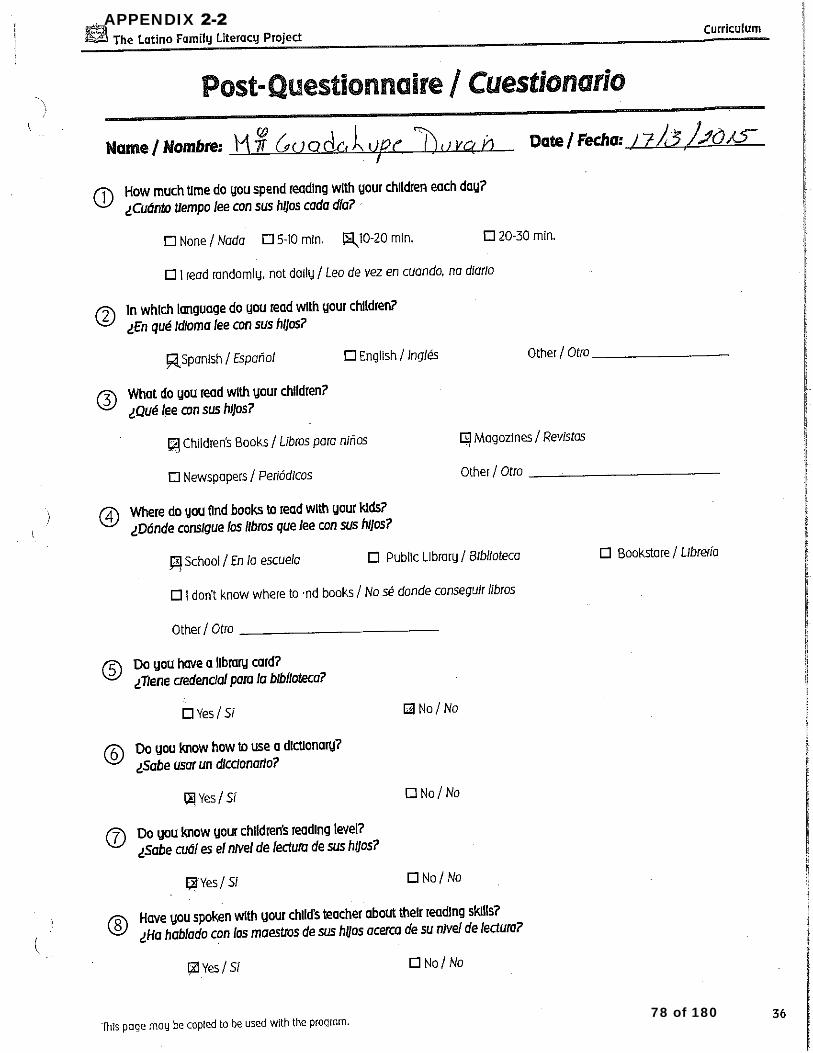
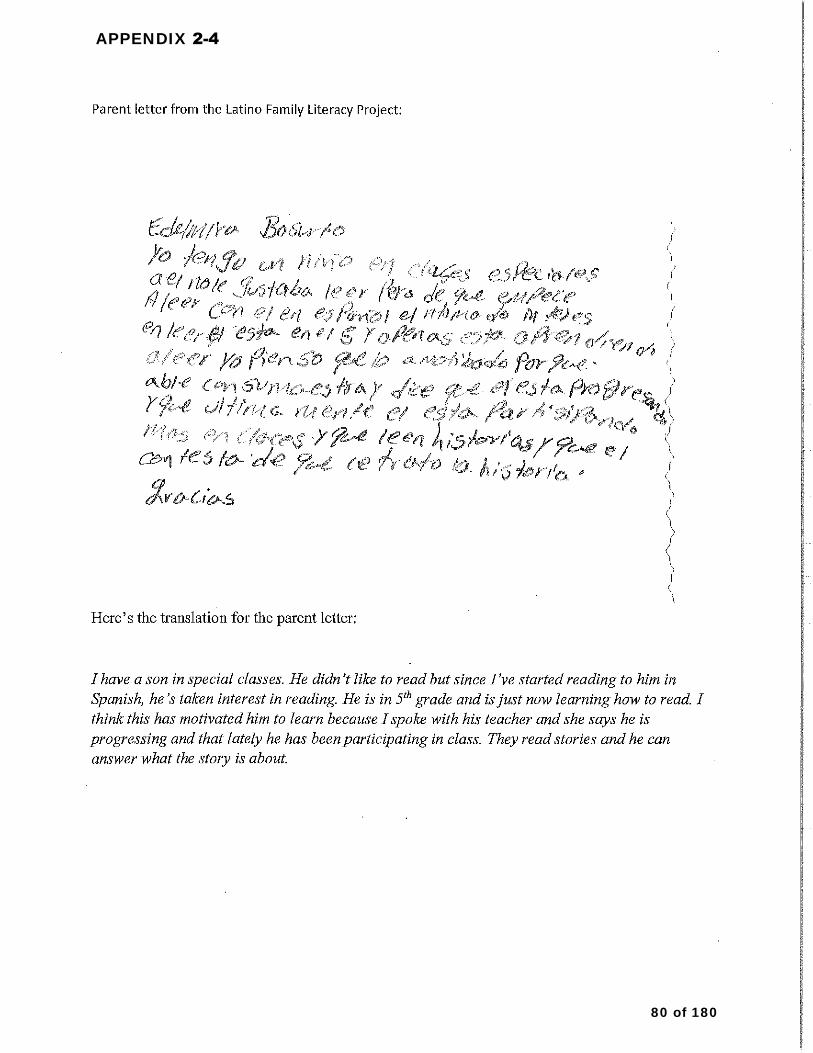
Literacy Project since we received the grant funds. The Project offers 10 classes per session where parents hear a bilingual book (published by Lectura Books, part of the Latino Family Literacy Project) read in English and Spanish each session, then they practice reading it with each other. Those who are not able to read either language are assisted in doing a “picture walk.” They take the book home and read it to their children, return it the next week and receive another book. They are also provided cameras to take family photos to create a captioned scrapbook in class. The scrapbook is a keepsake to read to their children when class is over. The parents who attend report that enjoy the classes, and at least 20 of them have come back for an additional session. On the surveys, all of the parents report that they have increased the time that they spend reading to their children at home and that they have asked for their child’s reading level from their teacher. The Latino Family Literacy Project is something that the district will continue to offer going forward. A Sample of the Pre and Post Parent Questionnaire is included in Appendix 2-2. I also included a letter from a parent about her child’s increased motivation to read and improvement in the classroom as a result of her experience in the Latino Family Literacy Project. Her letter is in Appendix 2-4.
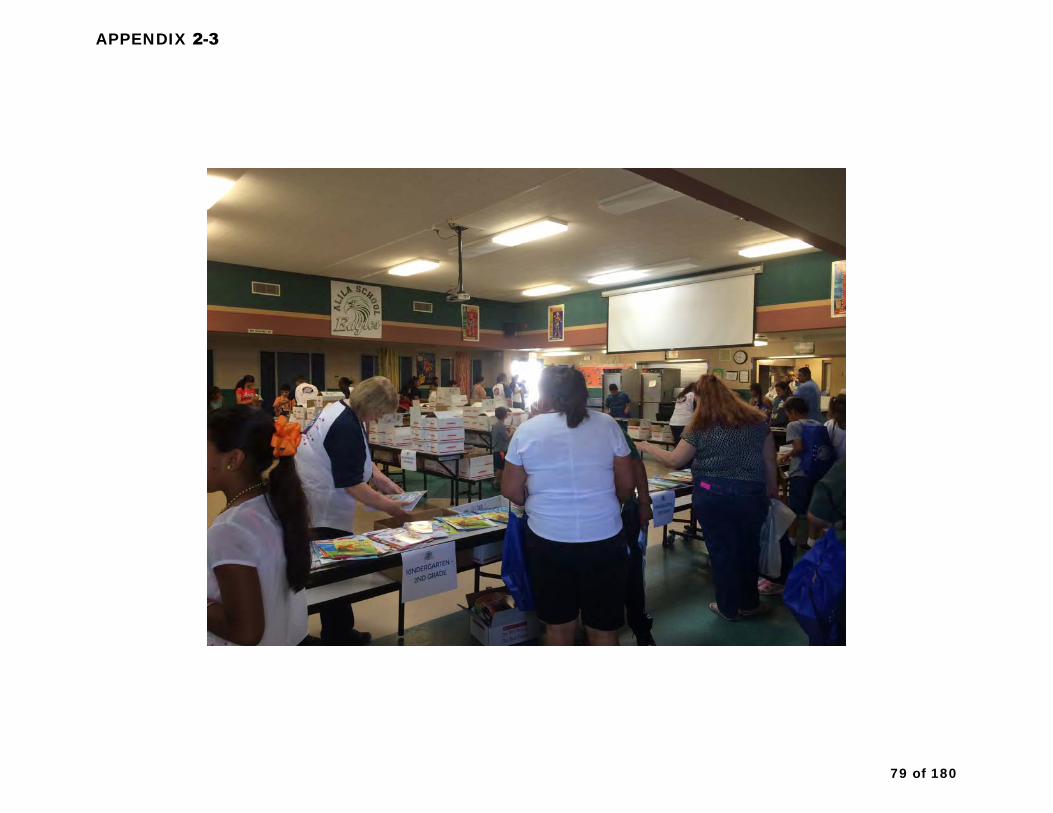
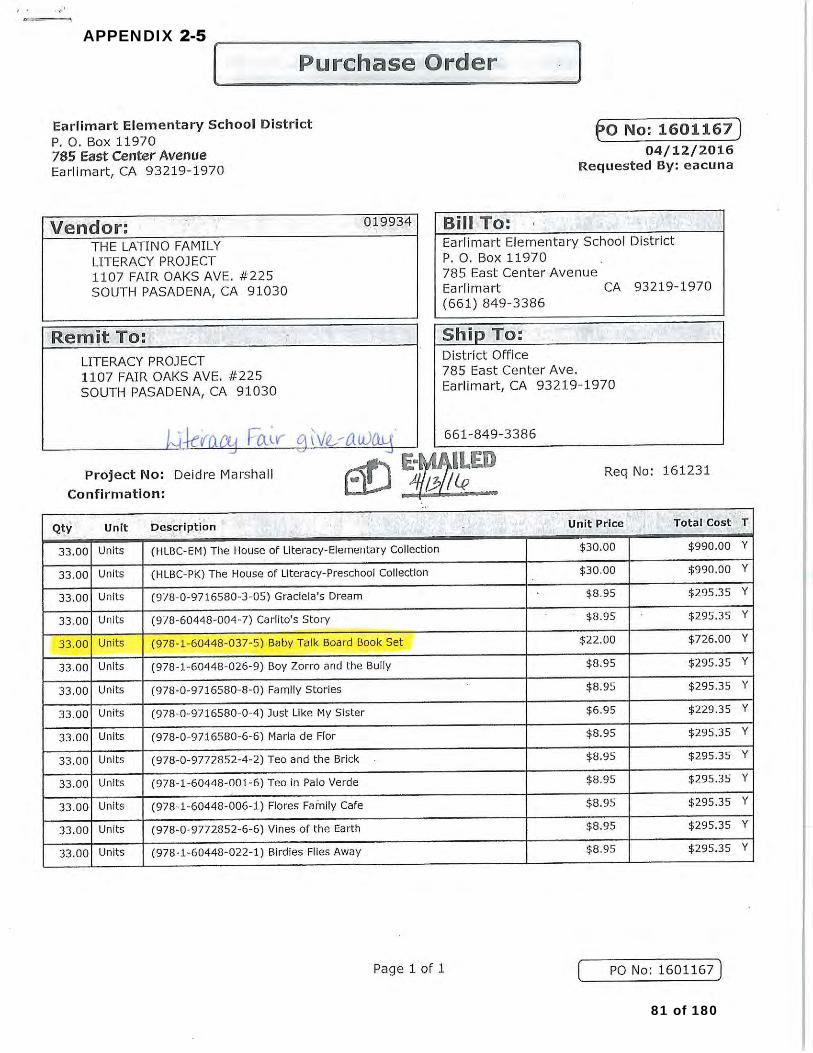
2. Summer Book Giveaway: We have an annual Literacy Fair each May and we gave away thousands of dollars in books. The IAL grant purchased Lectura books to give away during the Literacy Fair. Photos of the Literacy Fair are included in Appendix 2-3.
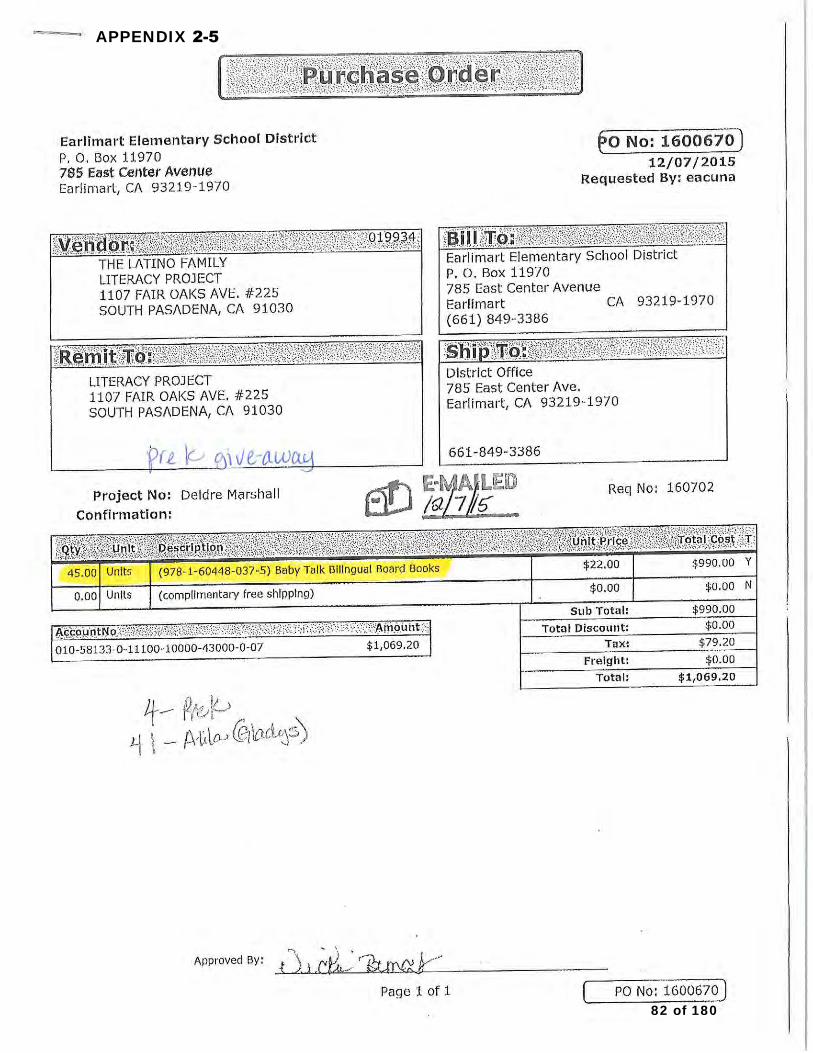
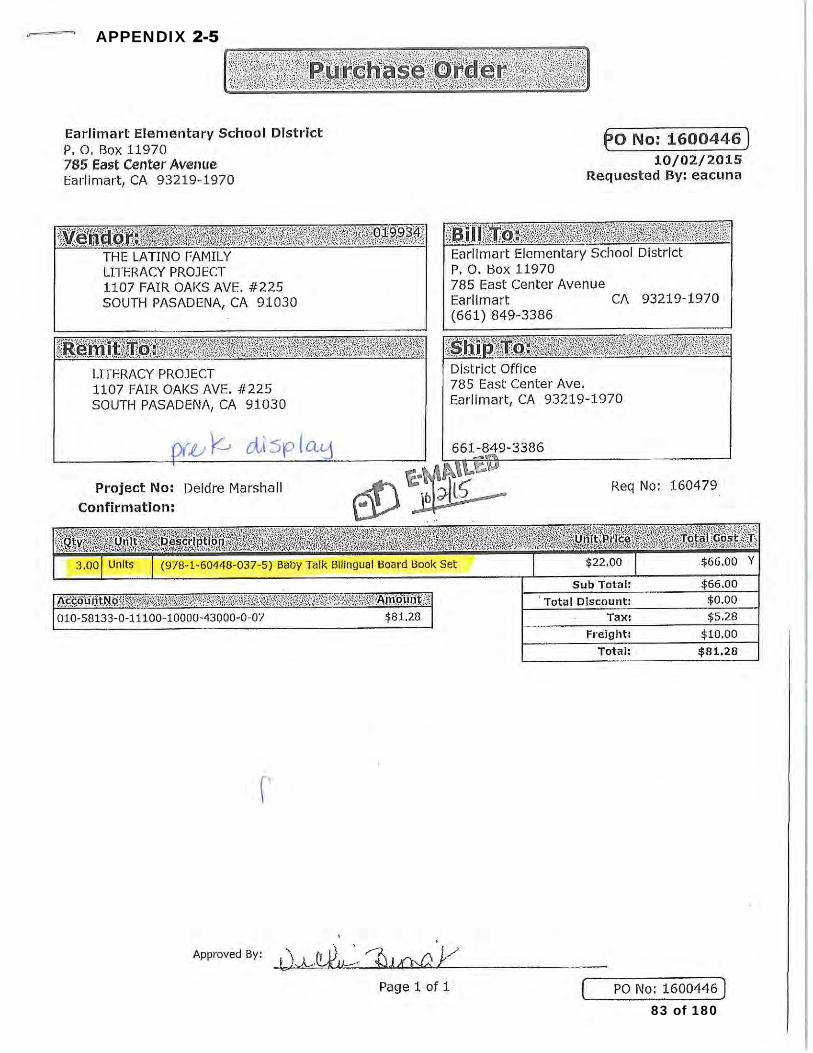
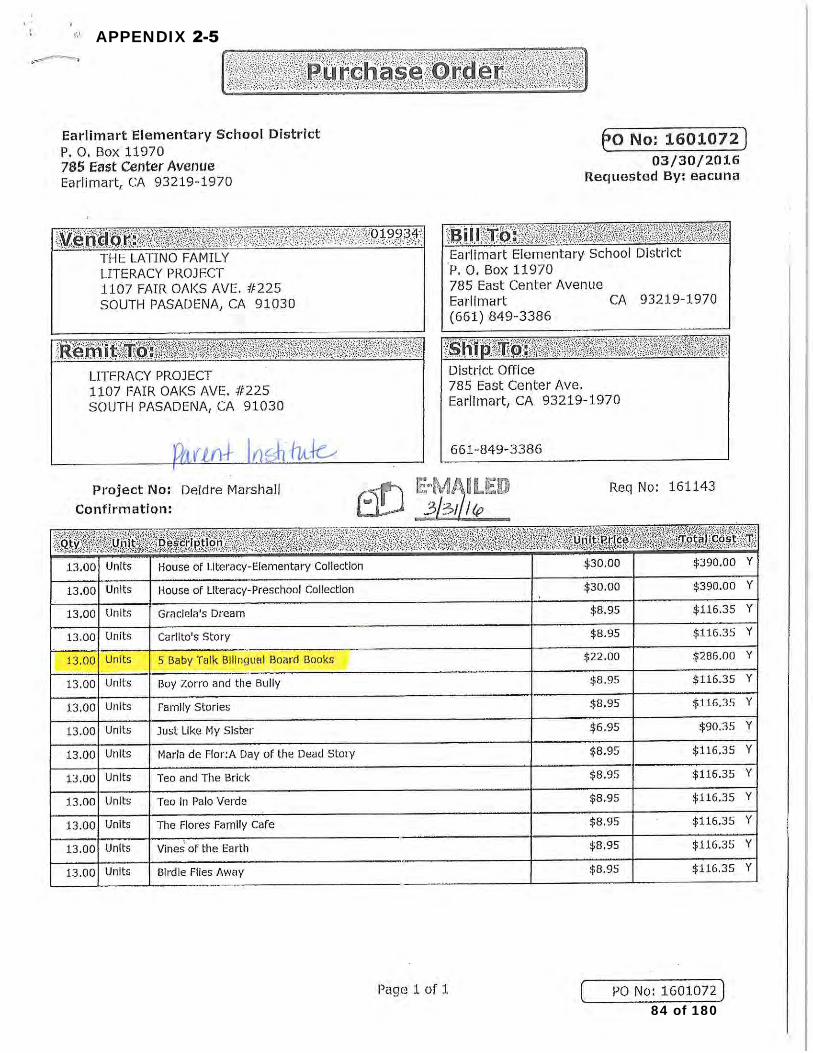
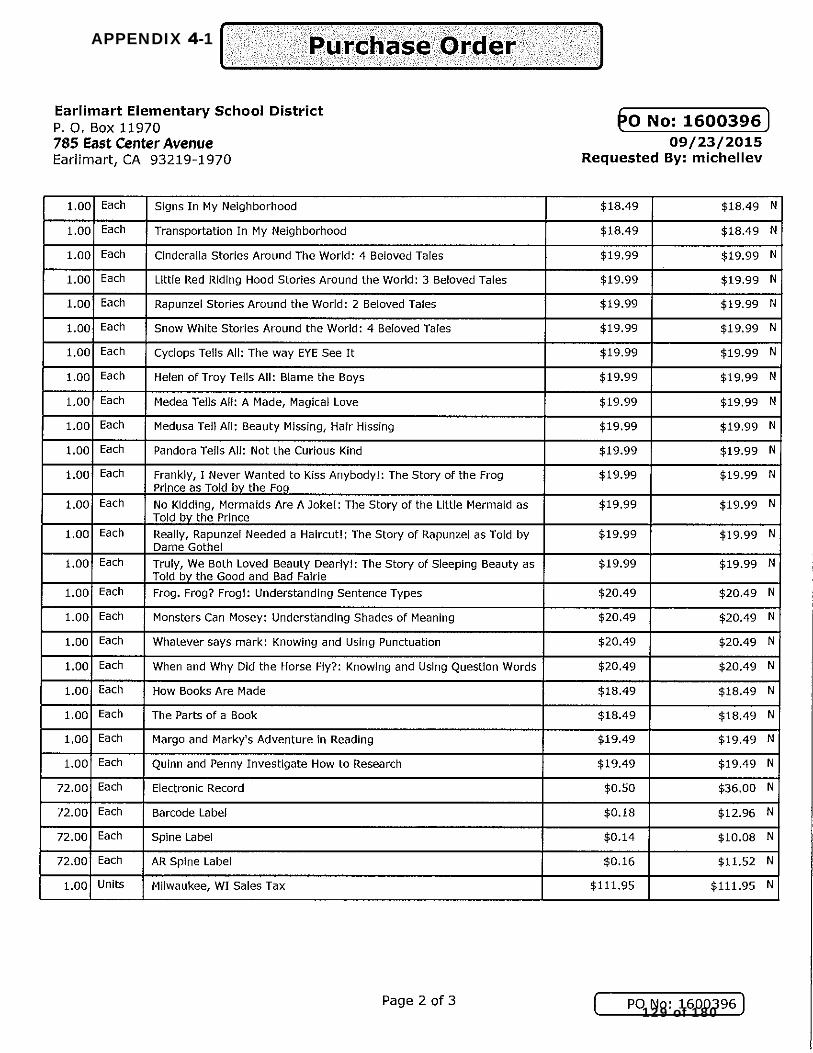
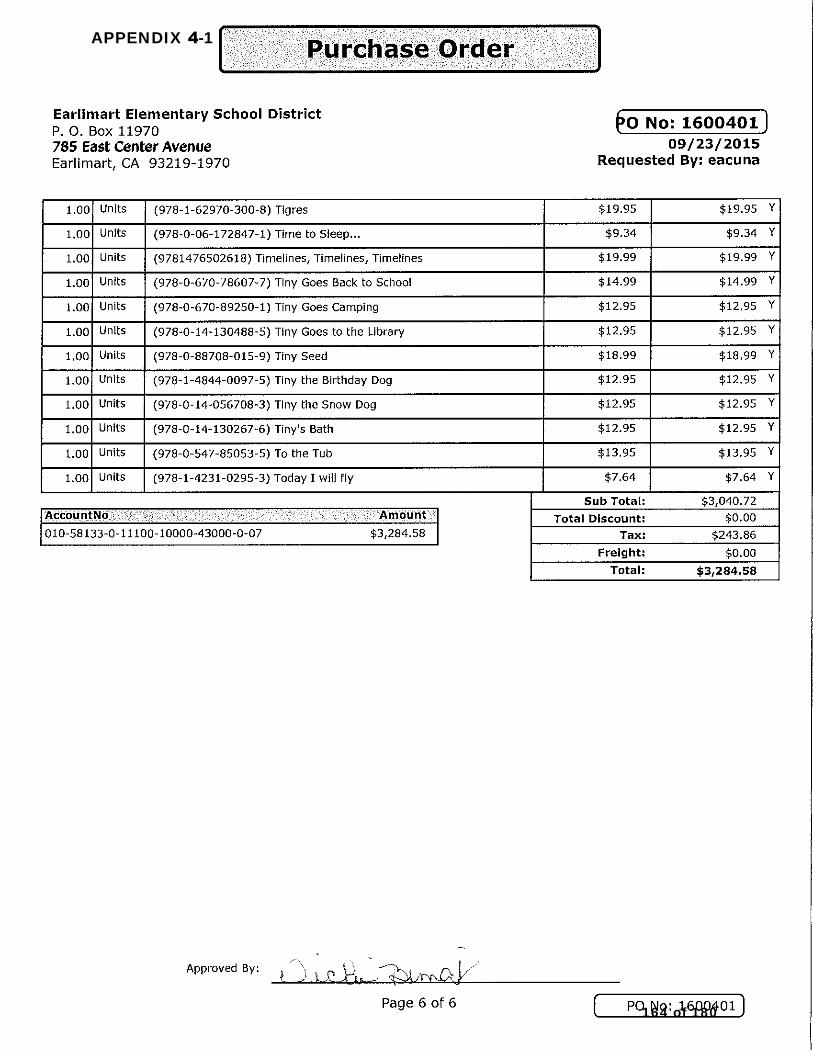
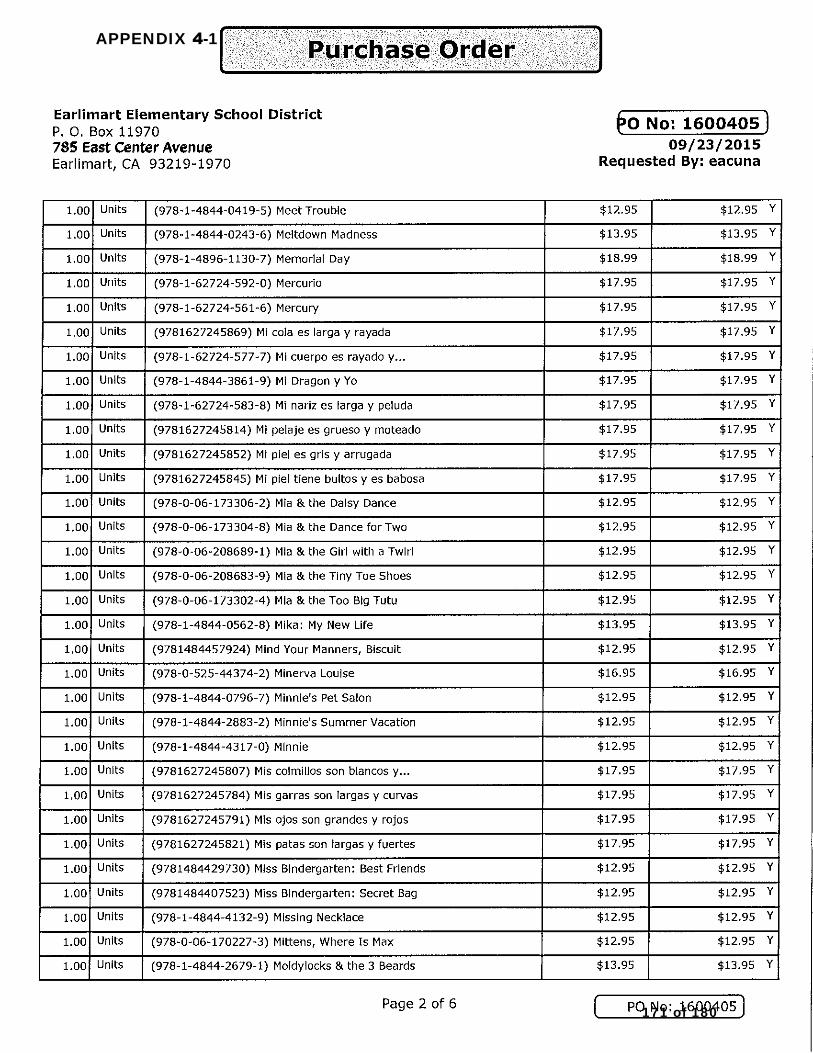
3. Toddler Book Giveaway: Lectura Books published a 5-book set of bilingual cardboard toddler books that we offered to our preschool parents. We gave away 45 sets of these books specifically to our preschool parents, and we gave 13 copies away during our Parent Institute. The purchase order for the summer and toddler book giveaways are included in Appendix 2-5.
Goal #2 Appendix 1. 2-year initial CELDT scores highlighting Kindergarten language proficiency scores 2. Sample Pre and Post Parent Questionnaires 3. Photos of the Literacy Fair 4. Latino Family Literacy Project Parent letter 5. POs for summer and preschool book giveaways
Goal #3: Improve the range of literary resources available to Earlimart students by modernizing and updating library collections at all three school sites.
OUTCOME: Students will significantly increase library usage and time spent reading.
Growth for this goal will be difficult to show because one of the benefits of this grant was to allow us to upgrade the outdated Athena library management system to the new Destiny system, and Athena did not have circulation data available. However, we do have circulation data from the Destiny system. It is included in Appendix 3-1.
5 of 180
One of the changes that we made to increase library usage was to adopt the “Open Library’ policy. In the past, teachers took their students to the library weekly and students checked out two books. With the Open Library approach, students can check out books daily which more than doubles the number of books a child can read, especially primary grade students who check out books that can be read in one sitting. We are getting additional training in Accelerated Reader so that school sites can learn more about the motivational part of the program. As sites expand their student recognition and competition efforts, library circulation will grow steadily.
Goal #3 Appendix Circulation data from Destiny
Goal #4: Provide adequate library resources to improve college and career readiness for Earlimart students entering high school.
OUTCOME: More Earlimart students will graduate and continue on to postsecondary education as a result of greater English language proficiency.
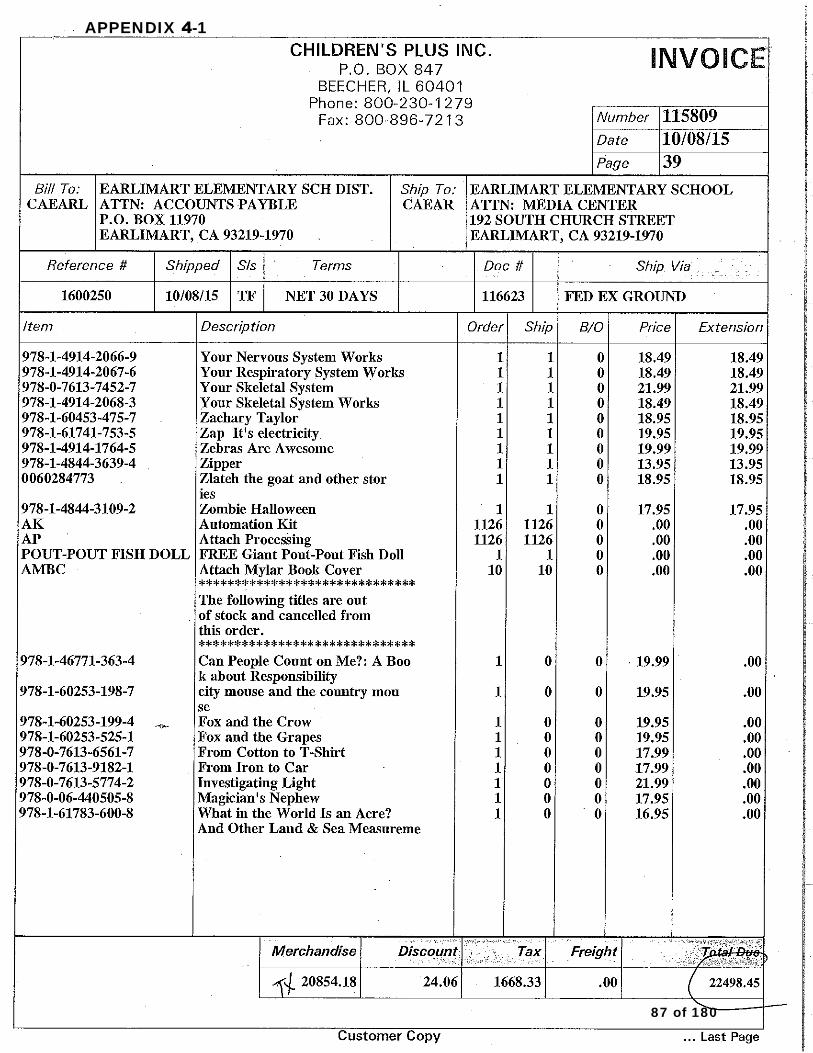
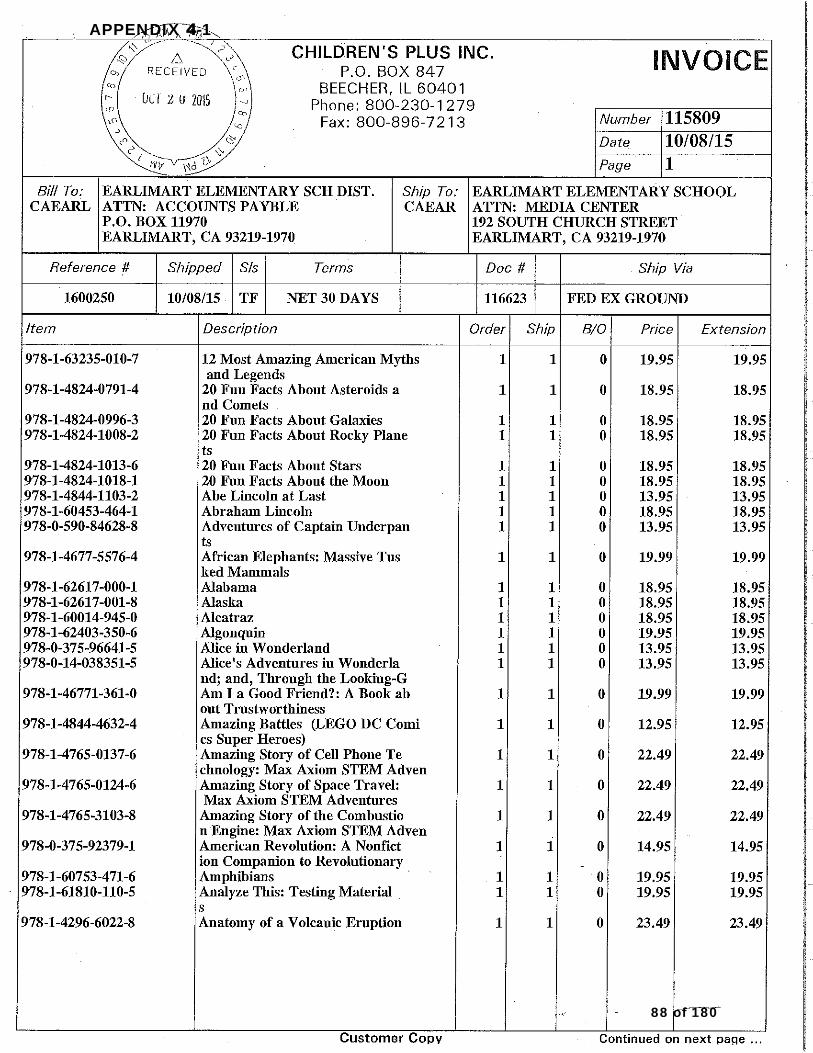
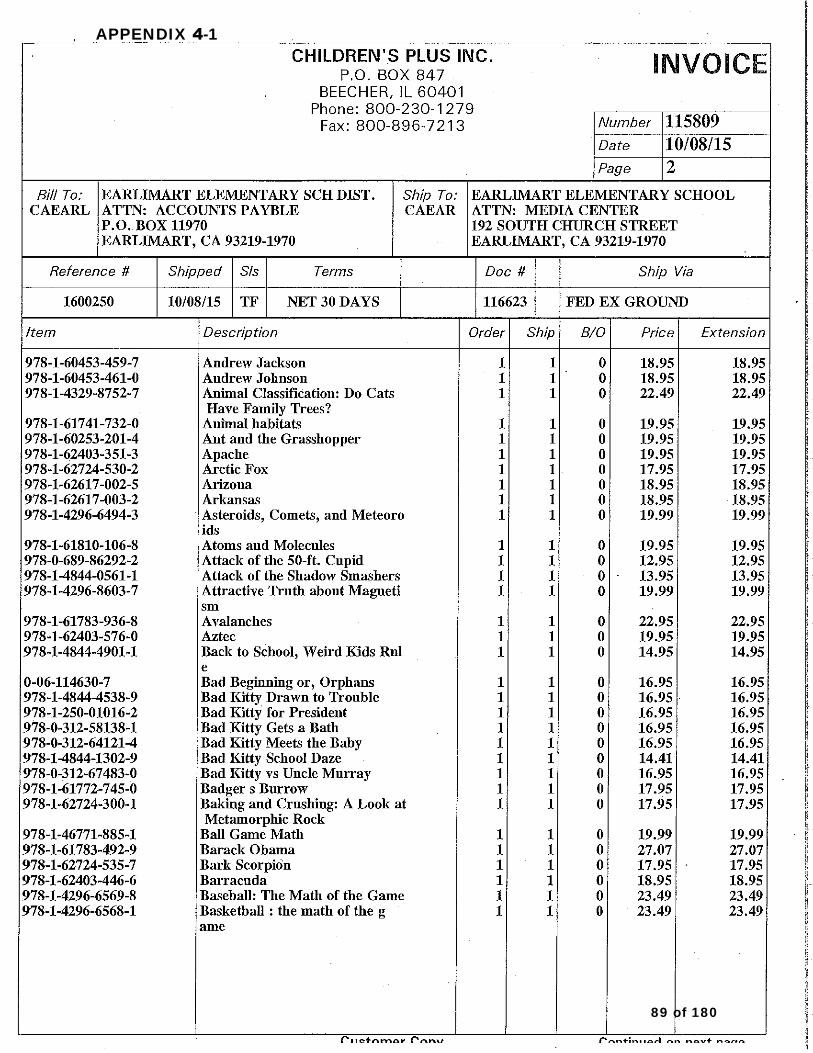
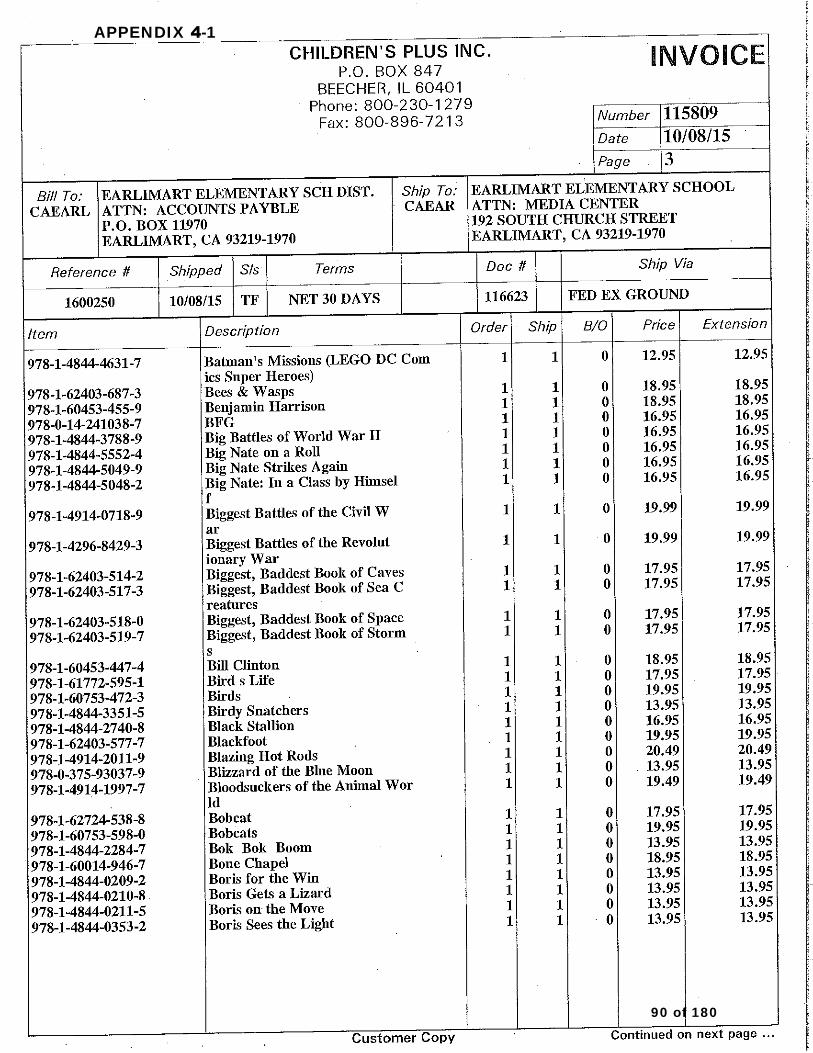
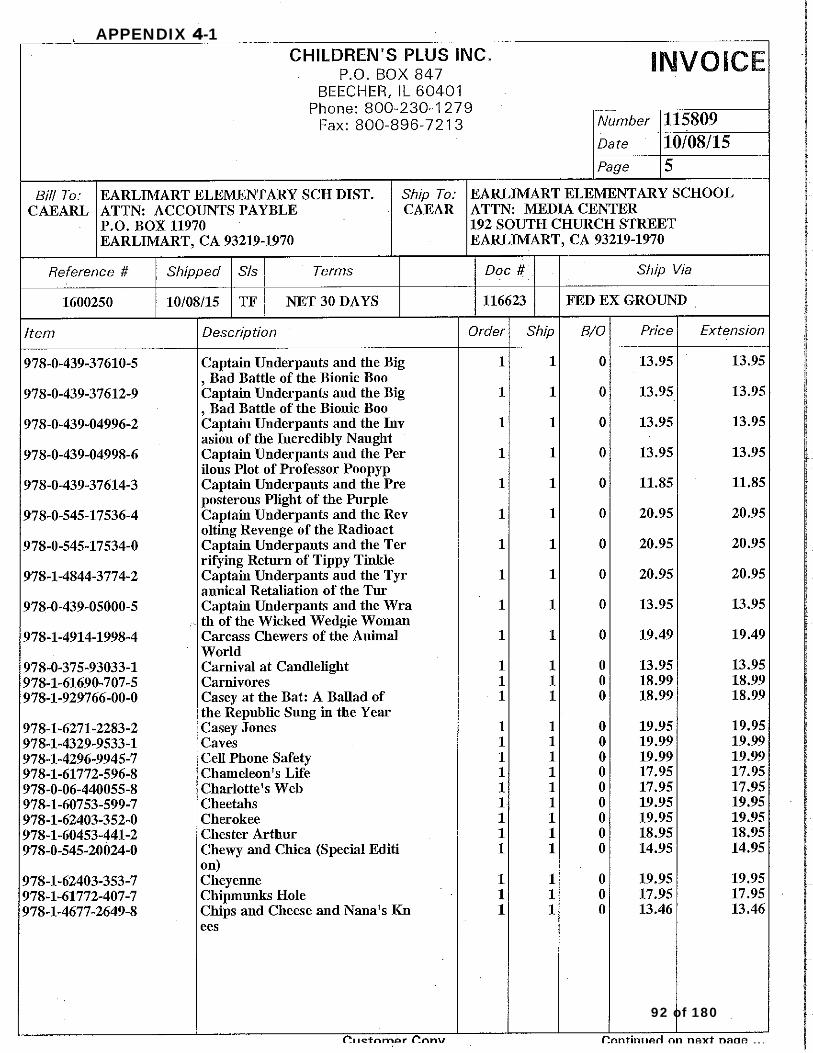
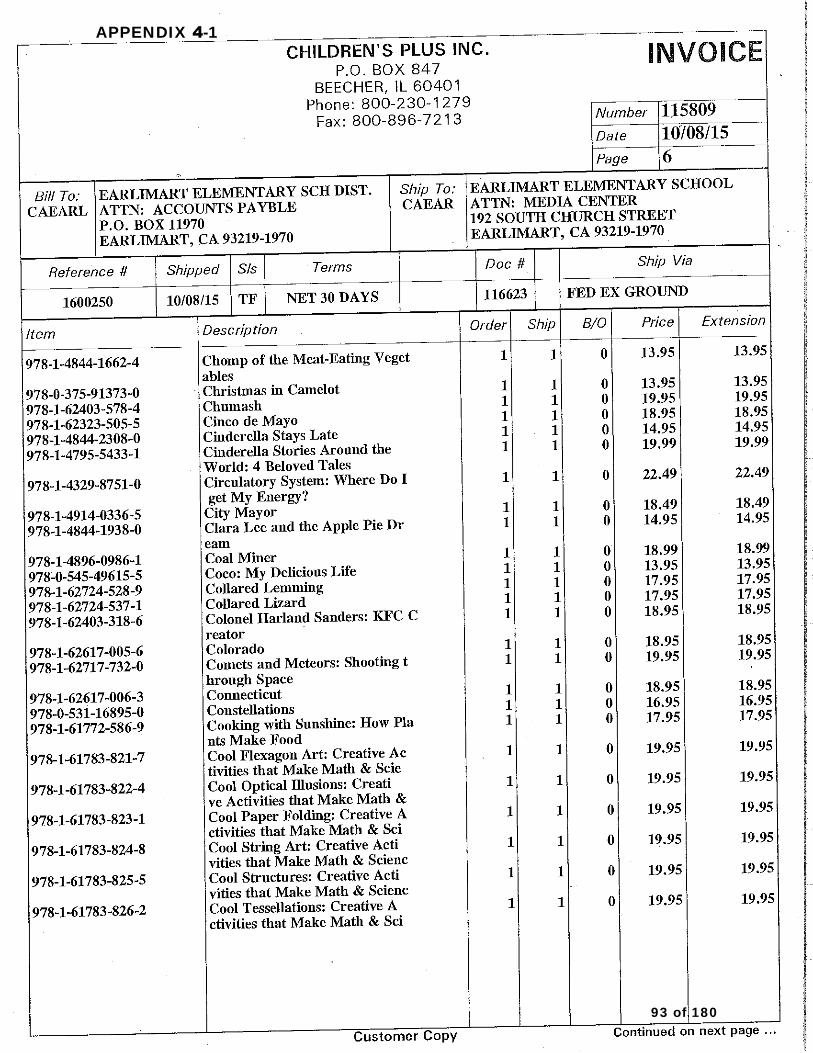
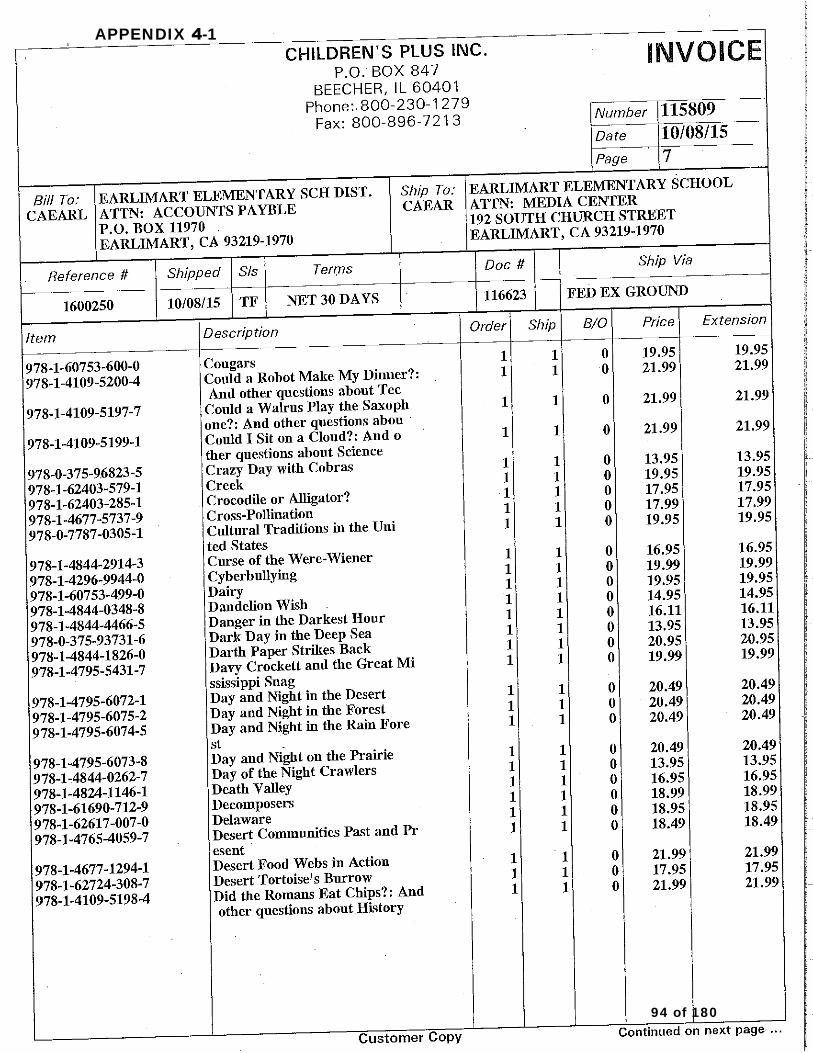
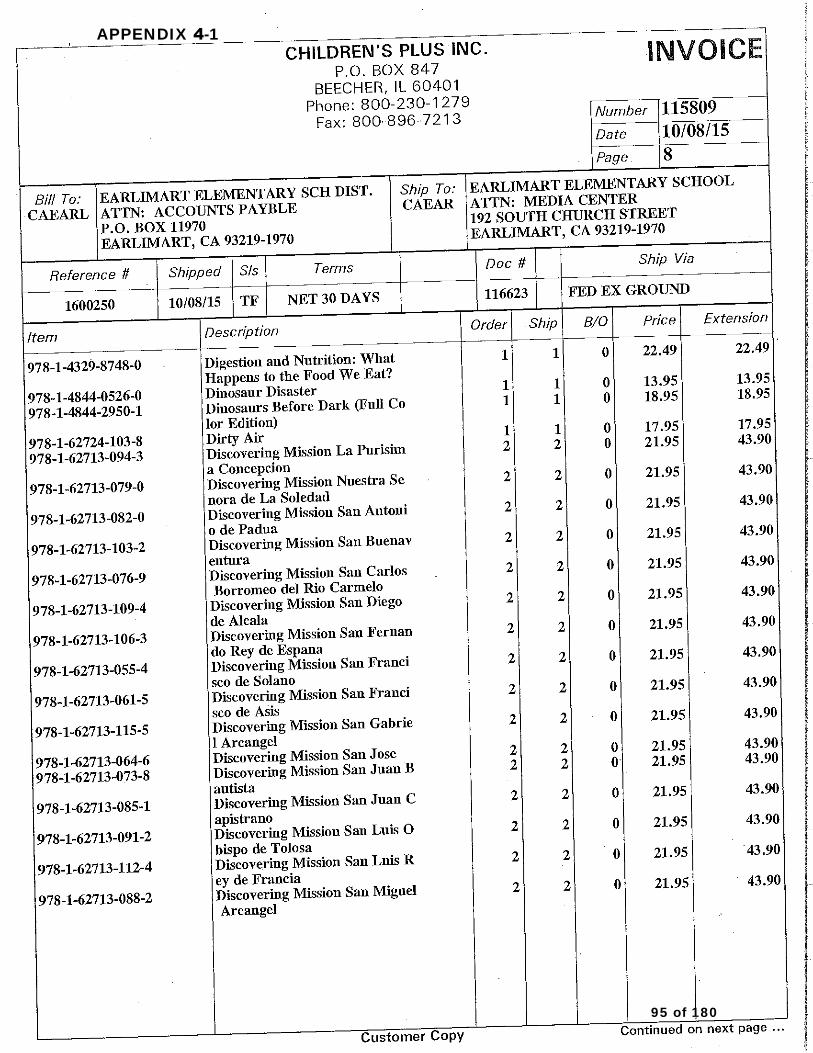
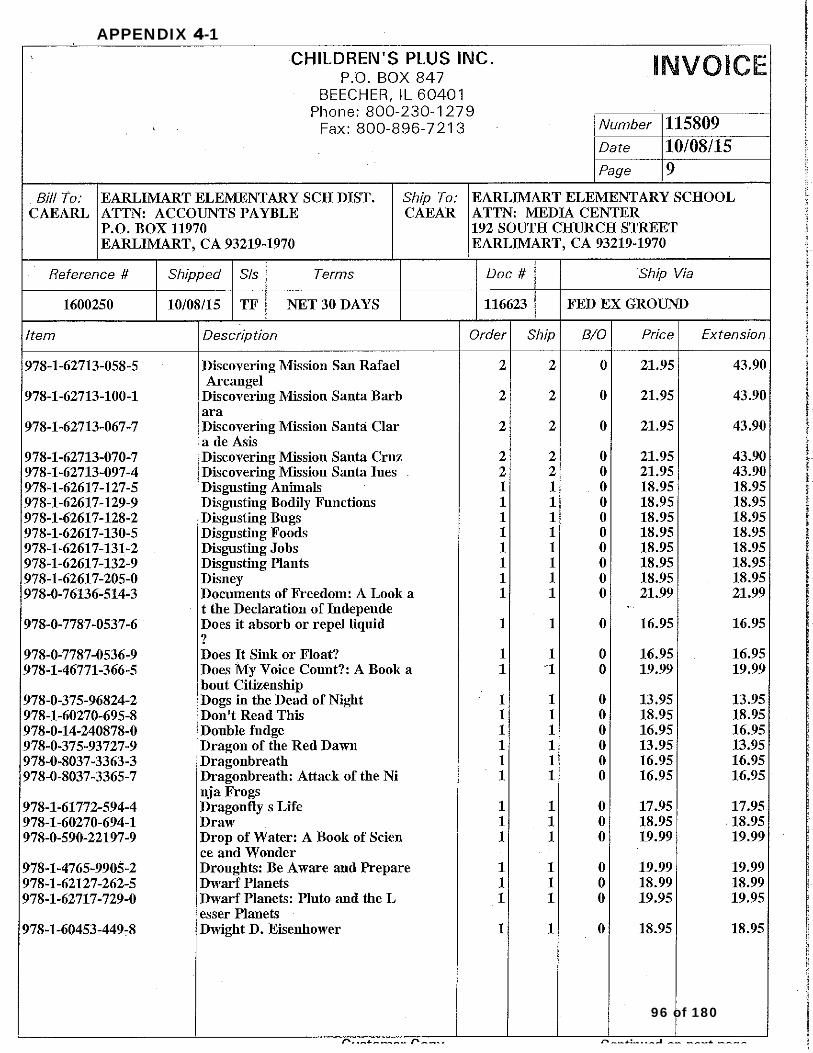
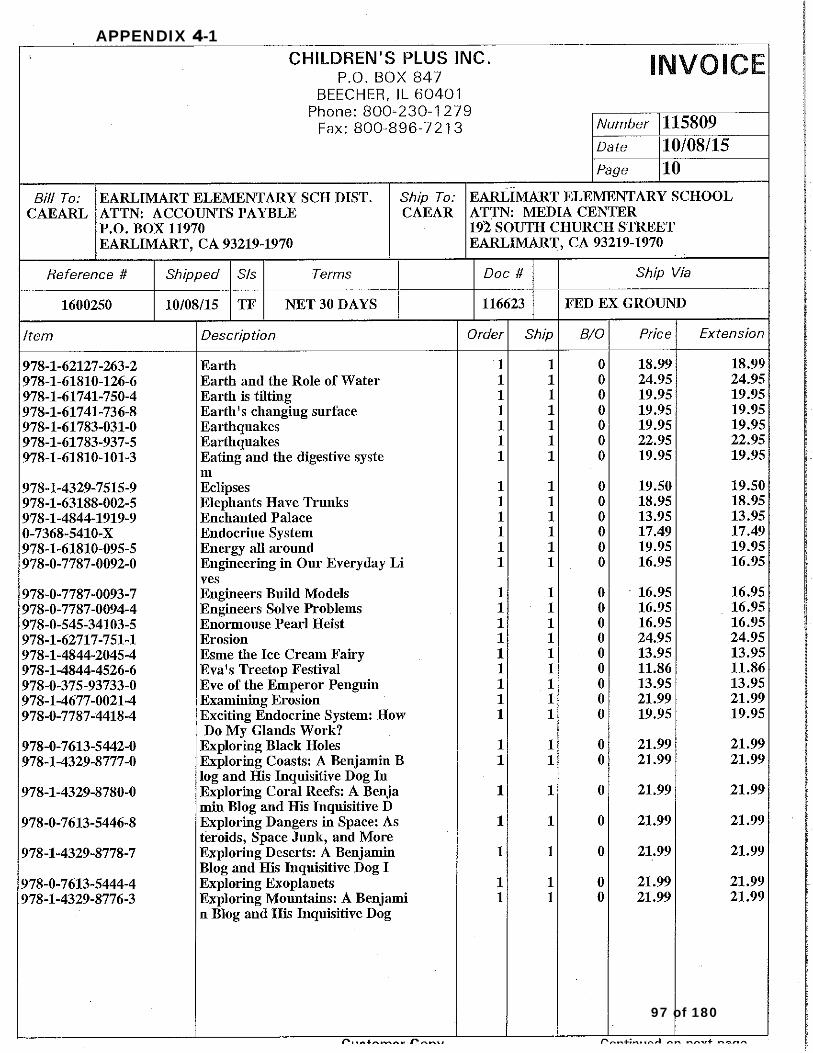
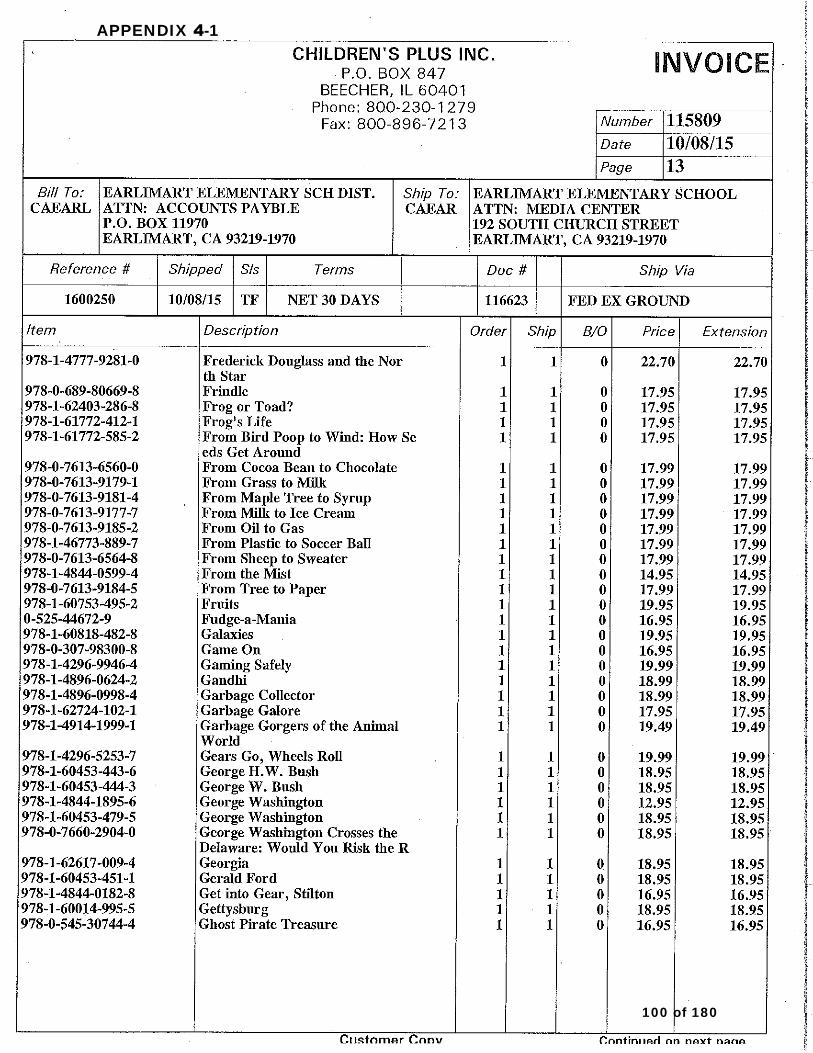
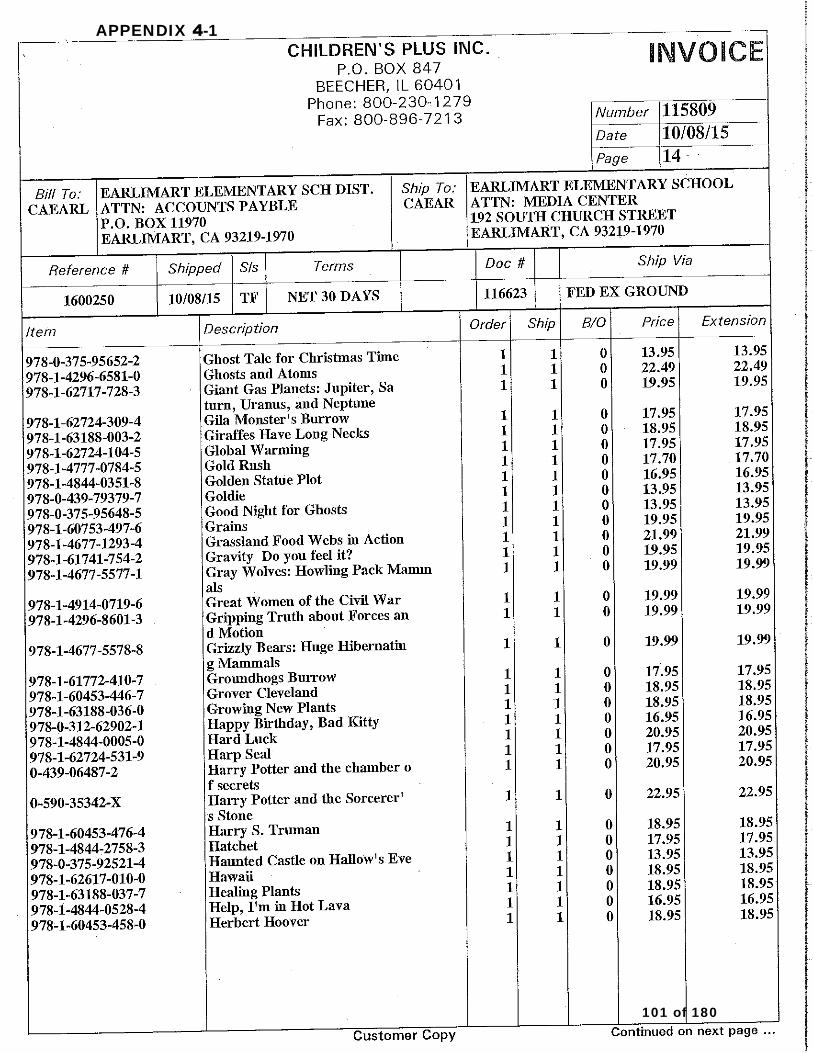
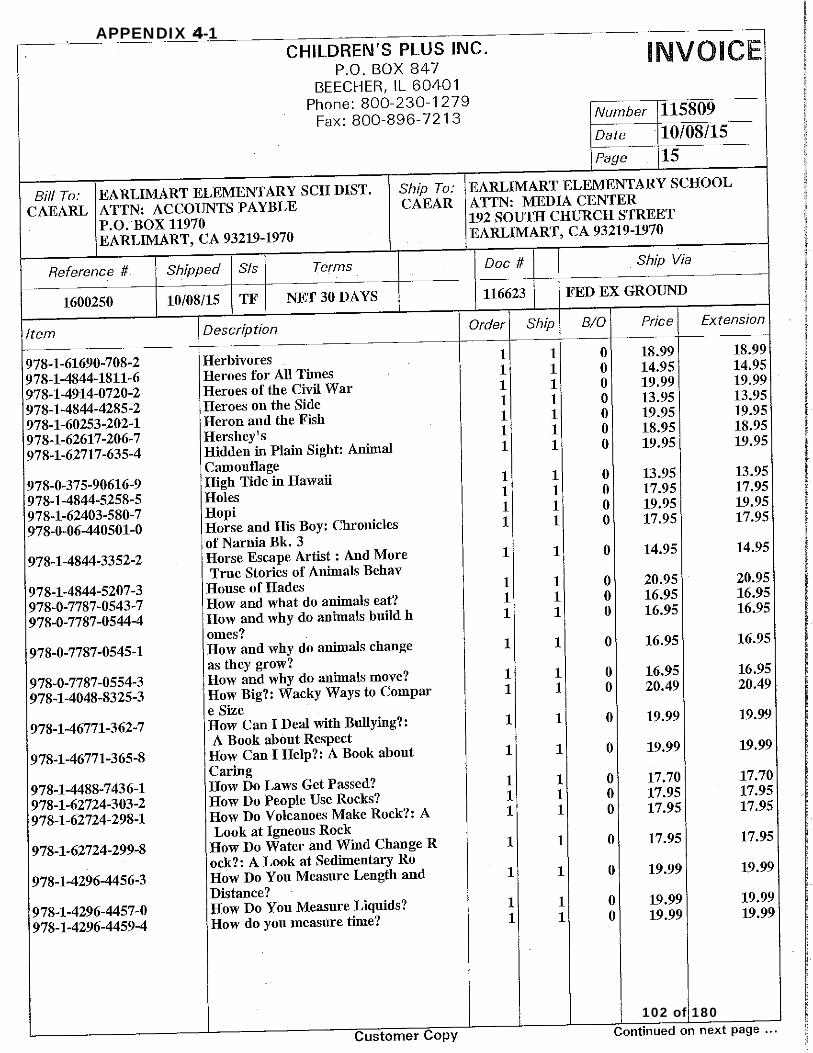
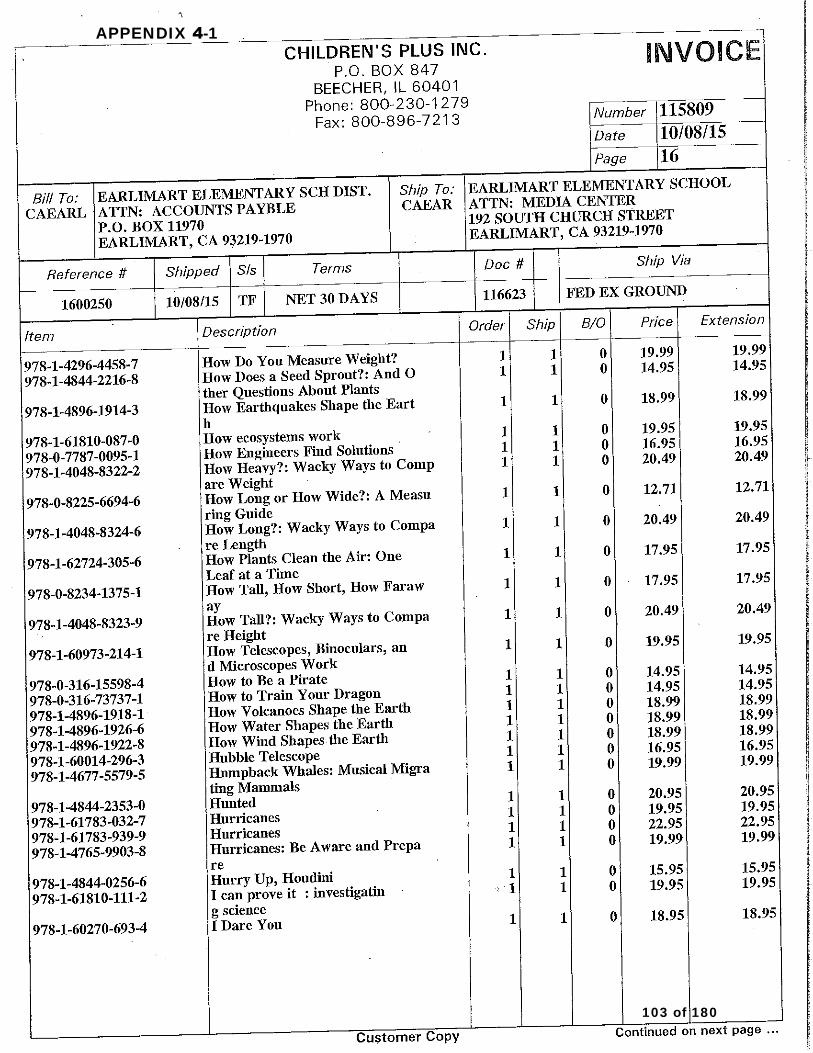
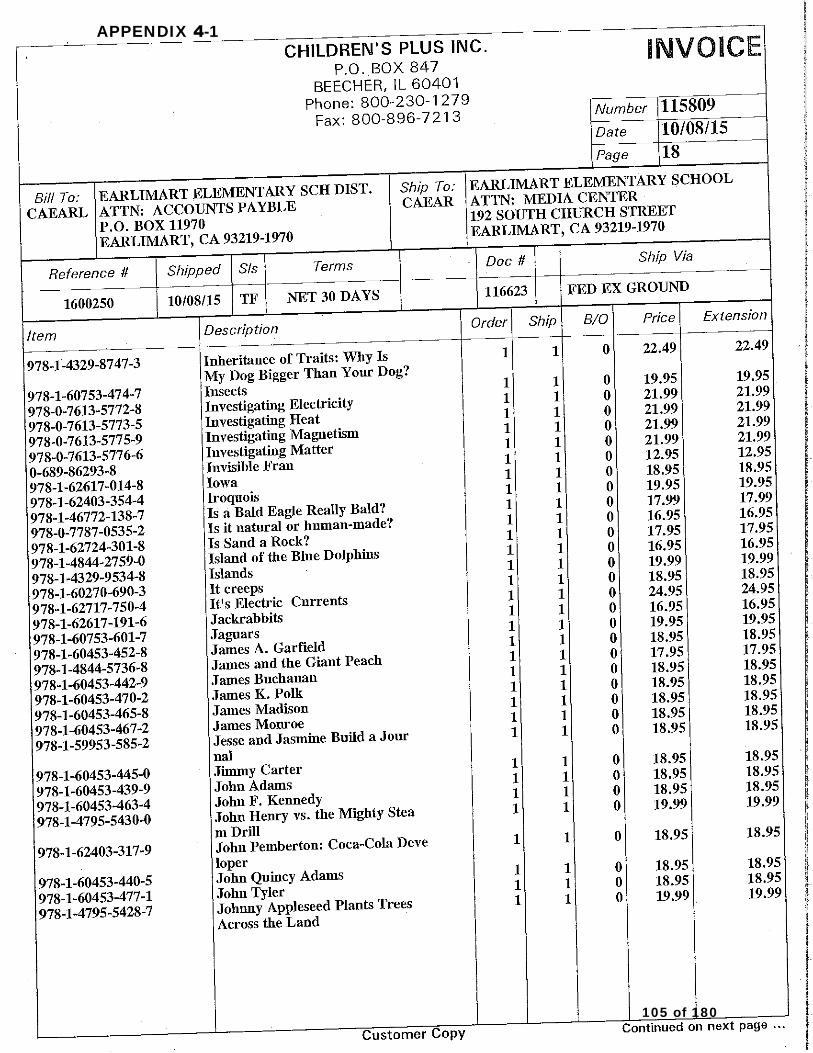
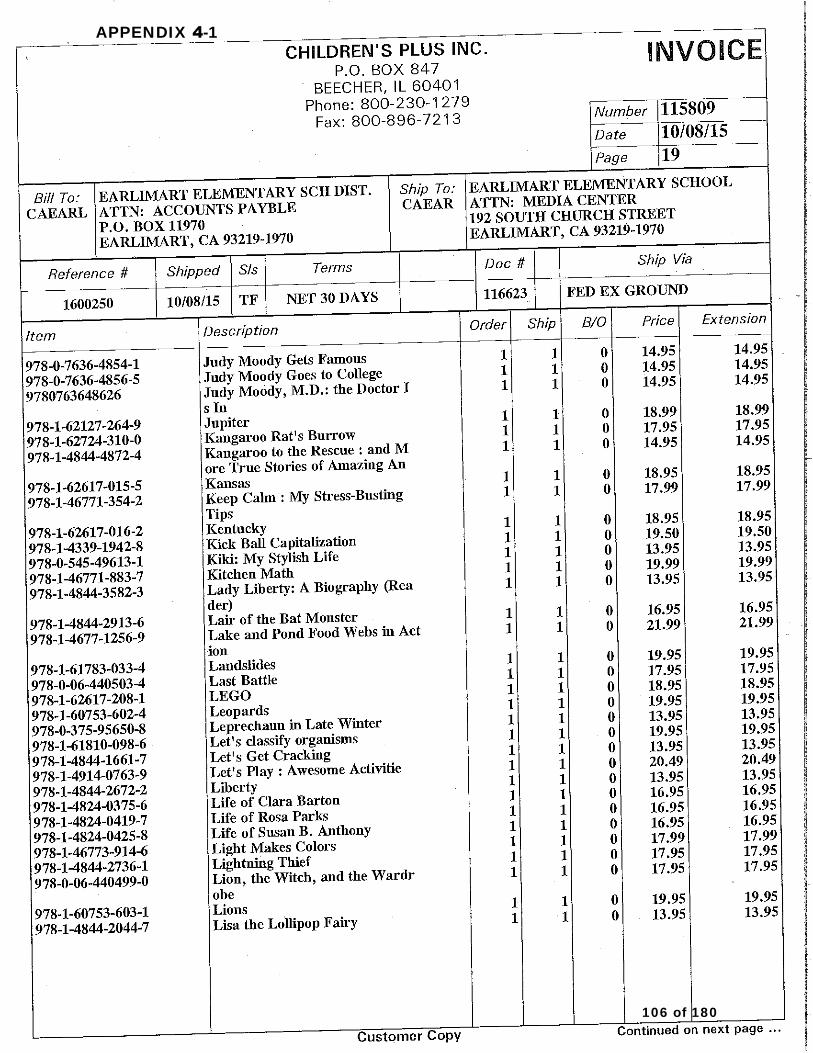
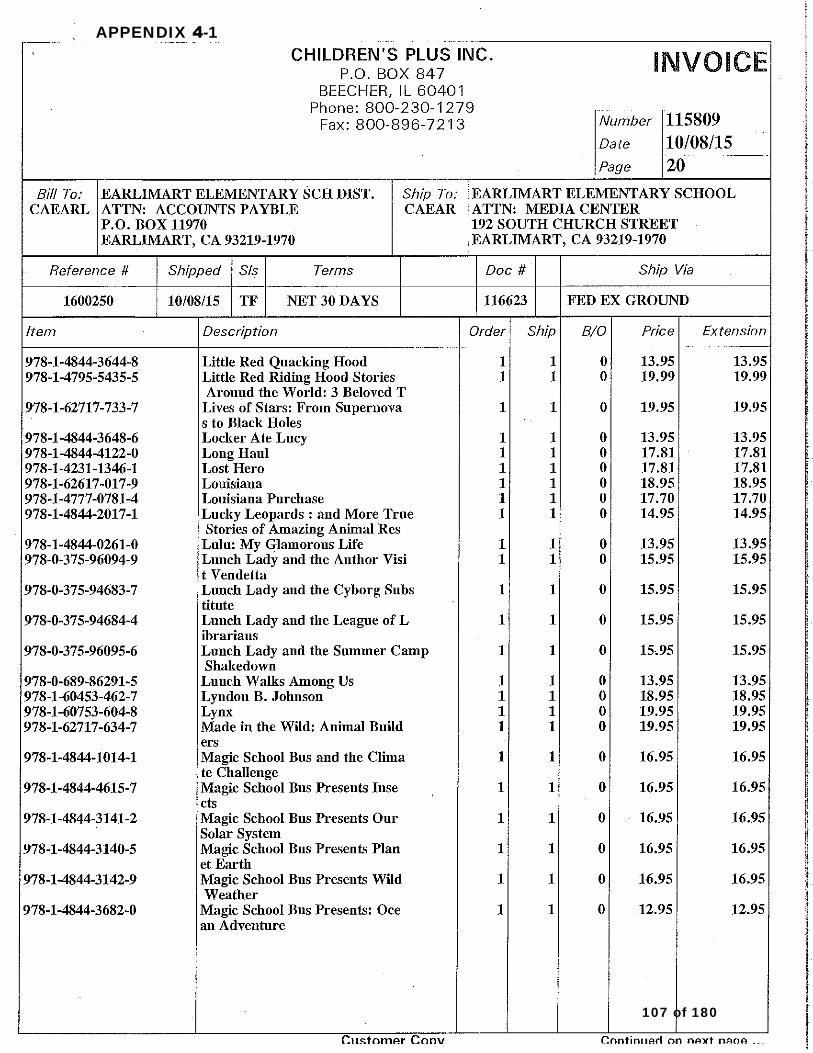
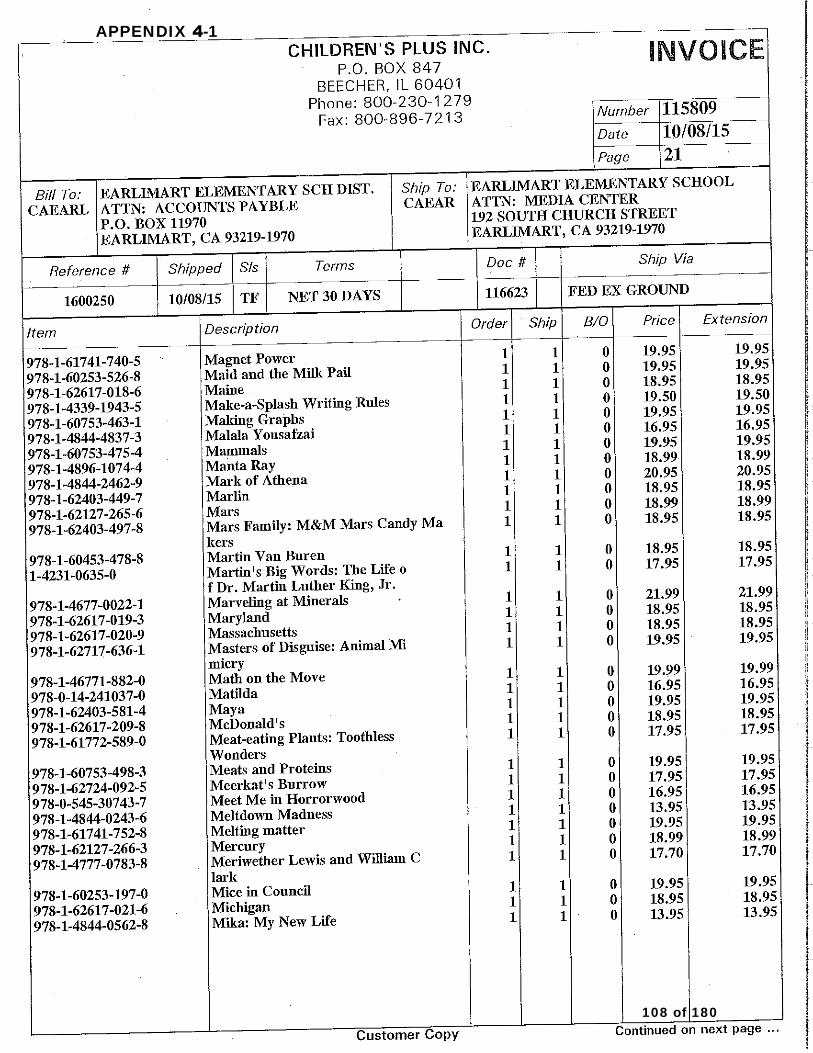
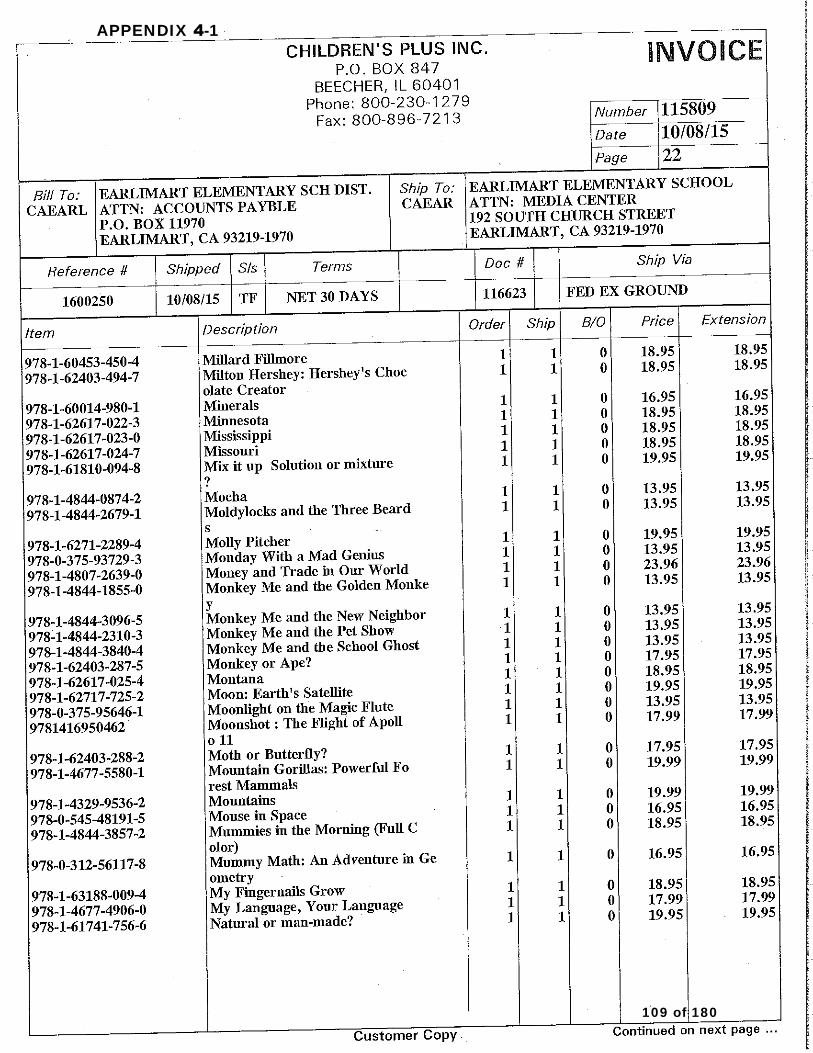
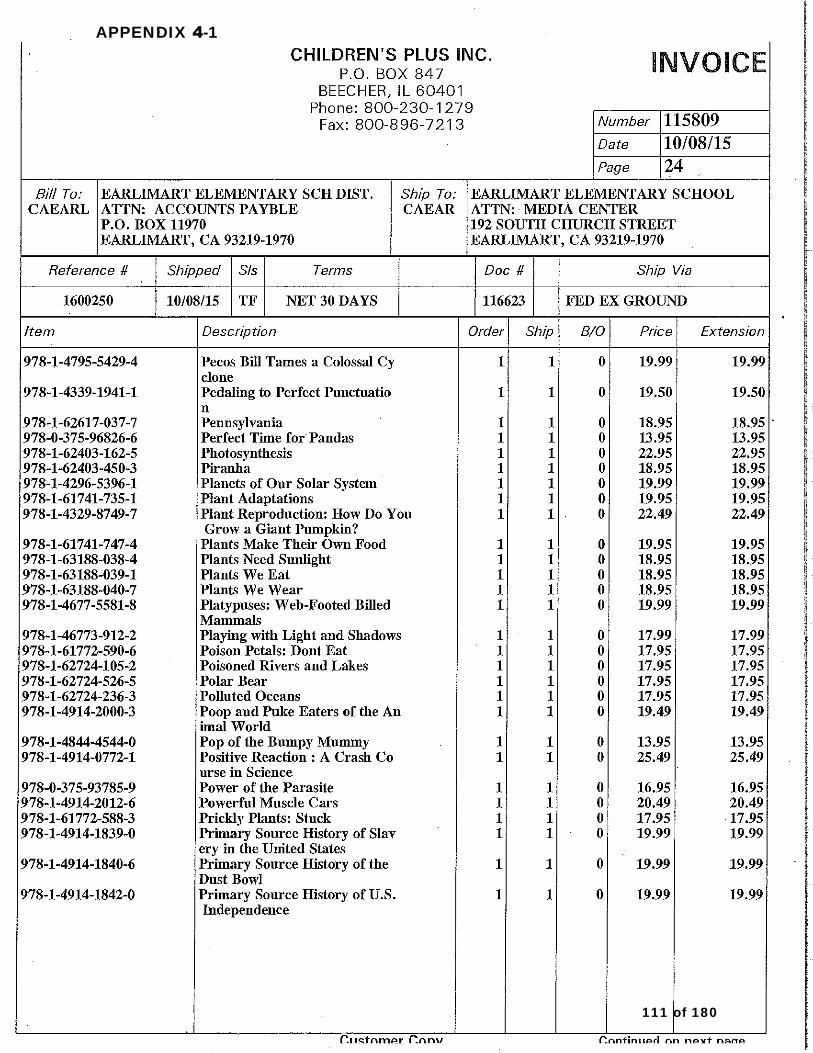
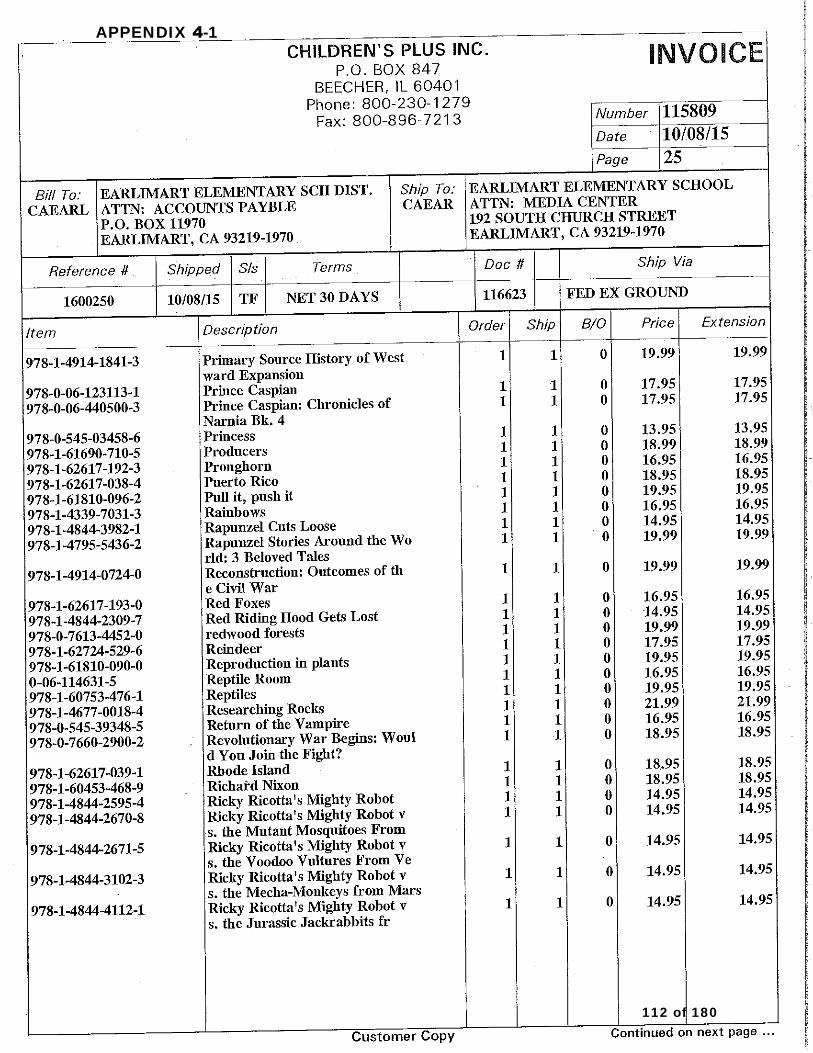
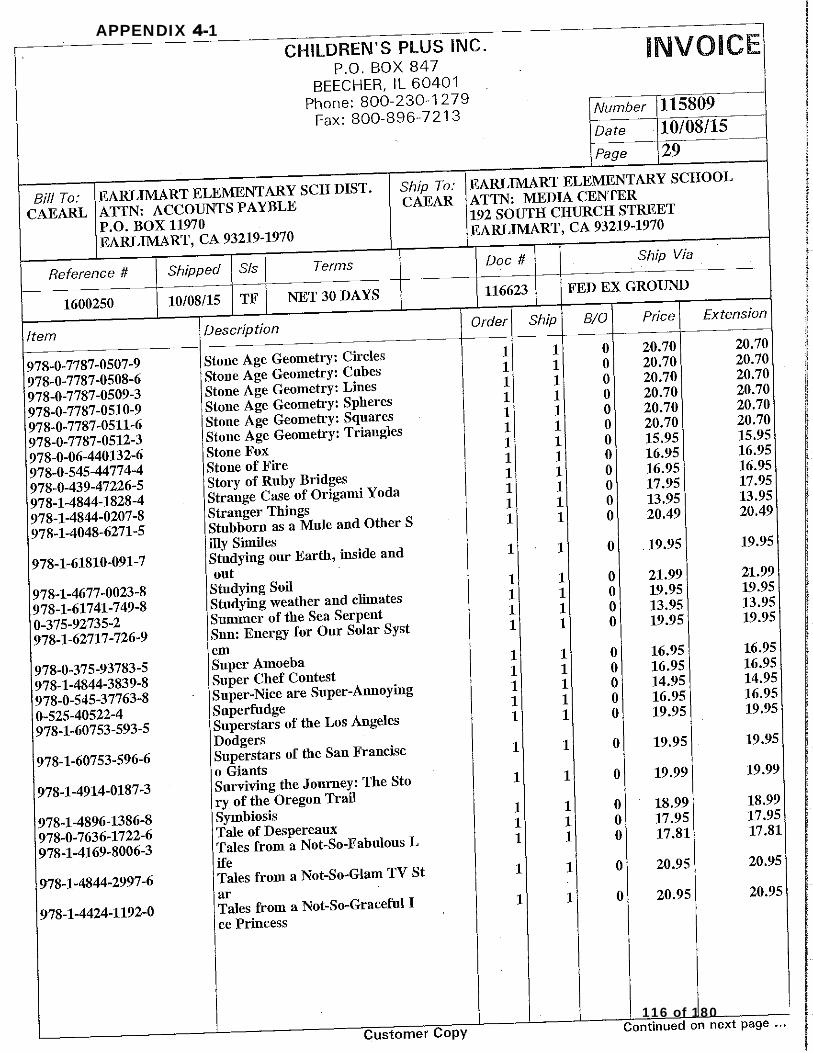
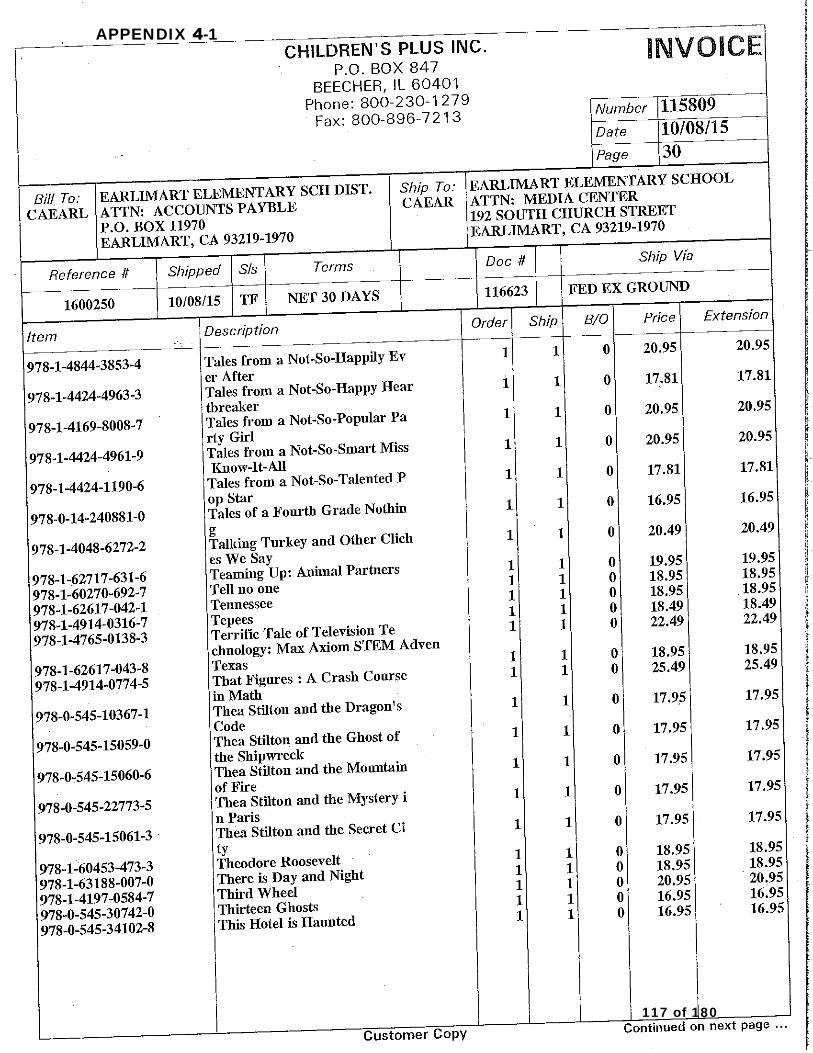
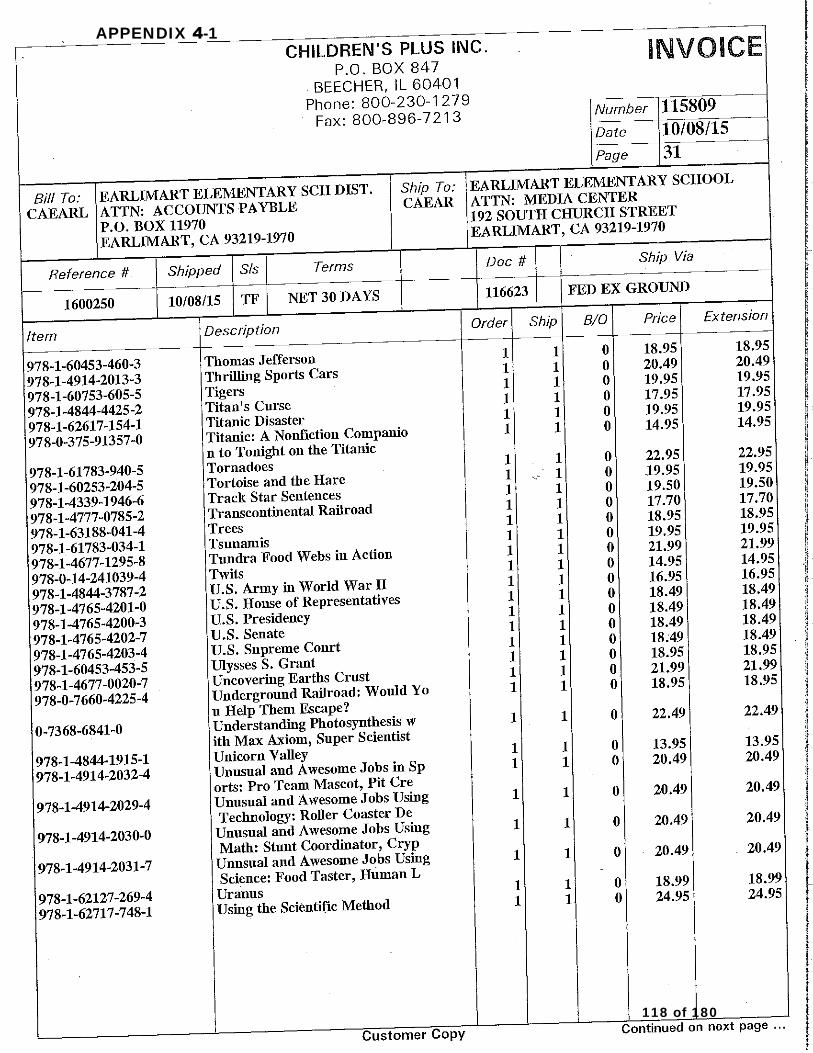
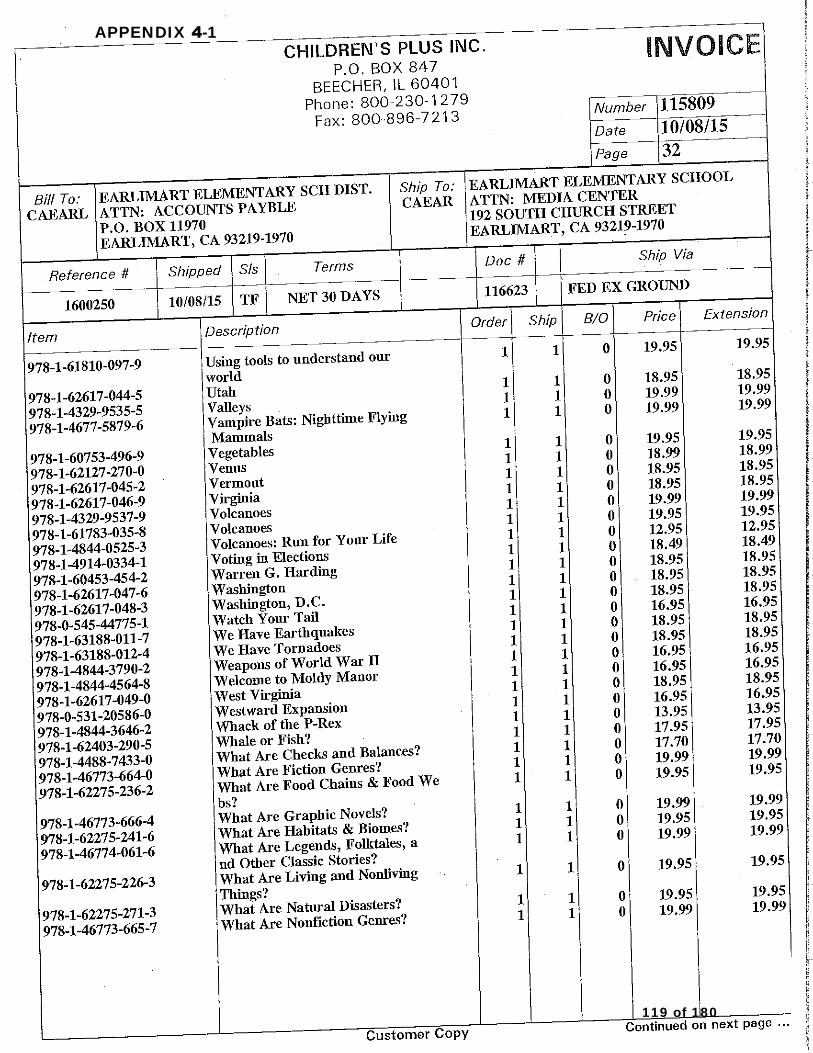
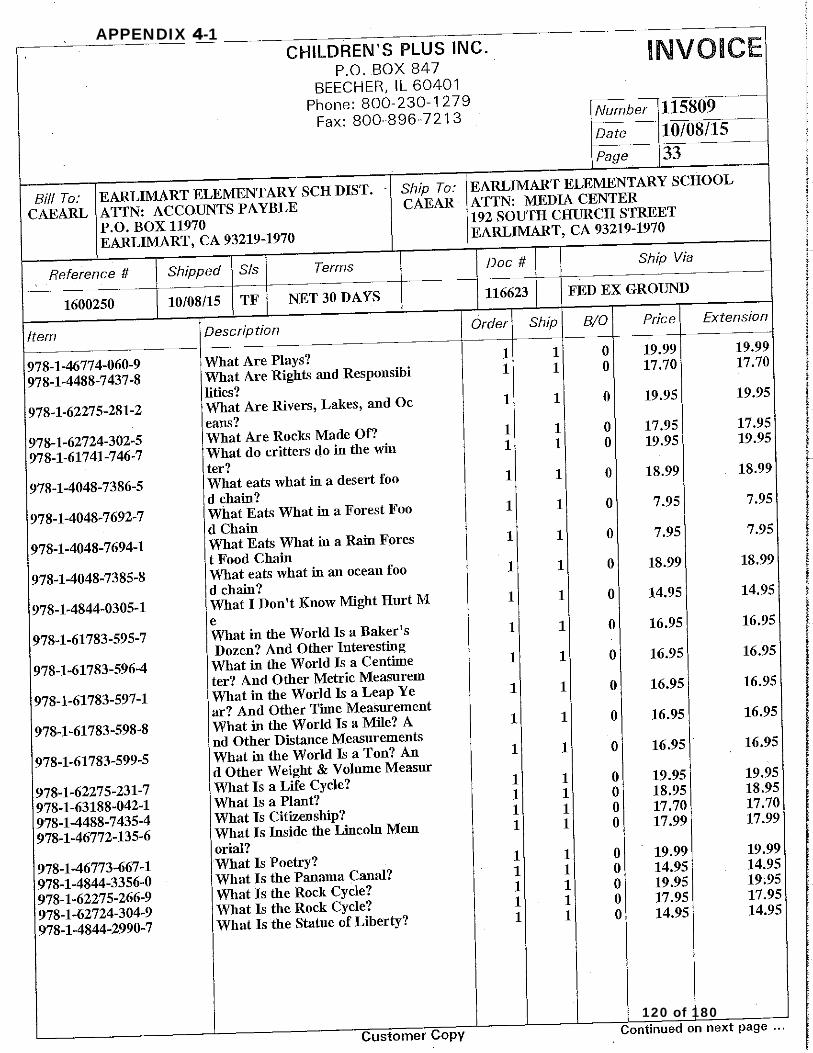
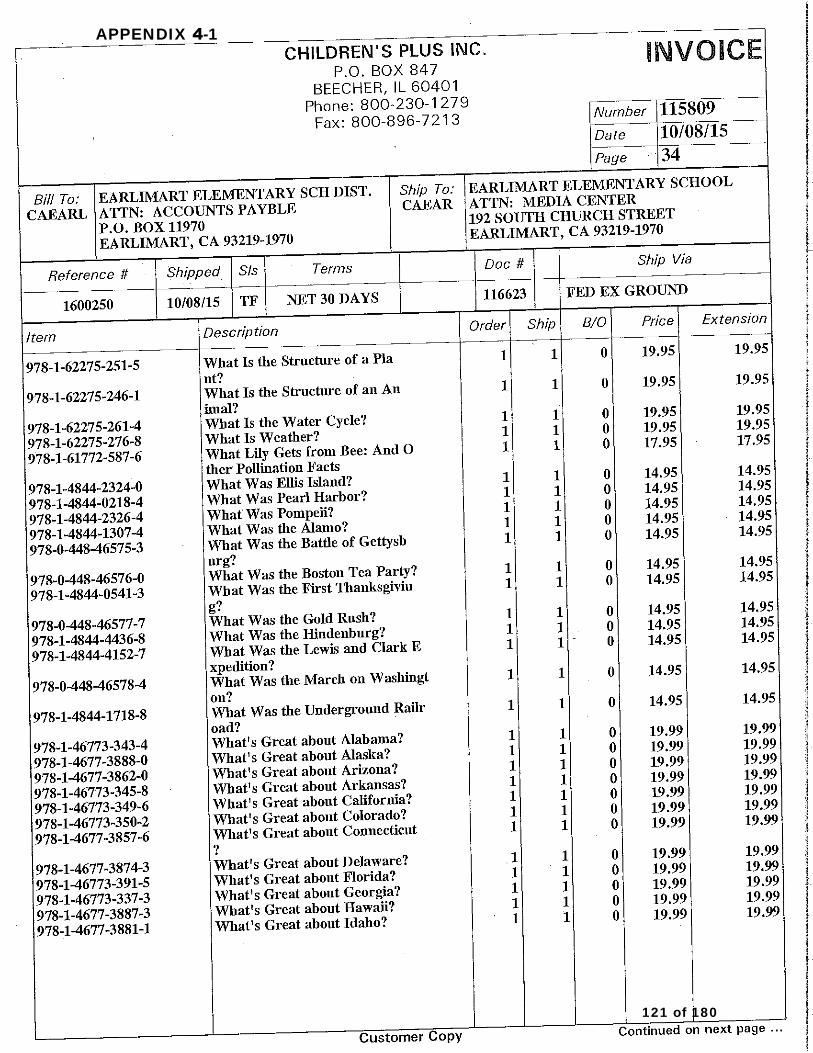
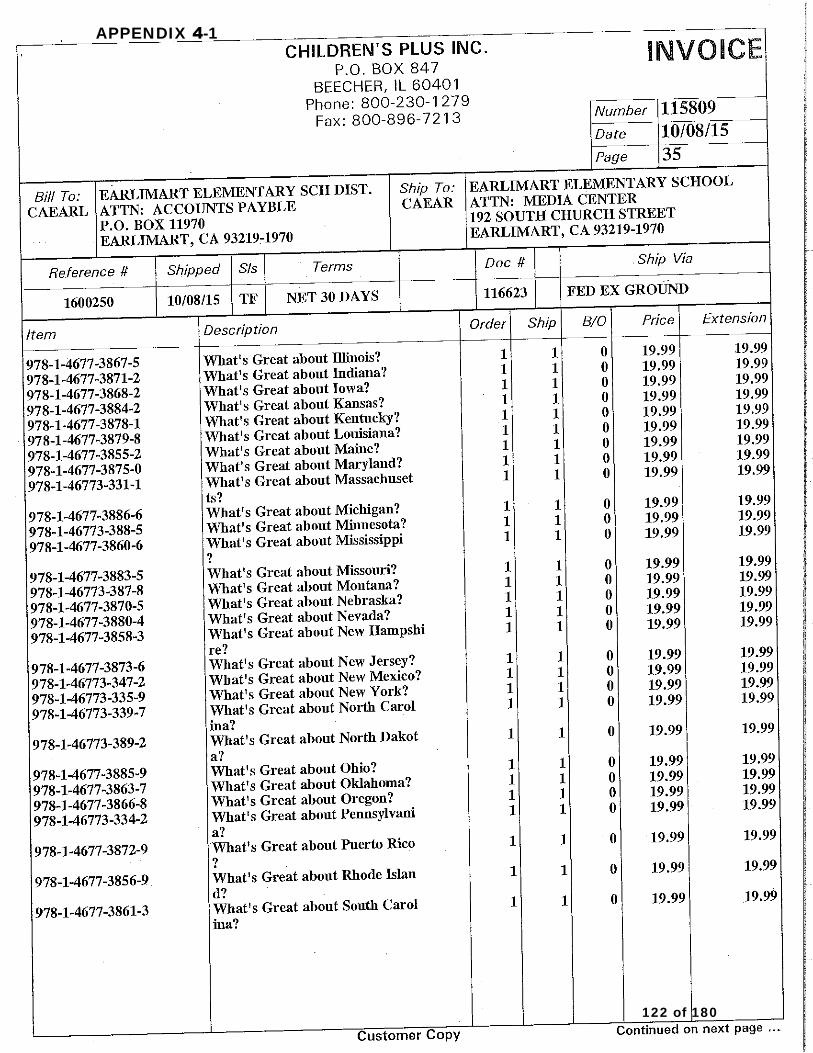
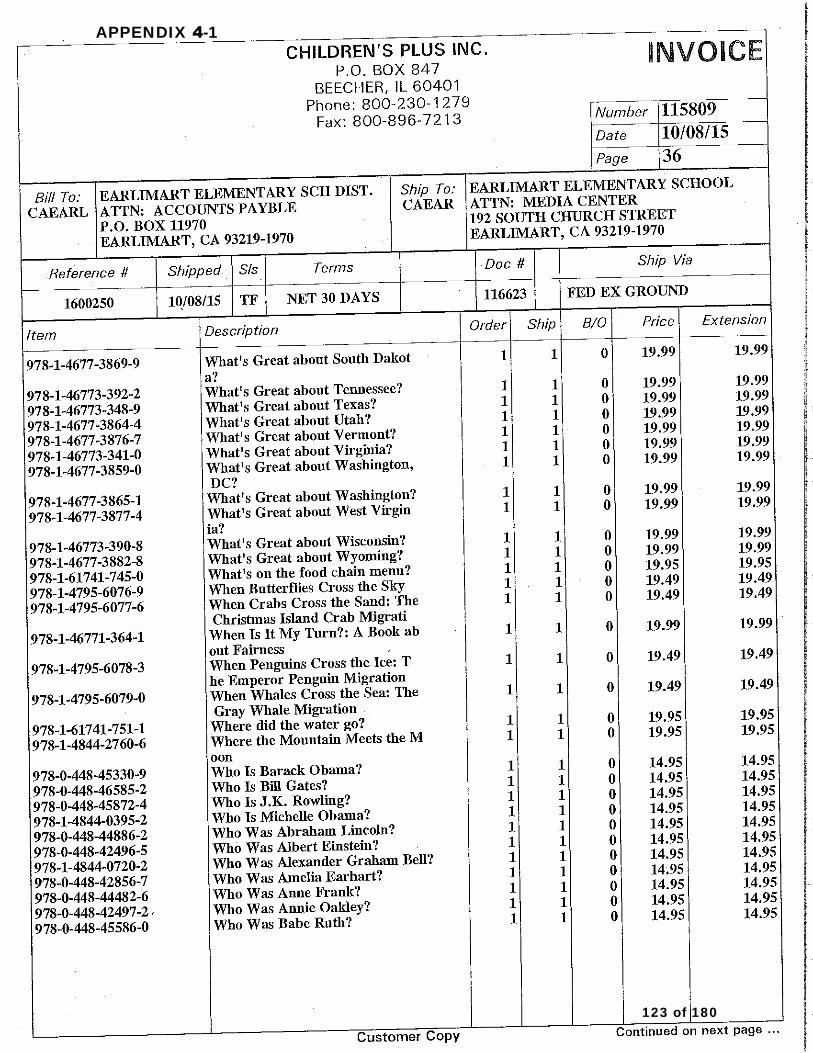
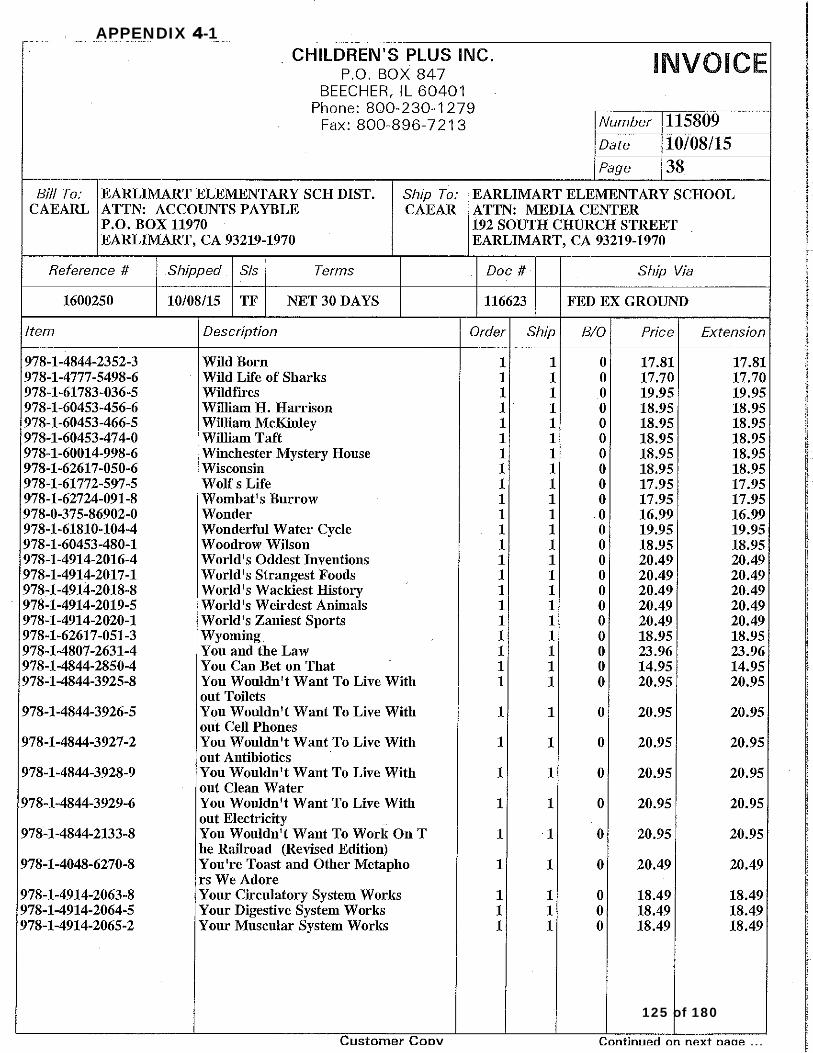
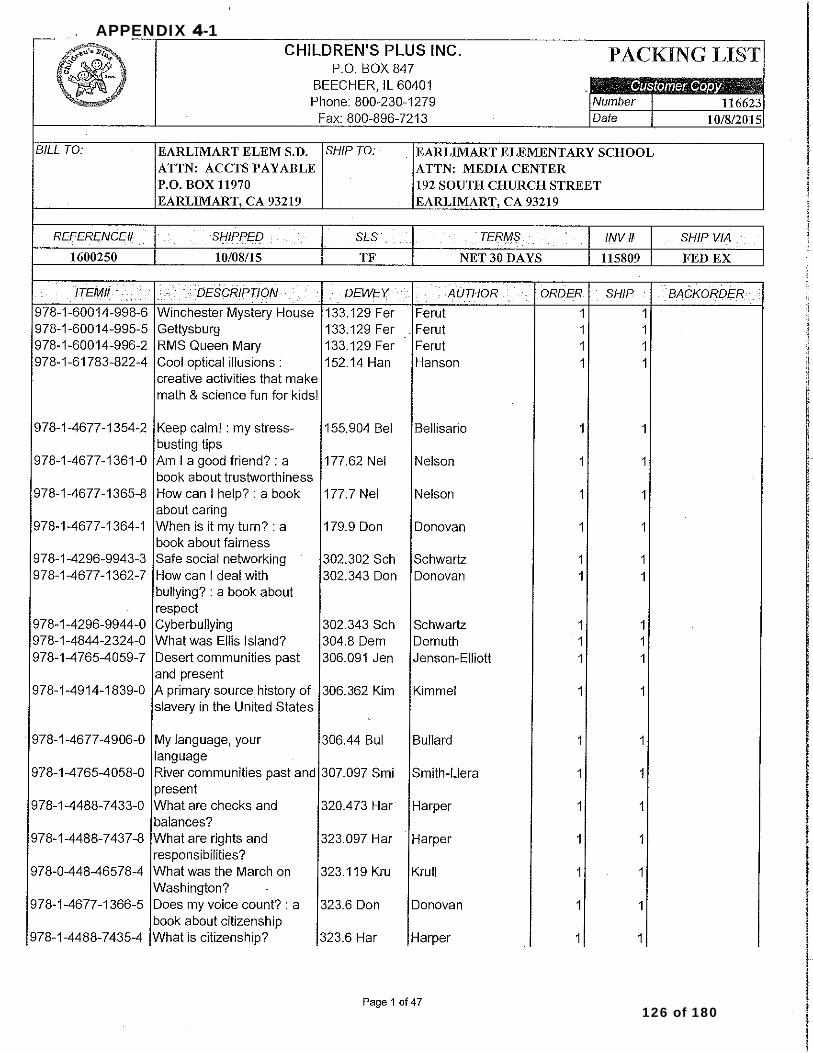
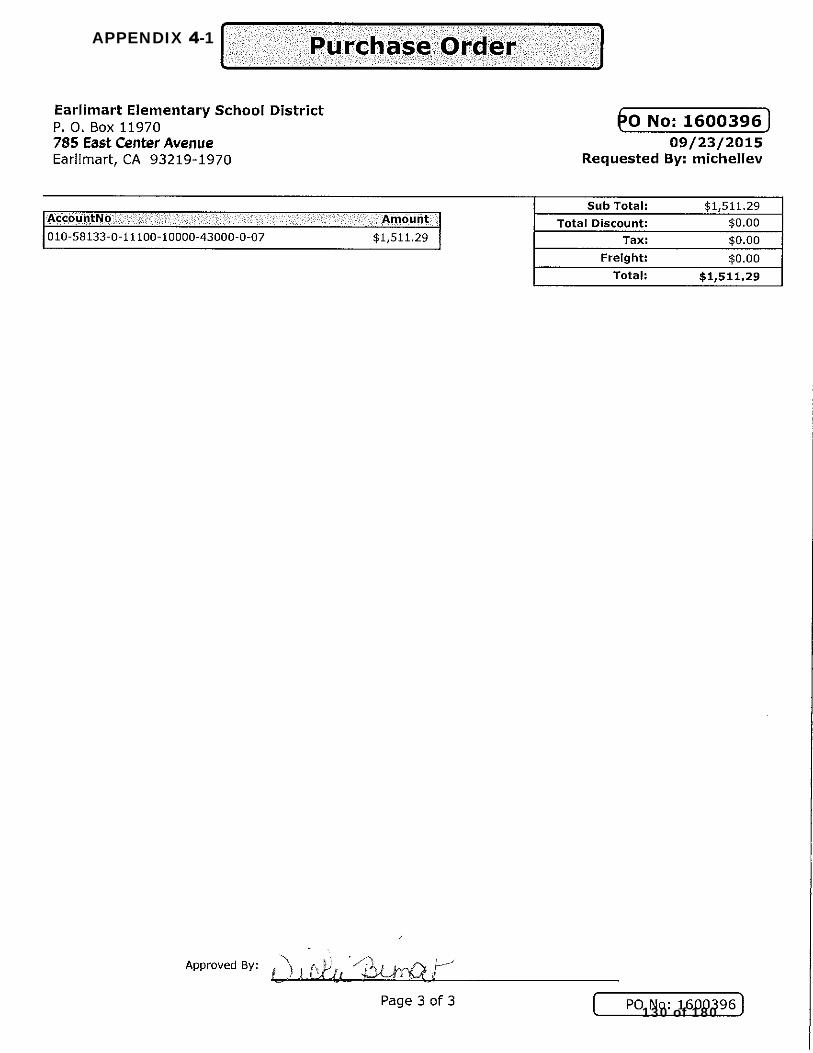
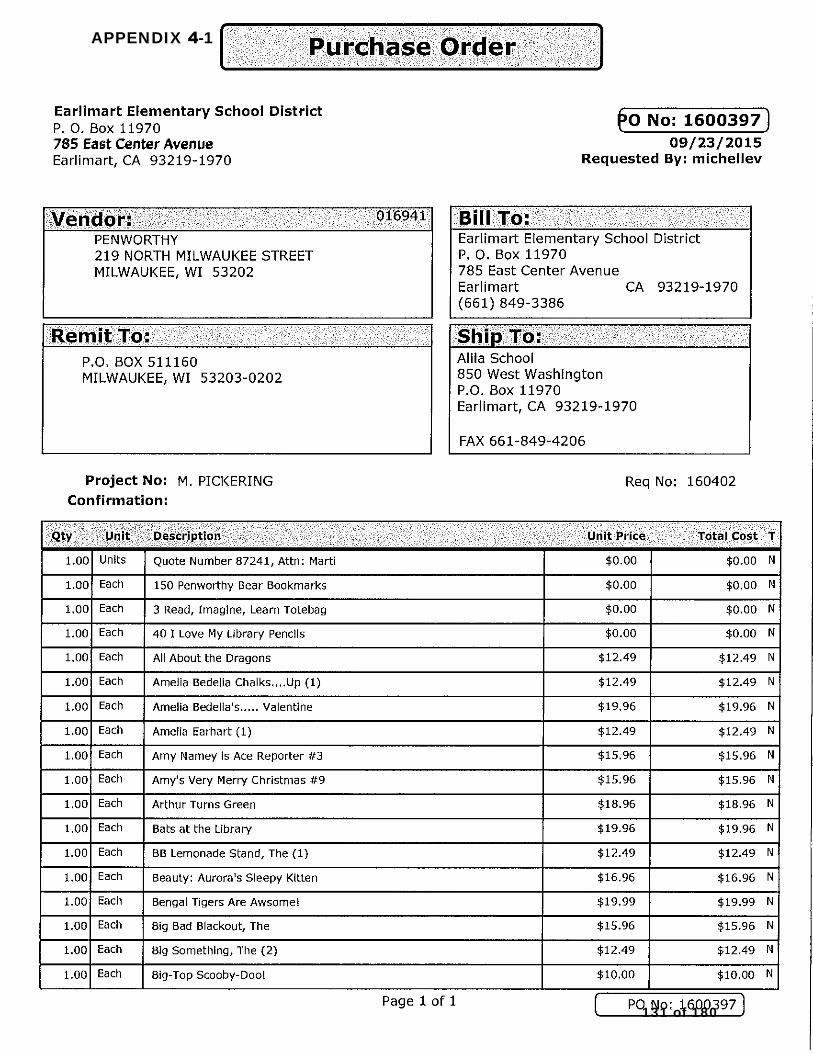
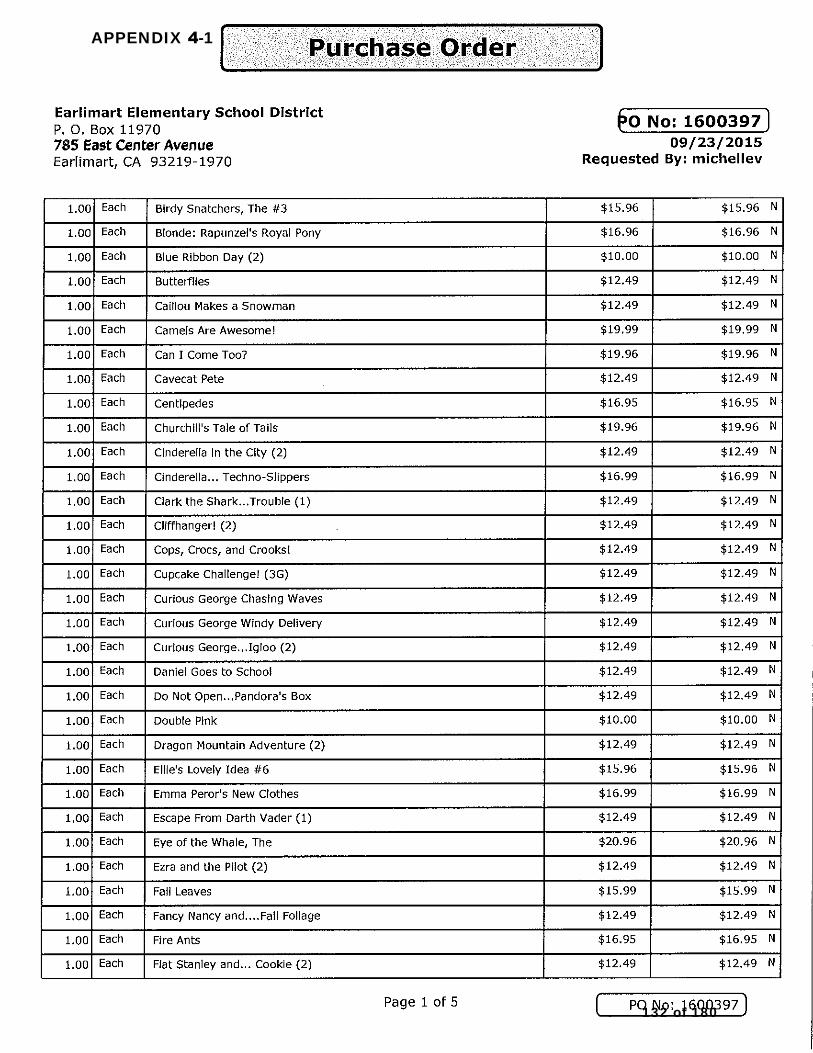
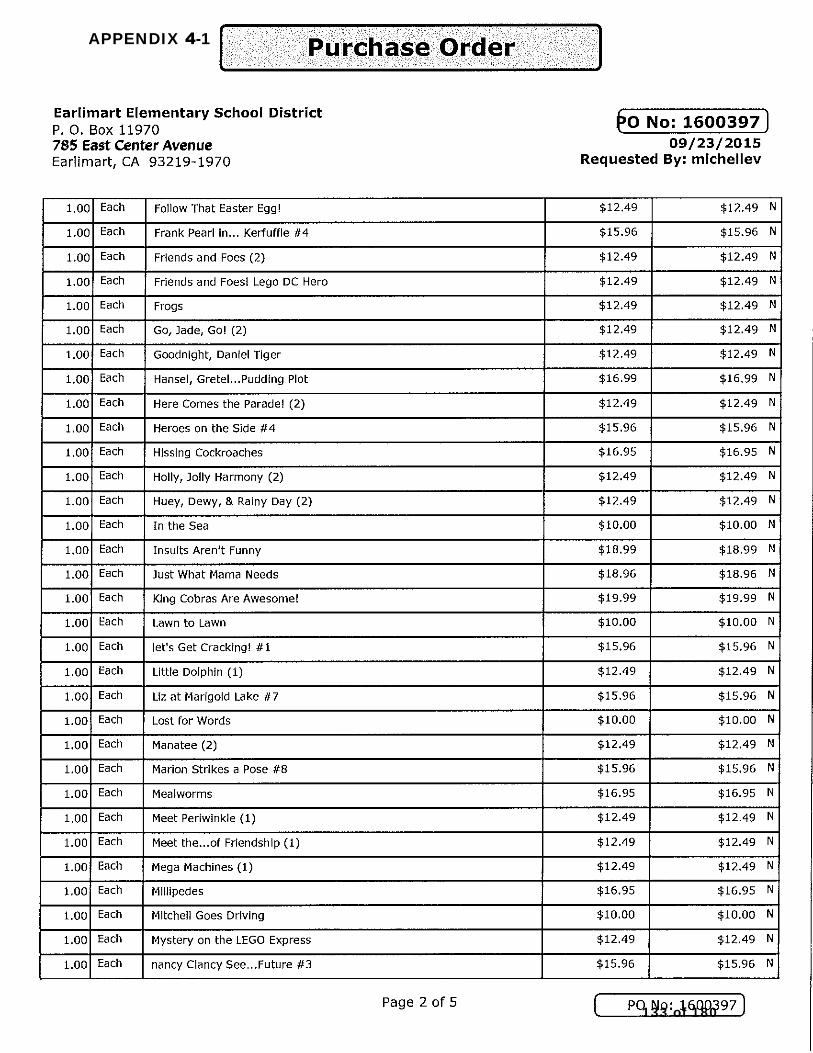
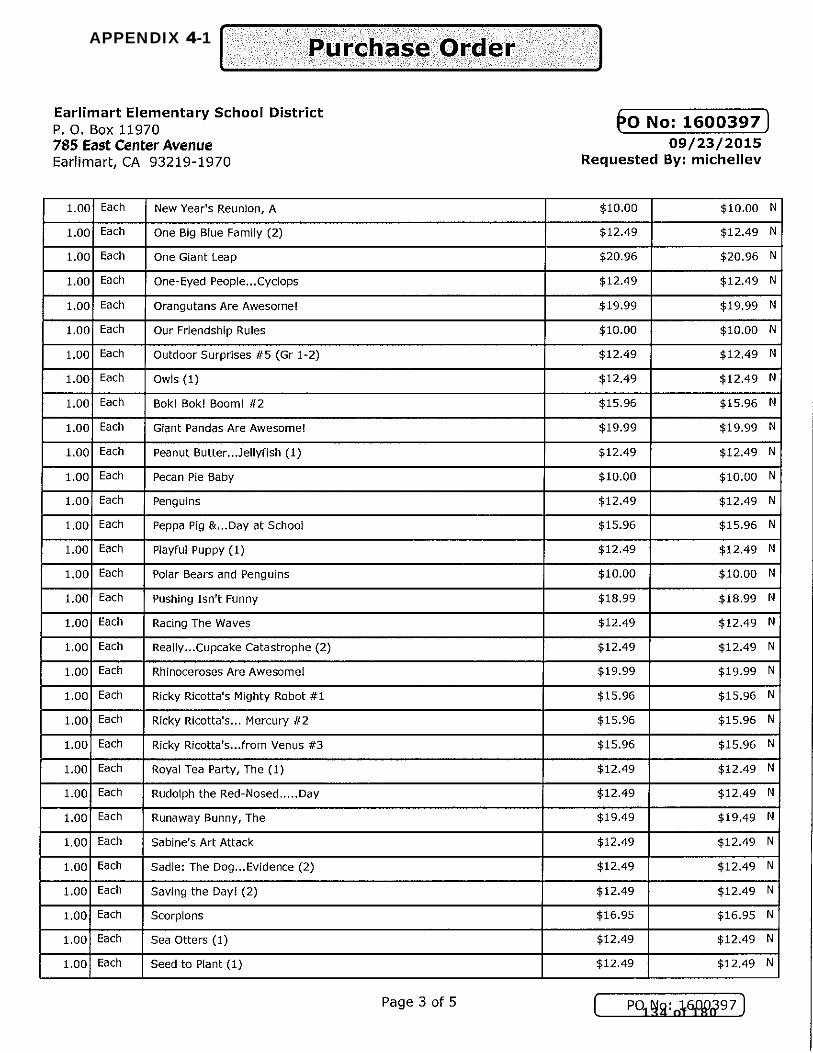
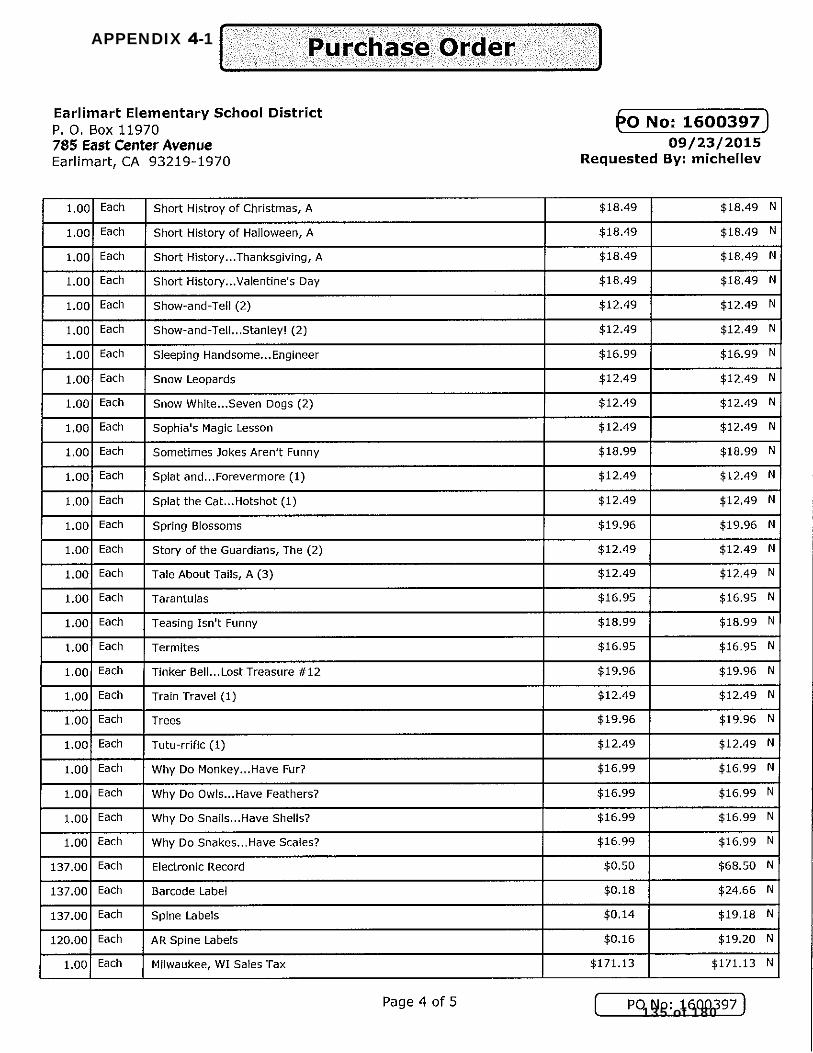
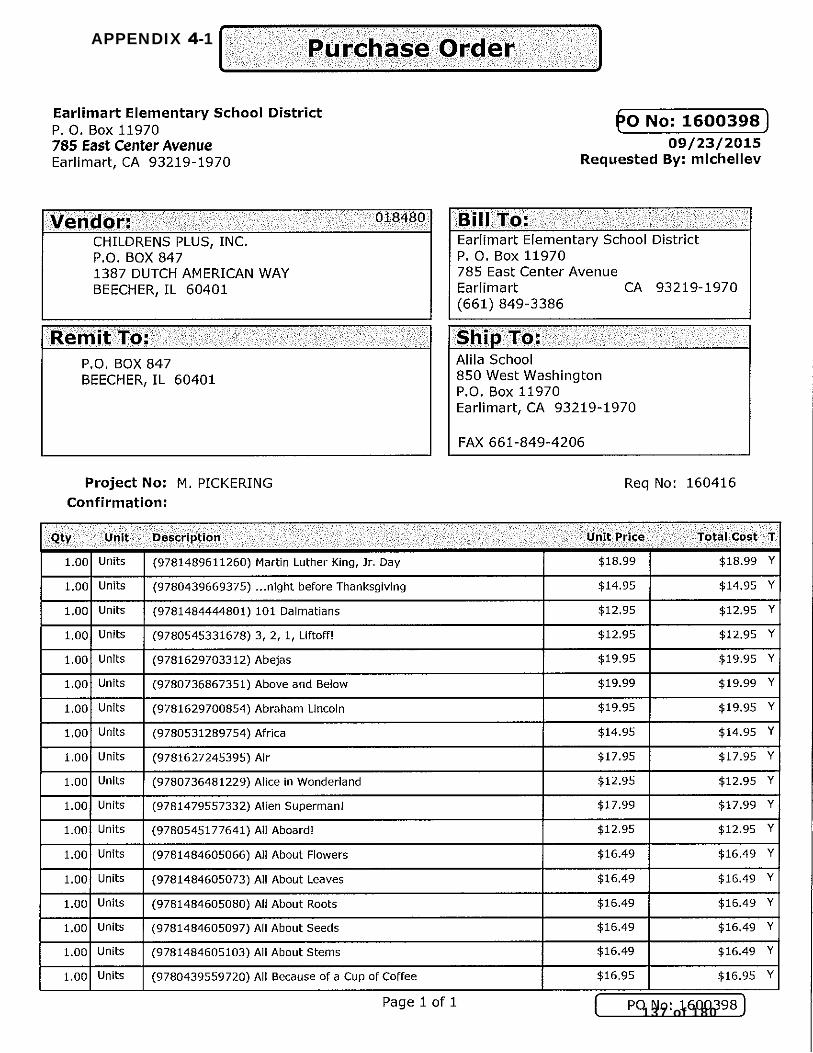
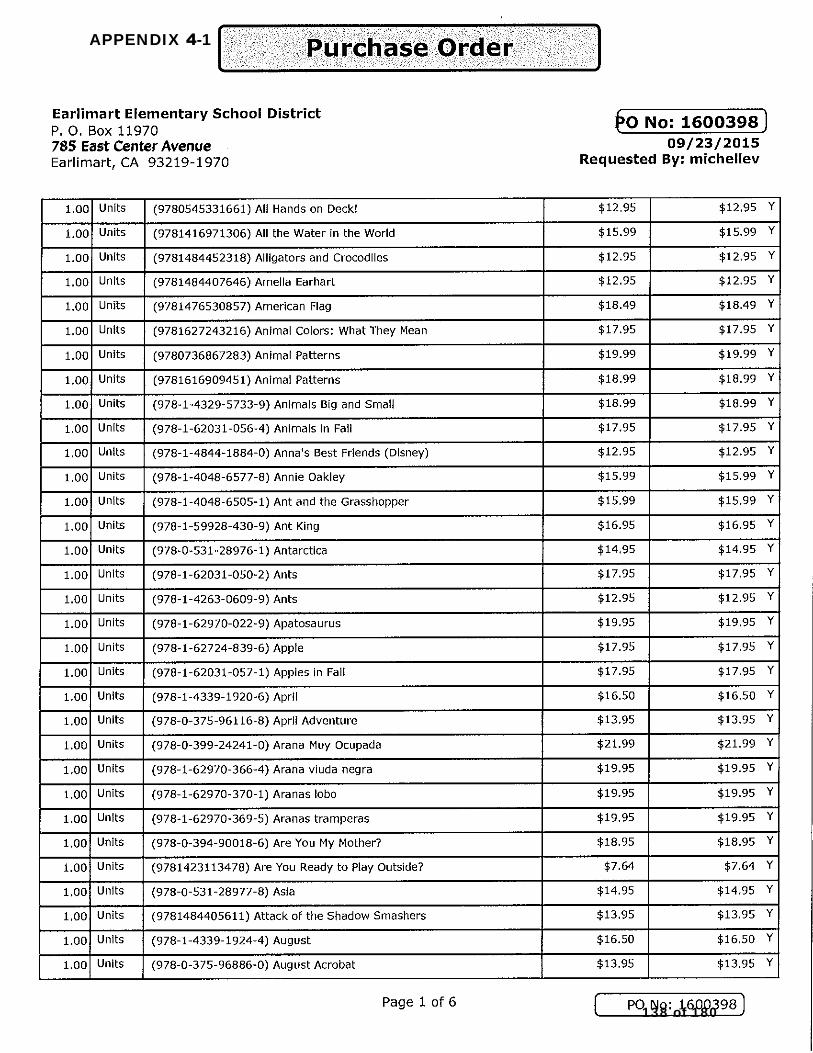
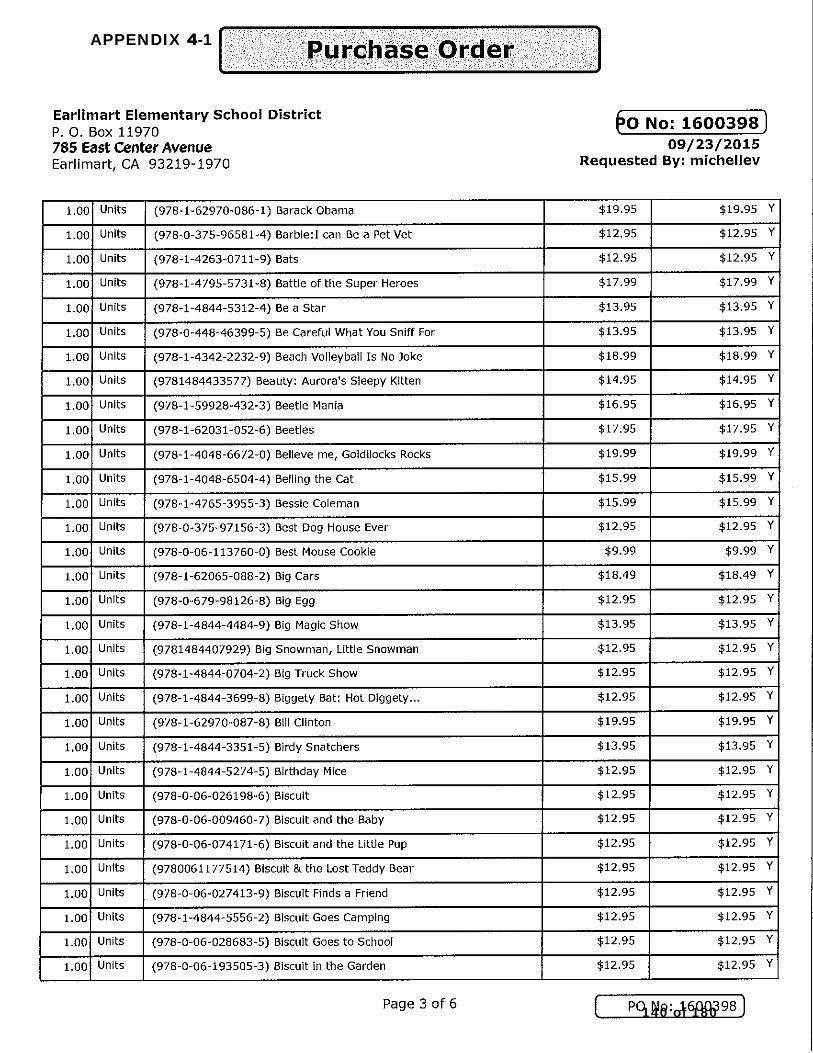
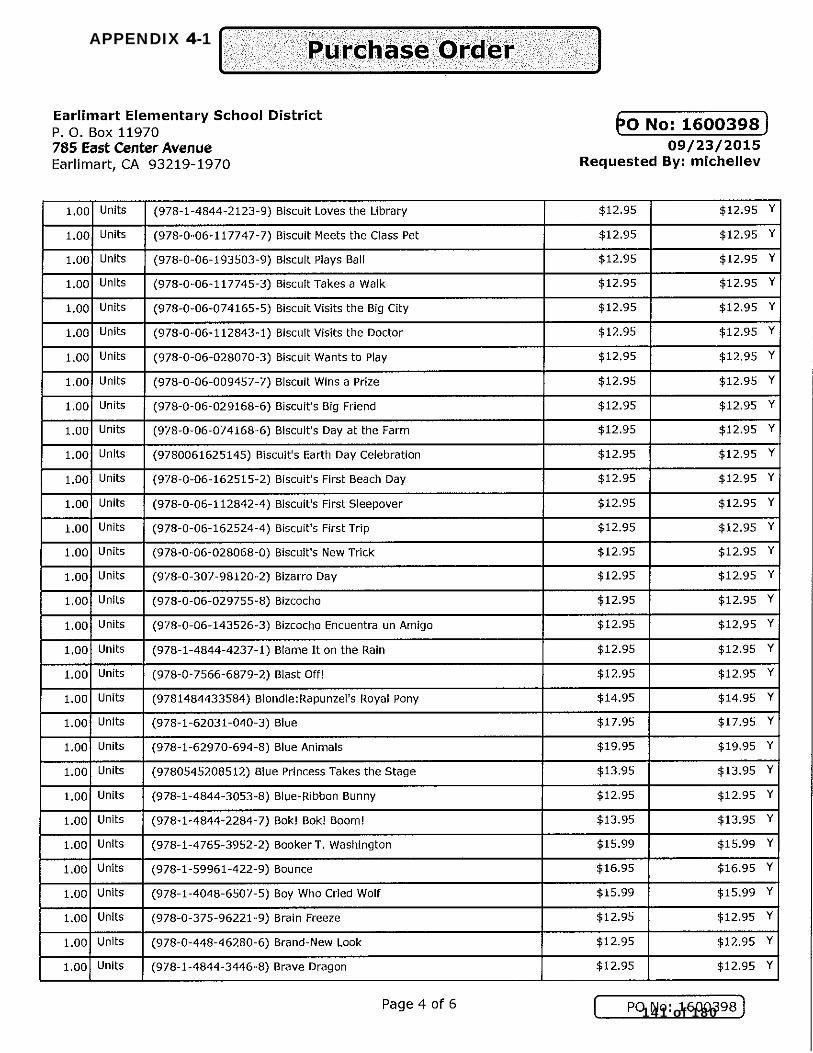
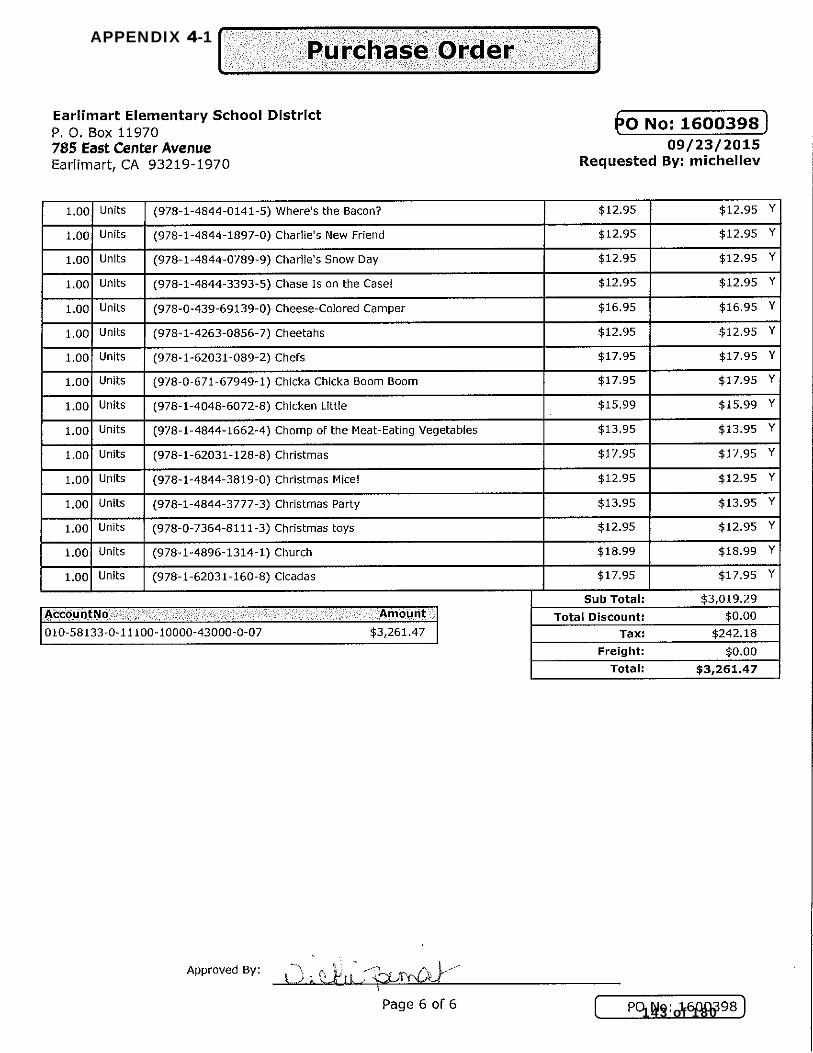
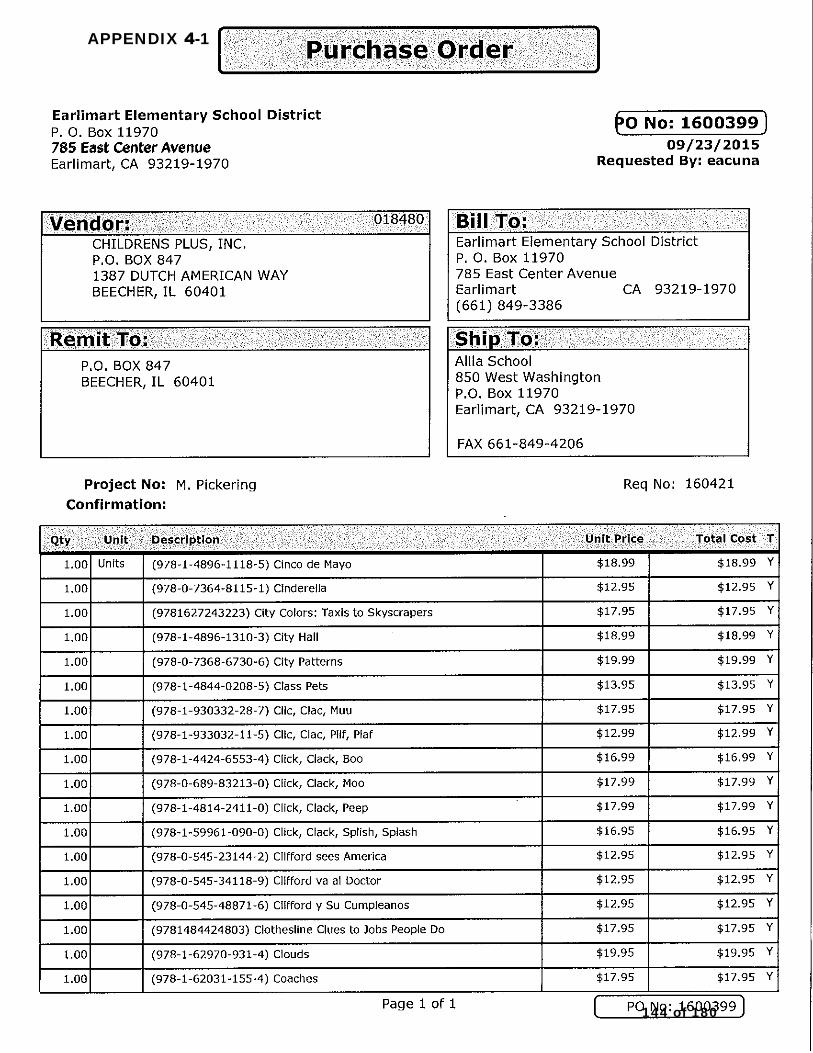
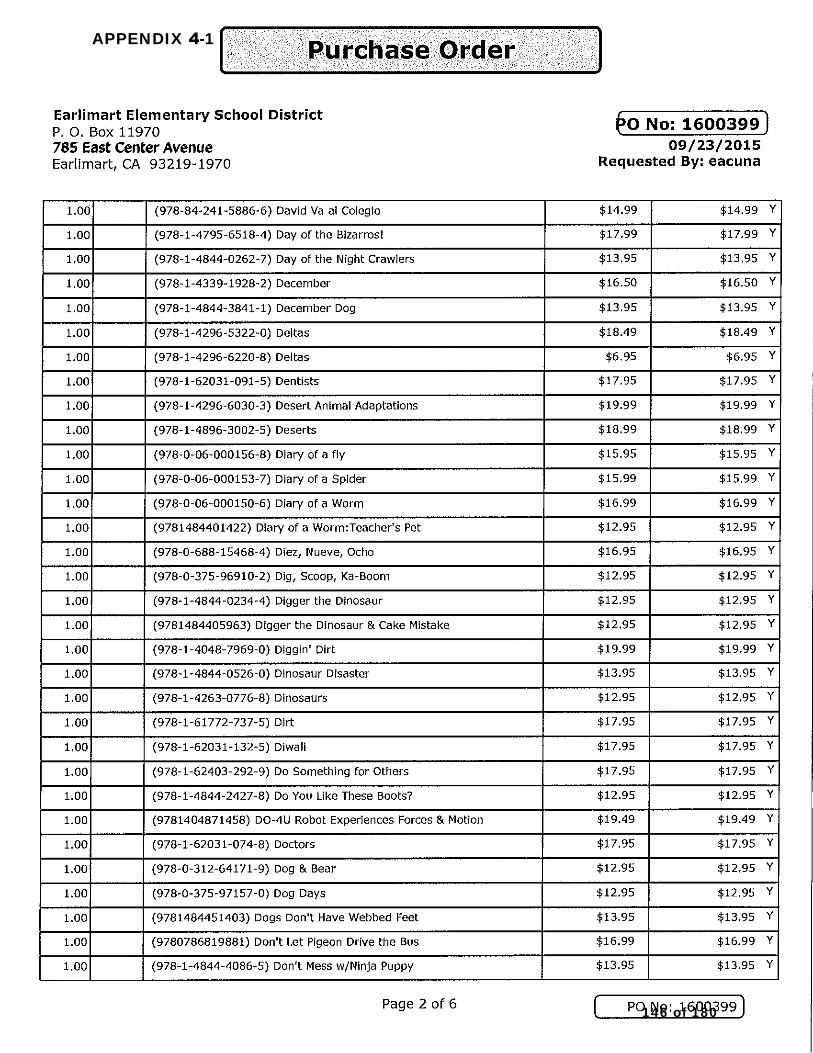
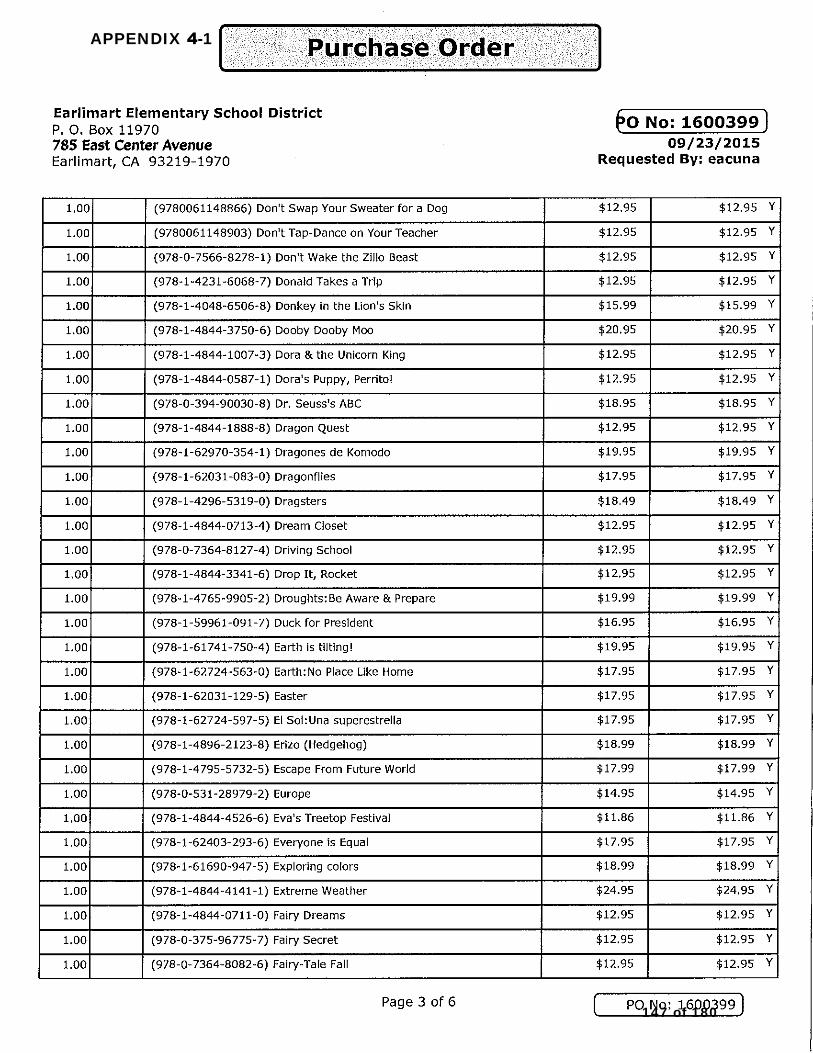
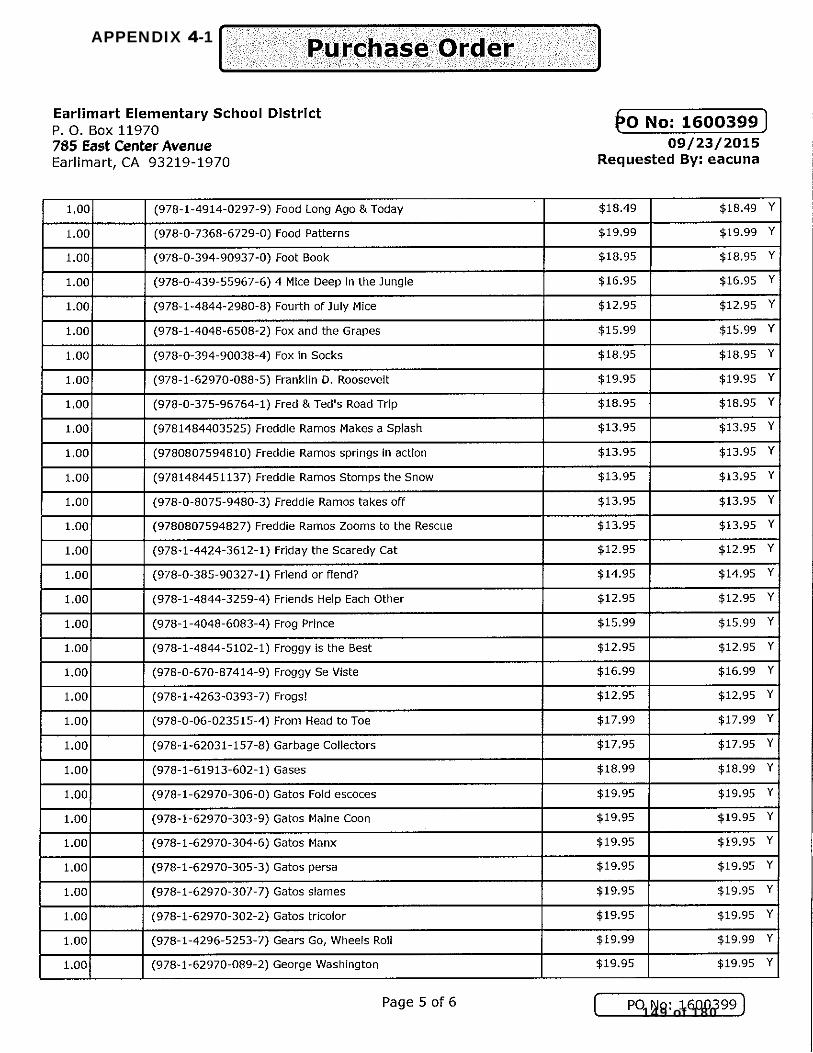
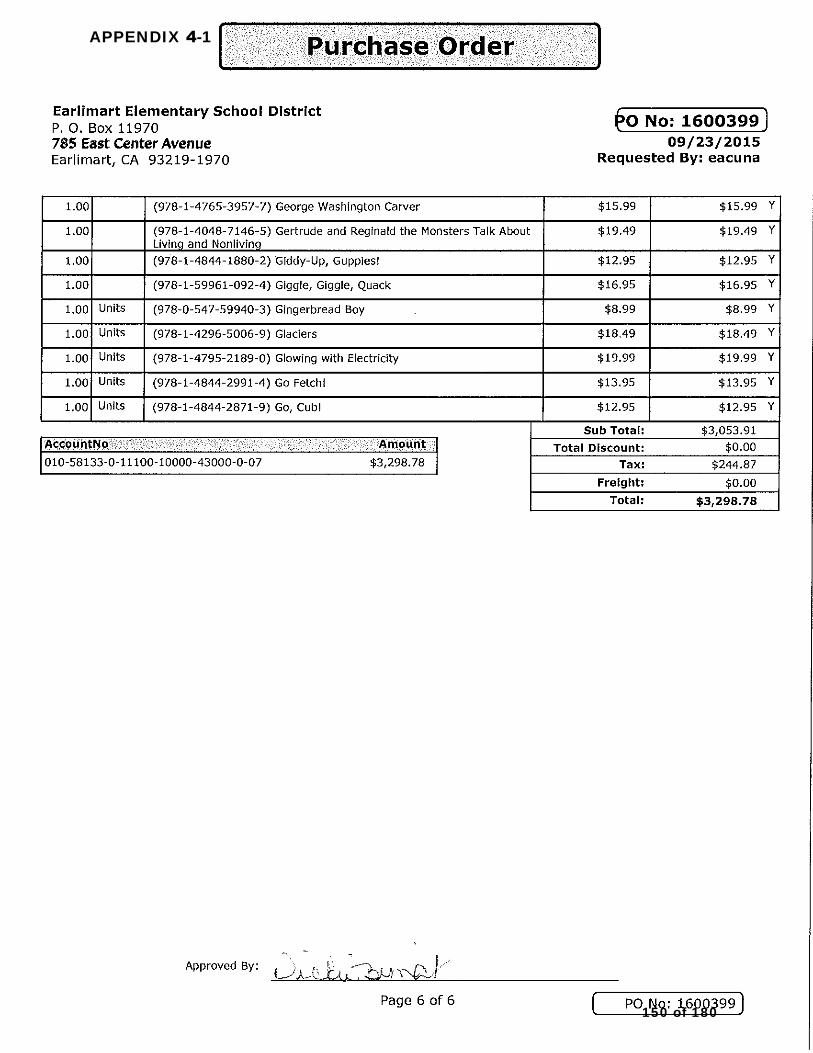
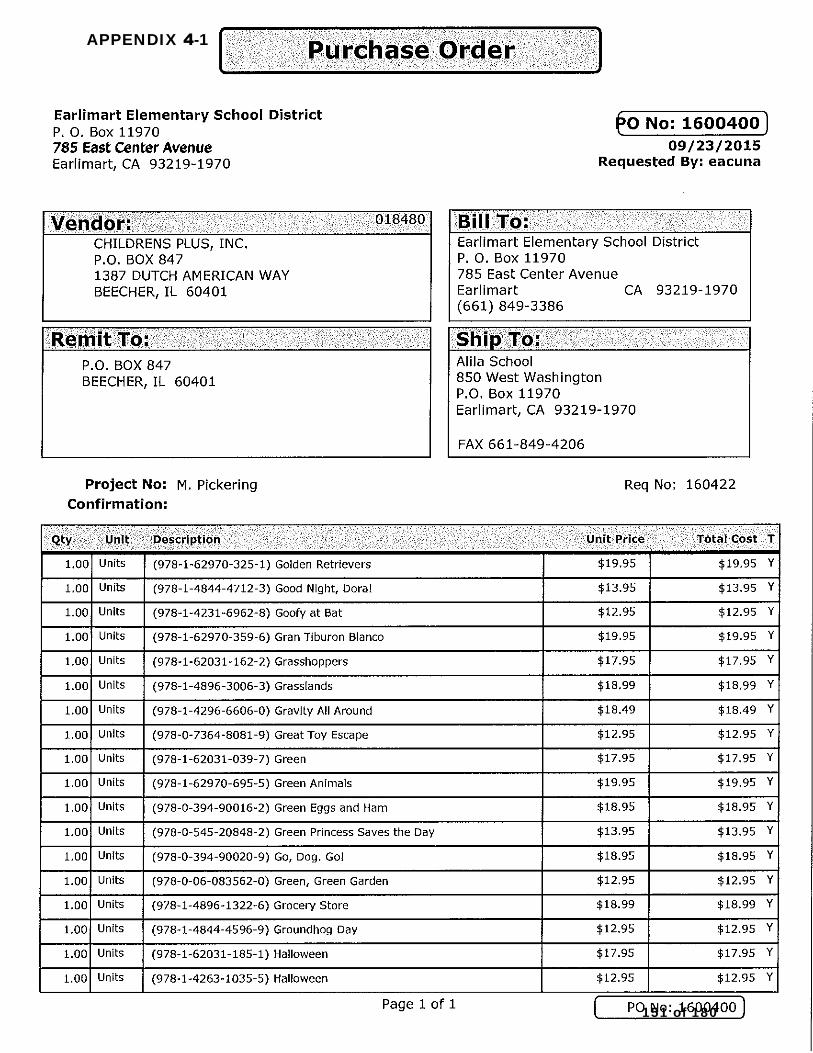
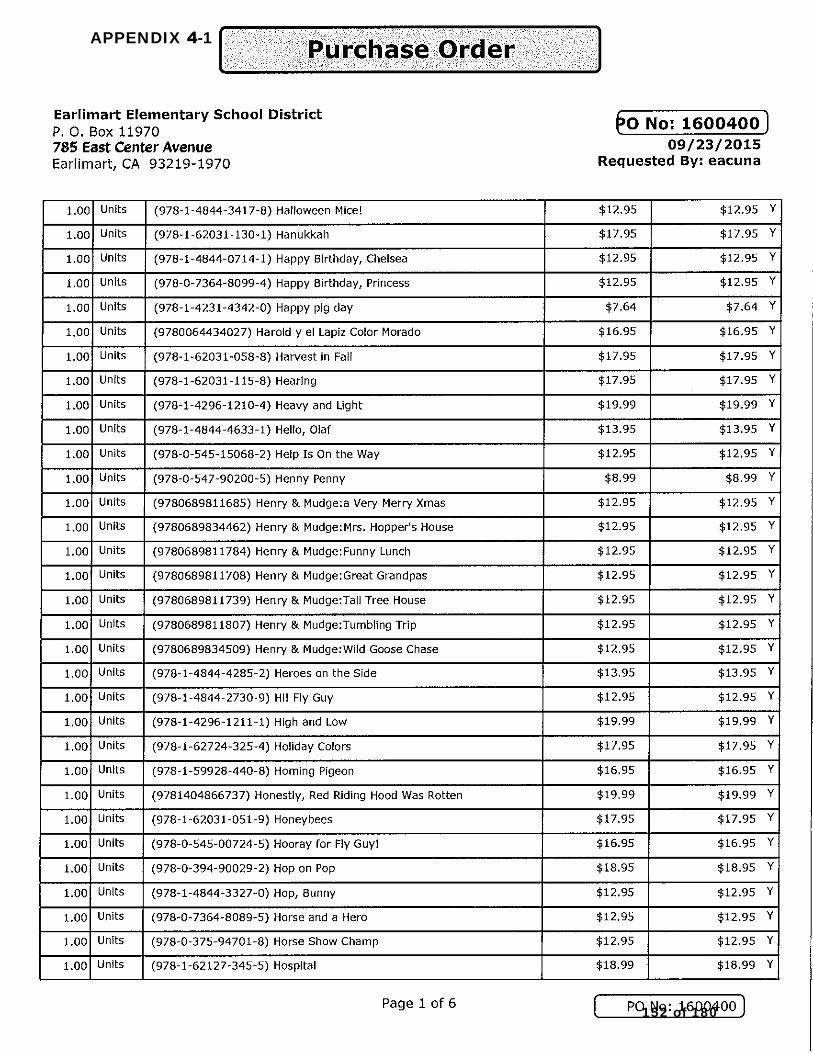
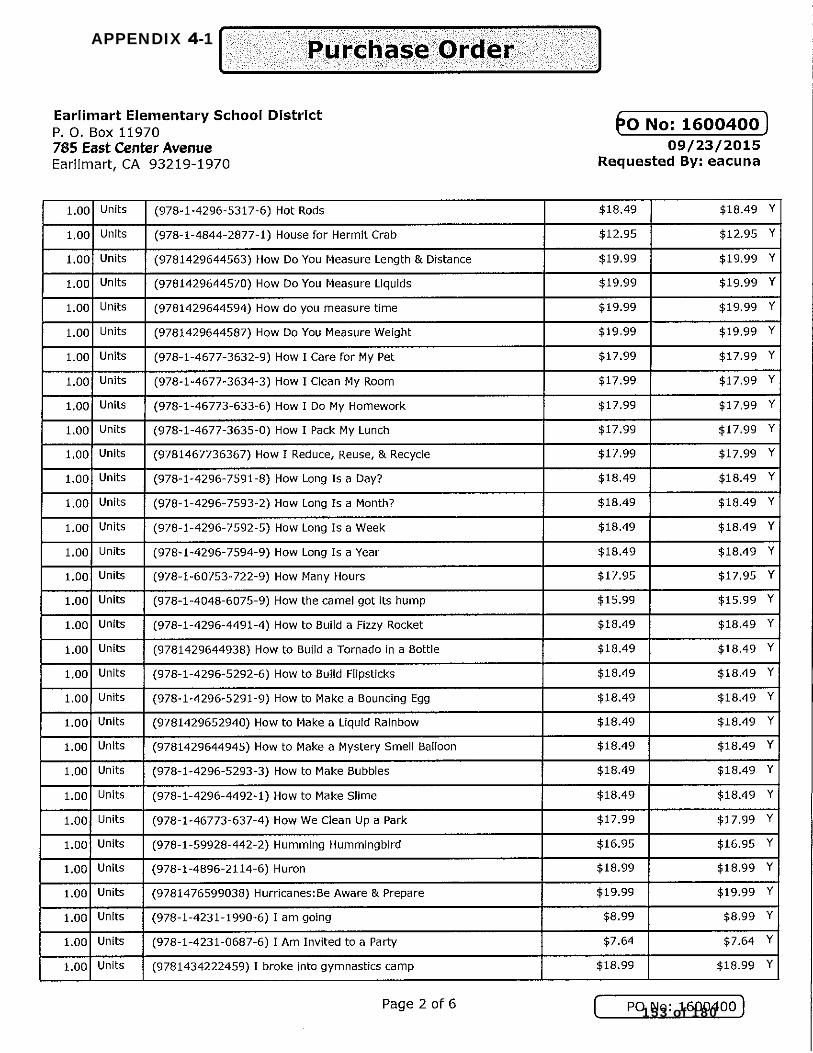
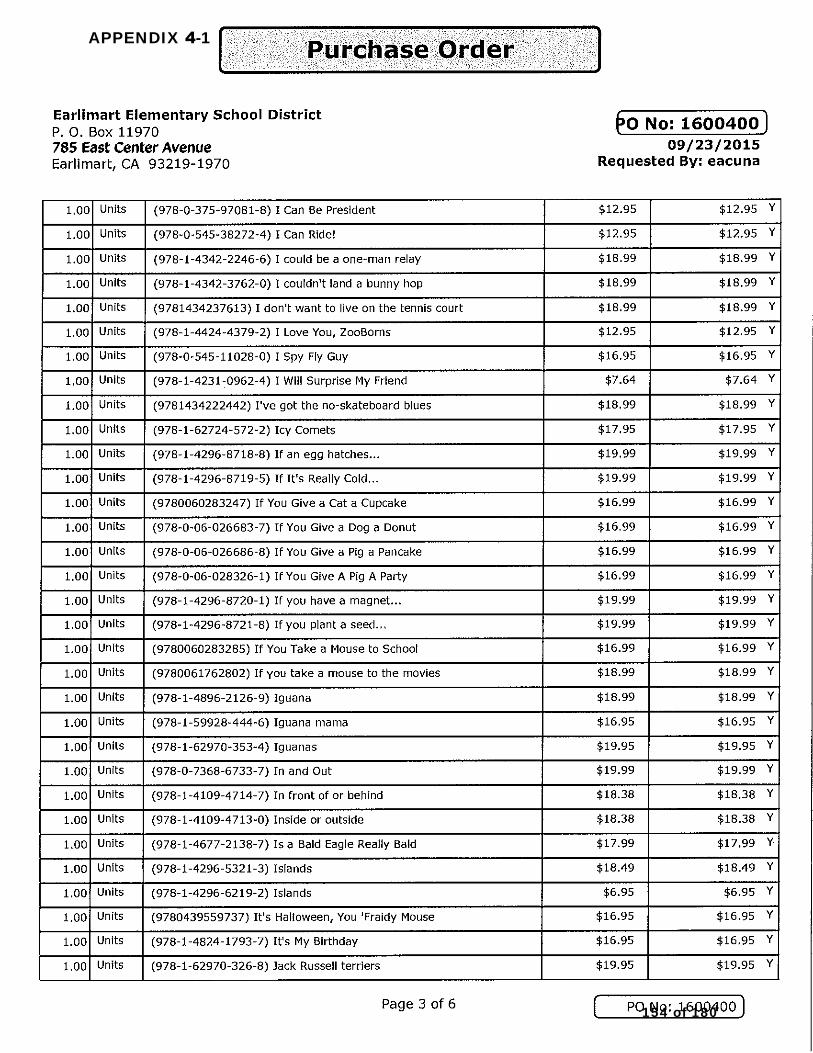
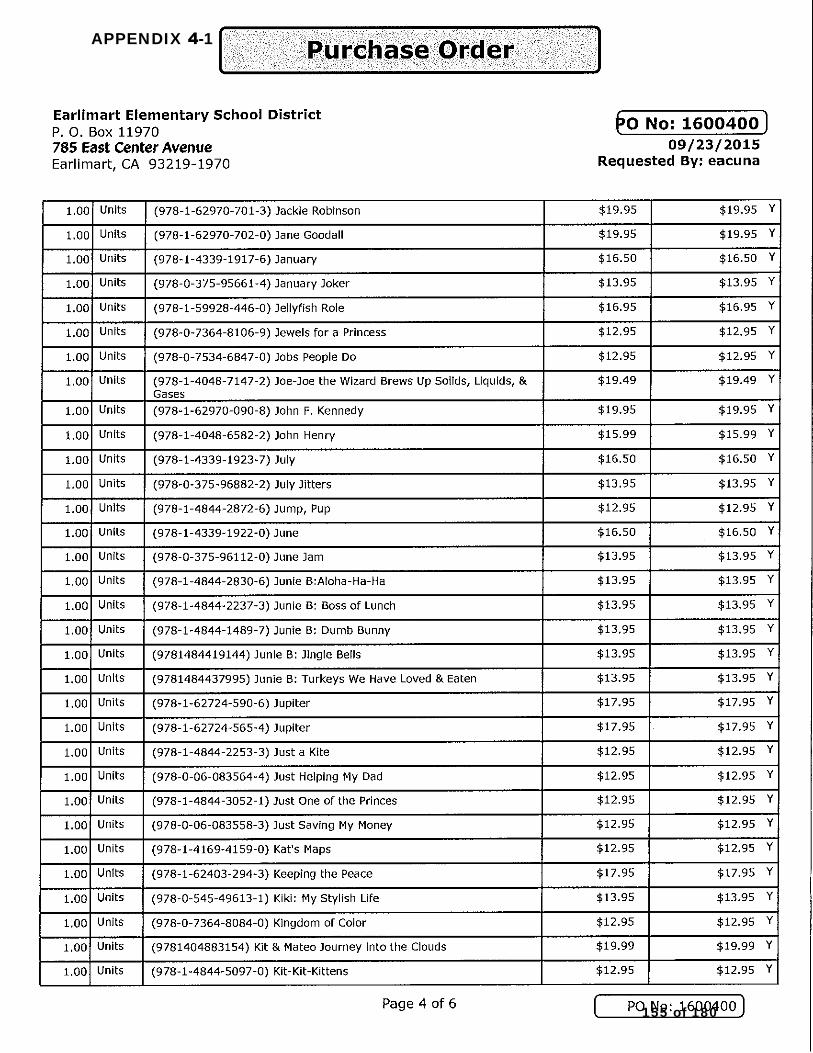
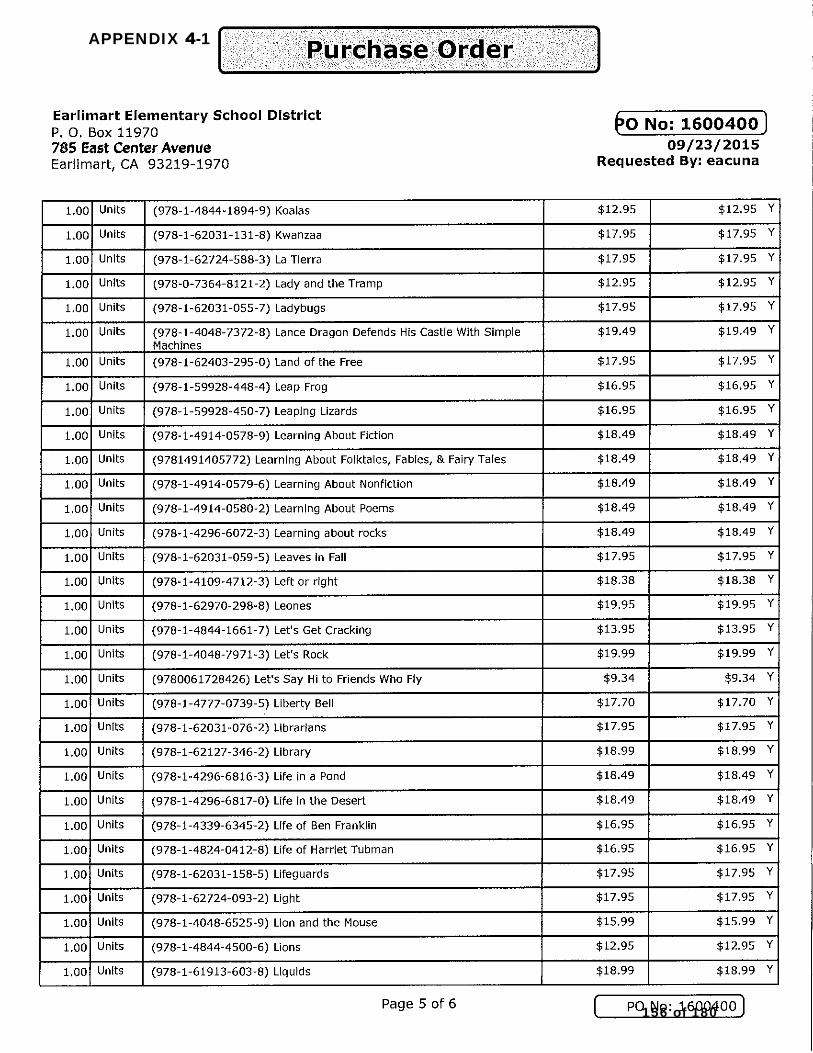
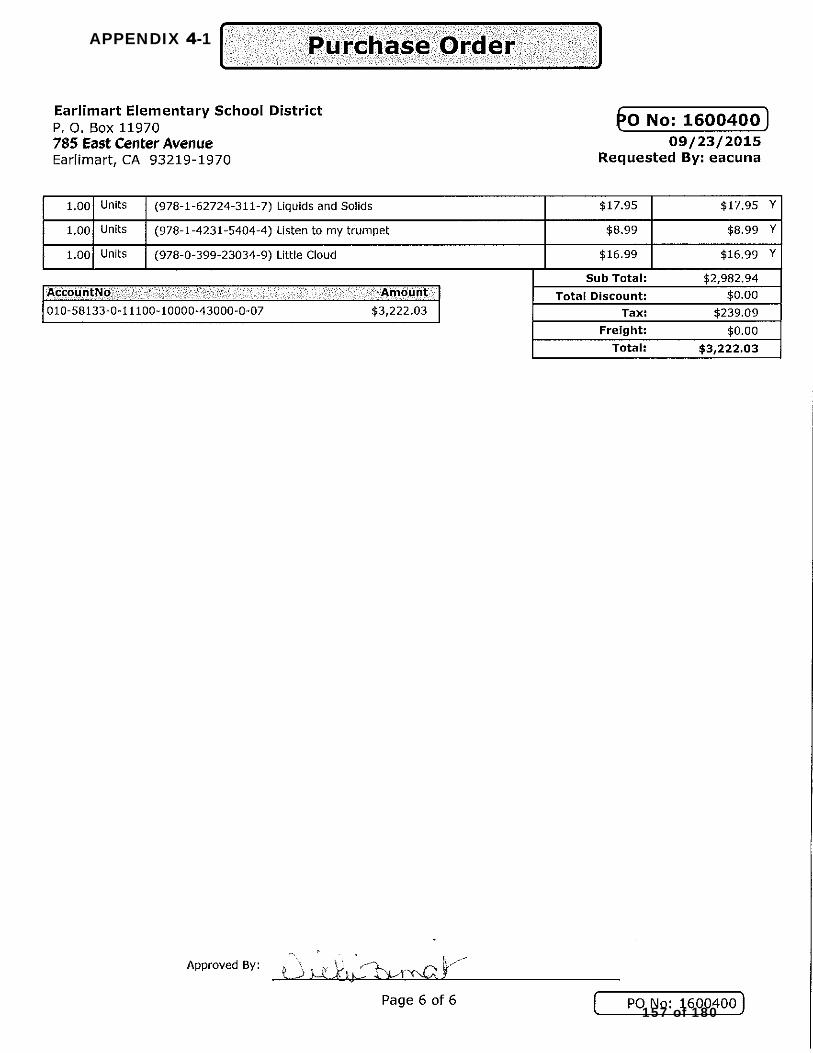
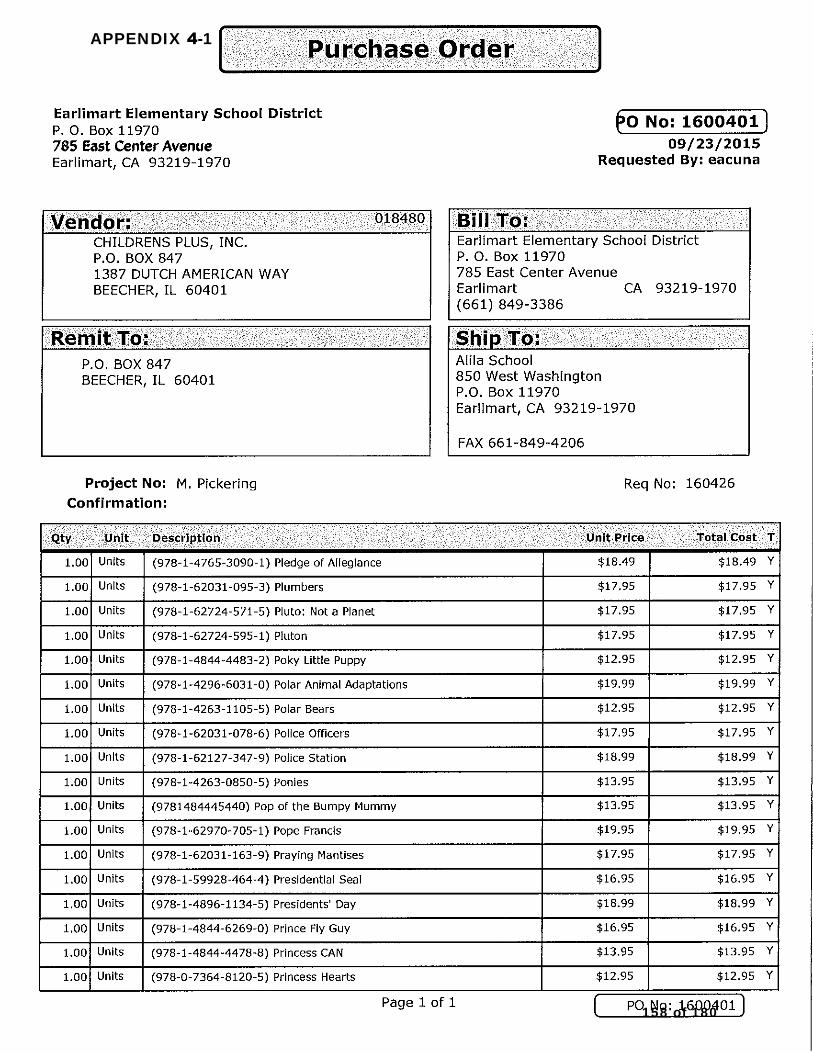
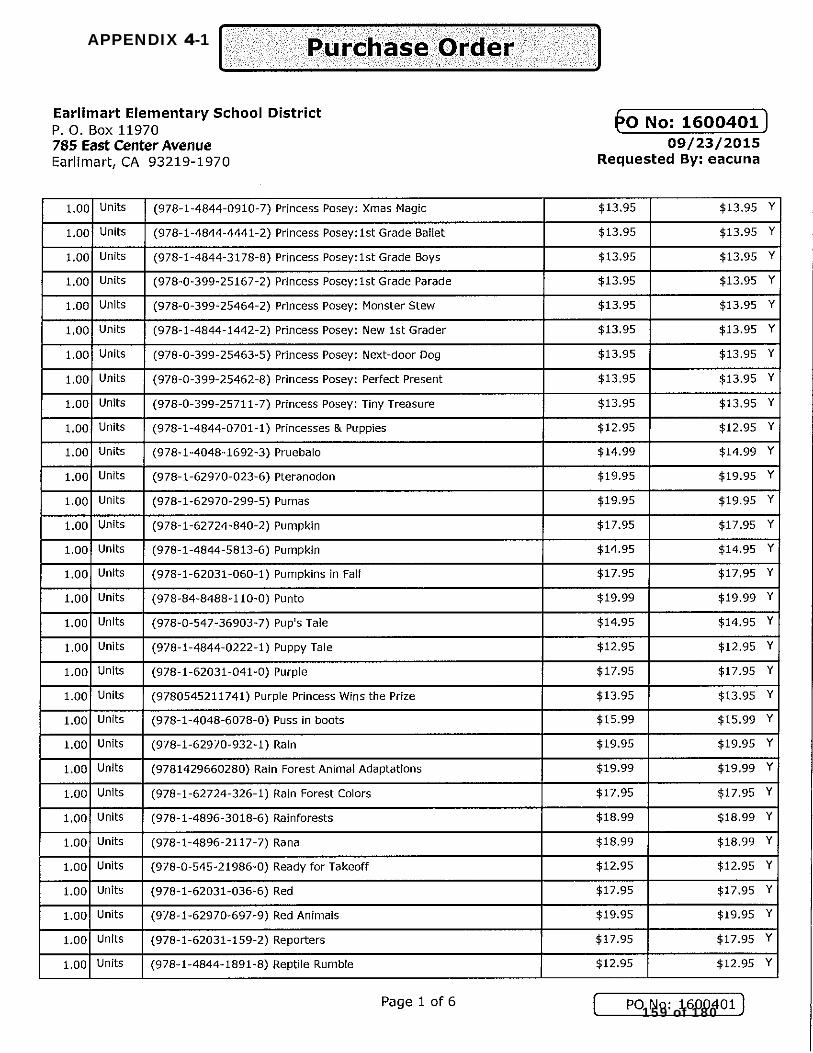
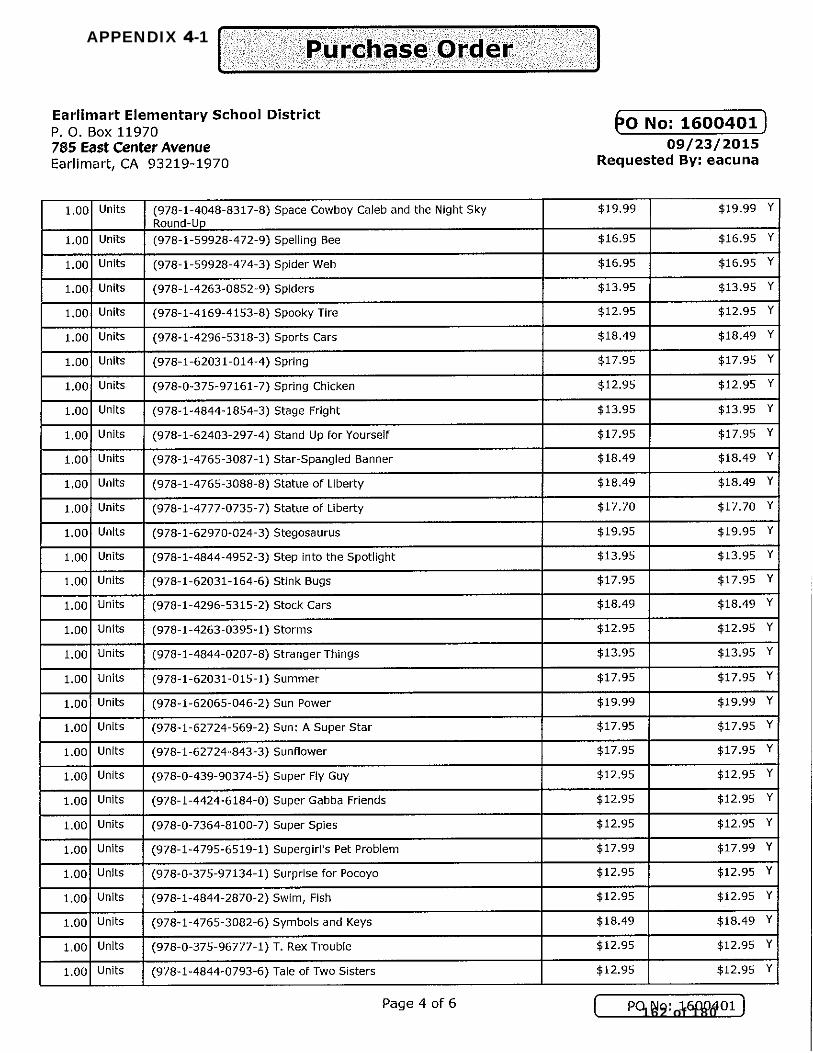
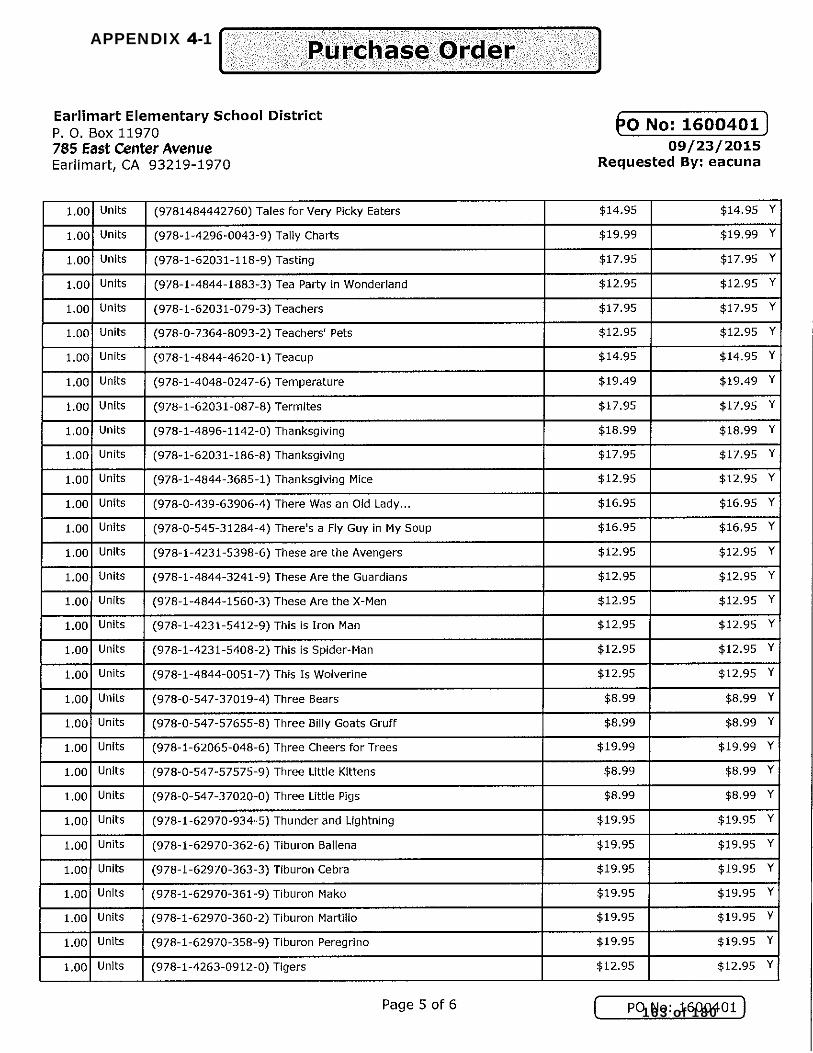
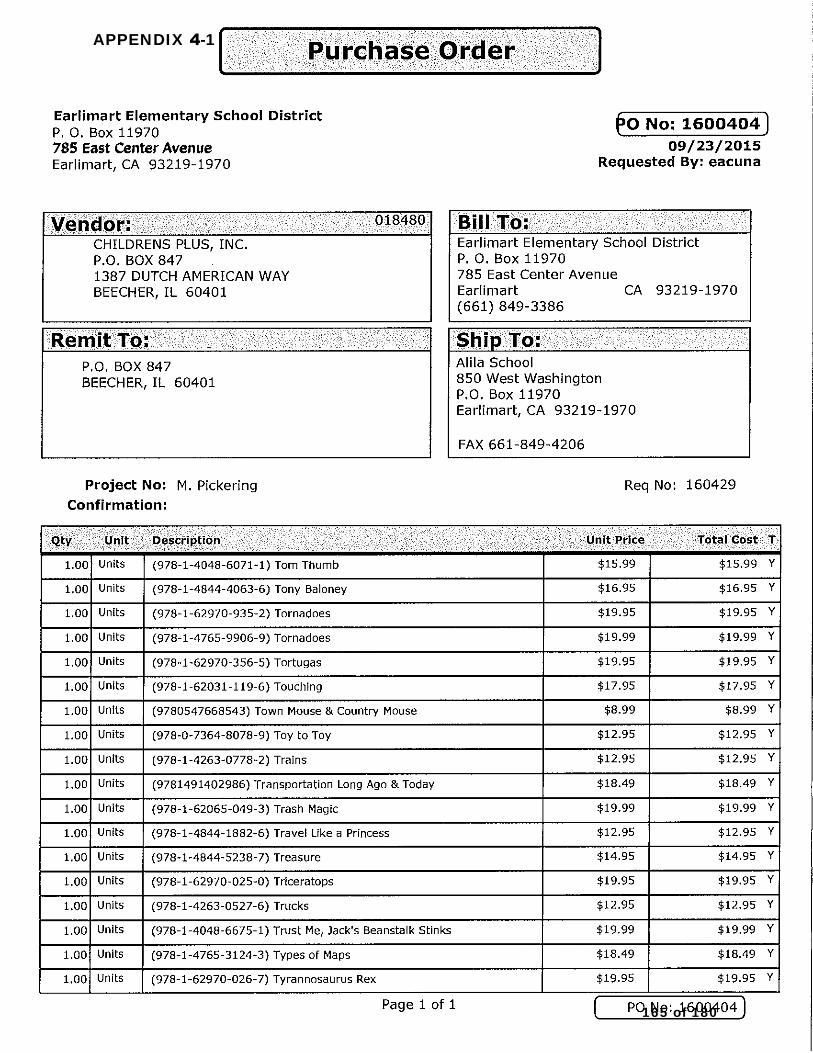
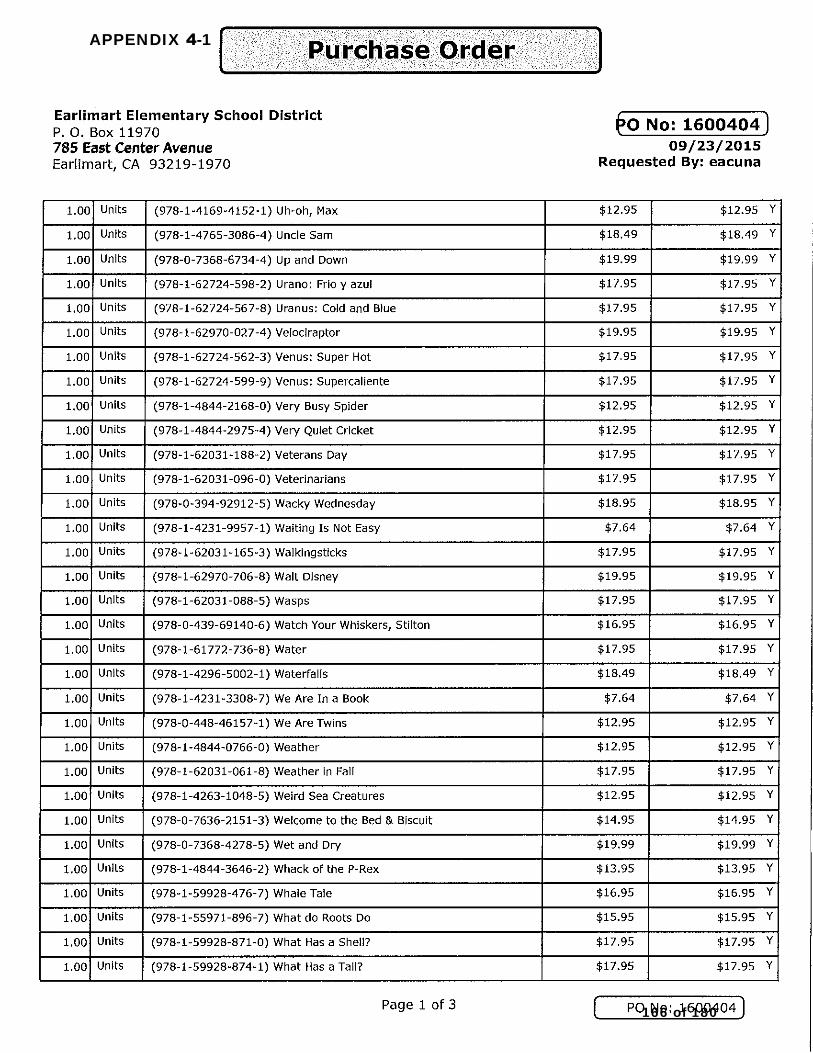
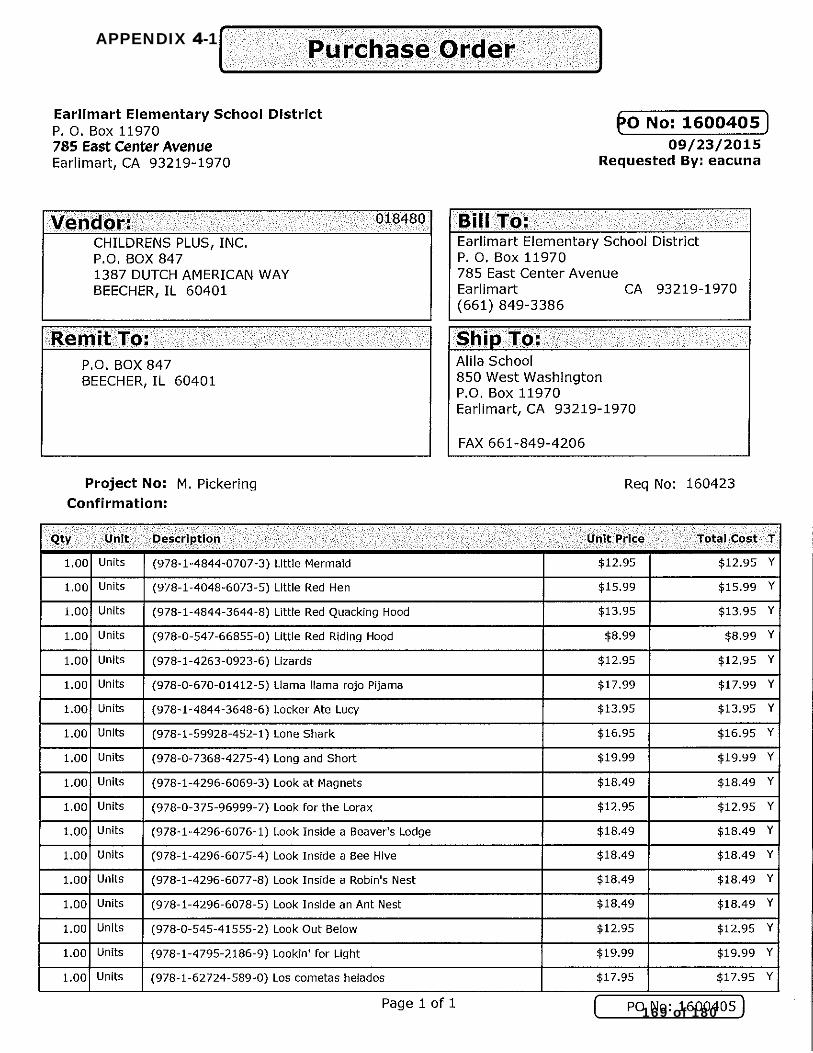
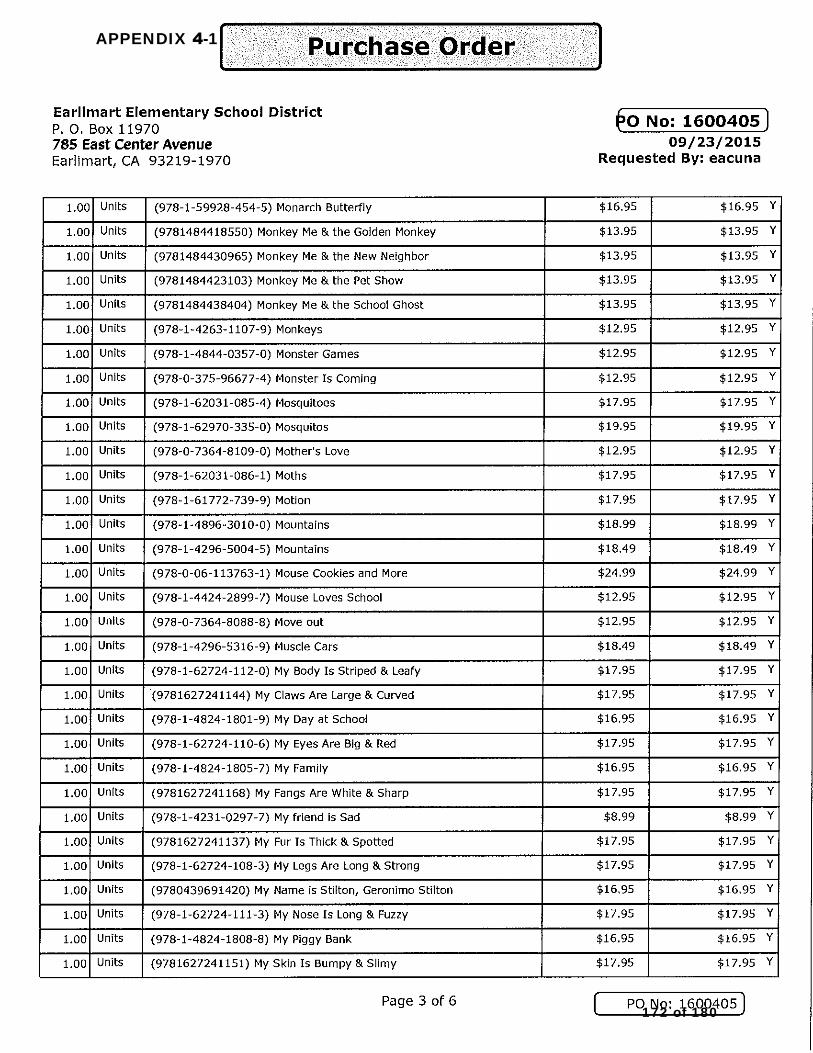
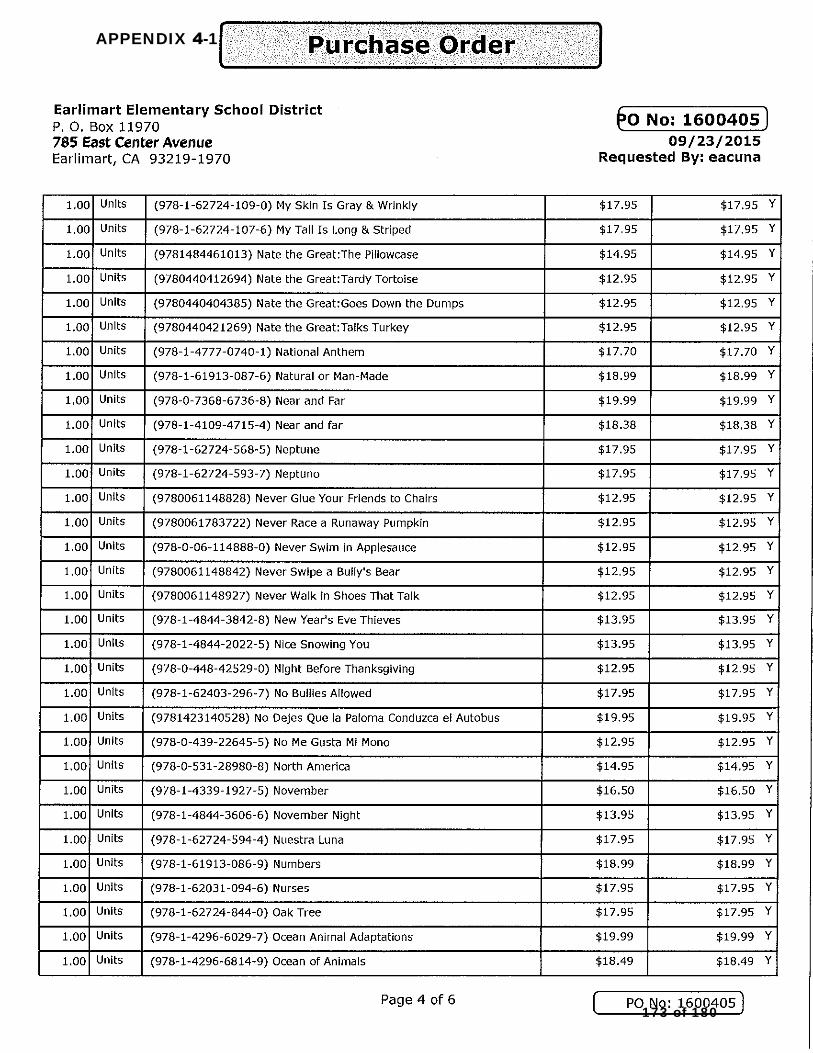
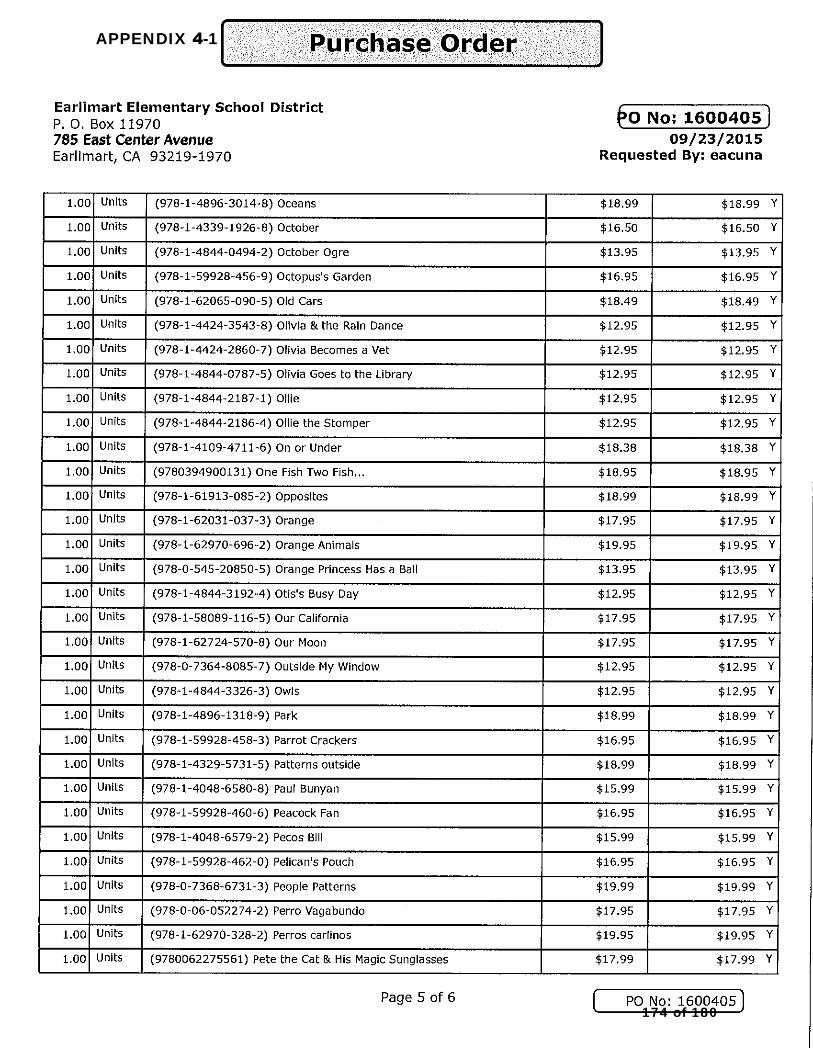
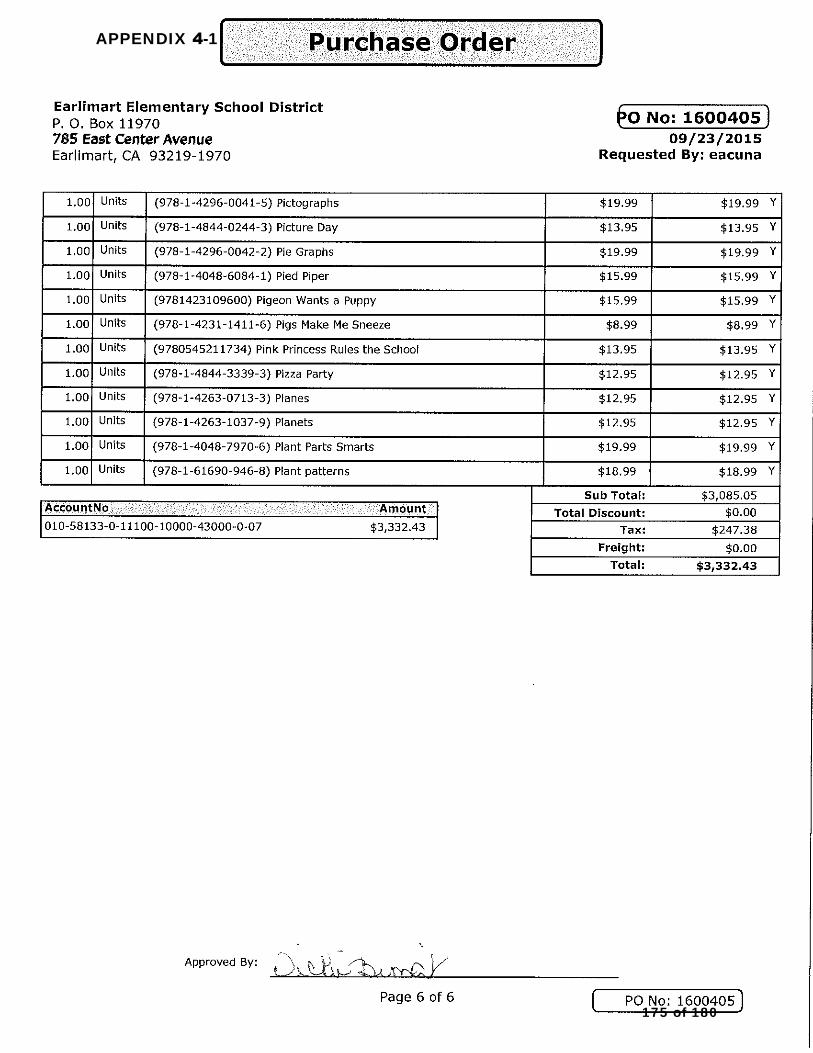
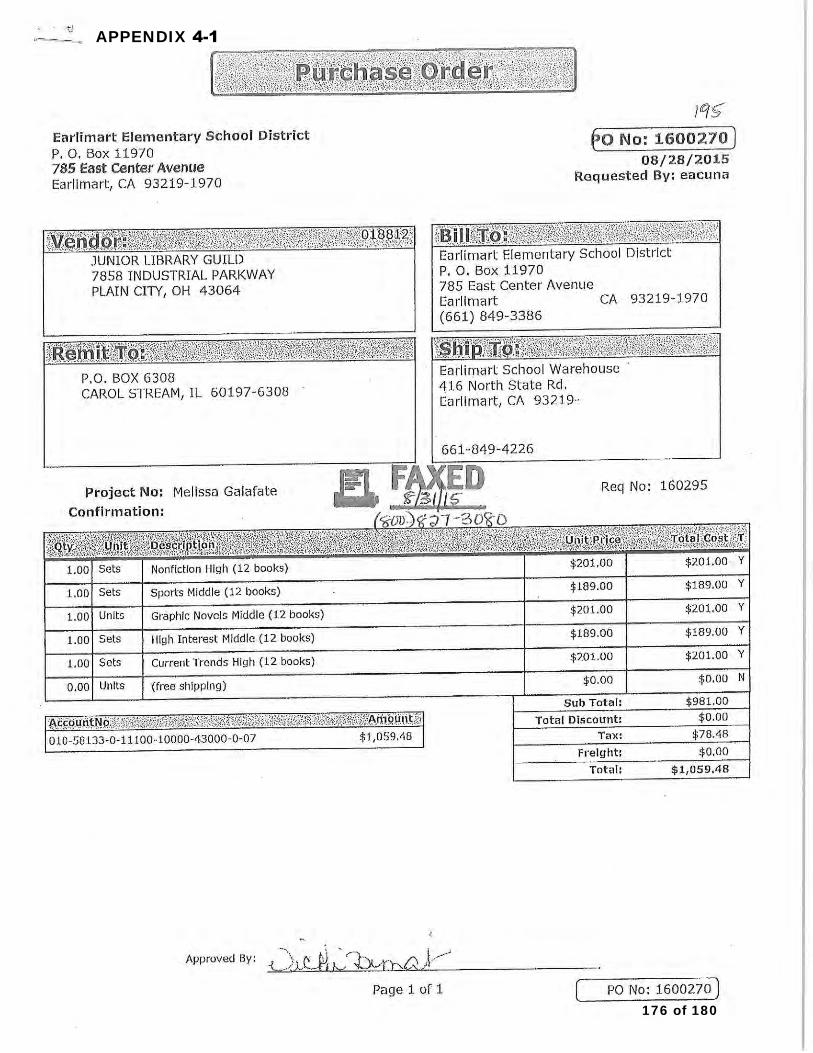
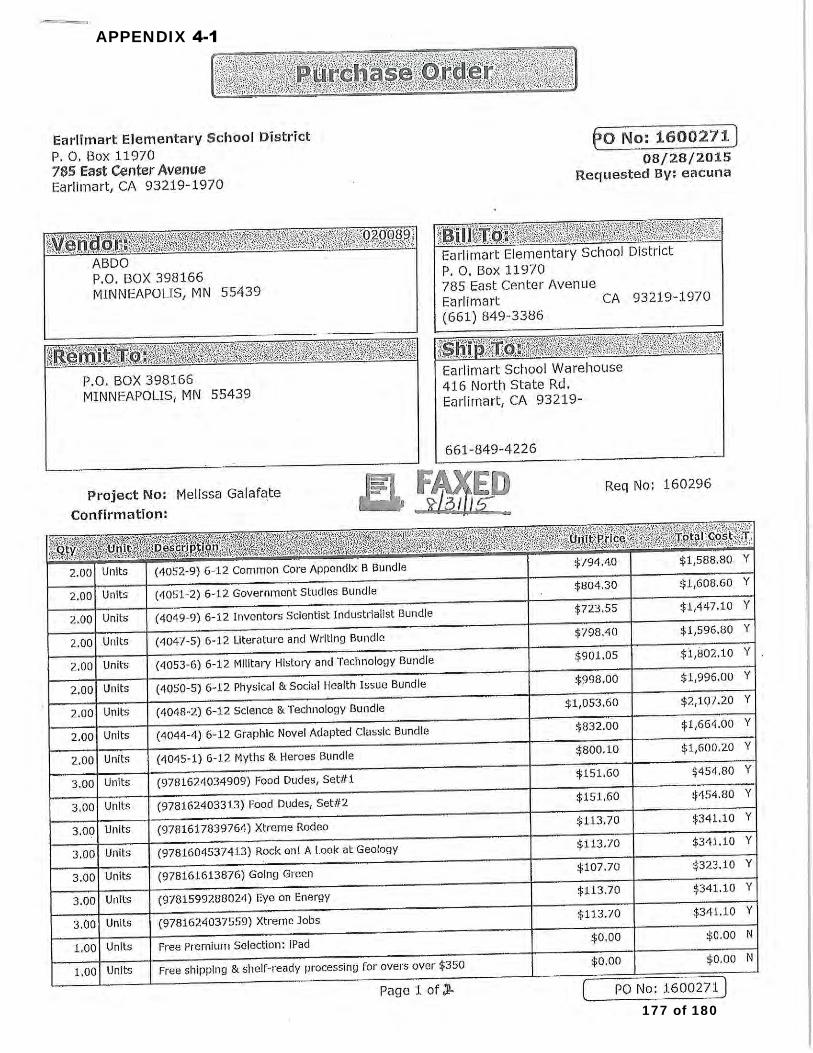
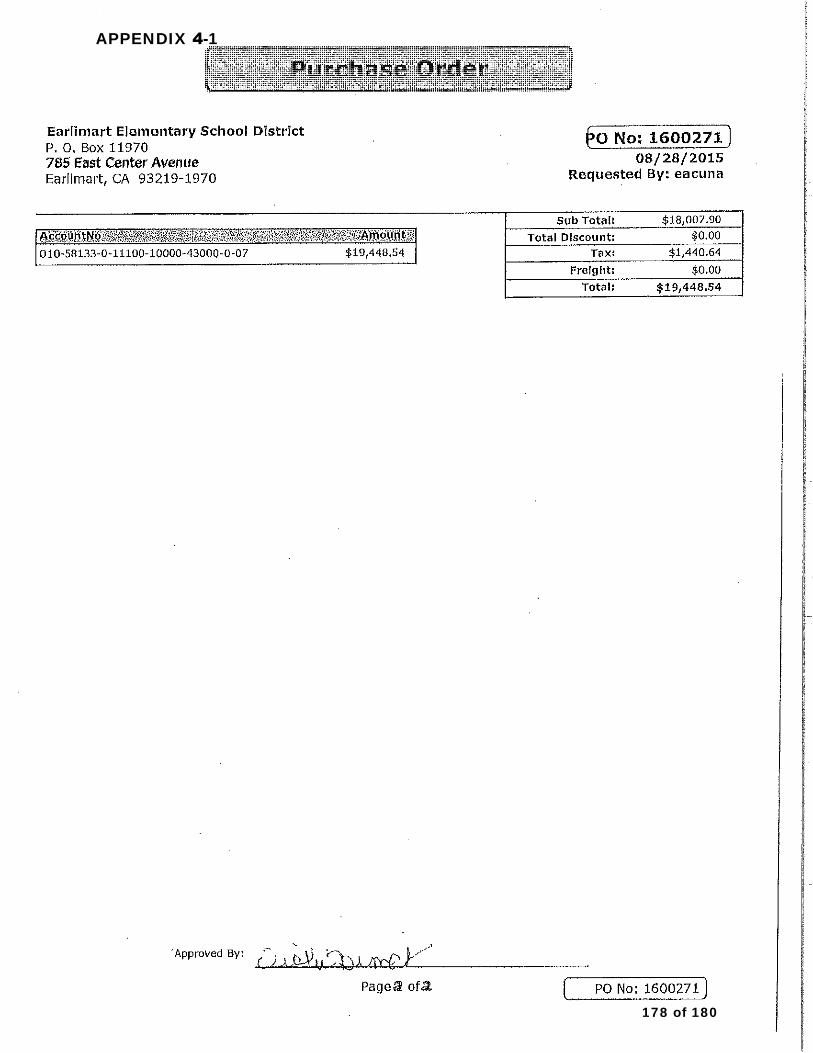
Through the support of this grant, we were able to purchase $22,500 in books for each of our 3 school libraries in the district. We were also able, as I mentioned in Goal 3, to purchase a new library management system. Finally, since we reconfigured our K-2nd and 3rd -5th grade schools into two K-5th grade schools, we used grant proceeds to reconfigure the libraries as well. The library at Earlimart Elementary was originally set up by AR levels and had books that were appropriate for younger students. We enlisted the help of TCOE and gathered a team of our own employees to convert the EES library to the Dewey Decimal System, and we purchased books that were appropriate for intermediate grade students. At Alila, we purchased books for primary grade students since there were few books that were appropriate for that age group. Appendix 4-1 includes the POs for our library books, with the titles attached. Our EL subgroup grew very well this year, outpacing the growth rate of the state of California. Appendix 4-2 includes a comparison of our English Learner subgroup between our district and the districts in Tulare County, as well as the California state average. Additionally, Appendix 4-3 shows the growth rate of the EL and Economically Disadvantaged subgroups of our district as compared to the state. Goal #4 Appendix
1. POs for library books 2. EL ELA State/County Comparison 3. EL CAASPP Growth Data
Goal #5: Improve library collections to help support the California Common Core State Standards.
OUTCOME: In accordance with rigorous academic standards, college and career readiness will be increased among Earlimart students.
6 of 180
Because of the Common Core demands for non-fiction text, a large percentage of the titles that we purchased were nonfiction. All librarians were instructed to order nonfiction text and higher level fiction texts. Our district is fortunate to have a close relationship with TCOE and our Library Media Supervisor is very familiar with the Common Core requirements for text. She gave our site teams guidance on what to purchase to bring our libraries into alignment with the new standards. Appendix 5-1 includes the email that I sent to the librarians, site administrators and the TCOE Library Media Supervisor.
Goal #5 Appendix Library order email
7 of 180
Evaluation findings for the IAL Grant
Earlimart School District
Goal 1: To improve English Language Arts proficiency for 2,030 Pre-K through 8th grade students
CAASPP ELA Data
Appendix 1-1 of the executive summary report references the 5% gain district wide as well as
the positive gains made by grade 3 and 8 on the annual CAASPP assessment of English
Language Arts. Also referenced are the gains made by the English Language Learner Subgroup
represents 77% of the school population. The gains made by grade 3 and grade 8 represent
gains in all sub test categories.
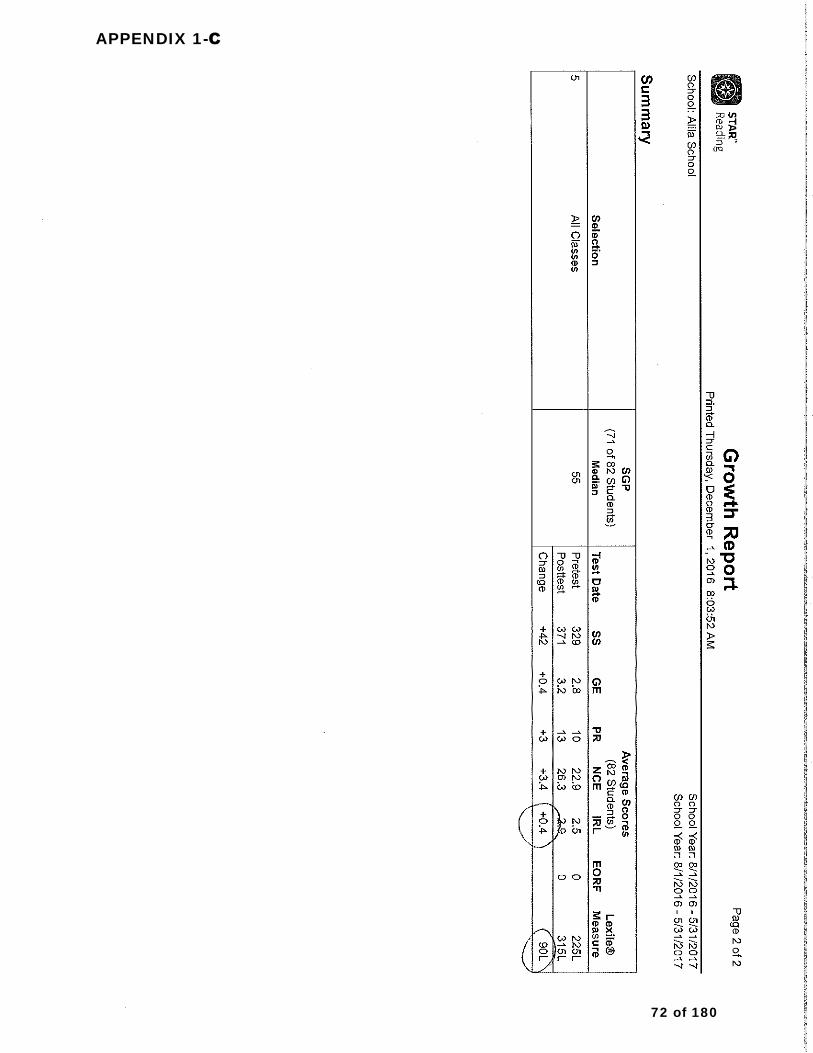
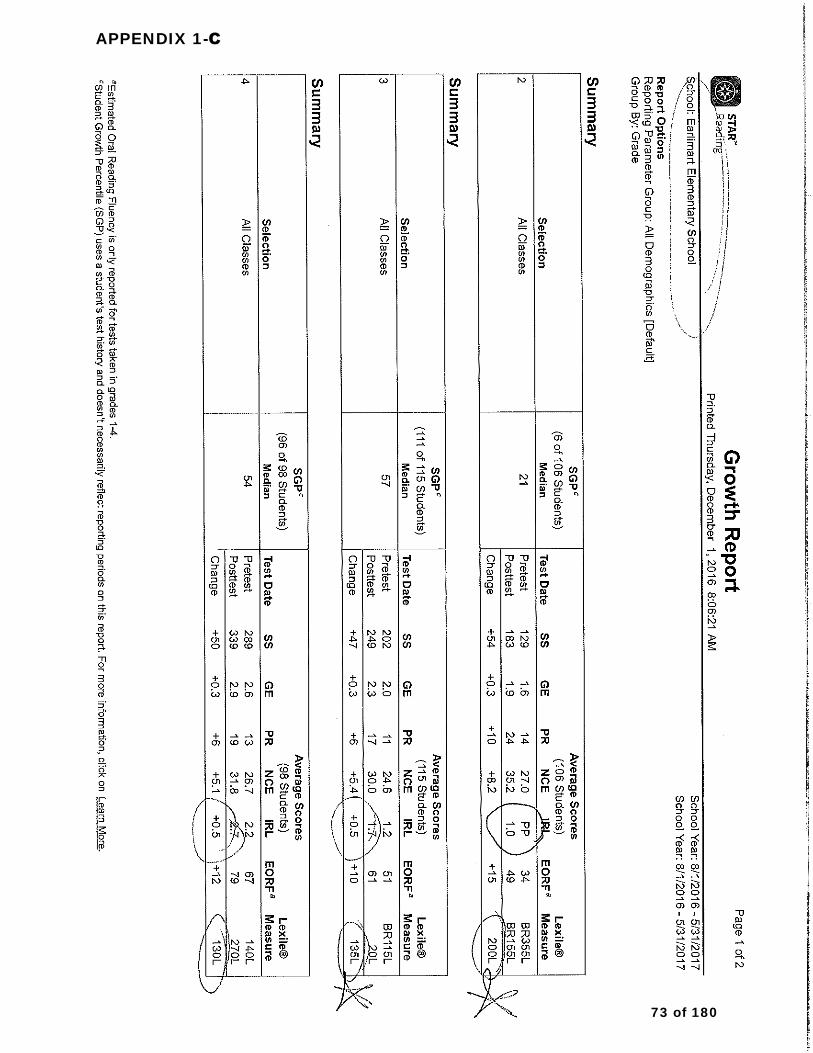
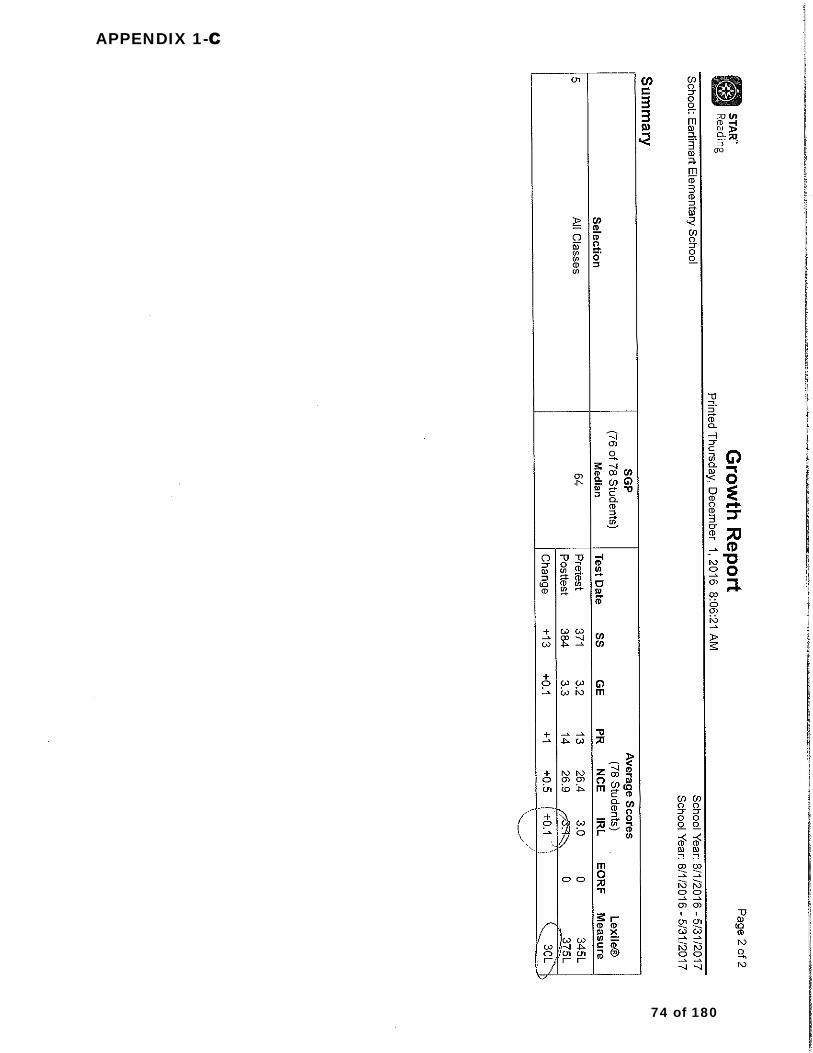
READING ASSESSMENTS GRADE LEVEL PROGRESS DATA
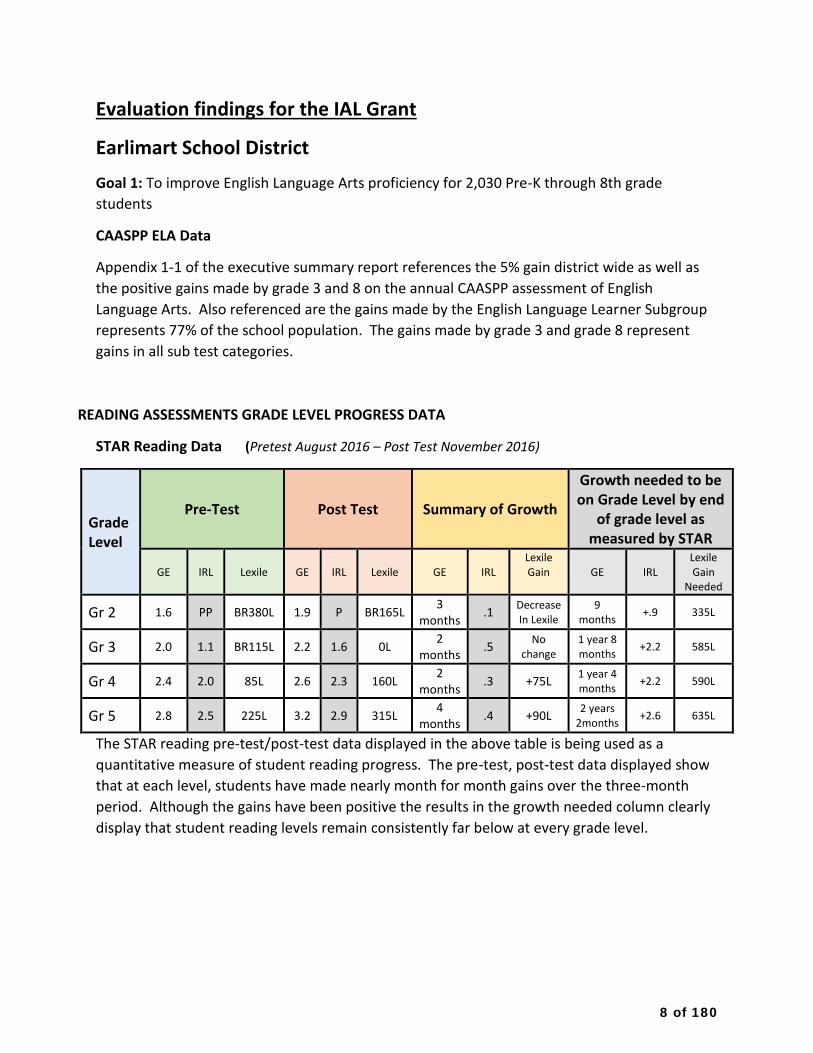
STAR Reading Data (Pretest August 2016 – Post Test November 2016)
Growth needed to be
Grade Pre-Test Post Test Summary of Growth
on Grade Level by end of grade level as
Level measured by STAR Lexile Lexile
GE IRL Lexile GE IRL Lexile GE IRL Gain GE IRL Gain Needed
Gr 2 1.6 PP BR380L 1.9 P BR165L 3
months .1
Decrease In Lexile
9 months
+.9 335L
Gr 3 2.0 1.1 BR115L 2.2 1.6 0L 2
months .5
No change
1 year 8 months
+2.2 585L
Gr 4 2.4 2.0 85L 2.6 2.3 160L 2
months .3 +75L
1 year 4 months
+2.2 590L
Gr 5 2.8 2.5 225L 3.2 2.9 315L 4
months .4 +90L
2 years 2months
+2.6 635L
The STAR reading pre-test/post-test data displayed in the above table is being used as a
quantitative measure of student reading progress. The pre-test, post-test data displayed show
that at each level, students have made nearly month for month gains over the three-month
period. Although the gains have been positive the results in the growth needed column clearly
display that student reading levels remain consistently far below at every grade level.
8 of 180
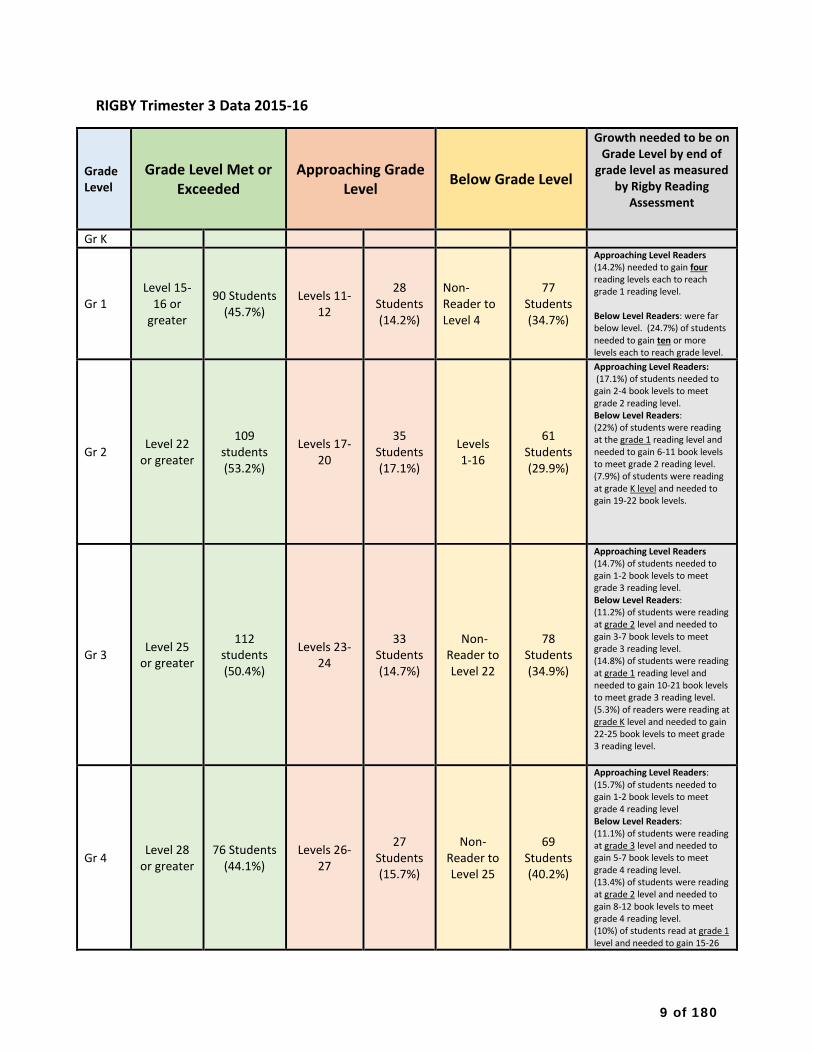
RIGBY Trimester 3 Data 2015-16
Grade Level
Grade Level Met or Exceeded
Approaching Grade Level
Below Grade Level
Growth needed to be on Grade Level by end of
grade level as measured by Rigby Reading
Assessment
Gr K Approaching Level Readers (14.2%) needed to gain four reading levels each to reach
Level 15-90 Students Levels 11-
28 Non- 77 grade 1 reading level.
Gr 1 16 or Students Reader to Students greater
(45.7%) 12 (14.2%) Level 4 (34.7%) Below Level Readers: were far
below level. (24.7%) of students needed to gain ten or more levels each to reach grade level.
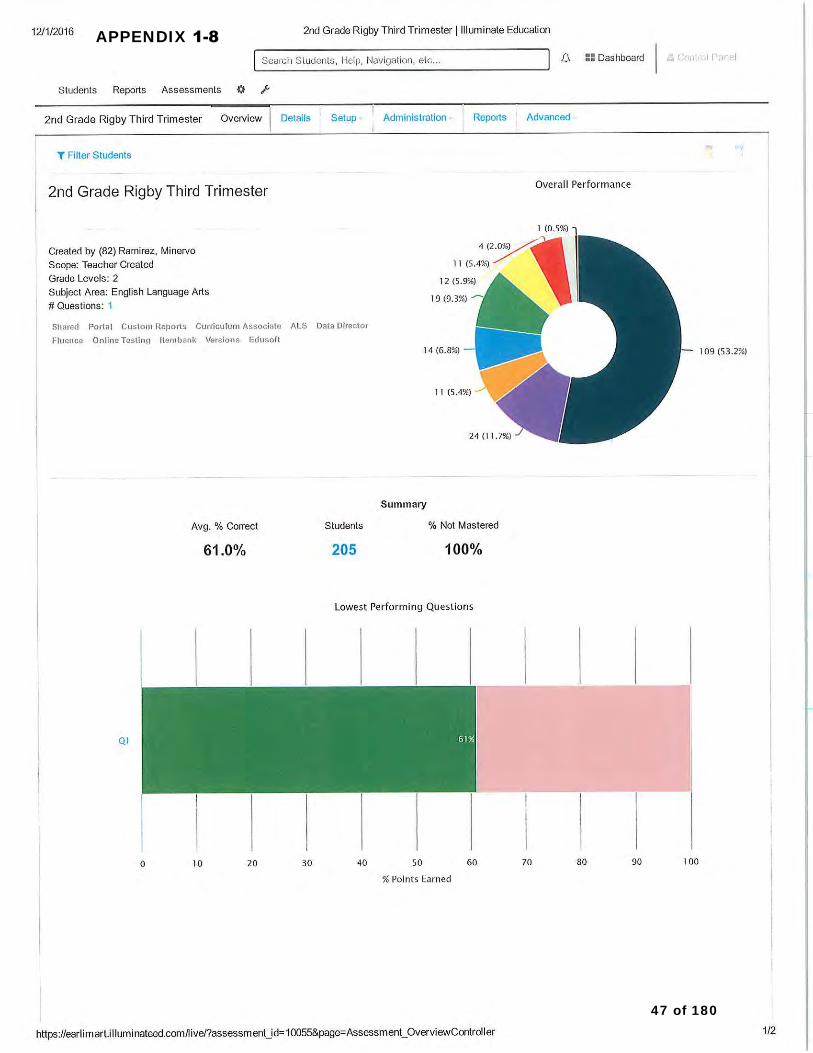
Gr 2 Level 22
or greater
109 students (53.2%)
Levels 17-20
35 Students (17.1%)
Levels 1-16
61 Students (29.9%)
Approaching Level Readers: (17.1%) of students needed to gain 2-4 book levels to meet grade 2 reading level. Below Level Readers: (22%) of students were reading at the grade 1 reading level and needed to gain 6-11 book levels to meet grade 2 reading level. (7.9%) of students were reading at grade K level and needed to gain 19-22 book levels.
112 33 Non- 78
Approaching Level Readers (14.7%) of students needed to gain 1-2 book levels to meet grade 3 reading level. Below Level Readers: (11.2%) of students were reading at grade 2 level and needed to gain 3-7 book levels to meet
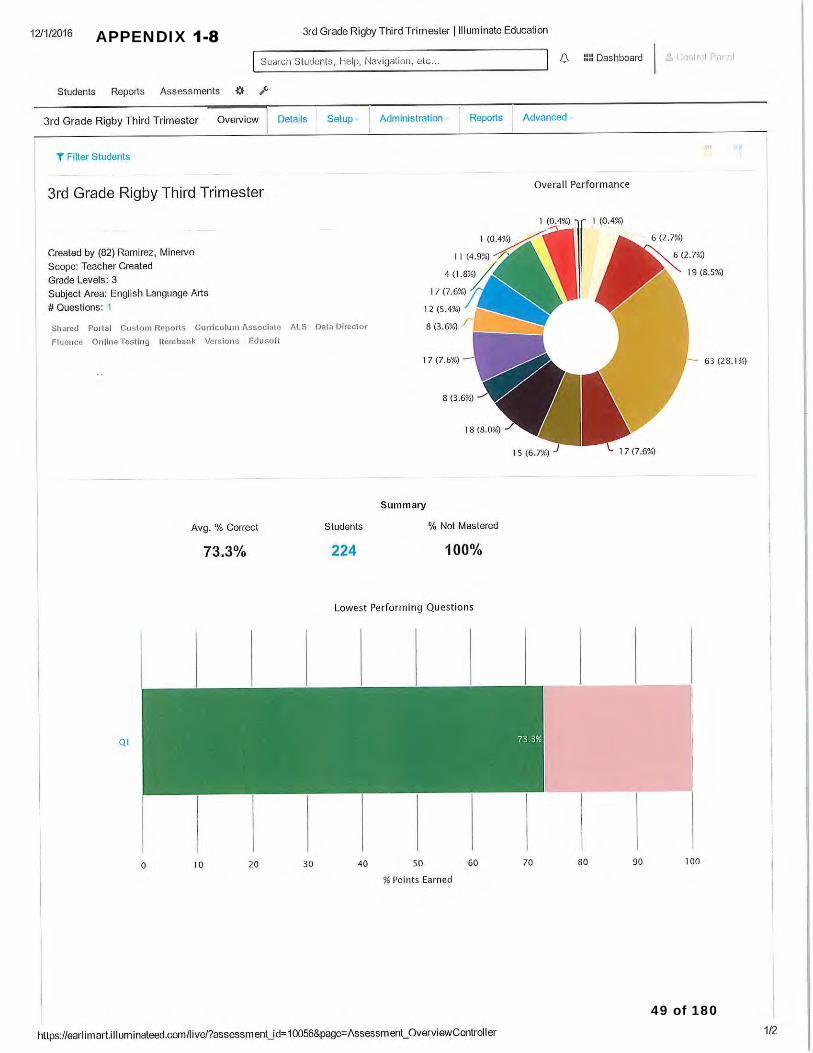
Gr 3 Level 25
or greater students (50.4%)
Levels 23-24
Students (14.7%)
Reader to Level 22
Students (34.9%)
grade 3 reading level. (14.8%) of students were reading at grade 1 reading level and needed to gain 10-21 book levels to meet grade 3 reading level. (5.3%) of readers were reading at grade K level and needed to gain 22-25 book levels to meet grade 3 reading level.
Approaching Level Readers: (15.7%) of students needed to gain 1-2 book levels to meet grade 4 reading level Below Level Readers: (11.1%) of students were reading
Level 28 76 Students Levels 26-27 Non- 69 at grade 3 level and needed to
Gr 4 Students Reader to Students gain 5-7 book levels to meet or greater (44.1%) 27
(15.7%) Level 25 (40.2%) grade 4 reading level. (13.4%) of students were reading at grade 2 level and needed to gain 8-12 book levels to meet grade 4 reading level. (10%) of students read at grade 1 level and needed to gain 15-26
9 of 180
book levels to meet grade 4 reading level. (5.8%) of readers were reading at K level and needed to gain 27-30 book levels to meet grade 4 reading level.
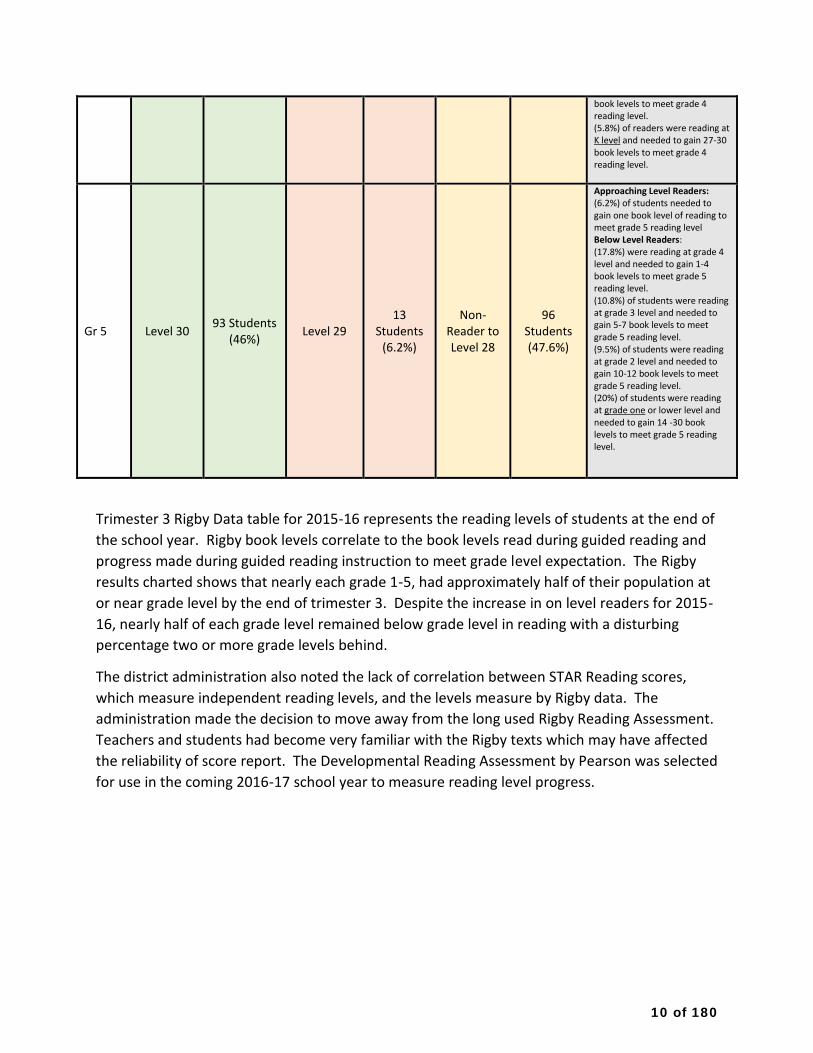
13 Non- 96
Approaching Level Readers: (6.2%) of students needed to gain one book level of reading to meet grade 5 reading level Below Level Readers: (17.8%) were reading at grade 4 level and needed to gain 1-4 book levels to meet grade 5 reading level. (10.8%) of students were reading at grade 3 level and needed to
Gr 5 Level 30 93 Students
(46%) Level 29 Students
(6.2%) Reader to Level 28
Students (47.6%)
gain 5-7 book levels to meet grade 5 reading level. (9.5%) of students were reading at grade 2 level and needed to gain 10-12 book levels to meet grade 5 reading level. (20%) of students were reading at grade one or lower level and needed to gain 14 -30 book levels to meet grade 5 reading level.
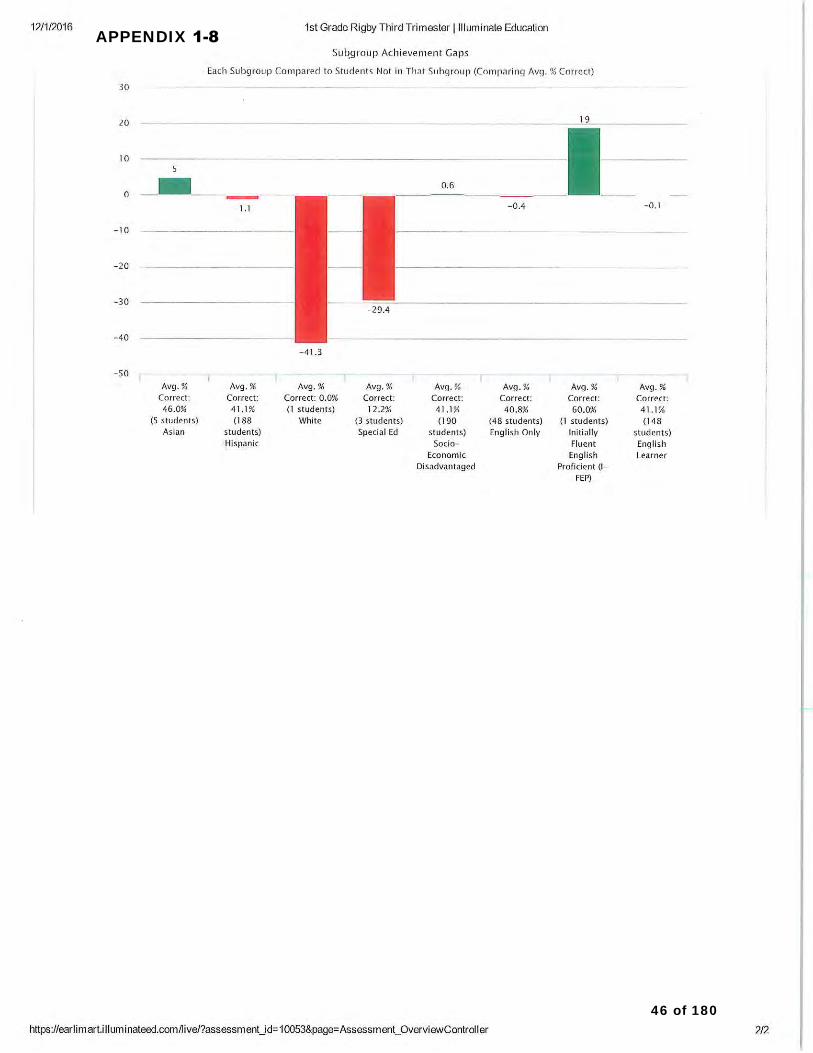
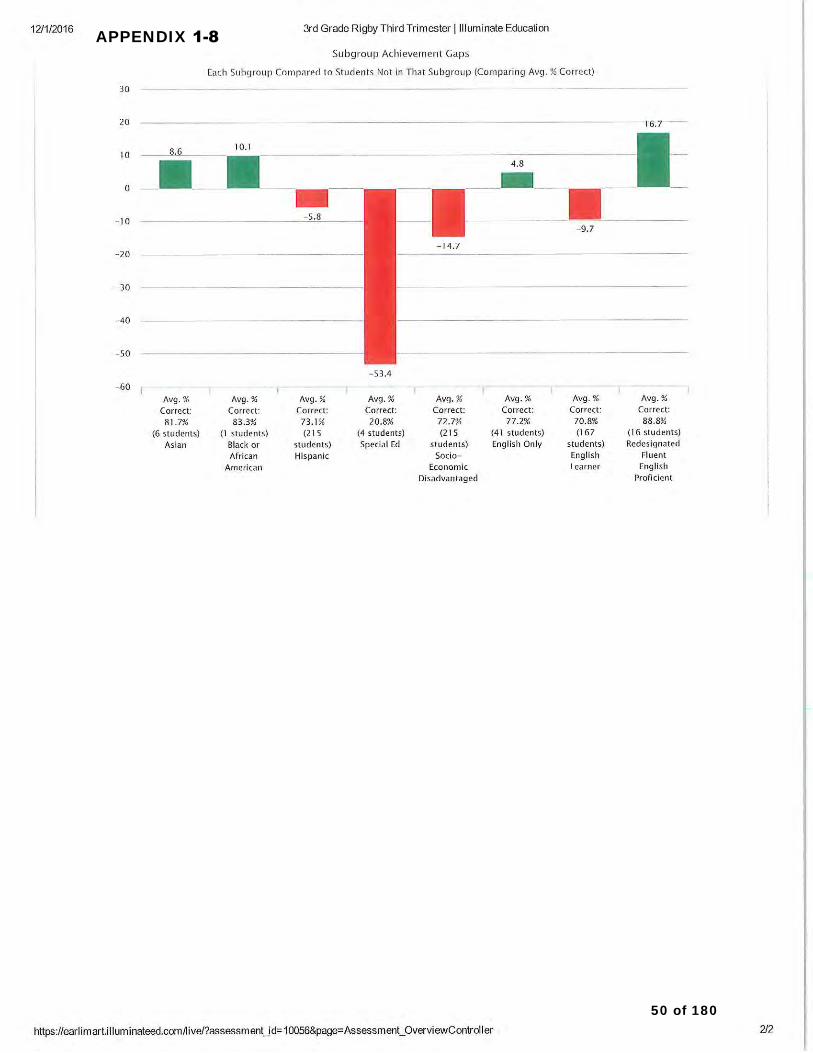
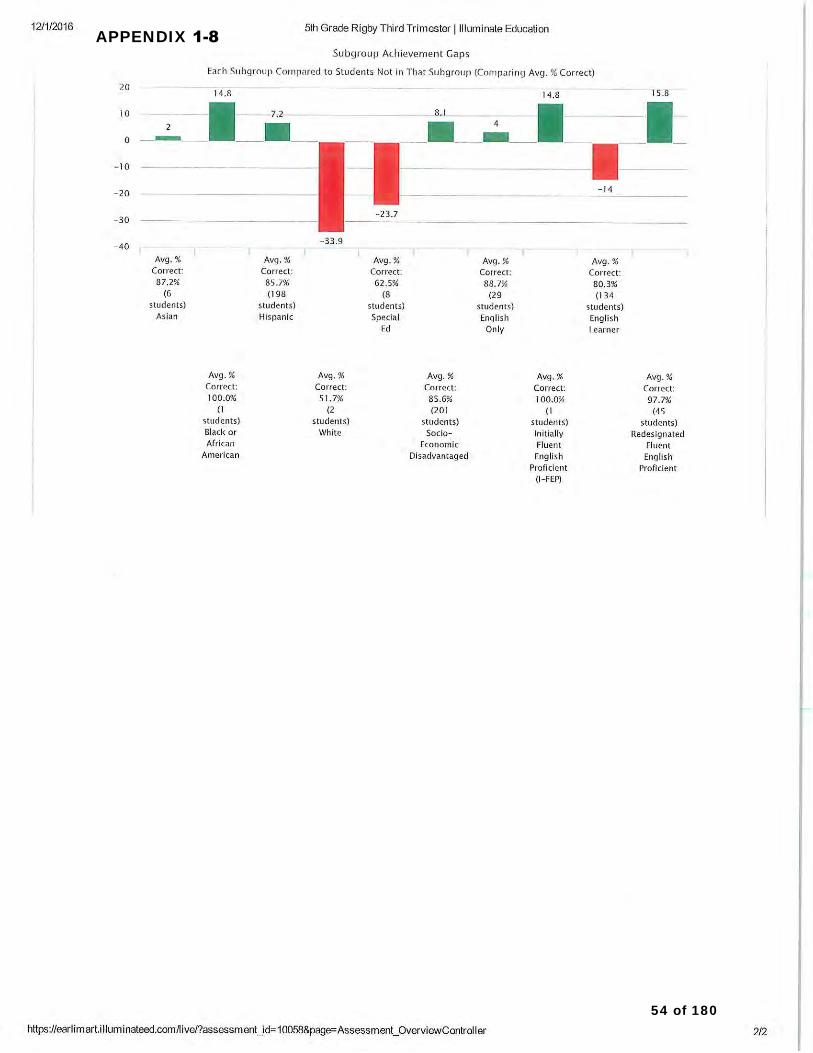
Trimester 3 Rigby Data table for 2015-16 represents the reading levels of students at the end of
the school year. Rigby book levels correlate to the book levels read during guided reading and
progress made during guided reading instruction to meet grade level expectation. The Rigby
results charted shows that nearly each grade 1-5, had approximately half of their population at
or near grade level by the end of trimester 3. Despite the increase in on level readers for 2015-
16, nearly half of each grade level remained below grade level in reading with a disturbing
percentage two or more grade levels behind.
The district administration also noted the lack of correlation between STAR Reading scores,
which measure independent reading levels, and the levels measure by Rigby data. The
administration made the decision to move away from the long used Rigby Reading Assessment.
Teachers and students had become very familiar with the Rigby texts which may have affected
the reliability of score report. The Developmental Reading Assessment by Pearson was selected
for use in the coming 2016-17 school year to measure reading level progress.
10 of 180

DRA Trimester 1 Data 2016-17
Grade Level
Grade Level Met or Exceeded
Approaching Grade Level
Below Grade Level
Growth needed to be on Grade Level by end of
grade level as measured by DRA (Developmental
Reading Assessment)
Gr K
Gr 1 Level 3
or greater
23 Students (13.8%)
Level 2 39
students (23.4%)
Non-Reader to
level1
104 students (62.6%)
Approaching Level Readers (23.4%) of students needed to gain 1 or more book levels to meet grade 1 reading level for T1 (14 levels to meet end of year criteria) Below Level Readers: (62.6%) of students needed to gain three or more levels each to reach grade 1 reading level for T1 (15-16 book levels to meet end of year criteria).
Approaching Level Readers (15.3%) of students needed to gain 2 or more book levels to meet grade 2 reading level for T1 (12 book levels to meet end of year criteria) Below Level Readers: (34.1%%) of students are reading
Level 36 31 Levels 1-
135 at the grade 1 level and needed to
Gr 2 18 or Students Level 16 students students gain 2-12 book levels to meet
greater (17.8%) (15.3%) 14
(66.8%) grade 2 reading level for T1 (6-16 book levels to meet end of year criteria). (32.7%)of students are reading at the grade K level and needed to gain 13-17 book levels to meet grade 2 reading level for T1 ( 17-19 to meet end of year criteria)
Level 10 176
Approaching Level Readers: (5.2%) of students needed to gain 2 book levels to meet grade 3 reading level for T1 (10 book levels to meet end of year criteria) Below Level Readers: (31%) of students are reading at a grade 2 level and needed to gain 8-14 book levels to meet grade 3 reading level for T1 (16-22 to meet end of year criteria).
Gr 3 30 or greater
7 Students (3.6%)
Level 28 Students (5.2%)
Levels 1-22
Students (91%)
(31.7%) of students are reading at a grade 1 reading level and needed to gain 14-16 book levels to meet grade 3 reading level for T1 (22-34 book levels to meet end of year criteria). (23.8%) of students are reading at a grade K level and needed to gain 27-30 book levels to meet grade 3 reading level for T1 (35-38 book levels to meet end of year criteria)
11 of 180

Approaching Level Readers: (5.8%) of students needed to gain 2 book levels to meet the grade 4 reading level for T1. Below Level Readers: (10.9%) of students are reading at the grade 3 level and needed to
Level 32 9 114
gain 6-10 book levels to read at grade 4 reading level for T1. (26.4%) of students are reading at
Gr 4 40 or greater
Students (20.6%)
Level 38 Students (5.8%)
Levels 1-34
Students (73.6%)
grade 2 level and needed to gain 12-22 levels to meet grade 4 reading level for T1. (23.9%) of students are reading at the grade 1 level and needed to gain 24-36 book levels to meet grade 4 reading level for T1. (8.4%) of students are reading at the grade K level and needed to gain 37-40 book levels to meet the grade 4 reading level for T1
Approaching Level Readers (15.4%) of students needed to gain 1-10 book levels to read at the grade 5 reading level for T1. Below Level Readers: (12.8%) of students are reading at a grade 3 level and needed to gain 12 -20 book levels to meet the grade 5 reading level for T1. (29.4%) of students are reading at
Levels 2 Students 12
Levels 1-64 a grade 2 reading level and
Gr 5 Level 40 Students Students needed to gain 22-32 book levels 50 (2.6%)
(15.4%) 38
(82%) to meet the grade 5 reading level for T1. (30.7%) of students are reading at the grade 1 reading level and needed to gain 34-46 book levels to meet grade 5 reading level for T1. (12.8%) of students are reading at the grade K level and needed to gain 47-50 book levels to meet grade 5 reading level for T1
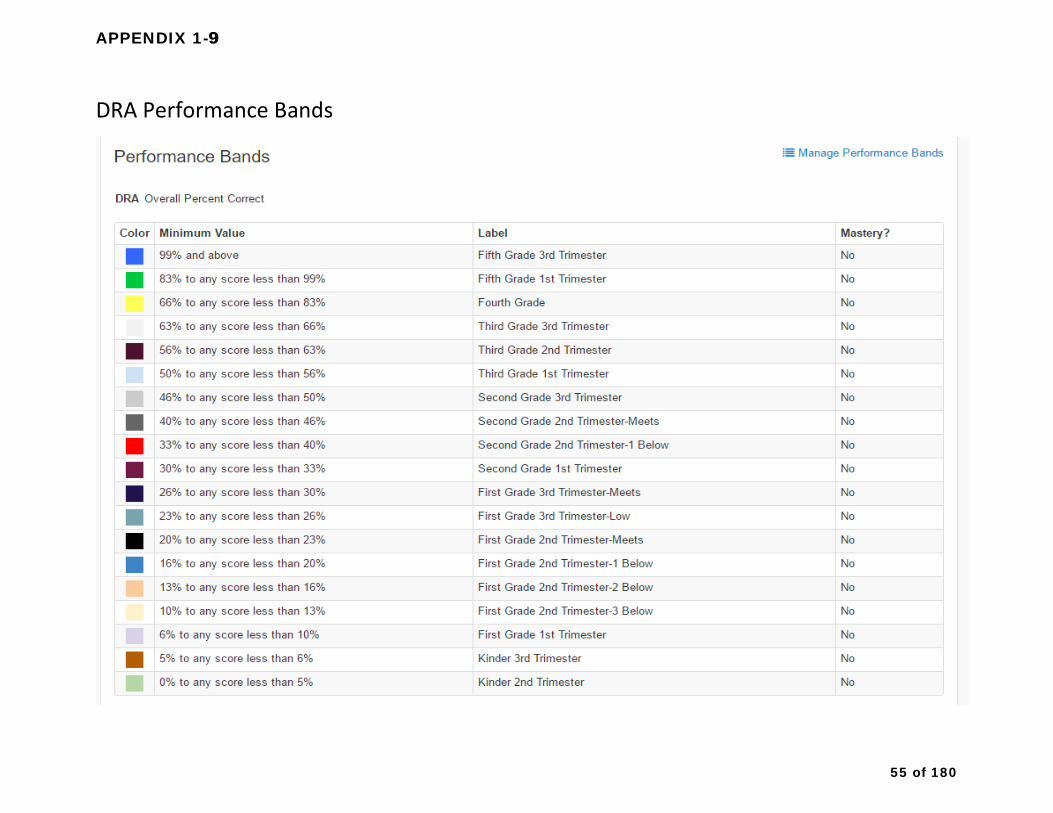
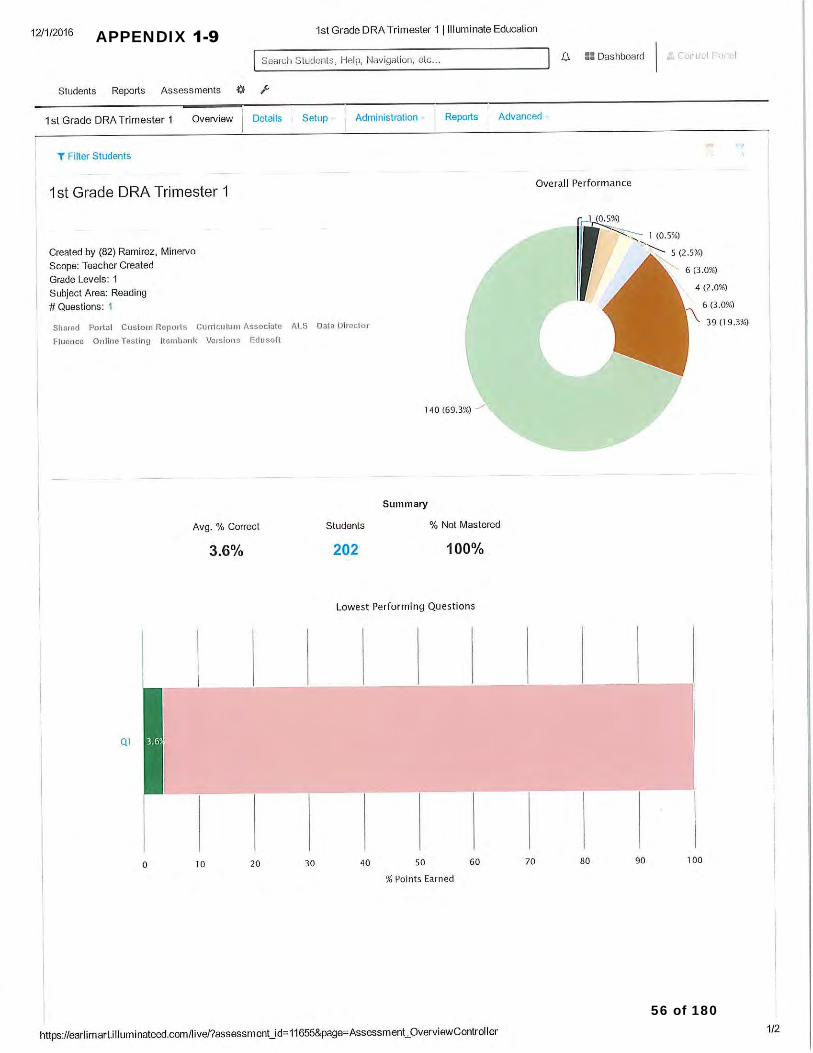
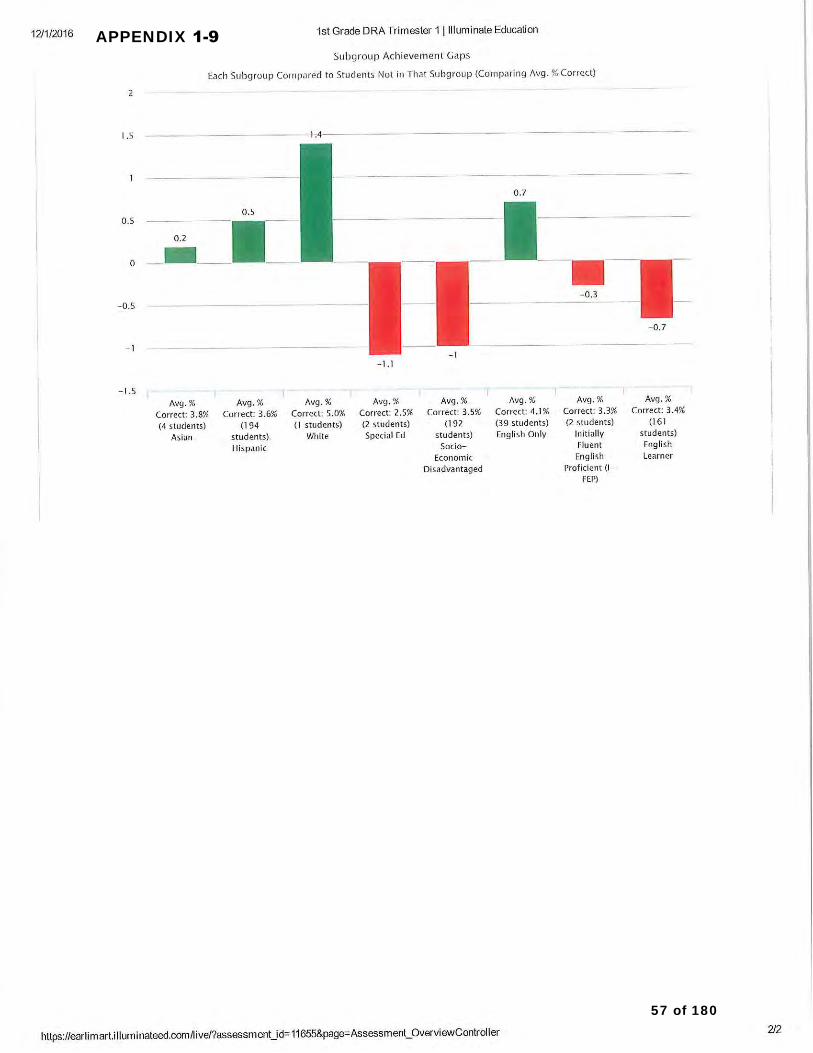
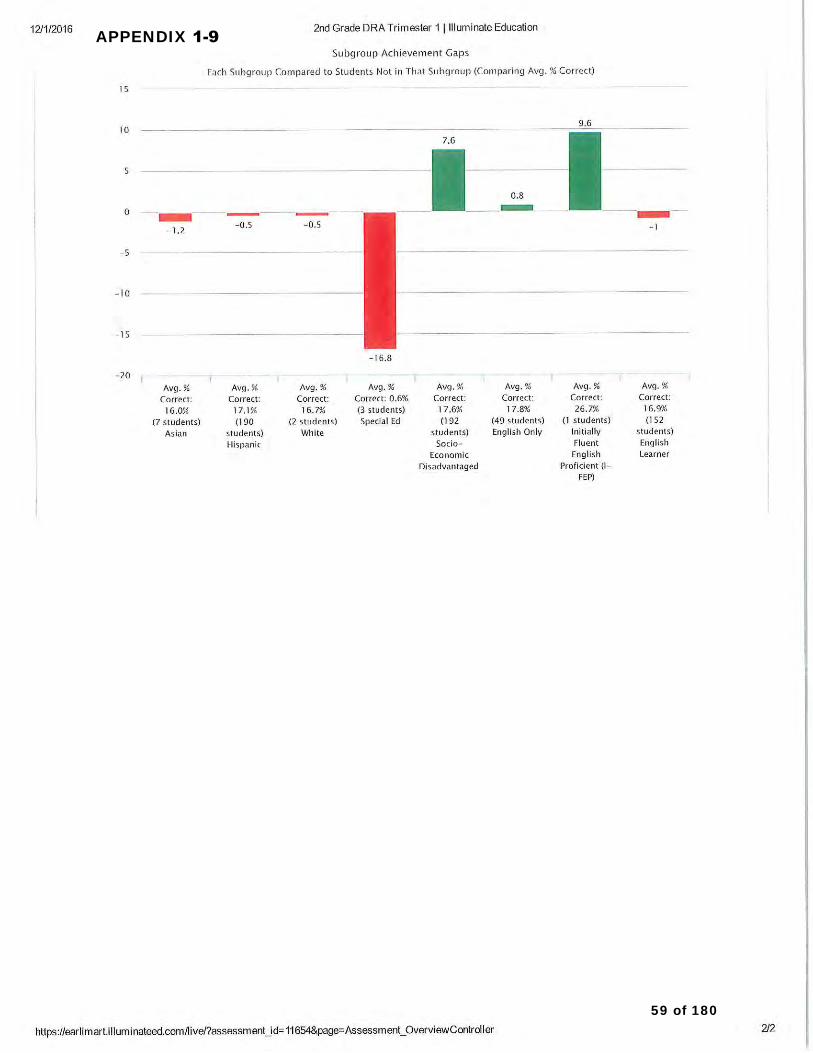
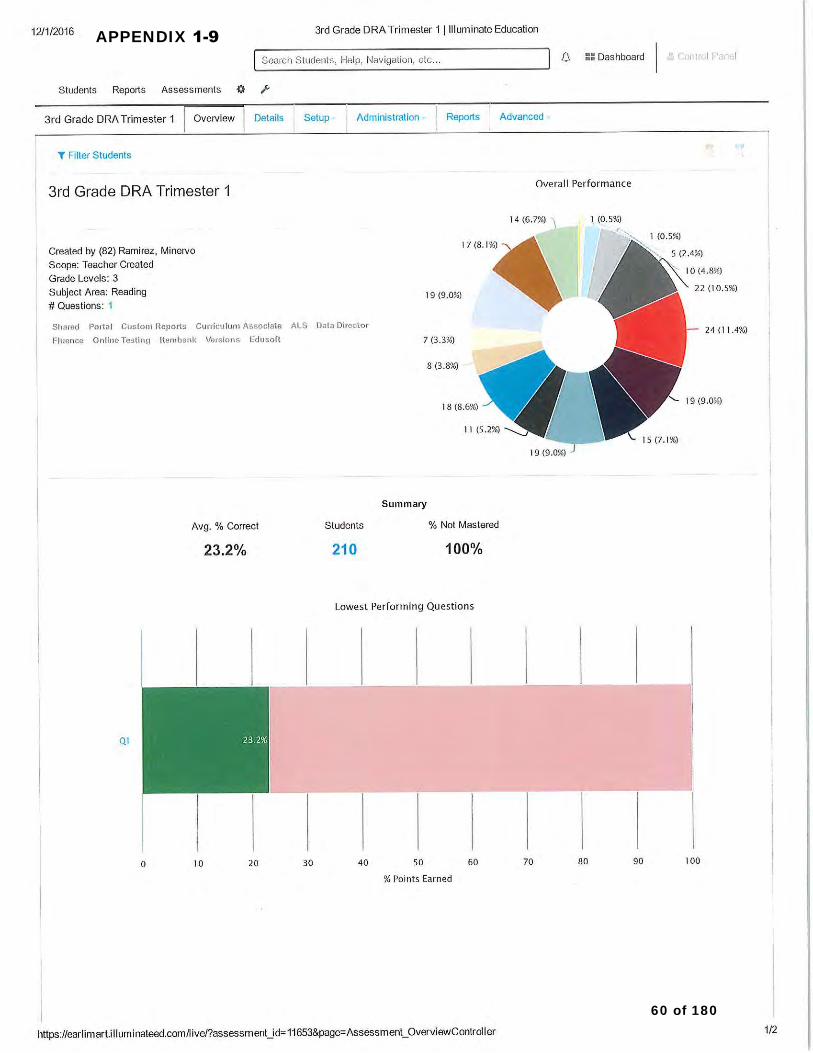
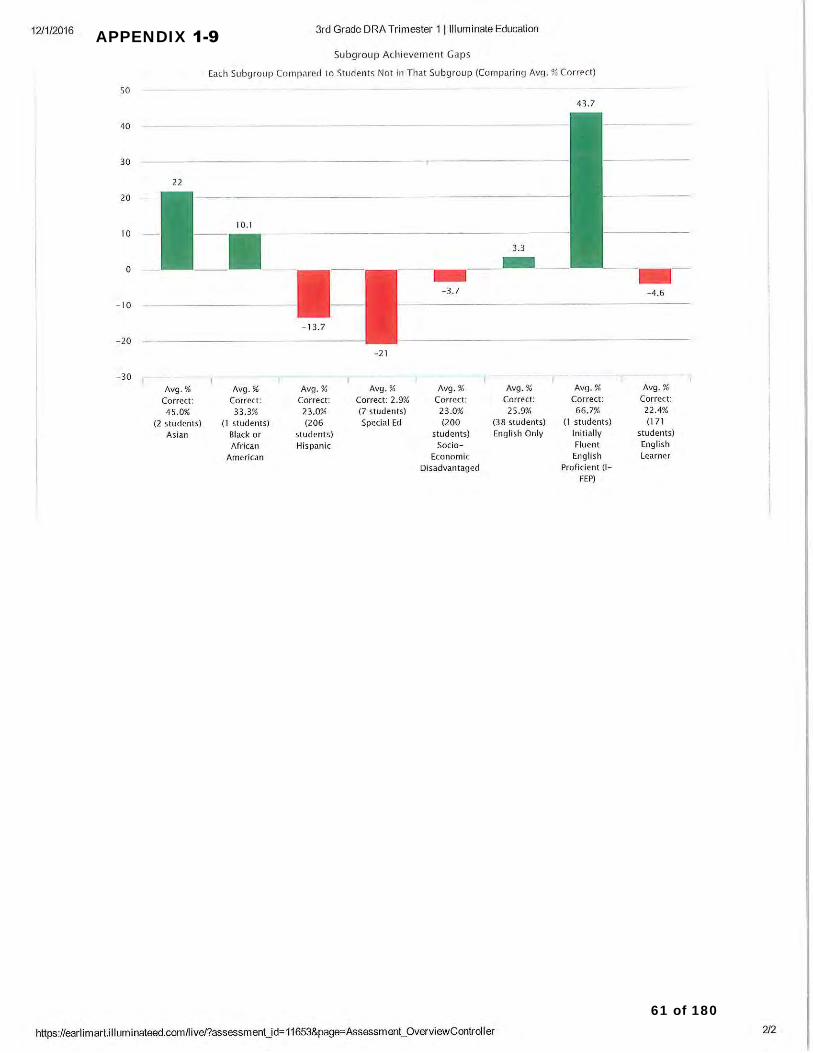
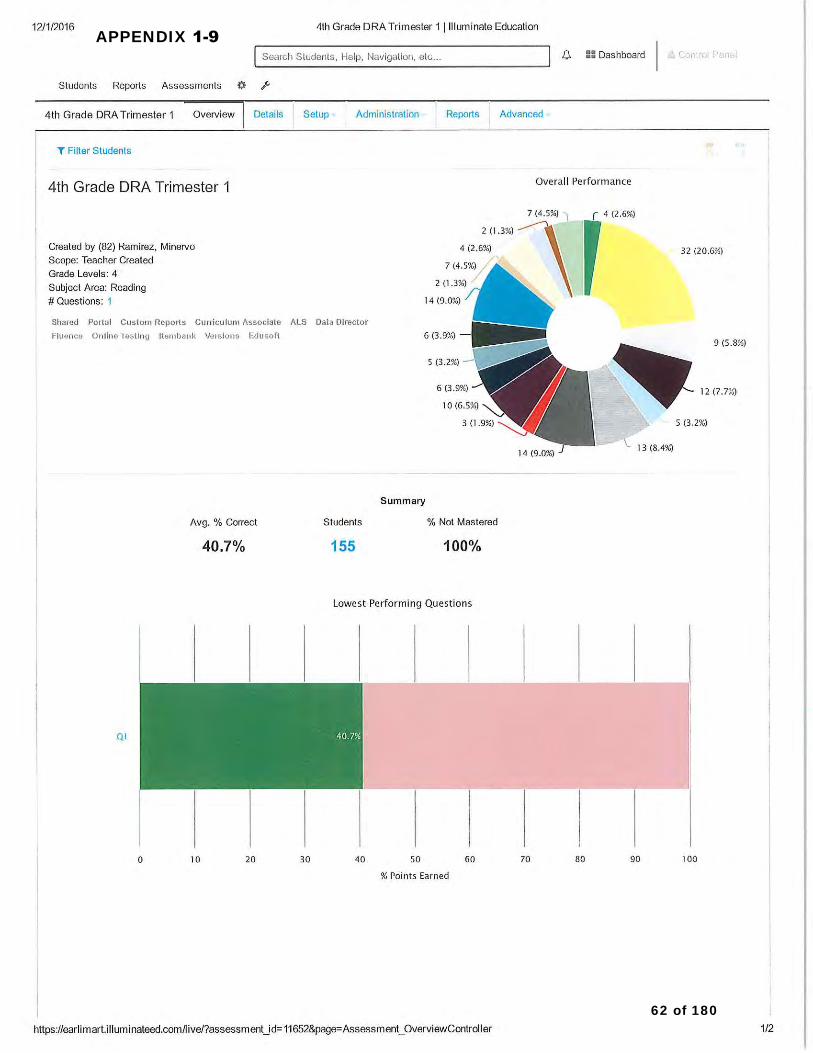
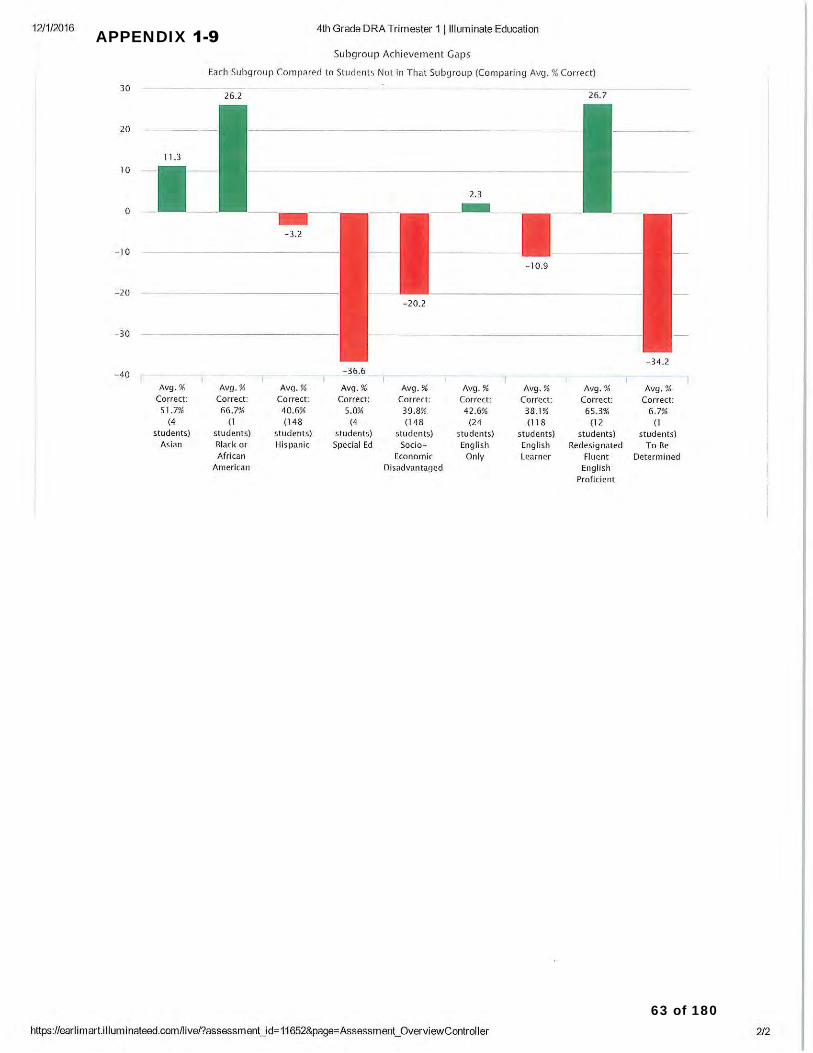
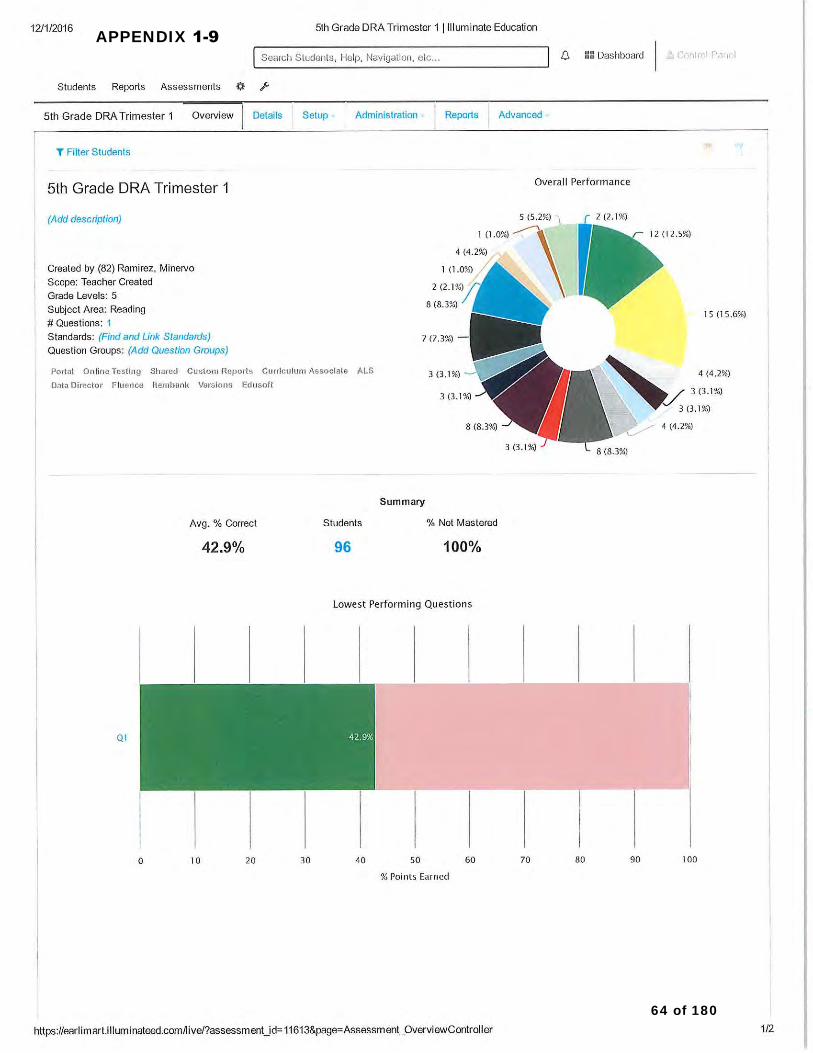
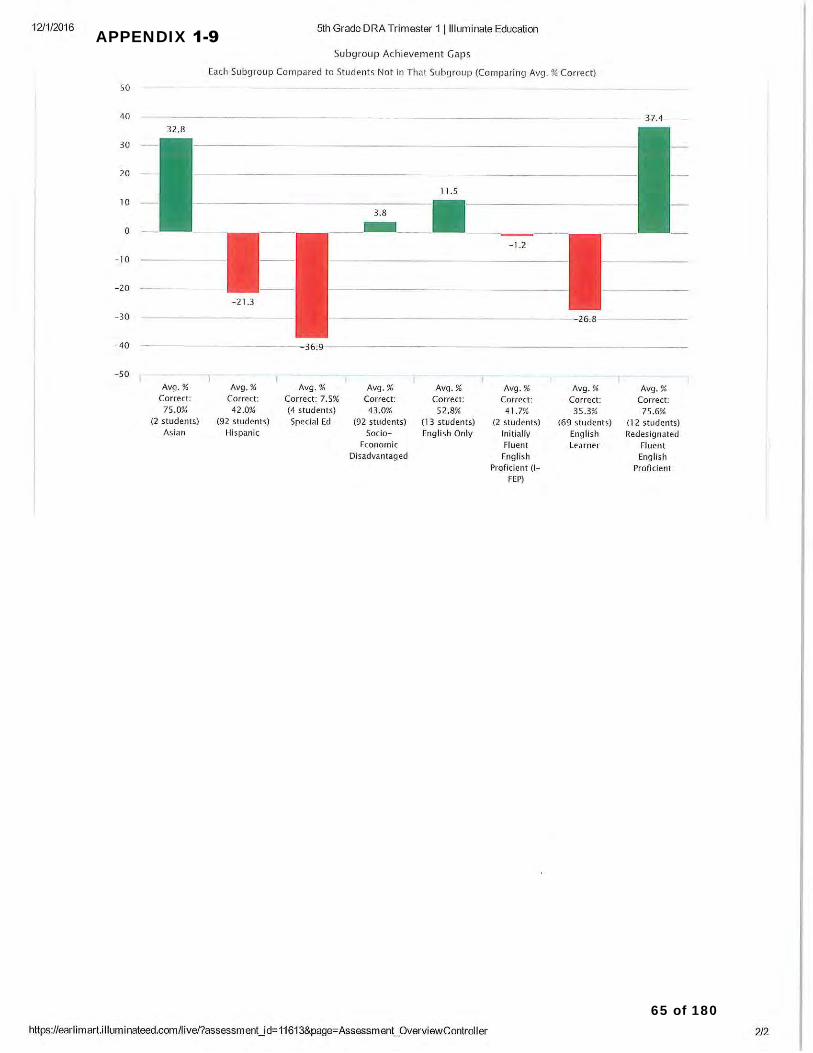
Trimester 1 DRA Data table for 2016-17 represents the reading levels of grade 1-5 students at
the end of Trimester 1. DRA book levels correlate to the book levels read during guided reading
and progress made during guided reading instruction to meet grade level expectation. Reading
levels at each grade reveal that less than half of each grade level have students reading at
trimester grade level expectation, as measured by book level reading. First grade had the
largest number of students (37.2%) at or near the trimester expectation. Third grade had the
lowest number of students (8.8%) reading at or near trimester expectation. Reading scores for
grades 2-5 show that the majority of below level readers are reading consistently two or more
years below grade level.
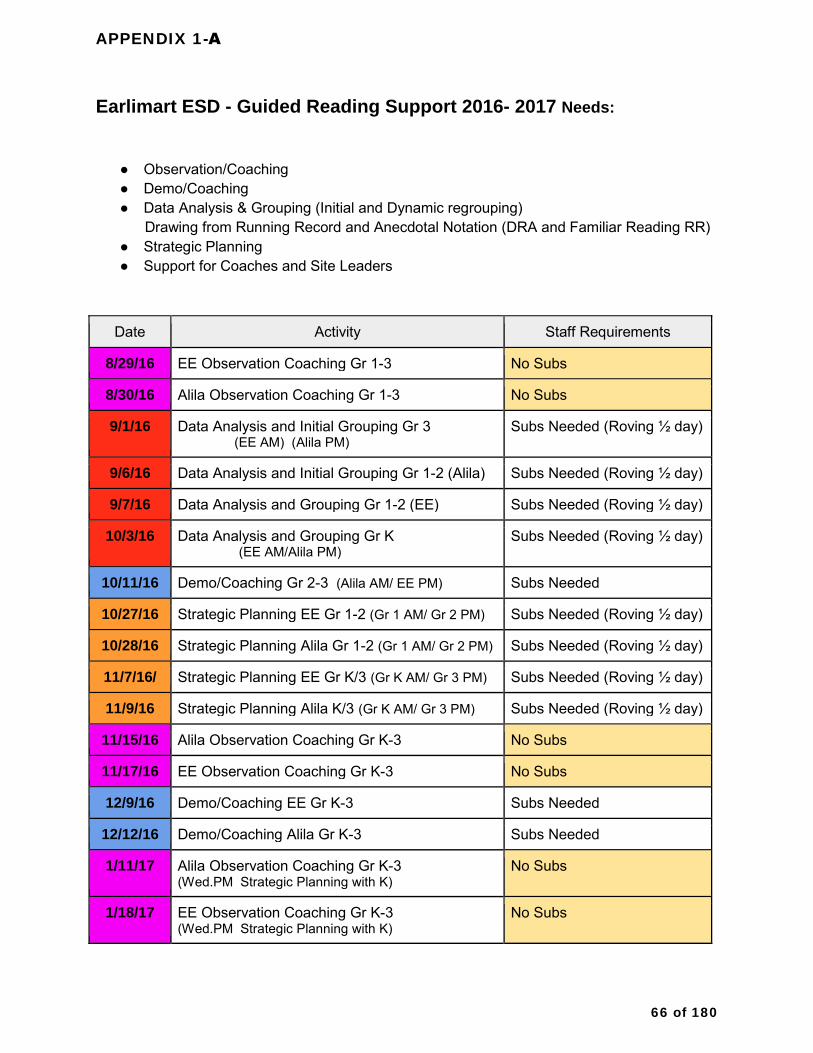
Due to the continued severity of the reading gap, teachers will be provided ongoing support in
the 2016-17 school year to facilitate acceleration of reading progress within guided reading.
Ongoing support in the form of data analysis, strategic planning, classroom coaching and demo
12 of 180
coaching from content experts. (see attached Appendix 1-A – Guided Reading summary of
support).
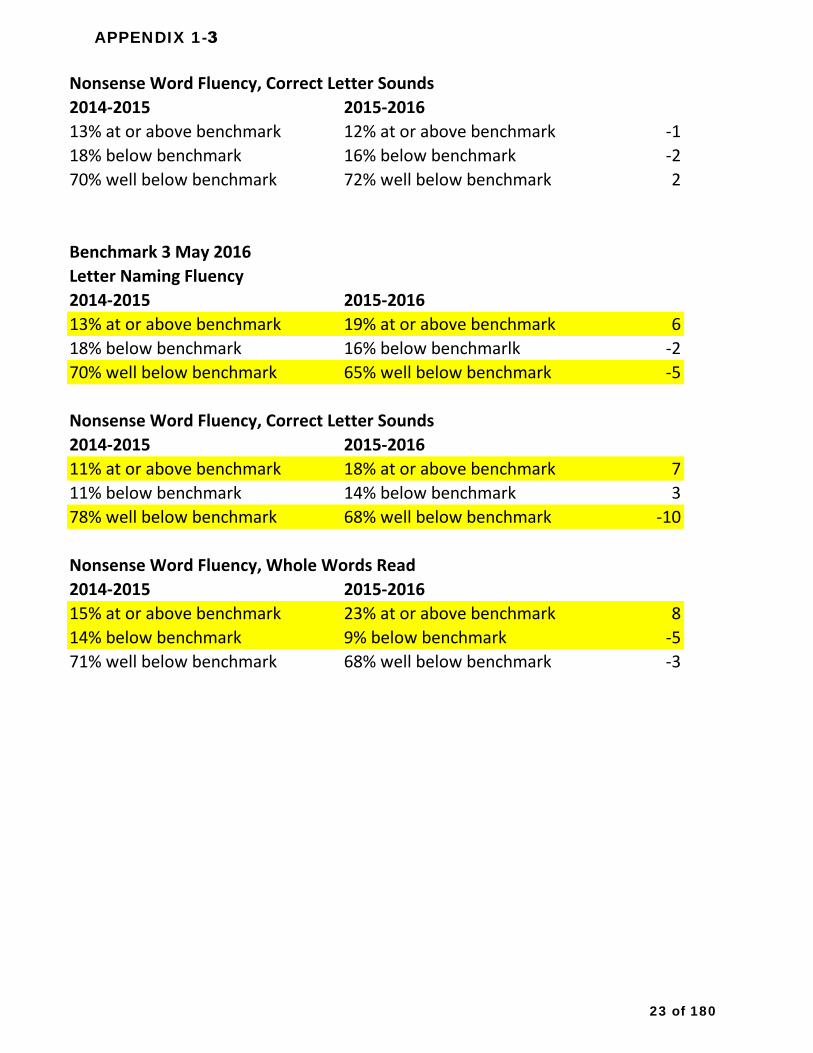
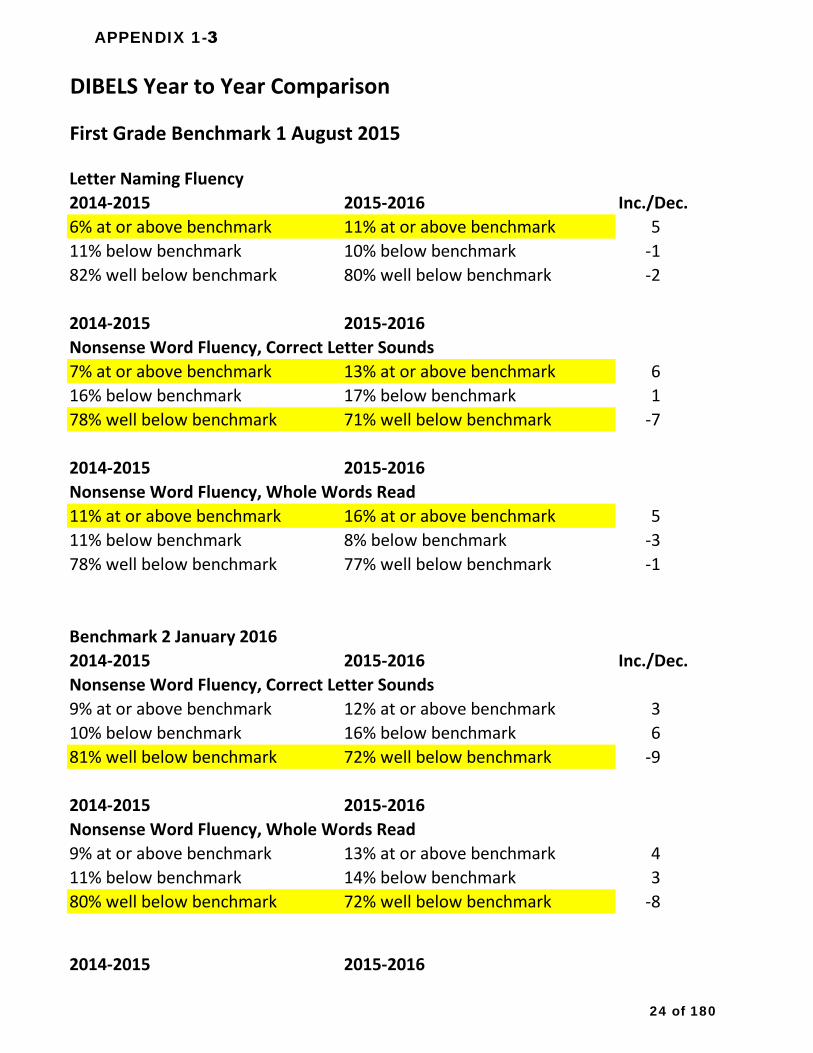
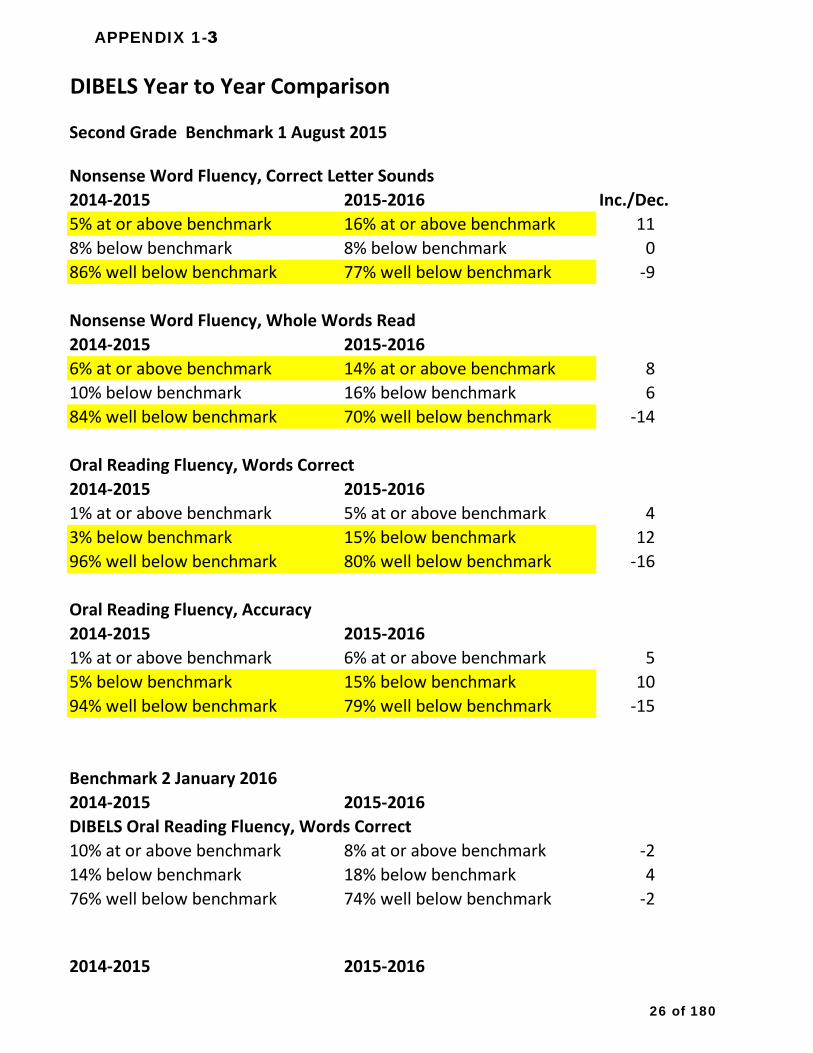
DIBELS Year to Year Comparison Data
The DIBELS year to year comparison data was used to measure growth in phonemic awareness and
phonics skills in grades Kindergarten through grade two, during the 2014-15 school year and to make
year to year comparisons of progress between 2014-15 and 2015-16 school years. The comparison data
revealed largely negative growth in grade K until May 2016 following the implementation of Project
Read. Grade one and two saw moderate gains between year one and two in Nonsense Word Reading
Fluency(NWRF) and Oral Reading Fluency (ORF). Grade two also saw moderate gains in NWRF and ORF
across the two-year comparison with proficiency declining slightly in May of 2015-16.
Although moderate gains were made in phonemic awareness and phonics, student reading proficiency
continues to problematic, teachers will be provided ongoing support in the 2016-17 school year to
facilitate instruction in phonemic awareness, phonics and word study within the context of a balanced
literacy program. Ongoing support in the form of strategic planning, classroom coaching and
demonstration lessons from content experts will be provided throughout the school year. (see attached
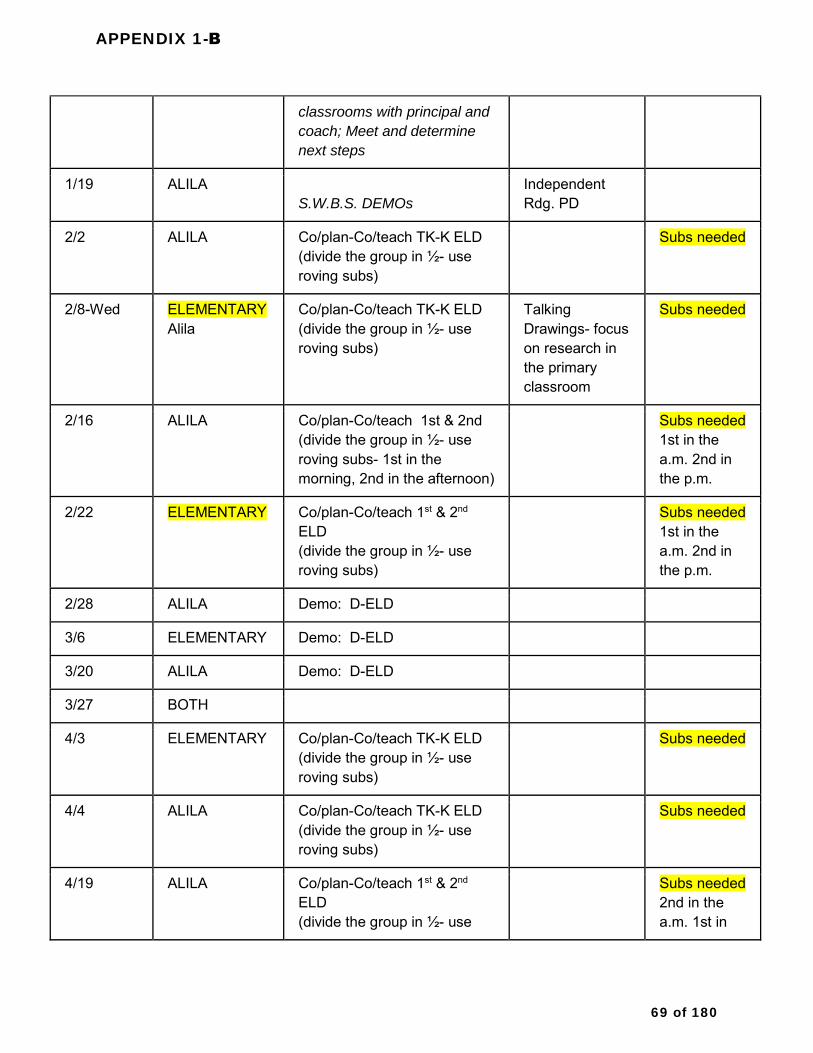
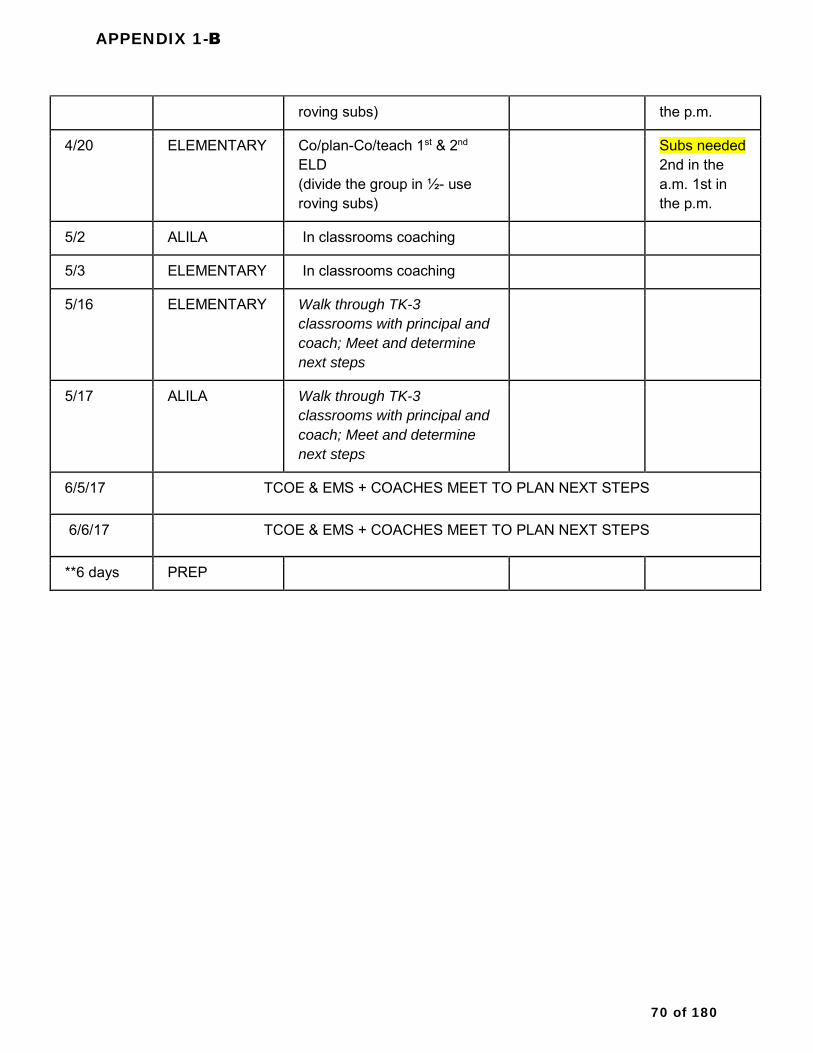
Appendix 1-B – Balanced Literacy summary of support)
District Policies and Criteria
The establishment of district level criteria, for instructional level decision making is a key improvement
factor for the district. In previous years, each site utilized individualized criteria for instructional
decision making, especially as it related to Tier 1 and 2 instruction. With the establishment of district
wide criteria each site is looking at common criteria for providing appropriate instructional supports as
well as using common criteria, for reclassification of level supports needed. This will allow for a more
seamless update and revision to policies over time to reflect the growing level of student reading and
academic proficiency.
Goal #2: Provide comprehensive literacy services to parents of English Learners to improve school
readiness and engage non-English speaking parents in the day-to-day life of their child’s school.
Appendix 2-1 of the executive summary references the gains by English Language Learners as measured
by CELDT. In addition to positive gains on the CELDT assessment, the district also put into place several
initiatives to enhance the support for language at home.
1. Latino Family Literacy Project 2. Summer Book Giveaway 3. Toddler Book Giveaway
Each of the three initiatives were positively received and provided literacy support for families through
reading materials and/or parent education. These programs work to foster a life of literacy at home,
which in turn provides support for at school reading readiness.
Goal #3 Appendix - Circulation data from Destiny Circulation and use of existing library resources has
shown a significant increase in access and usage of resources.
13 of 180

Goal #4 – Goal # 5: Provide adequate library resources to improve college and career readiness for
Earlimart students entering high school and Improve library collections to help support the California
Common Core State Standards. The updating of library collections and increase in materials available
will benefit students for years to come and provides a larger variety of appropriately rigorous texts.
14 of 180

Appendices Table of Contents
Goal #1
1-1. CAASPP ELA overall and growth data
1-2. District Policy on Project Read and Student Study Team
1-3. DIBELS 2-year comparison data
1-4. Decodable Reading Reference Guide
1-5. Guided Reading Exit Policy
1-6. Reading Horizons sample data
1-7. Project Read Guidelines
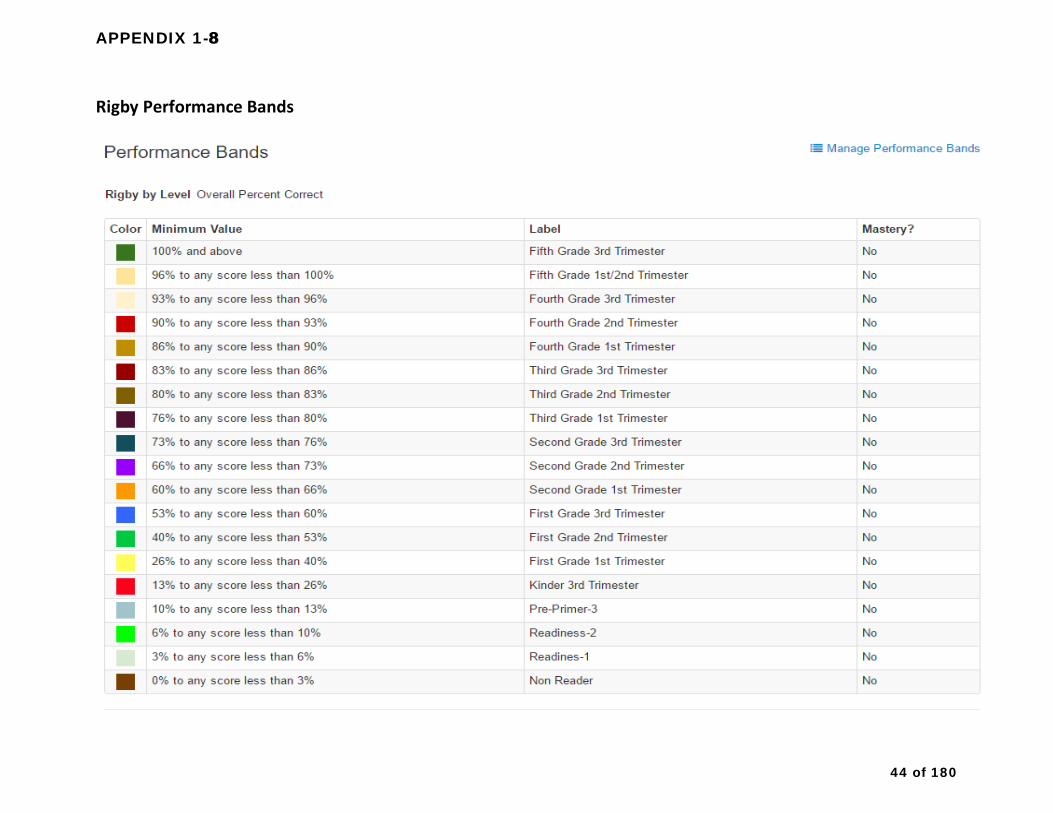
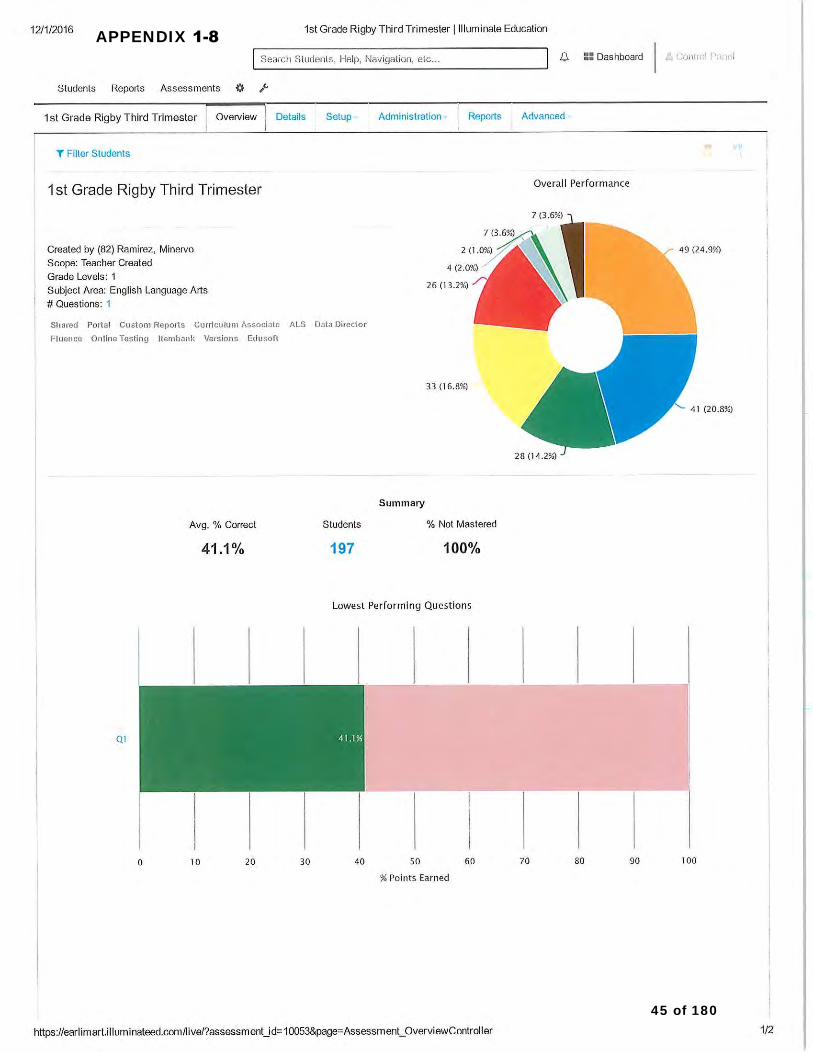
1-8. RIGBY Performance Bands and 2015-16 T3 Grade Level Reports
1-9. DRA Performance Bands and 2016-17 T1 Grade Level Reports
1-A. Summary of Guided Reading Support
1-B. Summary of Balanced Literacy Support
1-C. STAR Reading Level Growth Chart
Goal #2 2-1. 2-year initial CELDT scores highlighting Kindergarten language proficiency scores
2-2. Sample Pre and Post Parent Questionnaires
2-3. Photos of the Literacy Fair
2-4. Latino Family Literacy Project Parent letter
2-5. POs for summer and preschool book giveaways
Goal #3 3-1. Circulation data from Destiny
Goal # 4 4-1. POs for library books 4-2. EL ELA State/County Comparison 4-3. EL CAASPP Growth Data
Goal #5
15 of 180
STAR Reading Results- What Do They Mean?
Test Structure:
There are 34 questions on the STAR Reading assessments. In STAR Reading the first 10 items
are from vocabulary and context, and the remaining 24 questions come from the other
domains. The topics vary by grade level. The STAR Reading Domains are: Word Knowledge and
Skills, Comprehension Strategies and Constructing Meaning, Analyzing Literary Text,
Understanding !uthor’s Craft, and !nalyzing !rgument and Evaluating Text.
Types of Scores:
Scaled Score (SS)- This is a conversion of the STAR results from the test. We have scaled scores
because the test contains so many questions (in order to allow students to have a different test
each time they take it), and there has to be a way to make all of the results comparable. The
scaled scores range from 0-1400. The SS is based on the difficulty of the questions as well as
the pattern of right and wrong answers.
Grade Equivalent (GE)- this indicates the grade placement of students for whom a particular
score is typical. THIS DOES NOT MEAN THE GRADE STUDENTS SHOULD BE IN FOR READING
CLASS! For example, if a student earned a GE of 10.7 then that student obtained a scaled score
as high as the average tenth grade, seventh month student in the norms group (and norms
aren’t necessarily where they are SUPPOSED to be). It is not uncommon for students to receive
scores higher than their current level. It most likely means that the student answered many
questions correctly and thus performed beyond the range of the test for that grade level. The
same could be true for low scores. If a student missed a series of questions, then he/she would
have a low GE. Note: They use the median (not the mean) for this statistic. The range for GE is
0.0 to 12.9+ (from the beginning of Kindergarten to the end of 12th grade). Another note is that
this scale is not an equal-interval scale. For example, an increase of 50 Scaled Score points
might only be 2-3 months change at the younger grades but may be over a year of change at
the HS level. This is because student growth in reading is not linear; it occurs much more
rapidly at the younger grades and slows down after the middle years.
There is a conversion chart available that will show the range of SS that is used to determine
each GE. Let me know if you would like a copy.
Estimated Oral Fluency (Est. ORF)- is an estimate of a student’s ability to read words quickly
and accurately in order to comprehend text efficiently. Students with ORF demonstrate
accurate decoding, automatic word recognition, and appropriate use of the rhythmic aspects of
the language (intonation, phrasing, pitch, and emphasis). It is reported as an estimated number
16 of 180
of words a student can read correctly within a one-minute time span on grade-level-
appropriate text (connected text in a comprehensible passage form that has a readability level
within the range of the first half of the school year). For example, an Est. ORF score of 60 for a
2nd grade student means the student is expected to read about 60 words correctly within one
minute on a passage that has a readability level between 2.0-2.5.
Instructional Reading Level (IRL)- this is a criterion-referenced score that is an estimate of the
most appropriate level of reading material for instruction (the level at which students can
recognize words and comprehend written instructional material with some help). The IRL is
defined as the highest reading level at which a student can comprehend 80% or more of the
words in each passage correctly. IRLs are represented by either letters or numbers indicating a
particular grade. IRL letter codes include: Pre-Primer (PP), Primer, grades .1-.9 (P), and Post
High School (PHS), grades 13.0+.
Note: In general, IRLs and GEs will differ. These differences are caused by the fact that they are
designed to provide different information. IRLs estimate the level of text that a student can
read with some help, and the GEs express a student’s performance in terms of the grade level
for which that performance is typical.
Percentile Rank (PR)- a norm-referenced score that shows the percentage of students in the
same grade and at the same point of time in the school year nationally who obtained scores
lower than the score of a particular student. For example a PR of 85 means that the student
scored higher than 85% of other students in that grade at that same time of year. The range of
percentile ranks is 1-99. It is not an equal-interval scale, so these scores should not be
averaged.
Normal Curve Equivalent (NCE)- scores that have been scaled in such a way that they have a
normal distribution. They also range from 1-99 so they appear similar to PRs, but these are
based on an equal interval scale. The NCEs are useful for statistical analyses and therefore do
not have a lot of meaning for sharing data with parents.
Zone of Proximal Development (ZPD)- this defines the readability range for which students
should be selecting books in order to ensure sufficient comprehension and achieve optimal
growth in reading comprehension without getting too frustrated. The ZPDs are based on the
GEs in STAR Reading.
So What Do We Use?
17 of 180
The scores to be used depend on the information desired. If you want to compare students at a
national level you would use PR or GE. If you are selected reading material for your students
you will want to look at the IRL. If you are sharing information with parents regarding the
student’s reading ability, I would share the GE, Est. ORF and IRL. This will give them information
regarding reading levels as well as how the student is doing on a variety of skills related to
reading.
18 of 180
APPENDIX 1-1
19 of 180
APPENDIX 1-1
20 of 180

APPENDIX 1-2
Phonics RtI Path for Sound Partners
Entry into Sound Partners will be based on Project Read performance
Tier 1: Student passes all Project Read assessments—no change in instruction
Tier 2 (in class): If a student does not pass one Project Read assessment, teachers must intervene in class and notify the principal. Available interventions include:
• Use extra decodables beyond what the other students are using (Decodable Reading Reference Guide link https://drive.google.com/open?id=0B6y2HwwEe5kkRlN2cFNSQloyRzg)
• Include the student into an additional guided reading group with the instructional aide so that he/she gets a “double dose” of guided reading
• Intervene using resources from the Lexia Lesson Library • Intervene using the appropriate “If…Then” mini-lessons from DRA if they
are available. • Deployed intervention time based on analyzed PLC data
DON’T WAIT—NOTIFY YOUR PRINCIPAL IMMEDIATELY AND ASK HER FOR HELP
All interventions should be documented with dates and data. Data should include:
o Running records from decodables o Completed Lexia lesson samples o DRA mini-lesson samples o Any other completed or attempted work sample that
demonstrates the student’s progress on an intervention lesson
Tier 2 (intensive): Student does not pass two consecutive Project Read assessments, even with the above supports.
• Student will have an SST scheduled to discuss the interventions and the results.
• During the SST, include Sound Partners as an additional intervention.
Tier 3: If a student passes fewer than 10 lessons in 30 instructional days, they should have an SST 2 where the parent signs an assessment plan for the student to be screened for Special Education.
21 of 180

APPENDIX 1-3
DIBELS Year to Year Comparison
Kindergarten Benchmark 1 August 2015
First Sound Fluency 2014-2015 19% at or above benchmark 9% below benchmark 72% well below benchmark
2014-2015 Letter Naming Fluency 23% at or above benchmark 10% below benchmark 68% well below benchmark
Benchmark 2 January 2016
First Sound Fluency 2014-2015 8% at or above benchmark 7% below benchmark 86% well below benchmark
2014-2015 Letter Naming Fluency 14% at or above benchmark 12% below benchmark 74% well below benchmark
2014-2015 Phoneme Segmentation Fluency 3% at or above benchmark 10% below benchmark
2015-2016 Inc./Dec. 13% at or above benchmark -6 9% below benchmark 0 78% well below benchmark 6
2015-2016
17% at or above benchmark -6 9% below benchmark -1 73% well below benchmark 5
Inc./Dec. 2015-2016 4% at or above benchmark -4 9% below benchmark 2 87% well below benchmark 1
2015-2016
12% at or above benchmark -2 17% below benchmark 5 71% well below benchmark -3
2015-2016
4% at or above benchmark 1 6% below benchmark -4
88% well below benchmark 90% well below benchmark 2
22 of 180
APPENDIX 1-3
Nonsense Word Fluency, Correct Letter Sounds 2014-2015 13% at or above benchmark 18% below benchmark 70% well below benchmark
Benchmark 3 May 2016 Letter Naming Fluency 2014-2015 13% at or above benchmark 18% below benchmark 70% well below benchmark
2015-2016 12% at or above benchmark -1 16% below benchmark -2 72% well below benchmark 2
2015-2016 19% at or above benchmark 6 16% below benchmarlk -2 65% well below benchmark -5
Nonsense Word Fluency, Correct Letter Sounds 2014-2015 2015-2016 11% at or above benchmark 18% at or above benchmark 7 11% below benchmark 14% below benchmark 3 78% well below benchmark 68% well below benchmark -10
Nonsense Word Fluency, Whole Words Read 2014-2015 15% at or above benchmark 14% below benchmark 71% well below benchmark
2015-2016 23% at or above benchmark 8 9% below benchmark -5 68% well below benchmark -3
23 of 180
APPENDIX 1-3
DIBELS Year to Year Comparison
First Grade Benchmark 1 August 2015
Letter Naming Fluency 2014-2015 2015-2016 Inc./Dec. 6% at or above benchmark 11% at or above benchmark 5 11% below benchmark 10% below benchmark -1 82% well below benchmark 80% well below benchmark -2
2014-2015 2015-2016 Nonsense Word Fluency, Correct Letter Sounds 7% at or above benchmark 13% at or above benchmark 6 16% below benchmark 17% below benchmark 1 78% well below benchmark 71% well below benchmark -7
2014-2015 2015-2016 Nonsense Word Fluency, Whole Words Read 11% at or above benchmark 16% at or above benchmark 5 11% below benchmark 8% below benchmark -3 78% well below benchmark 77% well below benchmark -1
24 of 180
Benchmark 2 January 2016 2014-2015 2015-2016 Inc./Dec. Nonsense Word Fluency, Correct Letter Sounds 9% at or above benchmark 12% at or above benchmark 3 10% below benchmark 16% below benchmark 6 81% well below benchmark 72% well below benchmark -9
2014-2015 2015-2016 Nonsense Word Fluency, Whole Words Read 9% at or above benchmark 13% at or above benchmark 4 11% below benchmark 14% below benchmark 3 80% well below benchmark 72% well below benchmark -8
2014-2015 2015-2016

APPENDIX 1-3
DIBELS Oral Reading Fluency, Words Correct 15% at or above benchmark 22% at or above benchmark 7 17% below benchmark 19% below benchmark 2 68% well below benchmark 60% well below benchmark -8
2014-2015 2015-2016 DIBELS Oral Reading Fluency, Accuracy 14% at or above benchmark 21% at or above benchmark 7 15% below benchmark 18% below benchmark 3 71% well below benchmark 61% well below benchmark -10
Benchmark 3 May 2016 2014-2015 2015-2016 Inc./Dec. Nonsense Word Fluency, Correct Letter Sounds 6% at or above benchmark 15% at or above benchmark 9 16% below benchmark 25% below benchmark 9 78% well below benchmark 60% well below benchmark -18
2014-2015 2015-2016 Nonsense Word Fluency, Whole Words Read 8% at or above benchmark 17% at or above benchmark 9 15% below benchmark 20% below benchmark 5 78% well below benchmark 63% well below benchmark -13
2014-2015 2015-2016 DIBELS Oral Reading Fluency, Words Correct 11% at or above benchmark 15% at or above benchmark 4 21% below benchmark 25% below benchmark 4 73% well below benchmark 60% well below benchmark -13
25 of 180
APPENDIX 1-3
DIBELS Year to Year Comparison
Second Grade Benchmark 1 August 2015
Nonsense Word Fluency, Correct Letter Sounds 2014-2015 2015-2016 Inc./Dec. 5% at or above benchmark 16% at or above benchmark 11 8% below benchmark 8% below benchmark 0 86% well below benchmark 77% well below benchmark -9
Nonsense Word Fluency, Whole Words Read 2014-2015 2015-2016 6% at or above benchmark 14% at or above benchmark 8 10% below benchmark 16% below benchmark 6 84% well below benchmark 70% well below benchmark -14
Oral Reading Fluency, Words Correct 2014-2015 1% at or above benchmark 3% below benchmark 96% well below benchmark
Oral Reading Fluency, Accuracy 2014-2015 1% at or above benchmark 5% below benchmark 94% well below benchmark
Benchmark 2 January 2016 2014-2015
2015-2016 5% at or above benchmark 4 15% below benchmark 12 80% well below benchmark -16
2015-2016 6% at or above benchmark 5 15% below benchmark 10 79% well below benchmark -15
2015-2016 DIBELS Oral Reading Fluency, Words Correct 10% at or above benchmark 8% at or above benchmark -2 14% below benchmark 18% below benchmark 4 76% well below benchmark 74% well below benchmark -2
2014-2015 2015-2016
26 of 180
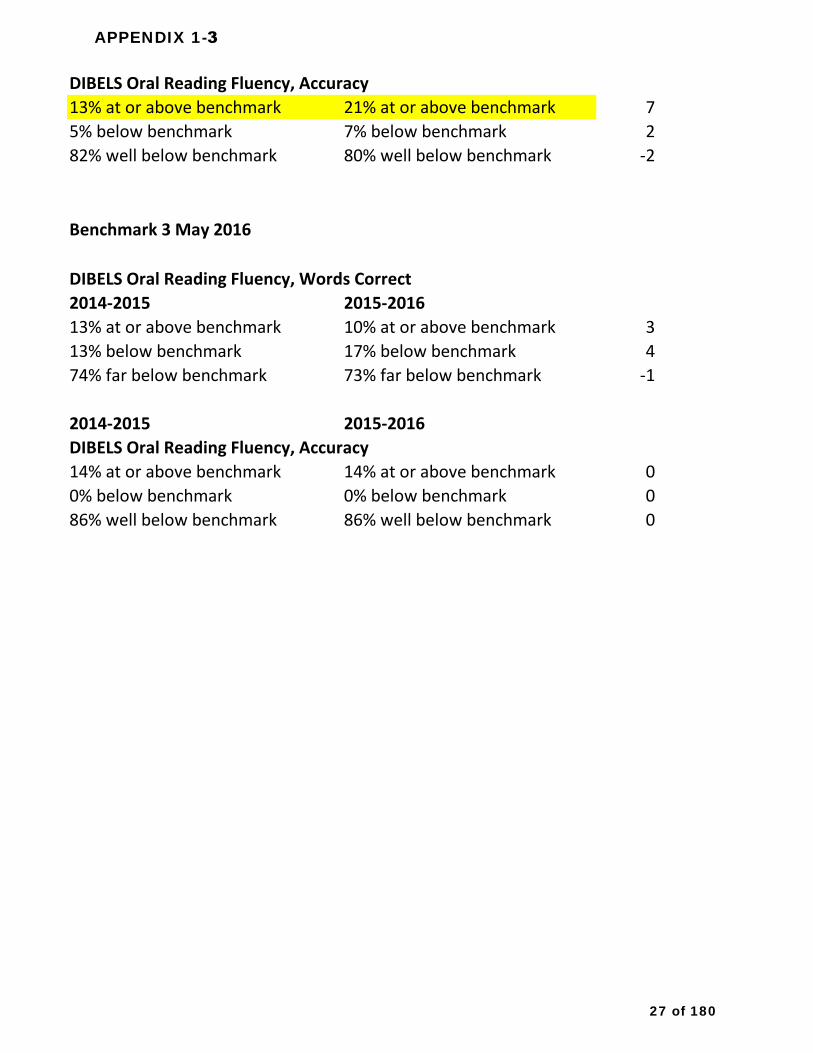
APPENDIX 1-3
DIBELS Oral Reading Fluency, Accuracy 13% at or above benchmark 21% at or above benchmark 7 5% below benchmark 7% below benchmark 2 82% well below benchmark 80% well below benchmark -2
Benchmark 3 May 2016
DIBELS Oral Reading Fluency, Words Correct 2014-2015 2015-2016 13% at or above benchmark 10% at or above benchmark 3 13% below benchmark 17% below benchmark 4 74% far below benchmark 73% far below benchmark -1
2014-2015 2015-2016 DIBELS Oral Reading Fluency, Accuracy 14% at or above benchmark 14% at or above benchmark 0 0% below benchmark 0% below benchmark 0 86% well below benchmark 86% well below benchmark 0
27 of 180
APPENDIX 1-4
28 of 180
APPENDIX 1-4
29 of 180
APPENDIX 1-4
30 of 180
APPENDIX 1-4
31 of 180
APPENDIX 1-4
32 of 180
APPENDIX 1-4
33 of 180
APPENDIX 1-4
34 of 180
APPENDIX 1-4
35 of 180

APPENDIX 1-4
36 of 180
APPENDIX 1-4
37 of 180
APPENDIX 1-4
38 of 180
APPENDIX 1-4
39 of 180
APPENDIX 1-4
40 of 180

APPENDIX 1-5
Guided Reading Exit Policy
When students reach grade level in DRA, compare their
DRA data to their STAR data. They should be at the
correct year and month in the STAR IRL.
Check the GP which is the grade placement for the
student. It tells where the STAR system has placed
them in terms of grade level and months.
Students below that level in the STAR IRL should
continue in guided reading with different books such
as Sundance readers, Scholastic non-fiction readers
and other leveled books.
Second grade has an additional data point to
consider. DIBELS Oral Reading Fluency (DORF) can
also be compared to students’ DRA levels and STAR
scores. The more data points we consider, the
stronger readers we will produce.
41 of 180
APPENDIX`1-6
42 of 180
APPENDIX`1-7
43 of 180
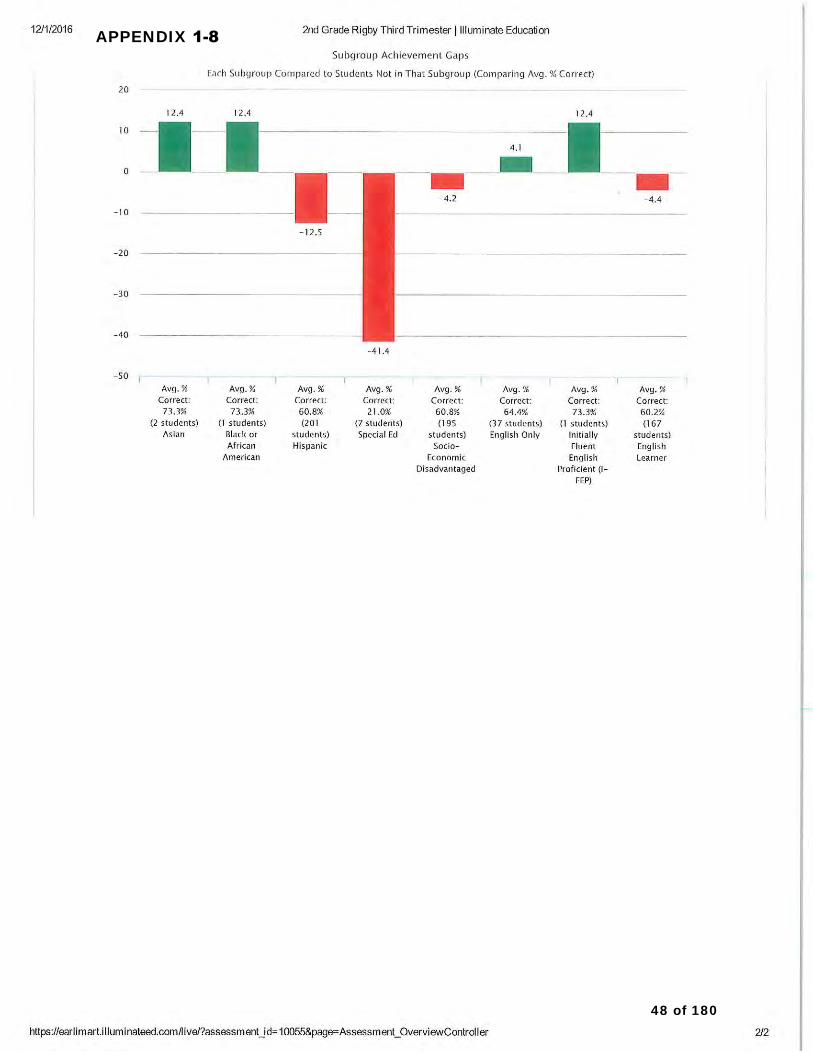
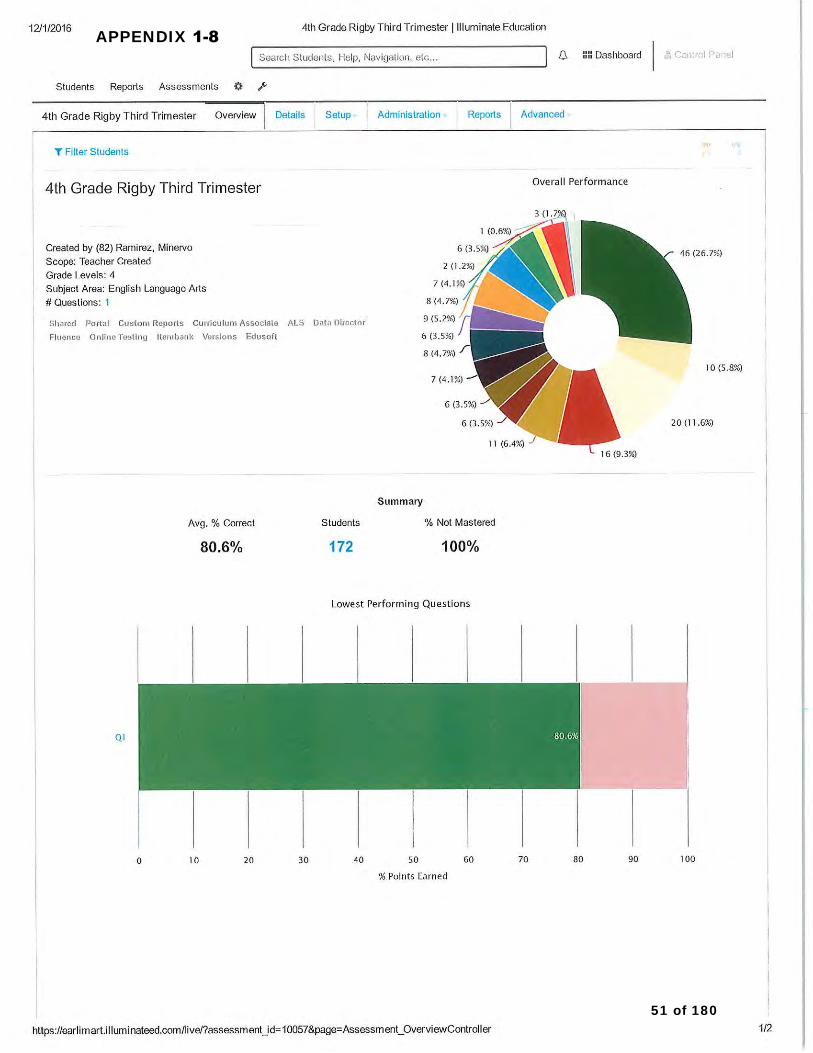
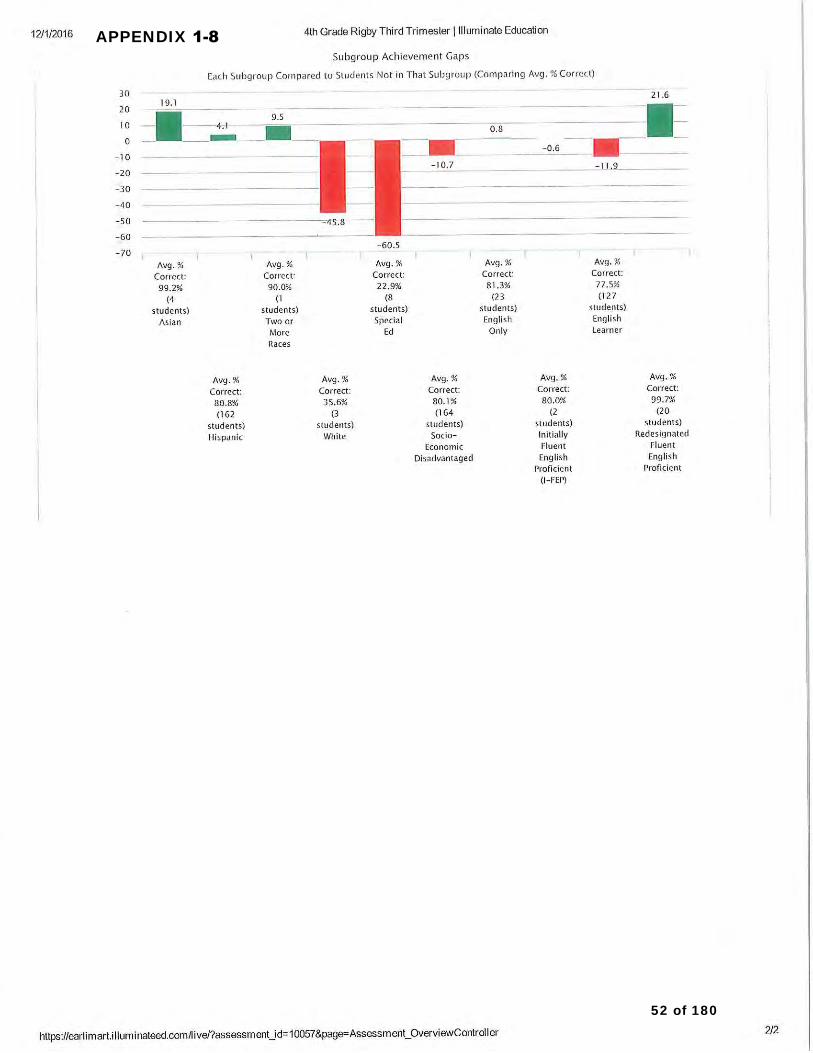
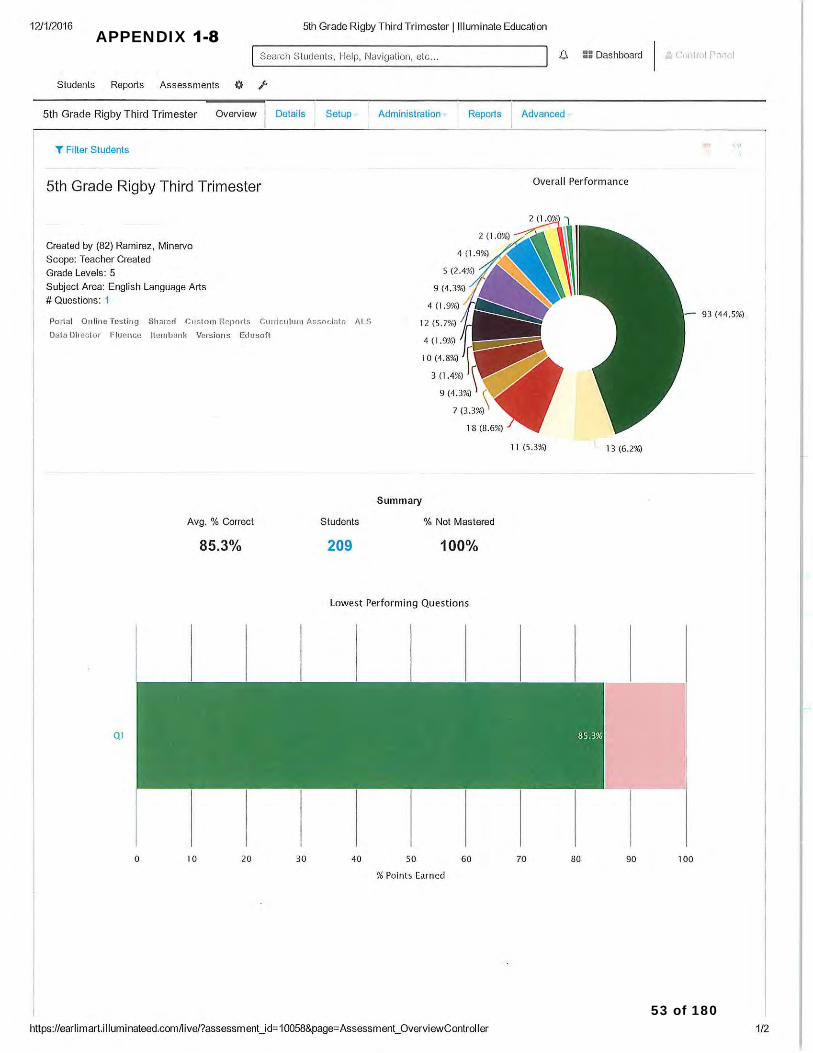
APPENDIX 1-8
Rigby Performance Bands
44 of 180
APPENDIX`1-8
45 of 180
APPENDIX`1-8
46 of 180
APPENDIX`1-8
47 of 180
APPENDIX`1-8
48 of 180
APPENDIX`1-8
49 of 180
APPENDIX`1-8
50 of 180
APPENDIX`1-8
51 of 180
APPENDIX`1-8
52 of 180
APPENDIX`1-8
53 of 180
APPENDIX`1-8
54 of 180
APPENDIX 1-9
DRA Performance Bands
55 of 180
APPENDIX`1-9
56 of 180
APPENDIX`1-9
57 of 180

APPENDIX`1-9
58 of 180
APPENDIX`1-9
59 of 180
APPENDIX`1-9
60 of 180
APPENDIX`1-9
61 of 180
APPENDIX`1-9
62 of 180
APPENDIX`1-9
63 of 180
APPENDIX`1-9
64 of 180
APPENDIX`1-9
65 of 180
APPENDIX 1-A
Earlimart ESD - Guided Reading Support 2016- 2017 Needs:
● Observation/Coaching ● Demo/Coaching ● Data Analysis & Grouping (Initial and Dynamic regrouping)
Drawing from Running Record and Anecdotal Notation (DRA and Familiar Reading RR) ● Strategic Planning ● Support for Coaches and Site Leaders
Date Activity Staff Requirements
8/29/16
8/30/16
9/1/16
9/6/16
9/7/16
10/3/16
10/11/16
10/27/16
10/28/16
11/7/16/
11/9/16
11/15/16
11/17/16
12/9/16
12/12/16
1/11/17
1/18/17
EE Observation Coaching Gr 1-3 No Subs
Alila Observation Coaching Gr 1-3 No Subs
Data Analysis and Initial Grouping Gr 3 (EE AM) (Alila PM)
Subs Needed (Roving ½ day)
Data Analysis and Initial Grouping Gr 1-2 (Alila) Subs Needed (Roving ½ day)
Data Analysis and Grouping Gr 1-2 (EE) Subs Needed (Roving ½ day)
Data Analysis and Grouping Gr K (EE AM/Alila PM)
Subs Needed (Roving ½ day)
Demo/Coaching Gr 2-3 (Alila AM/ EE PM) Subs Needed
Strategic Planning EE Gr 1-2 (Gr 1 AM/ Gr 2 PM) Subs Needed (Roving ½ day)
Strategic Planning Alila Gr 1-2 (Gr 1 AM/ Gr 2 PM) Subs Needed (Roving ½ day)
Strategic Planning EE Gr K/3 (Gr K AM/ Gr 3 PM) Subs Needed (Roving ½ day)
Strategic Planning Alila K/3 (Gr K AM/ Gr 3 PM) Subs Needed (Roving ½ day)
Alila Observation Coaching Gr K-3 No Subs
EE Observation Coaching Gr K-3 No Subs
Demo/Coaching EE Gr K-3 Subs Needed
Demo/Coaching Alila Gr K-3 Subs Needed
Alila Observation Coaching Gr K-3 (Wed.PM Strategic Planning with K)
No Subs
EE Observation Coaching Gr K-3 (Wed.PM Strategic Planning with K)
No Subs
66 of 180

APPENDIX 1-A
3/1/17 Strategic Planning EE (Gr K/1 PM - Gr 2/3 AM) Subs Needed (Roving)
3/2/17 Strategic Planning Alila (Gr K/1 PM - Gr 2/3 AM) Subs Needed (Roving)
5/9/17 EE Observation Coaching Gr K-3 No Subs
5/10/17 Alila Observation Coaching Gr K-3 No Subs
67 of 180
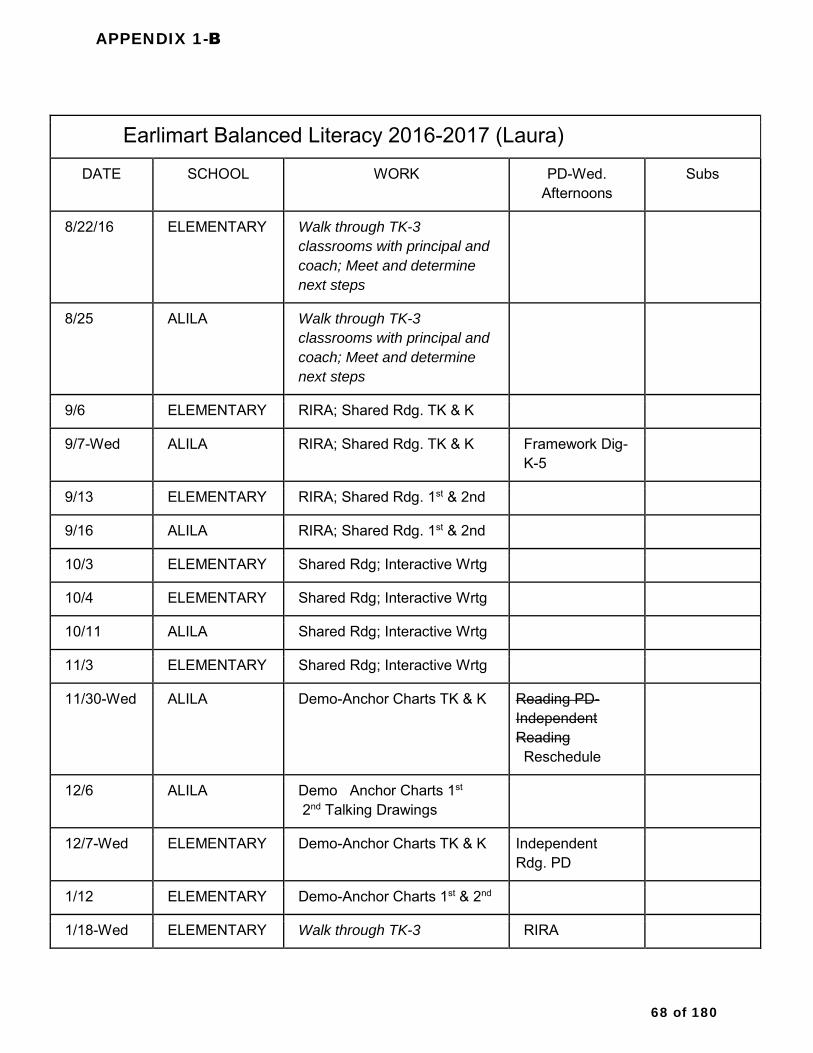
APPENDIX 1-B
Earlimart Balanced Literacy 2016-2017 (Laura)
DATE SCHOOL WORK PD-Wed. Afternoons
Subs
8/22/16 ELEMENTARY Walk through TK-3
classrooms with principal and
coach; Meet and determine
next steps
8/25 ALILA Walk through TK-3
classrooms with principal and
coach; Meet and determine
next steps
9/6 ELEMENTARY RIRA; Shared Rdg. TK & K
9/7-Wed ALILA RIRA; Shared Rdg. TK & K Framework Dig-K-5
9/13 ELEMENTARY RIRA; Shared Rdg. 1st & 2nd
9/16 ALILA RIRA; Shared Rdg. 1st & 2nd
10/3 ELEMENTARY Shared Rdg; Interactive Wrtg
10/4 ELEMENTARY Shared Rdg; Interactive Wrtg
10/11 ALILA Shared Rdg; Interactive Wrtg
11/3 ELEMENTARY Shared Rdg; Interactive Wrtg
11/30-Wed ALILA Demo-Anchor Charts TK & K Reading PD-Independent Reading Reschedule
12/6 ALILA Demo Anchor Charts 1st
2nd Talking Drawings
12/7-Wed ELEMENTARY Demo-Anchor Charts TK & K Independent Rdg. PD
1/12 ELEMENTARY Demo-Anchor Charts 1st & 2nd
1/18-Wed ELEMENTARY Walk through TK-3 RIRA
68 of 180
APPENDIX 1-B
classrooms with principal and
coach; Meet and determine
next steps
1/19 ALILA S.W.B.S. DEMOs
Independent Rdg. PD
2/2 ALILA Co/plan-Co/teach TK-K ELD (divide the group in ½- use roving subs)
Subs needed
2/8-Wed ELEMENTARY Alila
Co/plan-Co/teach TK-K ELD (divide the group in ½- use roving subs)
Talking Drawings- focus on research in the primary classroom
Subs needed
2/16 ALILA Co/plan-Co/teach 1st & 2nd (divide the group in ½- use roving subs- 1st in the morning, 2nd in the afternoon)
Subs needed 1st in the a.m. 2nd in the p.m.
2/22 ELEMENTARY Co/plan-Co/teach 1st & 2nd
ELD (divide the group in ½- use roving subs)
Subs needed 1st in the a.m. 2nd in the p.m.
2/28 ALILA Demo: D-ELD
3/6 ELEMENTARY Demo: D-ELD
3/20 ALILA Demo: D-ELD
3/27 BOTH
4/3 ELEMENTARY Co/plan-Co/teach TK-K ELD (divide the group in ½- use roving subs)
Subs needed
4/4 ALILA Co/plan-Co/teach TK-K ELD (divide the group in ½- use roving subs)
Subs needed
4/19 ALILA Co/plan-Co/teach 1st & 2nd
ELD (divide the group in ½- use
Subs needed 2nd in the a.m. 1st in
69 of 180
APPENDIX 1-B
roving subs) the p.m.
4/20 ELEMENTARY Co/plan-Co/teach 1st & 2nd
ELD (divide the group in ½- use roving subs)
Subs needed 2nd in the a.m. 1st in the p.m.
5/2 ALILA In classrooms coaching
5/3 ELEMENTARY In classrooms coaching
5/16 ELEMENTARY Walk through TK-3
classrooms with principal and
coach; Meet and determine
next steps
5/17 ALILA Walk through TK-3
classrooms with principal and
coach; Meet and determine
next steps
6/5/17 TCOE & EMS + COACHES MEET TO PLAN NEXT STEPS
6/6/17 TCOE & EMS + COACHES MEET TO PLAN NEXT STEPS
**6 days PREP
70 of 180
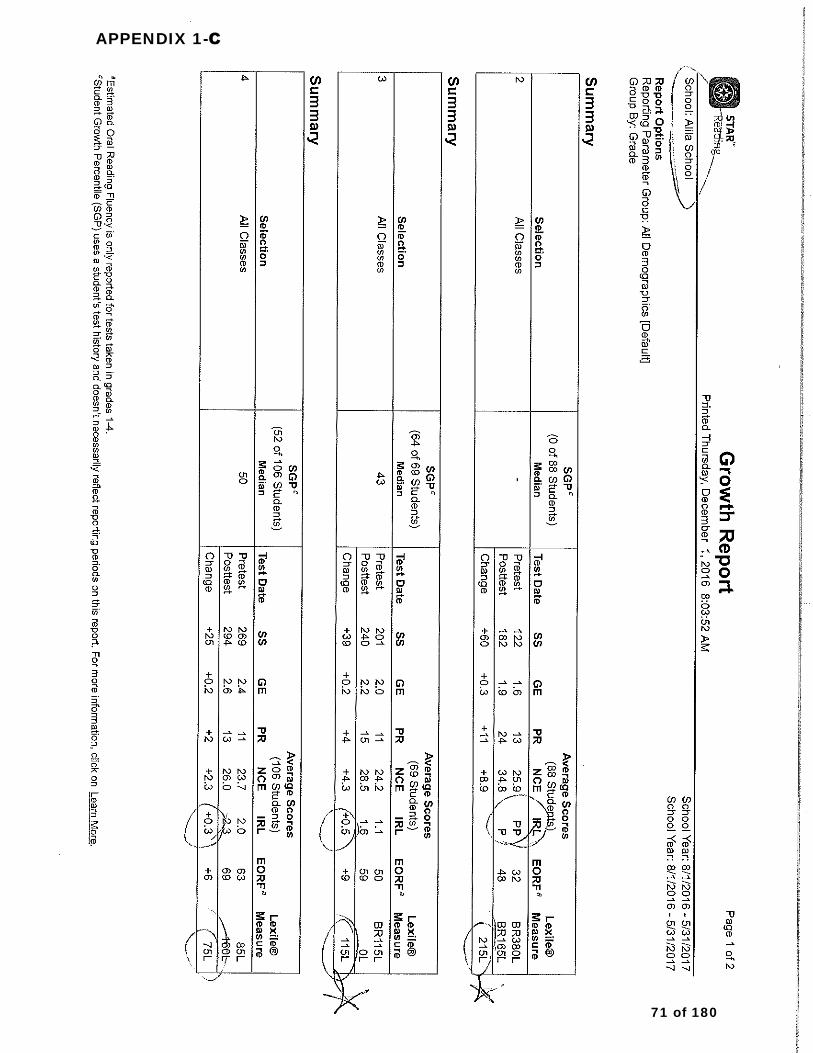
APPENDIX 1-C
71 of 180
APPENDIX 1-C
72 of 180
APPENDIX 1-C
73 of 180
APPENDIX 1-C
74 of 180
APPENDIX`2-1
75 of 180
APPENDIX`2-1
76 of 180
APPENDIX 2-2
77 of 180
APPENDIX 2-2
78 of 180
APPENDIX`2-3
79 of 180
APPENDIX 2-4
80 of 180
APPENDIX`2-5
81 of 180
APPENDIX`2-5
82 of 180
APPENDIX`2-5
83 of 180
APPENDIX`2-5
84 of 180

APPENDIX 3-1
Earlimart School District Library Circulation Data
School Today (10/28/16)
October 2016 Year to date Last year
Earlimart Elementary
245 3,626 6,806 18,646
Alila Elementary
173 749 1,185 19,075
Earlimart Middle
192 2,215 6,347 27,876
85 of 180

APPENDIX 4-1
86 of 180
APPENDIX 4-1
87 of 180
APPENDIX 4-1
88 of 180
APPENDIX 4-1
89 of 180
APPENDIX 4-1
90 of 180

APPENDIX 4-1
91 of 180
APPENDIX 4-1
92 of 180
APPENDIX 4-1
93 of 180
APPENDIX 4-1
94 of 180
APPENDIX 4-1
95 of 180
APPENDIX 4-1
96 of 180
APPENDIX 4-1
97 of 180

APPENDIX 4-1
98 of 180

APPENDIX 4-1
99 of 180
APPENDIX 4-1
100 of 180
APPENDIX 4-1
101 of 180
APPENDIX 4-1
102 of 180
APPENDIX 4-1
103 of 180

APPENDIX 4-1
104 of 180
APPENDIX 4-1
105 of 180
APPENDIX 4-1
106 of 180
APPENDIX 4-1
107 of 180
APPENDIX 4-1
108 of 180
APPENDIX 4-1
109 of 180

APPENDIX 4-1
110 of 180
APPENDIX 4-1
111 of 180
APPENDIX 4-1
112 of 180

APPENDIX 4-1
113 of 180

APPENDIX 4-1
114 of 180

APPENDIX 4-1
115 of 180
APPENDIX 4-1
116 of 180
APPENDIX 4-1
117 of 180
APPENDIX 4-1
118 of 180
APPENDIX 4-1
119 of 180
APPENDIX 4-1
120 of 180
APPENDIX 4-1
121 of 180
APPENDIX 4-1
122 of 180
APPENDIX 4-1
123 of 180

APPENDIX 4-1
124 of 180
APPENDIX 4-1
125 of 180
APPENDIX 4-1
126 of 180

APPENDIX 4-1
127 of 180

APPENDIX 4-1
128 of 180
APPENDIX 4-1
129 of 180
APPENDIX 4-1
130 of 180
APPENDIX 4-1
131 of 180
APPENDIX 4-1
132 of 180
APPENDIX 4-1
133 of 180
APPENDIX 4-1
134 of 180
APPENDIX 4-1
135 of 180

APPENDIX 4-1
136 of 180
APPENDIX 4-1
137 of 180
APPENDIX 4-1
138 of 180

APPENDIX 4-1
139 of 180
APPENDIX 4-1
140 of 180
APPENDIX 4-1
141 of 180

APPENDIX 4-1
142 of 180
APPENDIX 4-1
143 of 180
APPENDIX 4-1
144 of 180

APPENDIX 4-1
145 of 180
APPENDIX 4-1
146 of 180
APPENDIX 4-1
147 of 180

APPENDIX 4-1
148 of 180
APPENDIX 4-1
149 of 180
APPENDIX 4-1
150 of 180
APPENDIX 4-1
151 of 180
APPENDIX 4-1
152 of 180
APPENDIX 4-1
153 of 180
APPENDIX 4-1
154 of 180
APPENDIX 4-1
155 of 180
APPENDIX 4-1
156 of 180
APPENDIX 4-1
157 of 180
APPENDIX 4-1
158 of 180
APPENDIX 4-1
159 of 180

APPENDIX 4-1
160 of 180

APPENDIX 4-1
161 of 180
APPENDIX 4-1
162 of 180
APPENDIX 4-1
163 of 180
APPENDIX 4-1
164 of 180
APPENDIX 4-1
165 of 180
APPENDIX 4-1
166 of 180

APPENDIX 4-1
167 of 180

APPENDIX 4-1
168 of 180
APPENDIX 4-1
169 of 180

APPENDIX 4-1
170 of 180
APPENDIX 4-1
171 of 180
APPENDIX 4-1
172 of 180
APPENDIX 4-1
173 of 180
APPENDIX 4-1
174 of 180
APPENDIX 4-1
175 of 180
APPENDIX`4-1
176 of 180
APPENDIX`4-1
177 of 180
APPENDIX 4-1
178 of 180

APPENDIX 4-2
ESD EL Subgroup Comparison vs. Tulare County and State Average
Sequoia Union**
Ducor*
Palo Verde* Waukena* Exeter Burton Buena Vista* Earlimart School District
Tipton
Hope
California Average
Alpaugh
Lindsay
Sundale
Woodlake
Allensworth
Porterville
Traver
Visalia Unified
Tulare County Average
Dinuba
Liberty Elementary
Rockford
Stone Corral
Strathmore
Sunnyside Union
Woodville
Cutler Orosi
Oak Valley Union
Pleasant View
Kings River
Terra Bella
Tulare City
Alta Vista
Farmersville
Richgrove
Monson-Sultana
Pixley
Outside Creek
Saucelito
42
26
23
22
20
19
18
14
14
13
12
12
12
12
12
11
11
11
11
10
9
9
9
9
9
9
9
8
8
8
7
7
7
6
6
4
3
2
0
0
ELA Rankings
*less than 100 students
**12 students
179 of 180

APPENDIX 4-3STATEWIDE/ESD SUBGROUP GROWTH DATA
180 of 180