innovative energy technologies in austria, market
TRANSCRIPT

bmk.gv.at
Innovative Energy Technologiesin Austria, Market Development 2020Presentation of results
Vienna, 17 June 2021

bmk.gv.at
Project team
Authors: P. Biermayr, C. Dißauer, M. Eberl, M. Enigl, H. Fechner, B. Fürnsinn, M. Jaksch-Fliegenschnee, K. Leonhartsberger, S. Moidl, E. Prem, C. Schmidl, C. Strasser, W. Weiss, M. Wittmann, P. Wonisch, E. Wopienka;
Commissioned by BMK
2Presentation of results “Market statistics renewables 2020“

bmk.gv.at
Contents of the presentation
• Project targets
• Framework conditions of the market development 2020
• Results of the investigated technologies
• Summary
• Conclusions
3Presentation of results “Market statistics renewables 2020“

bmk.gv.at
Project targets• Empirical survey and documentation of the market development• Information processing and analysis− Energy output− GHG-emission savings− Economic effects− Innovations and trends− Market diffusion compared to roadmaps
• Deriving of conclusions• Target groups: Energy-, research- and environmental policy, industry, r&d institutes
4Presentation of results “Market statistics renewables 2020“
bmk.gv.at
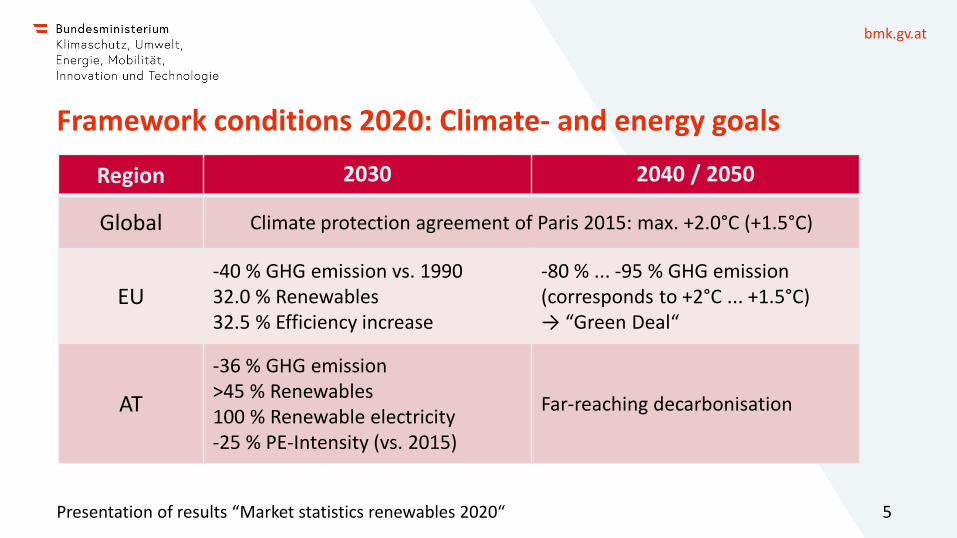
Framework conditions 2020: Climate- and energy goals
5
Region 2030 2040 / 2050
Global Climate protection agreement of Paris 2015: max. +2.0°C (+1.5°C)
EU-40 % GHG emission vs. 199032.0 % Renewables32.5 % Efficiency increase
-80 % ... -95 % GHG emission (corresponds to +2°C ... +1.5°C)→ “Green Deal“
AT
-36 % GHG emission>45 % Renewables100 % Renewable electricity-25 % PE-Intensity (vs. 2015)
Far-reaching decarbonisation
Presentation of results “Market statistics renewables 2020“

bmk.gv.at
Framework conditions 2020: Price of fossil energy
6
• Indicator oil price
• Since 2015 low and stable for the longer term!
• Total price collapse 2020
• Ø 2020 approx. 41 US$/barrel
Data source: Mineralölwirtschaftsverband, www.mwv.de
2020
Presentation of results “Market statistics renewables 2020“

bmk.gv.at
Photovoltaics: Market development 2020
7
• New installations: 340.8 MWpeak
• 2019→2020: +38.0 %
• Stock: 2.043 GWpeak
• 2019→2020: +20.0 %
Presentation of results “Market statistics renewables 2020“
Source: Technikum Wien

bmk.gv.at
Photovoltaics: System prices
8
Source: Technikum Wien
• System prices of 5 kWpeak systems keep falling
• System prices of >10 kWpeak
systems are stagnating
• An increase in system prices cannot be ruled out in the future
Presentation of results “Market statistics renewables 2020“

bmk.gv.at
Solid biomass – fuels: Market development 2020
9
Source: BEST
2019 → 2020:
Briquettes: +8.6 %
Pellets: +6.3 %
Bark: -1.6 %
Wood chips: +1.6 %
Logs: +3.1 %
Total: +2.6 %
Presentation of results “Market statistics renewables 2020“

bmk.gv.at
Solid biomass – fuels: Production of pellets
10
Source: ProPellets Austria
• Constant expansion of production capacities
• Securing domestic production
• Expansion of the sawmill industry → Expansion of pellet production
Presentation of results “Market statistics renewables 2020“

bmk.gv.at
Solid biomass – boilers: Market development 2020
11
Source: BEST
2019 → 2020:
in total 13,778 pieces
Pellet boilers: +21.9 %
Combined pellet boilers: +45.2 %
Log boilers: +10.9 %
Wood chips to 100 kW: +6.9 %
Wood chips >100 kW: +0.8 %
Total: +18.8 %
Presentation of results “Market statistics renewables 2020“

bmk.gv.at
Solid biomass – stoves: Market development 2020
12
Source: BEST
2019 → 2020:
Pellet stoves: -2.1 %
Kitchen stoves: -16.3 %
Chimney stoves: -5.8 %
Total: -9.5 %
Presentation of results “Market statistics renewables 2020“

bmk.gv.at
Solid biomass – boilers: Combined pellet boilers
13
• 2019 → 2020: +45.2 %
• Strong growth compared to log boilers (+10.9 %)
• Automation trend plus need for self-sufficiency
Source: LK NÖ
Presentation of results “Market statistics renewables 2020“

bmk.gv.at
Solarthermics: Market development 2020
14
Source: AEE INTEC
• New installations: 53.2 MWth
• 2019→2020: -17.0 %
• Stock: 3.447 GWth
• 2019→2020: -2.5 %
Presentation of results “Market statistics renewables 2020“

bmk.gv.at
Solarthermics: Areas of application
15
Newly installed solar thermal systems in 2020 by area of application
Source: AEE INTEC
Presentation of results “Market statistics renewables 2020“

bmk.gv.at
Solarthermics: Solar district heating
16
Source: AEE INTEC
Presentation of results “Market statistics renewables 2020“
Solar district heating systems

bmk.gv.at
Wind power: Market development 2020
17
Source: IG Windkraft
• New installations: 25 MW • 2019→2020: -84.3 %
• Stock: 3.105 GW• 2019→2020: -1.3 %
• Wind power 2020: ca. 7 TWh
Presentation of results “Market statistics renewables 2020“

bmk.gv.at
Wind power: International stock
18
Sour
ce: W
indE
urop
e (2
020)
Presentation of results “Market statistics renewables 2020“

bmk.gv.at
Wind power: Outlook for Austria
19
• Around 4 GW of installed wind power by 2025 (made possible by the remaining funding from the green electricity amendment 2019)
• Around +120 wind power plants and +550 MW necessary for climate targets by 2030
• Expansion currently in Lower Austria, Burgenland, Styria • Use of potential throughout Austria necessary by 2030 (EAG, zoning,
permits, grid expansion, ...) • Technical advancement from 3MW to 5 MW output
Presentation of results “Market statistics renewables 2020“
bmk.gv.at
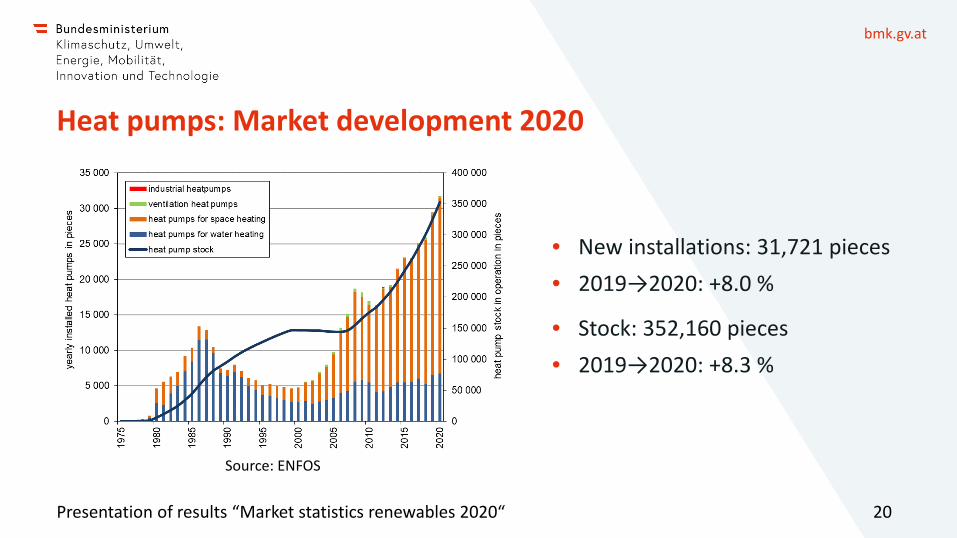
Heat pumps: Market development 2020
20
• New installations: 31,721 pieces • 2019→2020: +8.0 %
• Stock: 352,160 pieces• 2019→2020: +8.3 %
Presentation of results “Market statistics renewables 2020“
Source: ENFOS

bmk.gv.at
Heat pumps: Some details
21
Source: ENFOS
Heat pumps for space heatingdomestic market 2020:
total 24,952 pieces
Presentation of results “Market statistics renewables 2020“

bmk.gv.at
Summary: Key figures 2020 (Sums of biomass, photovoltaics, solarthermics, heat pumps and wind power)
22
• Renewable energy: 234 PJ (≙67.7 TWh)
• CO2equ-savings: 14.4 Mio. Tonnen
• Turnover (primary, gross): 5.5 billion €
• Employees: 31,800 full-time equivalents
Presentation of results “Market statistics renewables 2020“

bmk.gv.at
Summary: Trends
23
Trend annual expansion 14/15 15/16 16/17 17/18 18/19 19/20
Biomass solid
Biomass liquid
Biomass gaseous (0) (0) (0)
Deep geothermal 0 0 0 0 0 0
Photovoltaics
Solarthermics
Heat pumps
Hydro power
Wind power
Presentation of results “Market statistics renewables 2020“

bmk.gv.at
Conclusions (1)
24
Sources: Statistik Austria, ENFOS
• For achieving the goals the historical market development is by far insufficient!
• Necessary are:
− Energy services ↓
− Energy efficiency ↑
− Renewables ↑
target 2020
target 2030
target 2040
Presentation of results “Market statistics renewables 2020“

bmk.gv.at
Conclusions (2)
25
• The idleness of the energy system is significant. Over the past 10 years the percentage of renewables has risen in AT from 31.0% (2009) to 33.6 % (2019) by 2.6 % - points. The average of the last 50 years was 2.9 % points/decade.
• To reach the goals 2030/2040 approved technologies for the use of renewables have to be implemented immediately and problematic fields need to be treated through accelerated R&D.
• To achieve the targets all nine in Austria available technologies for the use of renewables will be necessary.
Presentation of results “Market statistics renewables 2020“

bmk.gv.at
Conclusions (3)
26
• „Innovators“ have already been served. The attributes of new users are a challenge.
• “low hanging fruits“ have already been harvested in many areas in the sense of potential cost curves.
• In times of cheap fossil energy and missing cost transparency renewables will not come automatically. The implementation of effective and efficient political instruments in a totally new scope is absolutely essential for attaining the targets.
Presentation of results “Market statistics renewables 2020“

bmk.gv.at
Conclusions (4)
27
• The “Out of the Oil“ campaign is already bearing fruit. “Out of Fossil Energy“ is essential for reaching the goals.
• Attention: Lock-in effect! In 2020 46,000 new gas-fired boilers and 3,000 new oil boilers have been sold in AT (approx. 47 % of the domestic heating market).
• Agreements of targets and instruments between the federal government and the federal states.
• Electricity: – Targets 2030 can only be reached with a functioning EAG.
– Grid development plan must be compatible with target path.
Presentation of results “Market statistics renewables 2020“

bmk.gv.at
Conclusions (5)
28
• With an offensive realisation of the national goals Austria can attain its leading role concerning climate protection and renewables again.
• An advance in innovations and production lead to market leadership and patents. A trustworthy domestic market creates new export opportunities.
Presentation of results “Market statistics renewables 2020“

bmk.gv.at
Acknowledgement
29
We are thankful for the productive cooperation of:
• The Austrian companies
• The associations
• The places of support of the federal states and federal government
• The energy departments of the federal states
• The employees of the R&D-institutions
Presentation of results “Market statistics renewables 2020“

bmk.gv.at
Thank you for your attention!
The final report is on the Internet:https://nachhaltigwirtschaften.at/de/iea/publikationen/