input cost monitor: the story of maize and wheat · input cost of wheat the main focus of this...
TRANSCRIPT
1
020406080
100120140160180200220240260280
1990
1991
1992
1993
1994
1995
1996
1997
1998
1999
2000
2001
2002
2003
2004
2005
2006
2007
2000=
100
FRPI-Total PPI-Total PPI-Field crops PPI-Maize PPI-Wheat
Input cost monitor: The story of Maize and Wheat
July 2008
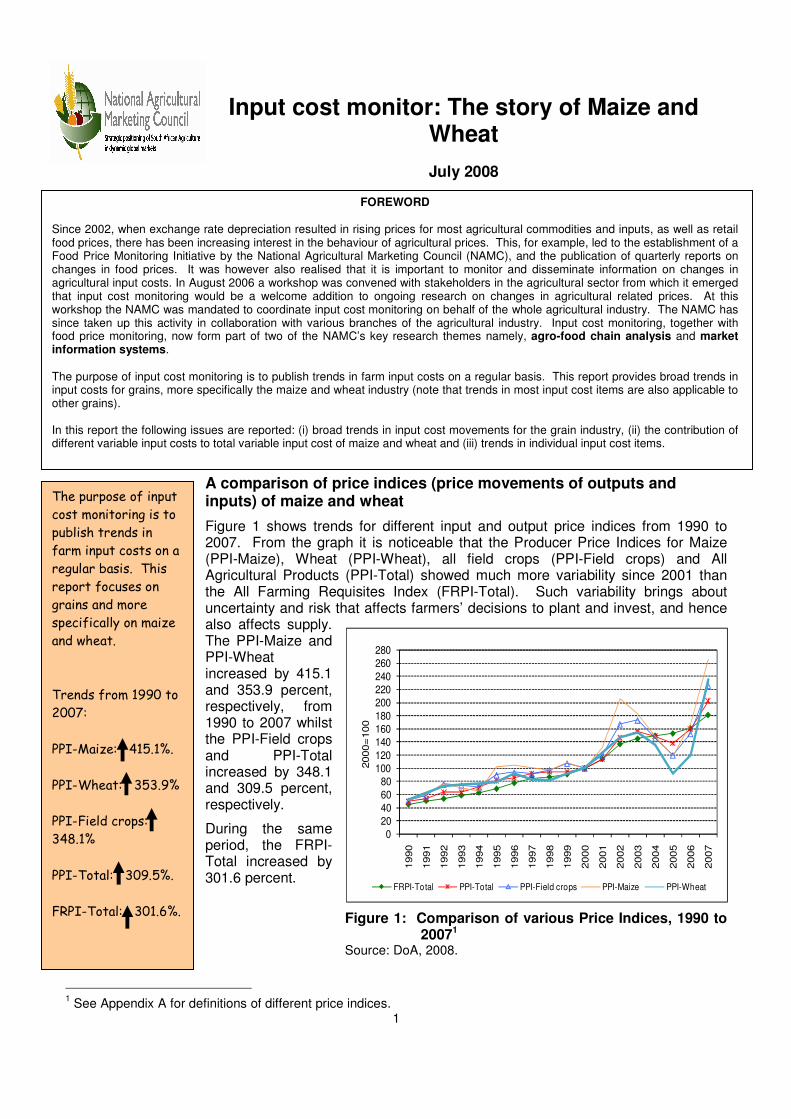
A comparison of price indices (price movements of outputs and inputs) of maize and wheat
Figure 1 shows trends for different input and output price indices from 1990 to 2007. From the graph it is noticeable that the Producer Price Indices for Maize (PPI-Maize), Wheat (PPI-Wheat), all field crops (PPI-Field crops) and All Agricultural Products (PPI-Total) showed much more variability since 2001 than the All Farming Requisites Index (FRPI-Total). Such variability brings about uncertainty and risk that affects farmers’ decisions to plant and invest, and hence also affects supply. The PPI-Maize and PPI-Wheat increased by 415.1 and 353.9 percent, respectively, from 1990 to 2007 whilst the PPI-Field crops and PPI-Total increased by 348.1 and 309.5 percent, respectively.
During the same period, the FRPI-Total increased by 301.6 percent.
Figure 1: Comparison of various Price Indices, 1990 to
20071 Source: DoA, 2008.
1 See Appendix A for definitions of different price indices.
FOREWORD Since 2002, when exchange rate depreciation resulted in rising prices for most agricultural commodities and inputs, as well as retail food prices, there has been increasing interest in the behaviour of agricultural prices. This, for example, led to the establishment of a Food Price Monitoring Initiative by the National Agricultural Marketing Council (NAMC), and the publication of quarterly reports on changes in food prices. It was however also realised that it is important to monitor and disseminate information on changes in agricultural input costs. In August 2006 a workshop was convened with stakeholders in the agricultural sector from which it emerged that input cost monitoring would be a welcome addition to ongoing research on changes in agricultural related prices. At this workshop the NAMC was mandated to coordinate input cost monitoring on behalf of the whole agricultural industry. The NAMC has since taken up this activity in collaboration with various branches of the agricultural industry. Input cost monitoring, together with food price monitoring, now form part of two of the NAMC’s key research themes namely, agro-food chain analysis and market information systems.
The purpose of input cost monitoring is to publish trends in farm input costs on a regular basis. This report provides broad trends in input costs for grains, more specifically the maize and wheat industry (note that trends in most input cost items are also applicable to other grains).
In this report the following issues are reported: (i) broad trends in input cost movements for the grain industry, (ii) the contribution of different variable input costs to total variable input cost of maize and wheat and (iii) trends in individual input cost items.
The purpose of input
cost monitoring is to
publish trends in
farm input costs on a
regular basis. This
report focuses on
grains and more
specifically on maize
and wheat.
Trends from 1990 to
2007:
PPI-Maize: 415.1%.
PPI-Wheat: 353.9%
PPI-Field crops:
348.1%
PPI-Total: 309.5%.
FRPI-Total: 301.6%.
2
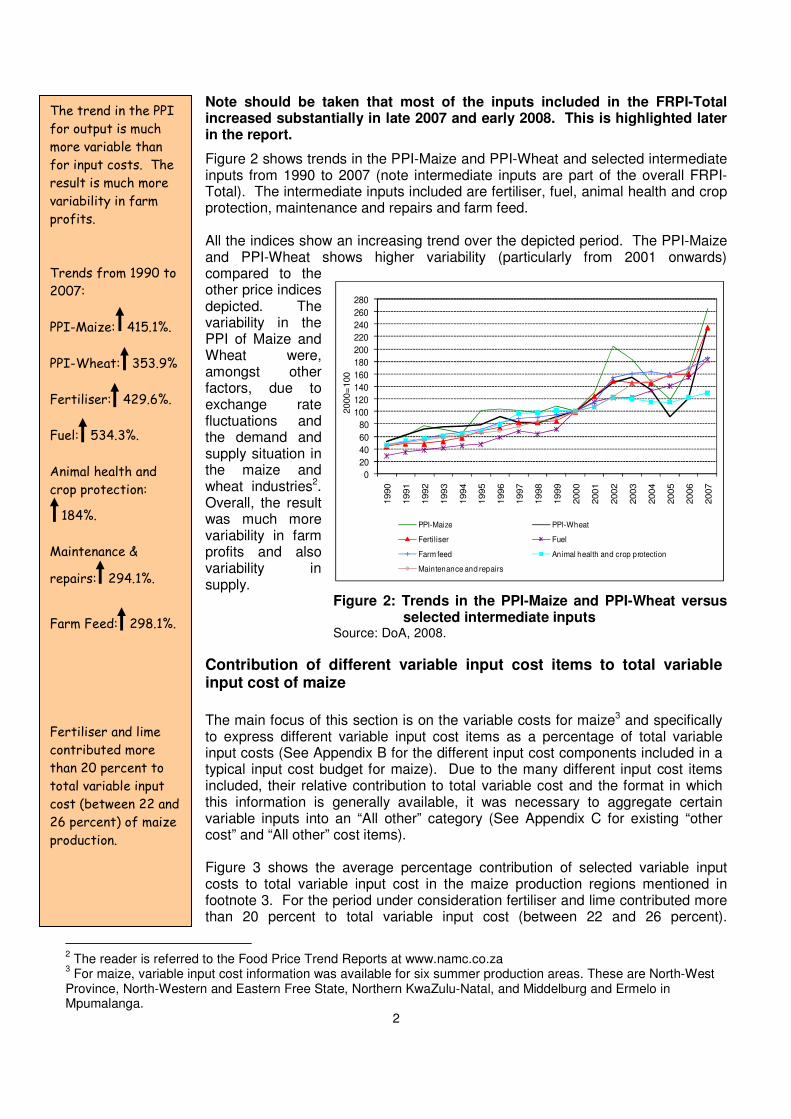
Note should be taken that most of the inputs included in the FRPI-Total increased substantially in late 2007 and early 2008. This is highlighted later in the report.
Figure 2 shows trends in the PPI-Maize and PPI-Wheat and selected intermediate inputs from 1990 to 2007 (note intermediate inputs are part of the overall FRPI-Total). The intermediate inputs included are fertiliser, fuel, animal health and crop protection, maintenance and repairs and farm feed. All the indices show an increasing trend over the depicted period. The PPI-Maize and PPI-Wheat shows higher variability (particularly from 2001 onwards) compared to the other price indices depicted. The variability in the PPI of Maize and Wheat were, amongst other factors, due to exchange rate fluctuations and the demand and supply situation in the maize and wheat industries2. Overall, the result was much more variability in farm profits and also variability in supply.
Figure 2: Trends in the PPI-Maize and PPI-Wheat versus selected intermediate inputs
Source: DoA, 2008.
Contribution of different variable input cost items to total variable input cost of maize
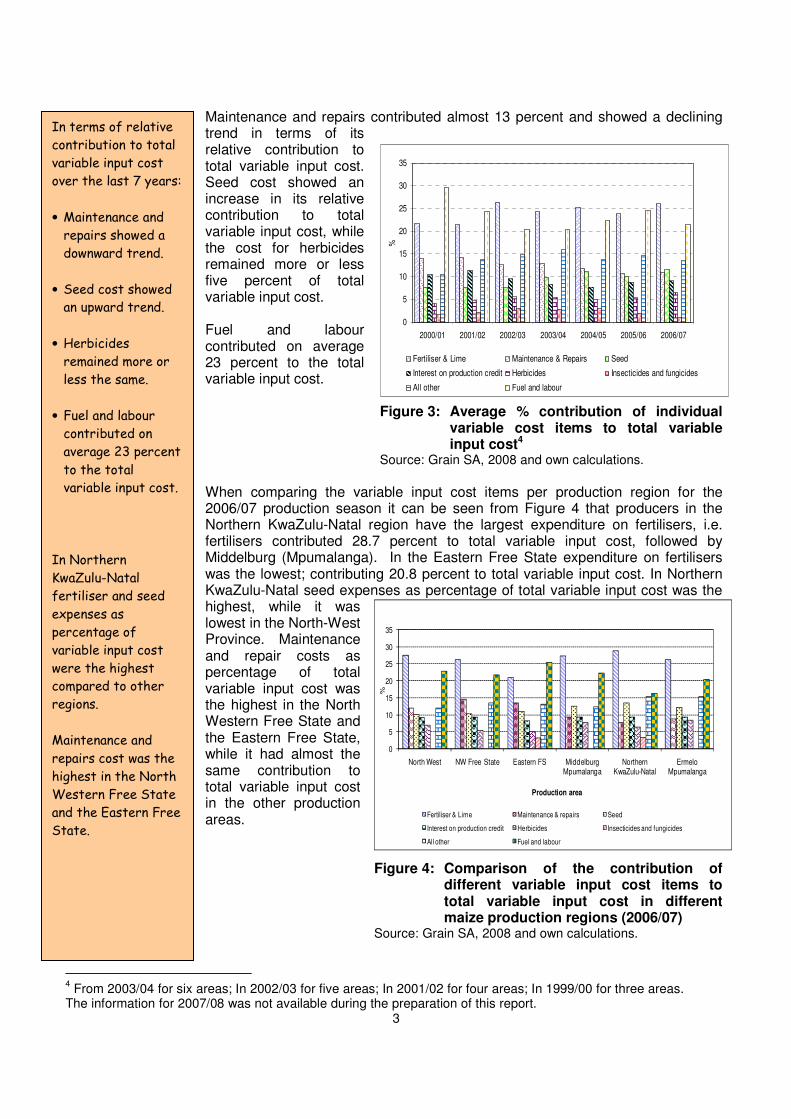
The main focus of this section is on the variable costs for maize3 and specifically to express different variable input cost items as a percentage of total variable input costs (See Appendix B for the different input cost components included in a typical input cost budget for maize). Due to the many different input cost items included, their relative contribution to total variable cost and the format in which this information is generally available, it was necessary to aggregate certain variable inputs into an “All other” category (See Appendix C for existing “other cost” and “All other” cost items). Figure 3 shows the average percentage contribution of selected variable input costs to total variable input cost in the maize production regions mentioned in footnote 3. For the period under consideration fertiliser and lime contributed more than 20 percent to total variable input cost (between 22 and 26 percent).
2 The reader is referred to the Food Price Trend Reports at www.namc.co.za
3 For maize, variable input cost information was available for six summer production areas. These are North-West
Province, North-Western and Eastern Free State, Northern KwaZulu-Natal, and Middelburg and Ermelo in Mpumalanga.
The trend in the PPI
for output is much
more variable than
for input costs. The
result is much more
variability in farm
profits.
Trends from 1990 to
2007:
PPI-Maize: 415.1%.
PPI-Wheat: 353.9%
Fertiliser: 429.6%.
Fuel: 534.3%.
Animal health and
crop protection:
184%.
Maintenance &
repairs: 294.1%.
Farm Feed: 298.1%.
Fertiliser and lime
contributed more
than 20 percent to
total variable input
cost (between 22 and
26 percent) of maize
production.
0
20
40
60
80
100
120
140
160
180
200
220
240
260
280
1990
1991
1992
1993
1994
1995
1996
1997
1998
1999
2000
2001
2002
2003
2004
2005
2006
2007
2000=
100
PPI-Maize PPI-Wheat
Fertiliser Fuel
Farm feed Animal health and crop protection
Maintenance and repairs
3
0
5
10
15
20
25
30
35
2000/01 2001/02 2002/03 2003/04 2004/05 2005/06 2006/07
%
Fertiliser & Lime Maintenance & Repairs Seed
Interest on production credit Herbicides Insecticides and fungicides
All other Fuel and labour
Maintenance and repairs contributed almost 13 percent and showed a declining trend in terms of its relative contribution to total variable input cost. Seed cost showed an increase in its relative contribution to total variable input cost, while the cost for herbicides remained more or less five percent of total variable input cost. Fuel and labour contributed on average 23 percent to the total variable input cost.
Figure 3: Average % contribution of individual variable cost items to total variable input cost4
Source: Grain SA, 2008 and own calculations.
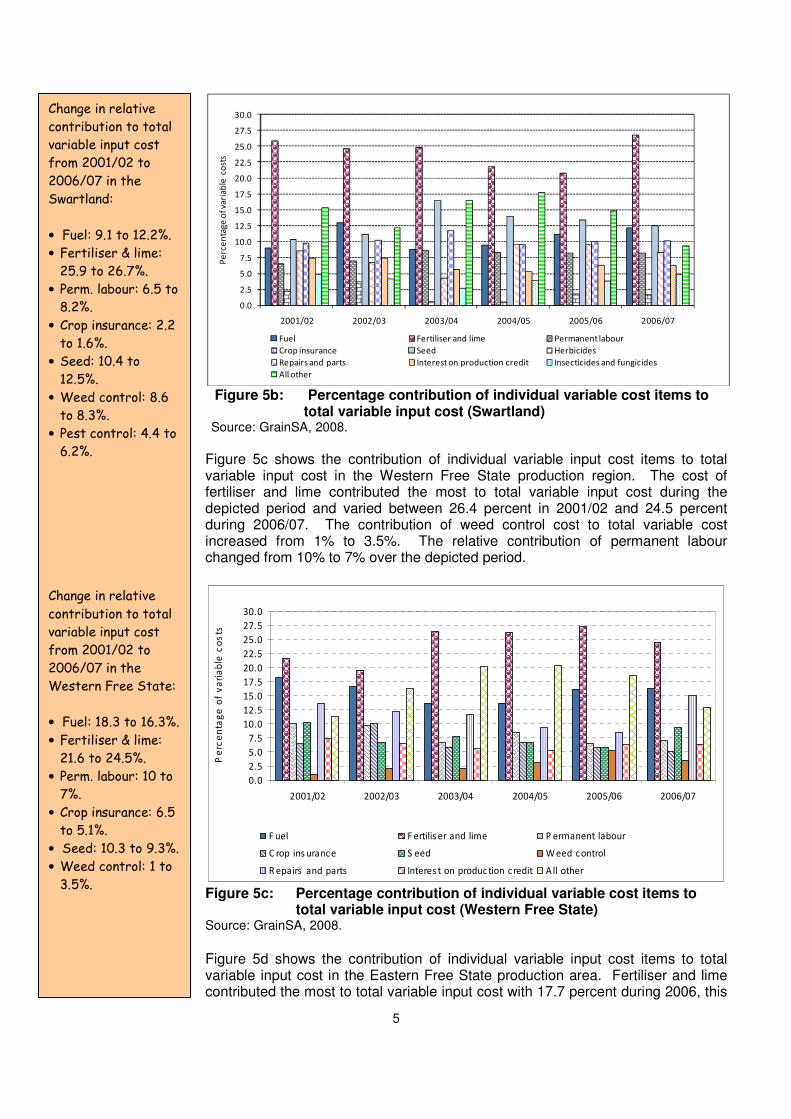
When comparing the variable input cost items per production region for the 2006/07 production season it can be seen from Figure 4 that producers in the Northern KwaZulu-Natal region have the largest expenditure on fertilisers, i.e. fertilisers contributed 28.7 percent to total variable input cost, followed by Middelburg (Mpumalanga). In the Eastern Free State expenditure on fertilisers was the lowest; contributing 20.8 percent to total variable input cost. In Northern KwaZulu-Natal seed expenses as percentage of total variable input cost was the highest, while it was lowest in the North-West Province. Maintenance and repair costs as percentage of total variable input cost was the highest in the North Western Free State and the Eastern Free State, while it had almost the same contribution to total variable input cost in the other production areas.
Figure 4: Comparison of the contribution of different variable input cost items to total variable input cost in different maize production regions (2006/07)
Source: Grain SA, 2008 and own calculations.
4 From 2003/04 for six areas; In 2002/03 for five areas; In 2001/02 for four areas; In 1999/00 for three areas.
The information for 2007/08 was not available during the preparation of this report.
In terms of relative
contribution to total
variable input cost
over the last 7 years:
• Maintenance and
repairs showed a
downward trend.
• Seed cost showed
an upward trend.
• Herbicides
remained more or
less the same.
• Fuel and labour
contributed on
average 23 percent
to the total
variable input cost.
In Northern
KwaZulu-Natal
fertiliser and seed
expenses as
percentage of
variable input cost
were the highest
compared to other
regions.
Maintenance and
repairs cost was the
highest in the North
Western Free State
and the Eastern Free
State.
0
5
10
15
20
25
30
35
North West NW Free State Eastern FS Middelburg Mpumalanga
Northern KwaZulu-Natal
Ermelo Mpumalanga
%
Production area
Fertiliser & Lime Maintenance & repairs Seed
Interest on production credit Herbicides Insecticides and fungicides
All other Fuel and labour

4
Contribution of different variable input cost items to total variable input cost of wheat The main focus of this section is on the variable input costs for wheat, and specifically to express different variable input cost items as a percentage of total variable input costs (See Appendix B for the different variable input cost components included in a typical input cost budget for wheat). Due to the many different variable input cost items included, their relative contribution to total variable cost and the format in which this information is generally available, it was necessary to aggregate certain variable inputs into an “All other” category (See Appendix C for existing “All other” cost items). Figure 5a, 5b, 5c and 5d show the average percentage contribution of selected variable input costs to total variable input cost in each of the following wheat production regions respectively: Southern Cape, Swartland (western part of Western Cape), Western Free State and Eastern Free State. For the period under consideration fertilizer and lime contributed between 17 and 26 percent to total variable input cost. Maintenance and repairs contributed between 10 and 13 percent to total variable input cost. Seed cost contributed between 8 and 10 percent to total variable input cost, while the cost for herbicides were more or less five percent of total variable input cost. Fuel contributed between 10 and 17 percent and labour between 8 and 12 percent to the total variable input cost. From Figure 5a it is evident that fertiliser and lime contributed the most to total variable input cost with 22.6 percent during 2006/07 in the Southern Cape production region. The contribution of fuel cost to total variable input cost increased the most from 2001/02 to 2006/07 with 60.7 percent followed by the cost of pest control with an increase of 39.8 percent.
Figure 5a: Percentage contribution of individual variable cost items to
total variable input cost (Southern Cape) Source: GrainSA, 2008.
Figure 5b shows the contribution of individual variable input cost items to total variable input cost in the Swartland production area. The cost of fertiliser and lime contributed the most to total variable cost during the depicted period and varied between 22.2 percent in 2001/02 and 26.7 percent during 2006/07. The contribution of fuel cost to total variable cost increased with 34 percent from 2001/02 to 2006/07.
0.0
2.5
5.0
7.5
10.0
12.5
15.0
17.5
20.0
22.5
25.0
27.5
30.0
2001/02 2002/03 2003/04 2004/05 2005/06 2006/07
Pe
rce
nta
ge
of
va
ria
ble
co
sts
F uel F ertilis er and lime P ermanent labour
C rop ins uranc e S eed Weed control
Interes t on produc tion c redit P es t c ontrol A ll other
The average relative
contribution of
selected variable
input costs to total
variable input cost
for wheat from
2001/02 to 2006/07
were:
• Fertilizer and lime
contributed
between 17 and
26%.
• Maintenance and
repairs cost
contributed
between 10 and
13%.
• Seed cost
contributed
between 8 and 10%.
• Fuel cost
contributed
between 10 and
17%.
• Labour cost
contributed
between 8 and 12%.
Change in relative
contribution to total
variable input cost
from 2001/02 to
2006/ 07 in the
Southern Cape
(selected items):
• Fuel: 10.9 to 17.4%.
• Fertiliser & lime:
24.3 to 22.6%.
• Perm. labour: 9.3
to 8.4%.
• Crop insurance: 3.5
to 1%.
• Seed: 12 to 11%.
• Weed control: 7.4
to 7.2%.
• Pest control: 4.4 to
6.2%.
5
Figure 5b: Percentage contribution of individual variable cost items to
total variable input cost (Swartland) Source: GrainSA, 2008.
Figure 5c shows the contribution of individual variable input cost items to total variable input cost in the Western Free State production region. The cost of fertiliser and lime contributed the most to total variable input cost during the depicted period and varied between 26.4 percent in 2001/02 and 24.5 percent during 2006/07. The contribution of weed control cost to total variable cost increased from 1% to 3.5%. The relative contribution of permanent labour changed from 10% to 7% over the depicted period.
Figure 5c: Percentage contribution of individual variable cost items to total variable input cost (Western Free State) Source: GrainSA, 2008.
Figure 5d shows the contribution of individual variable input cost items to total variable input cost in the Eastern Free State production area. Fertiliser and lime contributed the most to total variable input cost with 17.7 percent during 2006, this
0.0
2.5
5.0
7.5
10.0
12.5
15.0
17.5
20.0
22.5
25.0
27.5
30.0
2001/02 2002/03 2003/04 2004/05 2005/06 2006/07
Pe
rce
nta
ge
of
va
ria
ble
co
sts
Fuel Fertiliser and lime Permanent labour
Crop insurance Seed Herbicides
Repairs and parts Interest on production credit Insecticides and fungicides
All other
0.0
2.5
5.0
7.5
10.0
12.5
15.0
17.5
20.0
22.5
25.0
27.5
30.0
2001/02 2002/03 2003/04 2004/05 2005/06 2006/07
Pe
rce
nta
ge
of
va
ria
ble
co
sts
F uel F ertilis er and lime P ermanent labour
C rop ins uranc e S eed W eed c ontrol
R epairs and parts Interes t on produc tion c redit A ll other
Change in relative
contribution to total
variable input cost
from 2001/02 to
2006/07 in the
Swartland:
• Fuel: 9.1 to 12.2%.
• Fertiliser & lime:
25.9 to 26.7%.
• Perm. labour: 6.5 to
8.2%.
• Crop insurance: 2.2
to 1.6%.
• Seed: 10.4 to
12.5%.
• Weed control: 8.6
to 8.3%.
• Pest control: 4.4 to
6.2%.
Change in relative
contribution to total
variable input cost
from 2001/02 to
2006/07 in the
Western Free State:
• Fuel: 18.3 to 16.3%.
• Fertiliser & lime:
21.6 to 24.5%.
• Perm. labour: 10 to
7%.
• Crop insurance: 6.5
to 5.1%.
• Seed: 10.3 to 9.3%.
• Weed control: 1 to
3.5%.

6
0
5
10
15
20
25
30
35
40
45
Fertiliser and lime
%
2006/07 Swartland 2007/08 Swartland 2008/09 Swartland
2006/07 Western Free State 2007/08 Western Free State 2008/09 Western Free State
2006/07 Eastern Free State 2007/08 Eastern Free State 2008/09 Eastern Free State
is 5.4 percent lower than the 18.7 percent in 2001/02. The relative contribution of fuel cost to total variable input cost increased the most from 2001 to 2006 with 29.5%.
Figure 5d: Percentage contribution of individual variable cost items to total variable input cost (Eastern Free State) Source: GrainSA, 2008.
To compare the previous (2006/07), current (2007/08) and forthcoming (2008/09) seasons, the most important variable input cost items in three wheat production regions are compared. The available data is for the Swartland, Western Free State and Eastern Free State production regions. The comparisons are done for fertilizer and lime, fuel, weed control and repairs and parts.
By comparing the fertilizers cost per production region for the 2007/08 and 2008/09 seasons with the 2006/07 production season it can be seen from Figure 6a that fertilizer and lime makes the largest contribution to total variable cost in the Swartland region. In the Swartland region the contribution of fertilizer and lime to total variable input cost is expected to increase to 39.3 percent in 2008/09. For the Western Free State the relative contribution to total variable input cost is expected to increase to 35.8 percent. In the Eastern Free State the relative contribution of fertilizers and lime to total variable input cost is expected to increase to 36.5 percent in 2008/09.
Figure 6a: Comparison of the contribution of fertilizer and lime cost to total variable input cost in different wheat production regions 2006/07 to 2008/095
Source: GrainSA, 2008.
5 Note in Figures 6a to 6d 2007/08 and 2008/09 budget figures were used and not final production cost figures.
0.0
2.5
5.0
7.5
10.0
12.5
15.0
17.5
20.0
22.5
25.0
2001/02 2002/03 2003/04 2004/05 2005/06 2006/07
Pe
rce
nta
ge
of
va
ria
ble
co
sts
F uel F ertilis er and lime P ermanent labour
C rop ins urance S eed W eed control
R epairs and parts Interes t on production c redit P es t control
A ll other
Change in relative
contribution to total
variable input cost
from 2001/02 to
2006/07 in the
Eastern Free State:
• Fuel: 12.8 to 16.6%.
• Fertiliser & lime:
18.7 to 17.7%.
• Perm. labour: 9 to
10.2%.
• Crop insurance:
13.4 to 7.1%.
• Seed: 4.2 to 3.9%.
• Weed control: 4.1
to 3.5%.
• Interest on
production credit:
6.5 to 6.3%.
• Pest control: 4.1 to
3.5%.
Change in the relative
contribution of
fertilizer and lime
costs to total
variable cost from
2006/07 to
2008/09:
• Swartland: 26.7 to
39.3%.
• Western Free
State: 24.5 to
35.8%.
• Eastern Free
State: 17.7 to
36.5%.
7
0.0
2.0
4.0
6.0
8.0
10.0
12.0
14.0
16.0
18.0
Fuel%
2006/07 Swartland 2007/08 Swartland 2008/09 Swartland
2006/07 Western Free State 2007/08 Western Free State 2008/09 Western Free State
2006/07 Eastern Free State 2007/08 Eastern Free State 2008/09 Eastern Free State
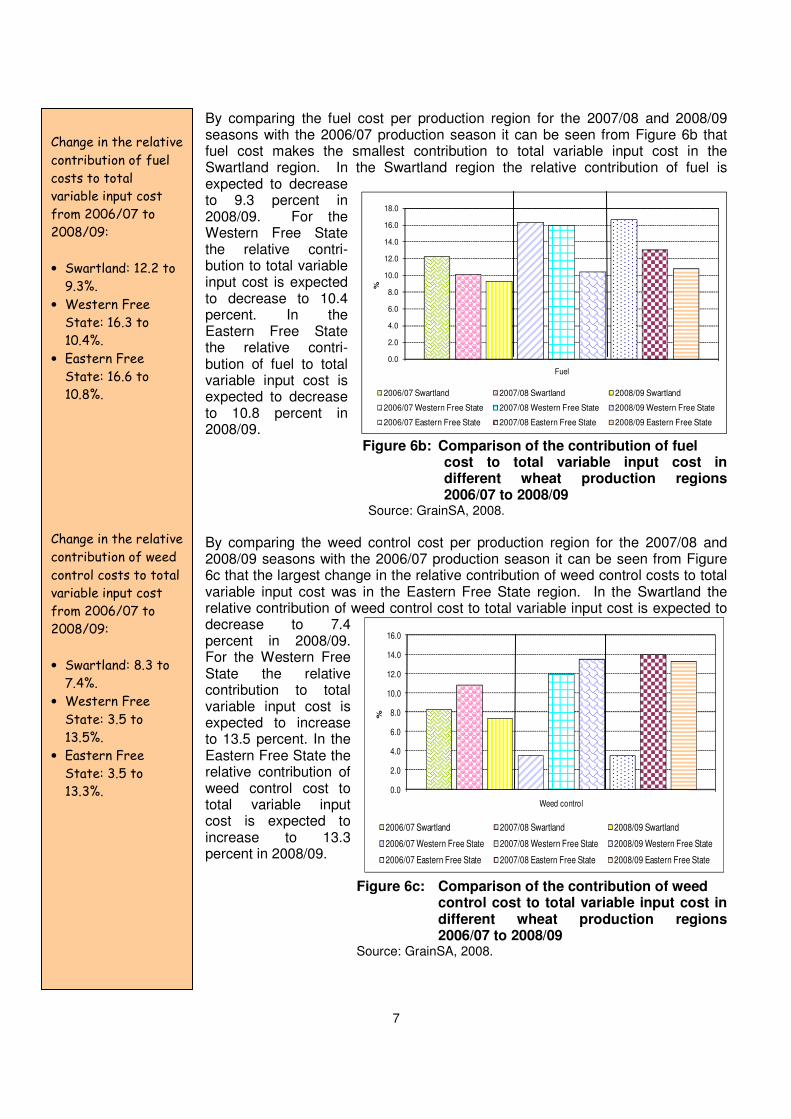
By comparing the fuel cost per production region for the 2007/08 and 2008/09 seasons with the 2006/07 production season it can be seen from Figure 6b that fuel cost makes the smallest contribution to total variable input cost in the Swartland region. In the Swartland region the relative contribution of fuel is expected to decrease to 9.3 percent in 2008/09. For the Western Free State the relative contri-bution to total variable input cost is expected to decrease to 10.4 percent. In the Eastern Free State the relative contri-bution of fuel to total variable input cost is expected to decrease to 10.8 percent in 2008/09.
Figure 6b: Comparison of the contribution of fuel cost to total variable input cost in different wheat production regions 2006/07 to 2008/09
Source: GrainSA, 2008.
By comparing the weed control cost per production region for the 2007/08 and 2008/09 seasons with the 2006/07 production season it can be seen from Figure 6c that the largest change in the relative contribution of weed control costs to total variable input cost was in the Eastern Free State region. In the Swartland the relative contribution of weed control cost to total variable input cost is expected to decrease to 7.4 percent in 2008/09. For the Western Free State the relative contribution to total variable input cost is expected to increase to 13.5 percent. In the Eastern Free State the relative contribution of weed control cost to total variable input cost is expected to increase to 13.3 percent in 2008/09.
Figure 6c: Comparison of the contribution of weed control cost to total variable input cost in different wheat production regions 2006/07 to 2008/09
Source: GrainSA, 2008.
Change in the relative
contribution of fuel
costs to total
variable input cost
from 2006/07 to
2008/09:
• Swartland: 12.2 to
9.3%.
• Western Free
State: 16.3 to
10.4%.
• Eastern Free
State: 16.6 to
10.8%.
Change in the relative
contribution of weed
control costs to total
variable input cost
from 2006/07 to
2008/09:
• Swartland: 8.3 to
7.4%.
• Western Free
State: 3.5 to
13.5%.
• Eastern Free
State: 3.5 to
13.3%.
0.0
2.0
4.0
6.0
8.0
10.0
12.0
14.0
16.0
Weed control
%
2006/07 Swartland 2007/08 Swartland 2008/09 Swartland
2006/07 Western Free State 2007/08 Western Free State 2008/09 Western Free State
2006/07 Eastern Free State 2007/08 Eastern Free State 2008/09 Eastern Free State

8
By comparing the repairs and parts cost per production region for the 2007/08 and 2008/09 seasons with the 2006/07 production season it can be seen from Figure 6d that repairs and parts makes the largest contribution to total variable input cost in the Western Free State region. In the Swartland the relative contribution of repairs and parts cost to total variable input cost is expected to decrease to 6.2 percent in 2008/09. For the Western Free State the relative contribution to total variable input cost is expected to decrease to 6.7 percent. In the Eastern Free State the relative contribution of repairs and parts to total variable input cost is expected to decrease to 7 percent in 2008/09.
Figure 6d: Comparison of the contribution of repairs and parts cost to total variable input cost in different wheat production regions 2006/07 to 2008/09
Source: GrainSA, 2008.
• Mechanisation
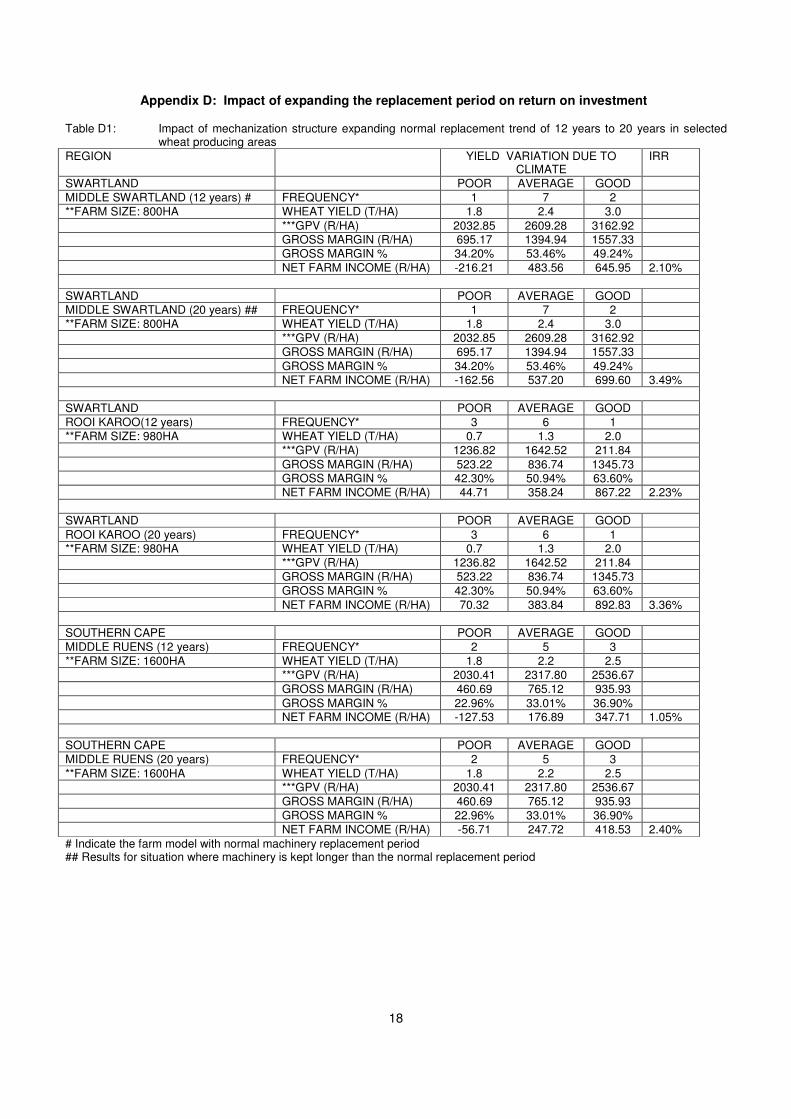
Producers are continuously seeking ways to reduce production cost of small grain. In some production areas like the Rooi Karoo and middle Rûens, producers tend to buy second hand machinery and keep them longer than the recommended replacement period of 12 years. To determine the impact on profitability, a typical small grain farm model was used to calculate the internal rate of return of a multi-period investment6. The impact of a 12 year replacement period for their combine harvesters and big tractors used for pulling the big planting machines was compared with the impact of a replacement period of 20 years. The impact on the Internal Rate of Returns (IRR’s) is shown in Table D1 (see Appendix D). The capital cost of the 20 year replacement period option is significantly lower, and the IRR higher. However, the risk of a machine breakdown during the critical periods of harvesting increases – an expected loss in income not captured by the model and in most cases not acceptable for producers in higher yield areas. The option of buying cheaper models of well-known European combine harvester brands manufactured elsewhere is also not preferred by Western Cape wheat producers as they expect the saving on a cheaper model to be exceeded by a loss in income if the lighter axle model breaks during harvesting – a risk that they cannot afford to take.
6 Developed by TE Kleynhans and W Hoffmann at the University of Stellenbosch.
0.0
2.0
4.0
6.0
8.0
10.0
12.0
14.0
16.0
Repairs and parts
%2006/07 Swartland 2007/08 Swartland 2008/09 Swartland
2006/07 Western Free State 2007/08 Western Free State 2008/09 Western Free State
2006/07 Eastern Free State 2007/08 Eastern Free State 2008/09 Eastern Free State
Change in the relative
contribution of
repairs and parts
costs to total
variable input cost
from 2006/07 to
2008/09:
• Swartland: 10.1 to
6.2%.
• Western Free
State: 14.9 to
6.7%.
• Eastern Free
State: 13.1 to 7%.

9
Changes in fertiliser prices This section report price changes for only selected fertilizers The decision, in consultation with GSA and producer representatives, to include the identified fertilisers was based on the fact that it was relatively easy to source price information, as well as their wide use. To ensure easy interpretation of the data presented, price movements on only the local market of the identified fertilisers are presented in Figures 7 and 8. The PPI-Wheat and PPI-Maize are also included. Figure 7 shows that the trends for the items represented are generally upward. Price increases for the items depicted between 1997 and 2007 were as follows: • MAP: 167.6% increase • LAN (28): 180.5%
increase • Urea Prill: 161.4 %
increase • Potassium chloride
granular: 157.8 % increase
• PPI-Wheat: 186% increase
• PPI-Maize: 161.1% increase
Figure 7: Price indices for different fertiliser products compared to the PPI-Wheat & PPI-Maize
Source: DoA, 2008 and own calculations from list prices.
Figure 8 shows that the trends for the items represented are also generally upward. Price increases for the items depicted between 1997 and 2007 were as follows: • 3.2.1(25): 148.7%
increase • 2.1.0(30): 145.7%
increase • 3.1.0(28): 155.7%
increase • Local Supers (10.5):
157.9% increase • PPI-Wheat: 186%
increase • PPI-Maize: 161.1%
increase Figure 8: Price indices for different fertiliser
products compared to the PPI-Wheat & PPI-Maize
Source: DoA, 2008 and own calculations from list prices.
The local demand for fertiliser is in the region of 2 million tons. To meet this demand almost 70% of the fertilisers have to be imported. Annual imports of Urea amounts to 450 000 tons, LAN between 20 000 and 60 000 tons, Ammonia
The price indices for
MAP and LAN (28)
increased more than
the price index for
maize from 1997 to
2007, but less than
that of wheat.
The price indices for
3.1.0(28), 3.2.0(30),
3.1.0(28) and local
supers(10.5)
increased less that
the PPI for outputs.
However, output
prices were much
more variable
resulting in large
variations in income.
South Africa’s
demand for fertiliser
is in the region of 2
million tons. To supply
in this demand almost
70% of the
fertilisers are
imported.
020406080
100120140160180200220240260280
1997 1998 1999 2000 2001 2002 2003 2004 2005 2006 2007
Ind
ex
20
00
=1
00
Local MAP Local LAN (28)
Local Urea Pril (46) Local Potassium Chloride
PPI-Maize PPI-Wheat
020406080
100120140160180200220240260280300
1997 1998 1999 2000 2001 2002 2003 2004 2005 2006 2007
20
00
=1
00
Local 3.1.0 (28) Local 2.1.0 (30) Local 3.2.1 (25)
Local Supers (10.5) PPI-Maize PPI-Wheat
10
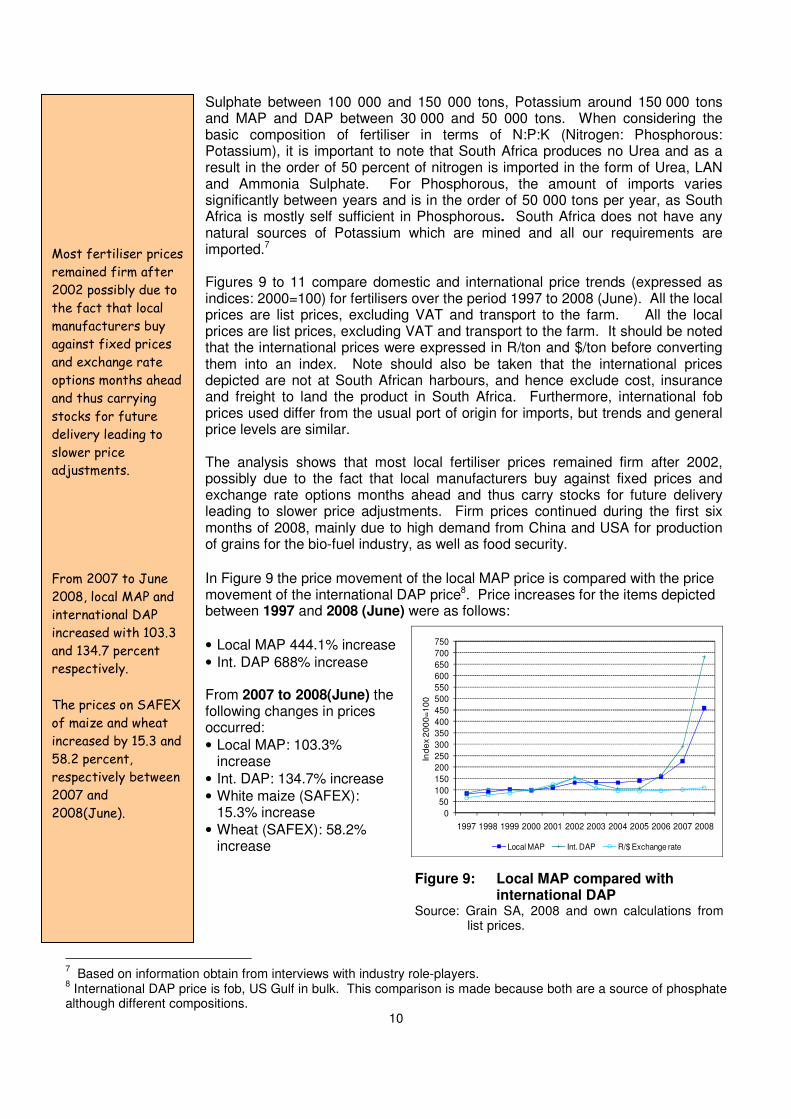
Sulphate between 100 000 and 150 000 tons, Potassium around 150 000 tons and MAP and DAP between 30 000 and 50 000 tons. When considering the basic composition of fertiliser in terms of N:P:K (Nitrogen: Phosphorous: Potassium), it is important to note that South Africa produces no Urea and as a result in the order of 50 percent of nitrogen is imported in the form of Urea, LAN and Ammonia Sulphate. For Phosphorous, the amount of imports varies significantly between years and is in the order of 50 000 tons per year, as South Africa is mostly self sufficient in Phosphorous. South Africa does not have any natural sources of Potassium which are mined and all our requirements are imported.7 Figures 9 to 11 compare domestic and international price trends (expressed as indices: 2000=100) for fertilisers over the period 1997 to 2008 (June). All the local prices are list prices, excluding VAT and transport to the farm. All the local prices are list prices, excluding VAT and transport to the farm. It should be noted that the international prices were expressed in R/ton and $/ton before converting them into an index. Note should also be taken that the international prices depicted are not at South African harbours, and hence exclude cost, insurance and freight to land the product in South Africa. Furthermore, international fob prices used differ from the usual port of origin for imports, but trends and general price levels are similar. The analysis shows that most local fertiliser prices remained firm after 2002, possibly due to the fact that local manufacturers buy against fixed prices and exchange rate options months ahead and thus carry stocks for future delivery leading to slower price adjustments. Firm prices continued during the first six months of 2008, mainly due to high demand from China and USA for production of grains for the bio-fuel industry, as well as food security. In Figure 9 the price movement of the local MAP price is compared with the price movement of the international DAP price8. Price increases for the items depicted between 1997 and 2008 (June) were as follows: • Local MAP 444.1% increase • Int. DAP 688% increase From 2007 to 2008(June) the following changes in prices occurred: • Local MAP: 103.3%
increase • Int. DAP: 134.7% increase • White maize (SAFEX):
15.3% increase • Wheat (SAFEX): 58.2%
increase
Figure 9: Local MAP compared with international DAP
Source: Grain SA, 2008 and own calculations from list prices.
7 Based on information obtain from interviews with industry role-players.
8 International DAP price is fob, US Gulf in bulk. This comparison is made because both are a source of phosphate
although different compositions.
Most fertiliser prices
remained firm after
2002 possibly due to
the fact that local
manufacturers buy
against fixed prices
and exchange rate
options months ahead
and thus carrying
stocks for future
delivery leading to
slower price
adjustments.
From 2007 to June
2008, local MAP and
international DAP
increased with 103.3
and 134.7 percent
respectively.
The prices on SAFEX
of maize and wheat
increased by 15.3 and
58.2 percent,
respectively between
2007 and
2008(June). 0
50
100
150
200
250
300
350
400
450
500
550
600
650
700
750
1997 1998 1999 2000 2001 2002 2003 2004 2005 2006 2007 2008
Inde
x 2
00
0=
10
0
Local MAP Int. DAP R/$ Exchange rate
11
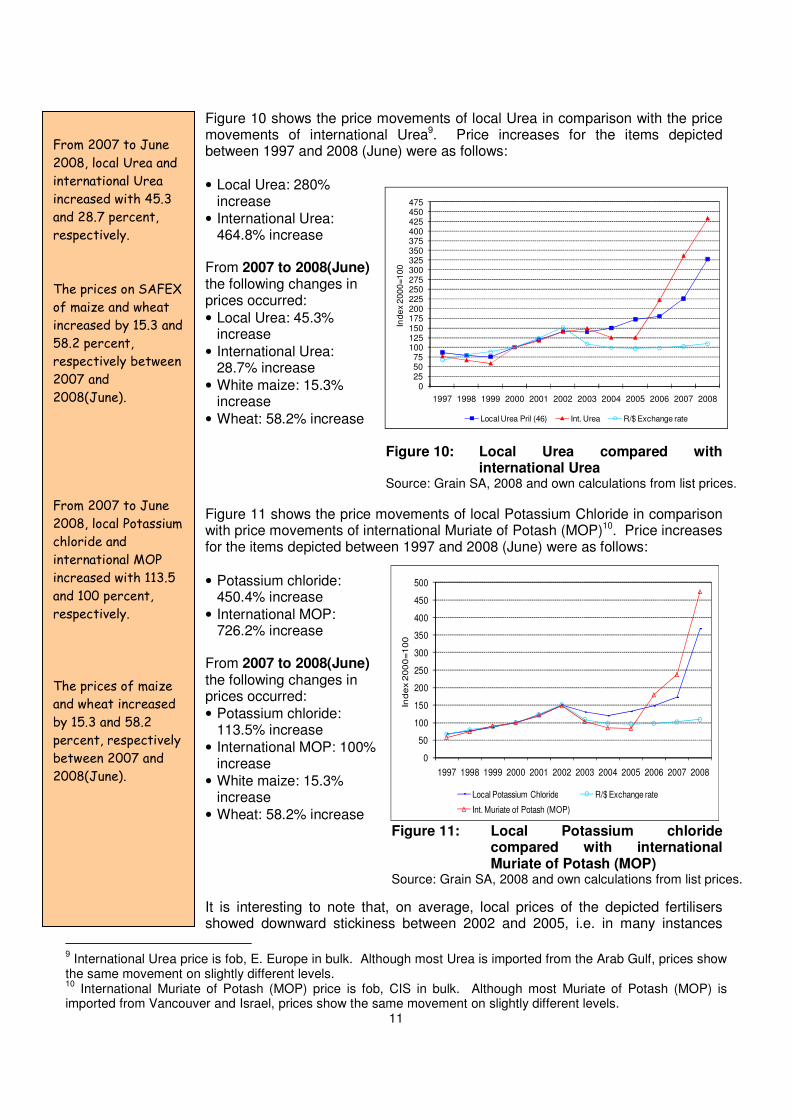
Figure 10 shows the price movements of local Urea in comparison with the price movements of international Urea9. Price increases for the items depicted between 1997 and 2008 (June) were as follows: • Local Urea: 280%
increase • International Urea:
464.8% increase From 2007 to 2008(June) the following changes in prices occurred: • Local Urea: 45.3%
increase • International Urea:
28.7% increase • White maize: 15.3%
increase • Wheat: 58.2% increase
Figure 10: Local Urea compared with
international Urea Source: Grain SA, 2008 and own calculations from list prices.
Figure 11 shows the price movements of local Potassium Chloride in comparison with price movements of international Muriate of Potash (MOP)10. Price increases for the items depicted between 1997 and 2008 (June) were as follows: • Potassium chloride:
450.4% increase • International MOP:
726.2% increase From 2007 to 2008(June) the following changes in prices occurred: • Potassium chloride:
113.5% increase • International MOP: 100%
increase • White maize: 15.3%
increase • Wheat: 58.2% increase
Figure 11: Local Potassium chloride compared with international Muriate of Potash (MOP)
Source: Grain SA, 2008 and own calculations from list prices.
It is interesting to note that, on average, local prices of the depicted fertilisers showed downward stickiness between 2002 and 2005, i.e. in many instances
9 International Urea price is fob, E. Europe in bulk. Although most Urea is imported from the Arab Gulf, prices show
the same movement on slightly different levels. 10
International Muriate of Potash (MOP) price is fob, CIS in bulk. Although most Muriate of Potash (MOP) is imported from Vancouver and Israel, prices show the same movement on slightly different levels.
From 2007 to June
2008, local Urea and
international Urea
increased with 45.3
and 28.7 percent,
respectively.
The prices on SAFEX
of maize and wheat
increased by 15.3 and
58.2 percent,
respectively between
2007 and
2008(June).
From 2007 to June
2008, local Potassium
chloride and
international MOP
increased with 113.5
and 100 percent,
respectively.
The prices of maize
and wheat increased
by 15.3 and 58.2
percent, respectively
between 2007 and
2008(June).
0255075
100125150175200225250275300325350375400425450475
1997 1998 1999 2000 2001 2002 2003 2004 2005 2006 2007 2008In
de
x 2
00
0=1
00
Local Urea Pril (46) Int. Urea R/$ Exchange rate
0
50
100
150
200
250
300
350
400
450
500
1997 1998 1999 2000 2001 2002 2003 2004 2005 2006 2007 2008
Ind
ex 2
00
0=1
00
Local Potassium Chloride R/$ Exchange rate
Int. Muriate of Potash (MOP)
12
75
100
125
150
175
200
225
250
275
2000 2001 2002 2003 2004 2005 2006 2007
2000=
100
P P I-Wheat W heat s eed price index P P I-Maiz e Maiz e s eed price index
fertiliser prices did not follow the same downward trend seen for international prices expressed in R/ton. As mentioned this is, amongst other things, due to forward cover on exchange rate options and order banking with fixed prices. Other factors that have an influence on the local market prices for fertilisers are the variability of local demand and stocks, oil prices and shipping fees. Developments in the bio-fuel markets also have a noticeable influence on fertiliser prices in that they influence the international demand for fertilisers, and hence the availability of base material.
Changes in maize and wheat seed prices
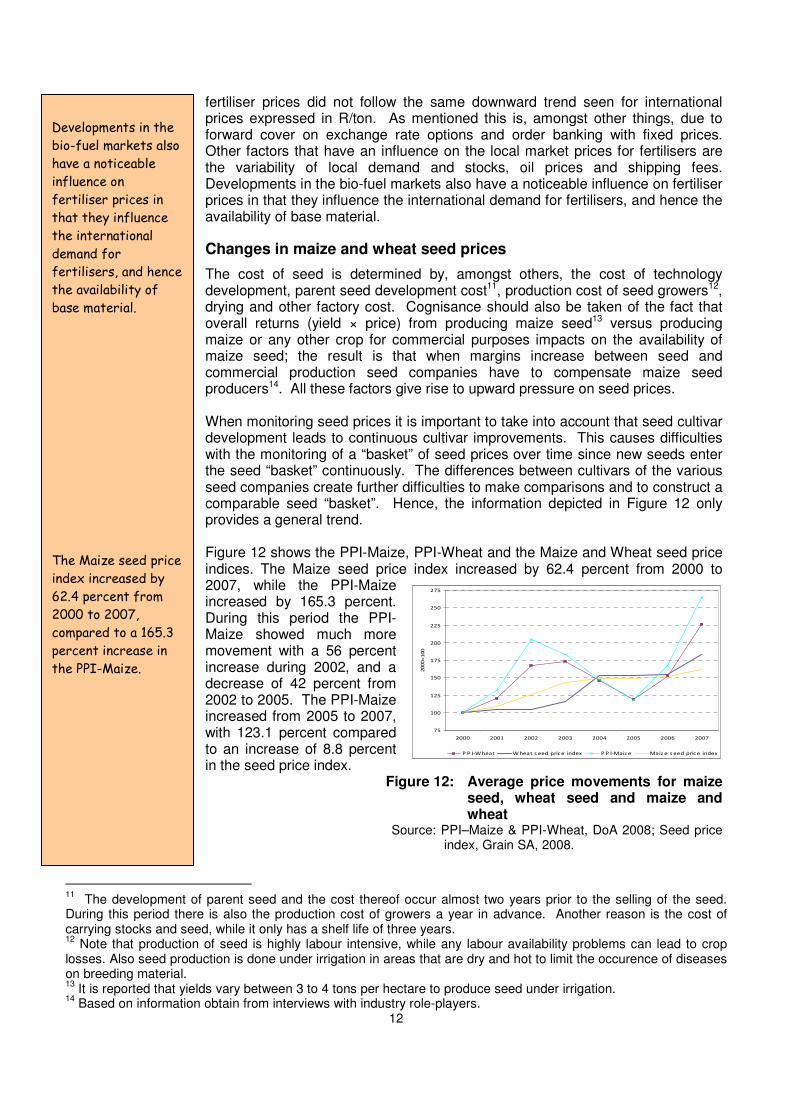
The cost of seed is determined by, amongst others, the cost of technology development, parent seed development cost11, production cost of seed growers12, drying and other factory cost. Cognisance should also be taken of the fact that overall returns (yield × price) from producing maize seed13 versus producing maize or any other crop for commercial purposes impacts on the availability of maize seed; the result is that when margins increase between seed and commercial production seed companies have to compensate maize seed producers14. All these factors give rise to upward pressure on seed prices. When monitoring seed prices it is important to take into account that seed cultivar development leads to continuous cultivar improvements. This causes difficulties with the monitoring of a “basket” of seed prices over time since new seeds enter the seed “basket” continuously. The differences between cultivars of the various seed companies create further difficulties to make comparisons and to construct a comparable seed “basket”. Hence, the information depicted in Figure 12 only provides a general trend. Figure 12 shows the PPI-Maize, PPI-Wheat and the Maize and Wheat seed price indices. The Maize seed price index increased by 62.4 percent from 2000 to 2007, while the PPI-Maize increased by 165.3 percent. During this period the PPI-Maize showed much more movement with a 56 percent increase during 2002, and a decrease of 42 percent from 2002 to 2005. The PPI-Maize increased from 2005 to 2007, with 123.1 percent compared to an increase of 8.8 percent in the seed price index.
Figure 12: Average price movements for maize seed, wheat seed and maize and wheat
Source: PPI–Maize & PPI-Wheat, DoA 2008; Seed price index, Grain SA, 2008.
11
The development of parent seed and the cost thereof occur almost two years prior to the selling of the seed. During this period there is also the production cost of growers a year in advance. Another reason is the cost of carrying stocks and seed, while it only has a shelf life of three years. 12
Note that production of seed is highly labour intensive, while any labour availability problems can lead to crop losses. Also seed production is done under irrigation in areas that are dry and hot to limit the occurence of diseases on breeding material. 13
It is reported that yields vary between 3 to 4 tons per hectare to produce seed under irrigation. 14
Based on information obtain from interviews with industry role-players.
Developments in the
bio-fuel markets also
have a noticeable
influence on
fertiliser prices in
that they influence
the international
demand for
fertilisers, and hence
the availability of
base material.
The Maize seed price
index increased by
62.4 percent from
2000 to 2007,
compared to a 165.3
percent increase in
the PPI-Maize.
13
Figure 12 further shows that the Wheat seed price index increased by 83.2 percent from 2000 to 2007, while the PPI-Wheat increased by 126.3 percent. During this period the PPI-Wheat also showed much more movement with a 39.2 percent increase during 2002, and a decrease of 28.8 percent from 2002 to 2005. The PPI-Wheat increased from 2005 to 2007, by 90 percent compared to an increase of 19.6 percent in the seed price index.
Changes in tractor prices
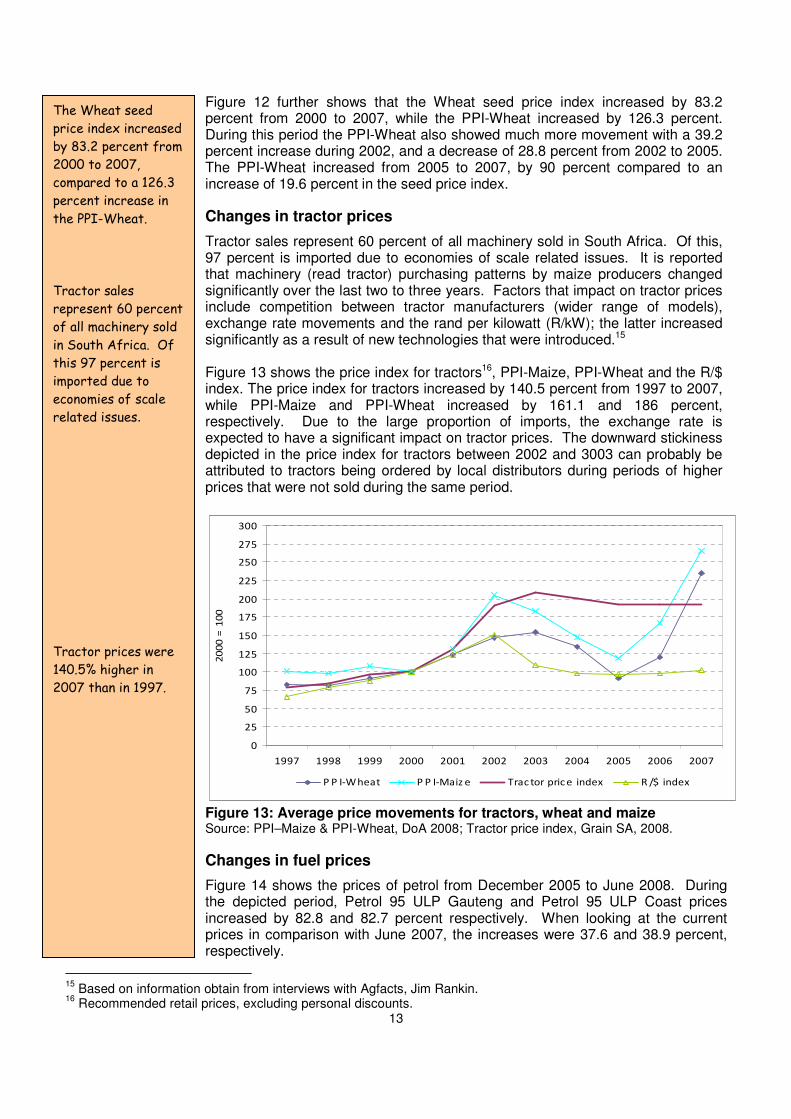
Tractor sales represent 60 percent of all machinery sold in South Africa. Of this, 97 percent is imported due to economies of scale related issues. It is reported that machinery (read tractor) purchasing patterns by maize producers changed significantly over the last two to three years. Factors that impact on tractor prices include competition between tractor manufacturers (wider range of models), exchange rate movements and the rand per kilowatt (R/kW); the latter increased significantly as a result of new technologies that were introduced.15 Figure 13 shows the price index for tractors16, PPI-Maize, PPI-Wheat and the R/$ index. The price index for tractors increased by 140.5 percent from 1997 to 2007, while PPI-Maize and PPI-Wheat increased by 161.1 and 186 percent, respectively. Due to the large proportion of imports, the exchange rate is expected to have a significant impact on tractor prices. The downward stickiness depicted in the price index for tractors between 2002 and 3003 can probably be attributed to tractors being ordered by local distributors during periods of higher prices that were not sold during the same period.
Figure 13: Average price movements for tractors, wheat and maize Source: PPI–Maize & PPI-Wheat, DoA 2008; Tractor price index, Grain SA, 2008.
Changes in fuel prices
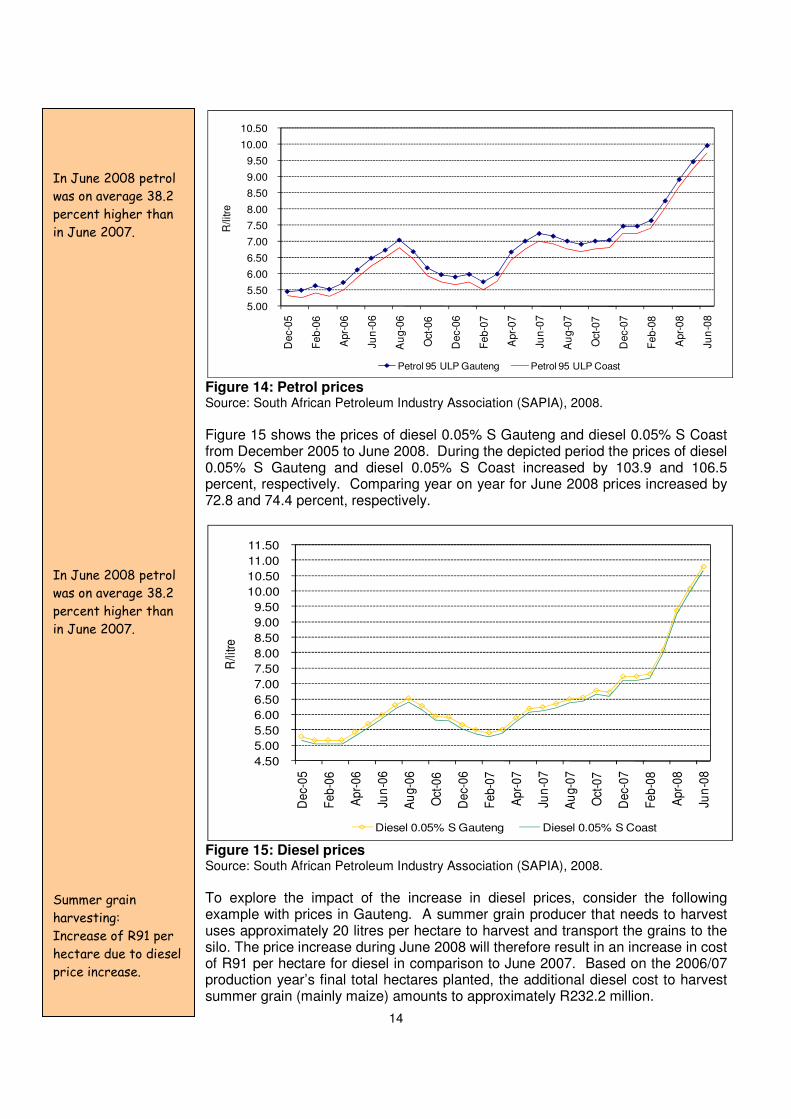
Figure 14 shows the prices of petrol from December 2005 to June 2008. During the depicted period, Petrol 95 ULP Gauteng and Petrol 95 ULP Coast prices increased by 82.8 and 82.7 percent respectively. When looking at the current prices in comparison with June 2007, the increases were 37.6 and 38.9 percent, respectively.
15
Based on information obtain from interviews with Agfacts, Jim Rankin. 16
Recommended retail prices, excluding personal discounts.
0
25
50
75
100
125
150
175
200
225
250
275
300
1997 1998 1999 2000 2001 2002 2003 2004 2005 2006 2007
20
00
= 1
00
P P I-Wheat P P I-Maiz e Trac tor pric e index R /$ index
The Wheat seed
price index increased
by 83.2 percent from
2000 to 2007,
compared to a 126.3
percent increase in
the PPI-Wheat.
Tractor sales
represent 60 percent
of all machinery sold
in South Africa. Of
this 97 percent is
imported due to
economies of scale
related issues.
Tractor prices were
140.5% higher in
2007 than in 1997.
14
Figure 14: Petrol prices Source: South African Petroleum Industry Association (SAPIA), 2008.
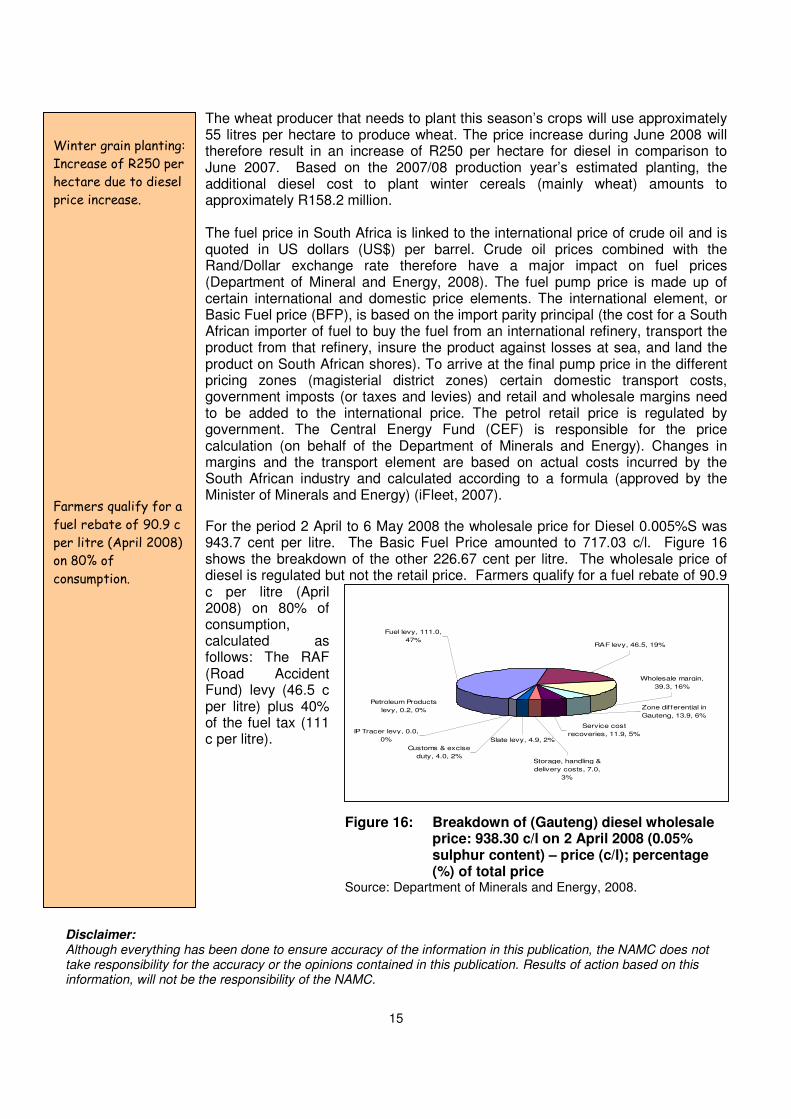
Figure 15 shows the prices of diesel 0.05% S Gauteng and diesel 0.05% S Coast from December 2005 to June 2008. During the depicted period the prices of diesel 0.05% S Gauteng and diesel 0.05% S Coast increased by 103.9 and 106.5 percent, respectively. Comparing year on year for June 2008 prices increased by 72.8 and 74.4 percent, respectively.
Figure 15: Diesel prices Source: South African Petroleum Industry Association (SAPIA), 2008.
To explore the impact of the increase in diesel prices, consider the following example with prices in Gauteng. A summer grain producer that needs to harvest uses approximately 20 litres per hectare to harvest and transport the grains to the silo. The price increase during June 2008 will therefore result in an increase in cost of R91 per hectare for diesel in comparison to June 2007. Based on the 2006/07 production year’s final total hectares planted, the additional diesel cost to harvest summer grain (mainly maize) amounts to approximately R232.2 million.
5.00
5.50
6.00
6.50
7.00
7.50
8.00
8.50
9.00
9.50
10.00
10.50
Dec-
05
Fe
b-0
6
Apr-
06
Jun
-06
Au
g-0
6
Oct
-06
Dec-
06
Fe
b-0
7
Apr-
07
Jun
-07
Au
g-0
7
Oct
-07
Dec-
07
Fe
b-0
8
Apr-
08
Jun
-08
R/li
tre
Petrol 95 ULP Gauteng Petrol 95 ULP Coast
4.50
5.00
5.50
6.00
6.50
7.00
7.50
8.00
8.50
9.00
9.50
10.00
10.50
11.00
11.50
De
c-0
5
Fe
b-0
6
Ap
r-0
6
Jun
-06
Au
g-0
6
Oct
-06
De
c-0
6
Fe
b-0
7
Ap
r-0
7
Jun
-07
Au
g-0
7
Oct
-07
De
c-0
7
Fe
b-0
8
Ap
r-0
8
Jun
-08
R/li
tre
Diesel 0.05% S Gauteng Diesel 0.05% S Coast
In June 2008 petrol
was on average 38.2
percent higher than
in June 2007.
In June 2008 petrol
was on average 38.2
percent higher than
in June 2007.
Summer grain
harvesting:
Increase of R91 per
hectare due to diesel
price increase.
15
RAF levy, 46.5, 19%
Fuel levy, 111.0,
47%
Zone differential in
Gauteng, 13.9, 6%
Wholesale margin,
39.3, 16%
IP Tracer levy, 0.0,
0% Slate levy, 4.9, 2%
Customs & excise
duty, 4.0, 2%
Petroleum Products
levy, 0.2, 0%
Service cost
recoveries, 11.9, 5%
Storage, handling &
delivery costs, 7.0,
3%
The wheat producer that needs to plant this season’s crops will use approximately 55 litres per hectare to produce wheat. The price increase during June 2008 will therefore result in an increase of R250 per hectare for diesel in comparison to June 2007. Based on the 2007/08 production year’s estimated planting, the additional diesel cost to plant winter cereals (mainly wheat) amounts to approximately R158.2 million. The fuel price in South Africa is linked to the international price of crude oil and is quoted in US dollars (US$) per barrel. Crude oil prices combined with the Rand/Dollar exchange rate therefore have a major impact on fuel prices (Department of Mineral and Energy, 2008). The fuel pump price is made up of certain international and domestic price elements. The international element, or Basic Fuel price (BFP), is based on the import parity principal (the cost for a South African importer of fuel to buy the fuel from an international refinery, transport the product from that refinery, insure the product against losses at sea, and land the product on South African shores). To arrive at the final pump price in the different pricing zones (magisterial district zones) certain domestic transport costs, government imposts (or taxes and levies) and retail and wholesale margins need to be added to the international price. The petrol retail price is regulated by government. The Central Energy Fund (CEF) is responsible for the price calculation (on behalf of the Department of Minerals and Energy). Changes in margins and the transport element are based on actual costs incurred by the South African industry and calculated according to a formula (approved by the Minister of Minerals and Energy) (iFleet, 2007).
For the period 2 April to 6 May 2008 the wholesale price for Diesel 0.005%S was 943.7 cent per litre. The Basic Fuel Price amounted to 717.03 c/l. Figure 16 shows the breakdown of the other 226.67 cent per litre. The wholesale price of diesel is regulated but not the retail price. Farmers qualify for a fuel rebate of 90.9 c per litre (April 2008) on 80% of consumption, calculated as follows: The RAF (Road Accident Fund) levy (46.5 c per litre) plus 40% of the fuel tax (111 c per litre).
Figure 16: Breakdown of (Gauteng) diesel wholesale price: 938.30 c/l on 2 April 2008 (0.05% sulphur content) – price (c/l); percentage (%) of total price
Source: Department of Minerals and Energy, 2008.
Disclaimer:
Although everything has been done to ensure accuracy of the information in this publication, the NAMC does not take responsibility for the accuracy or the opinions contained in this publication. Results of action based on this information, will not be the responsibility of the NAMC.
Winter grain planting:
Increase of R250 per
hectare due to diesel
price increase.
Farmers qualify for a
fuel rebate of 90.9 c
per litre (April 2008)
on 80% of
consumption.

16
Appendix A: Definitions of different price indices
FRPI-Total includes price indices for machinery and implements, materials for fixed improvements and intermediate goods. The latter includes fertiliser, fuel, farm feed, animal health and crop protection, packing material, and maintenance and repairs. PPI-Total includes indices of producer prices of field crops, horticulture and animal production. PPI-Field crops include indices of producer prices for summer grains, winter grains, oilseeds, sugarcane, hay, dry beans, cotton and tobacco. PPI-Maize is the price index for producer prices for maize. PPI-Wheat is the price index for producer prices for wheat.
Appendix B: Composition typical of production costs
Table B.1 shows the different input cost components included in a typical input cost budget. The focus of this report is on the variable cost component only. Table B.1: Input cost components. Variable cost Capital cost
Seed Machinery & Equipment:
Fertiliser & Lime Depreciation
Herbicides Interest
Insecticides and fungicides Fixed improvements:
Fuel Interest
Maintenance and repairs Depreciation
Crop insurance Repairs & maintenance
Casual labour
Marketing cost
Drying & cleaning cost
License & Insurance
Permanent labour
Interest on production credit
Contract work
Other cost
17
Table B.2 shows the different input cost components included in a typical input cost budget for wheat. The focus of this report is on the variable cost component only. Table B.2: Input cost components.
Variable cost Capital cost
Seed Machinery & Equipment:
Fertiliser & Lime Depreciation
Herbicides Interest
Insecticides en fungicides Fixed improvements:
Fuel Interest
Maintenance and repairs Depreciation
Crop insurance Repairs & maintenance
Casual labour
Marketing cost
Drying & cleaning cost
License & Insurance
Permanent labour
Interest on production credit
Contract work
Other cost
Appendix C: “Other cost” & “All other” cost items
The “other cost” category includes banking fees, printing and stationary, donations, water and electricity, telephone and auditing costs. The “All other” cost category includes cost of crop insurance, marketing, drying and cleaning, license and insurance, and contract work.
18
Appendix D: Impact of expanding the replacement period on return on investment Table D1: Impact of mechanization structure expanding normal replacement trend of 12 years to 20 years in selected
wheat producing areas REGION YIELD VARIATION DUE TO
CLIMATE IRR
SWARTLAND POOR AVERAGE GOOD MIDDLE SWARTLAND (12 years) # FREQUENCY* 1 7 2 **FARM SIZE: 800HA WHEAT YIELD (T/HA) 1.8 2.4 3.0 ***GPV (R/HA) 2032.85 2609.28 3162.92 GROSS MARGIN (R/HA) 695.17 1394.94 1557.33 GROSS MARGIN % 34.20% 53.46% 49.24% NET FARM INCOME (R/HA) -216.21 483.56 645.95 2.10%
SWARTLAND POOR AVERAGE GOOD MIDDLE SWARTLAND (20 years) ## FREQUENCY* 1 7 2 **FARM SIZE: 800HA WHEAT YIELD (T/HA) 1.8 2.4 3.0 ***GPV (R/HA) 2032.85 2609.28 3162.92 GROSS MARGIN (R/HA) 695.17 1394.94 1557.33 GROSS MARGIN % 34.20% 53.46% 49.24% NET FARM INCOME (R/HA) -162.56 537.20 699.60 3.49%
SWARTLAND POOR AVERAGE GOOD ROOI KAROO(12 years) FREQUENCY* 3 6 1 **FARM SIZE: 980HA WHEAT YIELD (T/HA) 0.7 1.3 2.0 ***GPV (R/HA) 1236.82 1642.52 211.84 GROSS MARGIN (R/HA) 523.22 836.74 1345.73 GROSS MARGIN % 42.30% 50.94% 63.60% NET FARM INCOME (R/HA) 44.71 358.24 867.22 2.23%
SWARTLAND POOR AVERAGE GOOD ROOI KAROO (20 years) FREQUENCY* 3 6 1 **FARM SIZE: 980HA WHEAT YIELD (T/HA) 0.7 1.3 2.0 ***GPV (R/HA) 1236.82 1642.52 211.84 GROSS MARGIN (R/HA) 523.22 836.74 1345.73 GROSS MARGIN % 42.30% 50.94% 63.60% NET FARM INCOME (R/HA) 70.32 383.84 892.83 3.36%
SOUTHERN CAPE POOR AVERAGE GOOD MIDDLE RUENS (12 years) FREQUENCY* 2 5 3 **FARM SIZE: 1600HA WHEAT YIELD (T/HA) 1.8 2.2 2.5 ***GPV (R/HA) 2030.41 2317.80 2536.67 GROSS MARGIN (R/HA) 460.69 765.12 935.93 GROSS MARGIN % 22.96% 33.01% 36.90% NET FARM INCOME (R/HA) -127.53 176.89 347.71 1.05%
SOUTHERN CAPE POOR AVERAGE GOOD MIDDLE RUENS (20 years) FREQUENCY* 2 5 3 **FARM SIZE: 1600HA WHEAT YIELD (T/HA) 1.8 2.2 2.5 ***GPV (R/HA) 2030.41 2317.80 2536.67 GROSS MARGIN (R/HA) 460.69 765.12 935.93 GROSS MARGIN % 22.96% 33.01% 36.90% NET FARM INCOME (R/HA) -56.71 247.72 418.53 2.40% # Indicate the farm model with normal machinery replacement period ## Results for situation where machinery is kept longer than the normal replacement period