input-output approaches to analyzing trade in global value
TRANSCRIPT

Input-output approaches to analyzing trade linkages of Latin America: Links to public policy
John Arvin Bernabe
Consultant
Statistics and Data Innovation Unit
Asian Development Bank
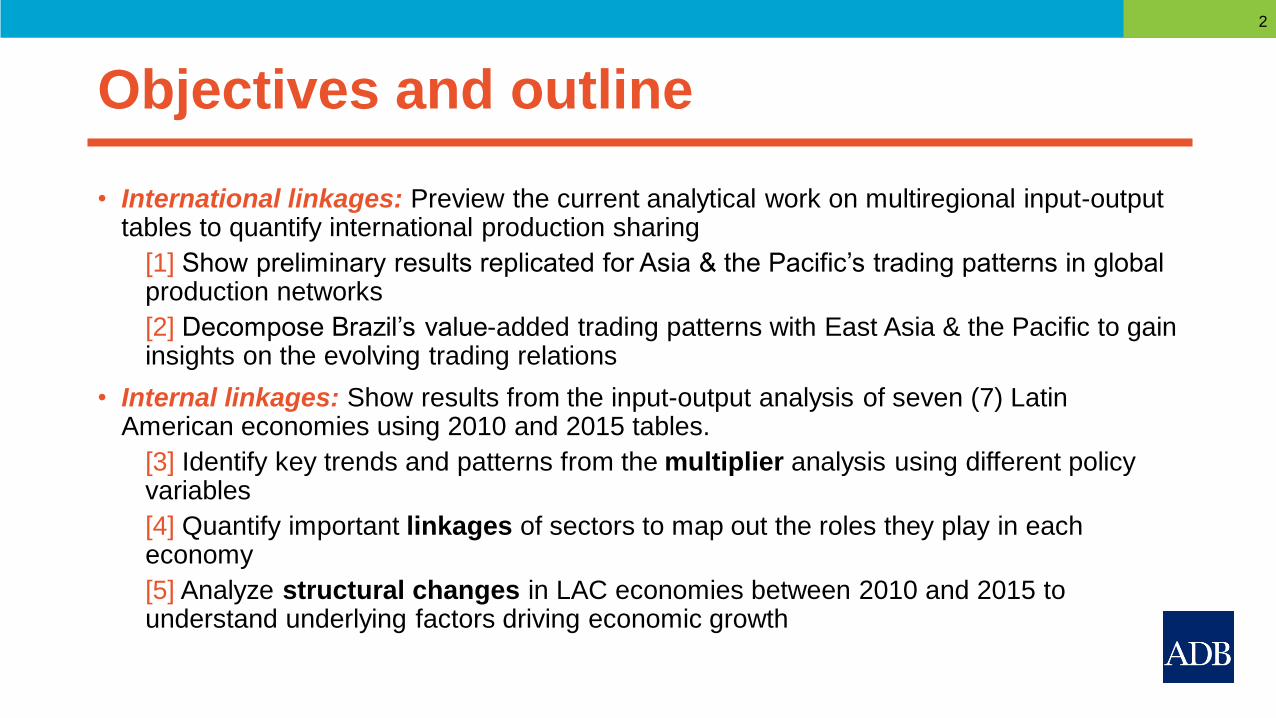
Objectives and outline
• International linkages: Preview the current analytical work on multiregional input-output tables to quantify international production sharing
[1] Show preliminary results replicated for Asia & the Pacific’s trading patterns in global production networks
[2] Decompose Brazil’s value-added trading patterns with East Asia & the Pacific to gain insights on the evolving trading relations
• Internal linkages: Show results from the input-output analysis of seven (7) Latin American economies using 2010 and 2015 tables.
[3] Identify key trends and patterns from the multiplier analysis using different policy variables
[4] Quantify important linkages of sectors to map out the roles they play in each economy
[5] Analyze structural changes in LAC economies between 2010 and 2015 to understand underlying factors driving economic growth
2

Part I. Introduction to the GVC analytical databaseTrade is increasingly flowing through global value chains, creating measurement challengesdue to globalization and technological advances. Accounting for global value chainstherefore becomes important for capturing the gains and managing risks.
3

What’s out there at the moment?
4
Database Number of countries Number of products and industries Years
AIIOT (IDE-JETRO) 10 (8 for 1975 table) 75 products (56 for 1975 table, 77 for
1985 table)
1975, 195, 1990, 1995, 2000, 2005
EORA MRIO 187 countries Varying across countries; simplified
version with 26 industries
1990-2013
EXIOBASE Versions 2 and 3 are more
enhanced
43 countries; 5 world regions 220 products; 163 industries 2000, 2007
FIGARO 28 EU countries; USA; Rest of the World 64 industries; 64 products 2010; 2010-2017 in progress
Global MRIO LAB 220 countries Flexible choice: 6357 products, industry
root classification
1990-2015 (preliminary data)
GTAP-MRIO 140 GTAP regions 57 GTAP commodities 2004, 2007, 2011
OECD-ICIO 64 (including Rest of the World) 34 industries; 34 products 1995-2011 (ISIC 3; nowcasted 2012-
2014); 2005-2011 (ISIC 4)
WIOD (2013 and 2016 release versions) 43 (including Rest of the World) 64 products; 56 industries 2000-2014
ADB MRIO 63 (including Rest of the World) Varying SUT dimensions; harmonized
to 35 industries
2000; 2007-2017 (2018 update on-
going)
International / Intercountry Input-Output Tables
Source: UN Handbook on Supply Use Tables and Input-Output Tables

What do we know so far?
5
Size Speed Orientation Shape Length
Breadth Depth Position
Data helps us contextualize global value chains.

Size: How important are GVCs?
6
Size Speed Orientation Shape Length
Breadth Depth Position

C
Pure Domestic Production Traditional Trade Complex GVC
r
C
Simple GVC
r r
C
s
r
C
Traditional production / trade GVC trade
Production & Consumption: 1 place Production: 1 place
Consumption: >1 place
Border crossing: 1
Production: >1 place
Consumption: >1 place
Border crossing: 1
Production: >1 place
Consumption: >1 place
Border crossing: >1
Decomposition of GDP by industry into four (4) types based on nature of cross-border production-sharing activities (Wang, Wei & Zhu 2017)
Gross Domestic Product
Size: How important are GVCs?

Size: How much GVC activity is happening?
8
2000 2007 2008 2009 2010 2011 2012 2013 2014 2015 2016 2017
Traditional trade Simple GVCs Complex GVCs
72%
74%
76%
78%
80%
82%
84%
86%
2000 2007 2008 2009 2010 2011 2012 2013 2014 2015 2016 2017
East Asia & Pacific domestic production as % of total Trade components in global production (US$ mln)
Trade in intermediate goods has slowed down in recent years.
Global value chains are being reshaped as domestic consumption in emerging market economies increase, domestic supply chains take inroads, and trade
in services become more predominant in global trade.

Size: How much GVC activity is happening?
9
0%
10%
20%
30%
40%
50%
60%
70%
80%
90%
100%
Share of goods & services in simple GVCs
Goods Services
0%
10%
20%
30%
40%
50%
60%
70%
80%
90%
100%
Share of goods and services in complex GVCs
Goods Services
-0.2
-0.1
0
0.1
0.2
2008 2009 2010 2011 2012 2013 2014 2015 2016 2017
% Changes in structural shares of goods and services in total GVC production
Goods Services
As services component in complex GVCs grow more significant, trade openness policies lean more towards the intangibles and skills development.
Services restrictiveness index by sector versus average GVC participation index, 2017
Ave. G
VC
part
icip
ation b
y
countr
y-s
ecto
r
Services restrictiveness index by sector

Speed: Are GVCs slowing down?
10
Size Speed Orientation Shape Length
Breadth Depth Position

Speed: The many “phases” of complex GVCs
11
-30%
-20%
-10%
0%
10%
20%
30%
40%
2008 2009 2010 2011 2012 2013 2014 2015 2016 2017
Domestic Traditional trade Simple GVCs Complex GVCs
Growth rates (%) of production components in East Asia and the Pacific
Weak phases of GVC growth seen in recent years. Whether this is cyclical or structural is still open to debate.

Speed: The many “phases” of complex GVCs
12
East Asia and the Pacific’s domestic value added contribution to exports is correlated with trading partner’s growth trajectory. Higher correlation with FVA
indicate a more downstream position for East Asia and the Pacific economies.
R2 = .39 R2 = .43
As against exports of domestic value added (DVA) As against foreign value added content in exports (FVA)
Tra
de
pa
rtn
ers
’ gro
wth
pe
rfo
rma
nce
Orientation: Shifting roles in GVCs?
13
Size Speed Orientation Shape Length
Breadth Depth Position
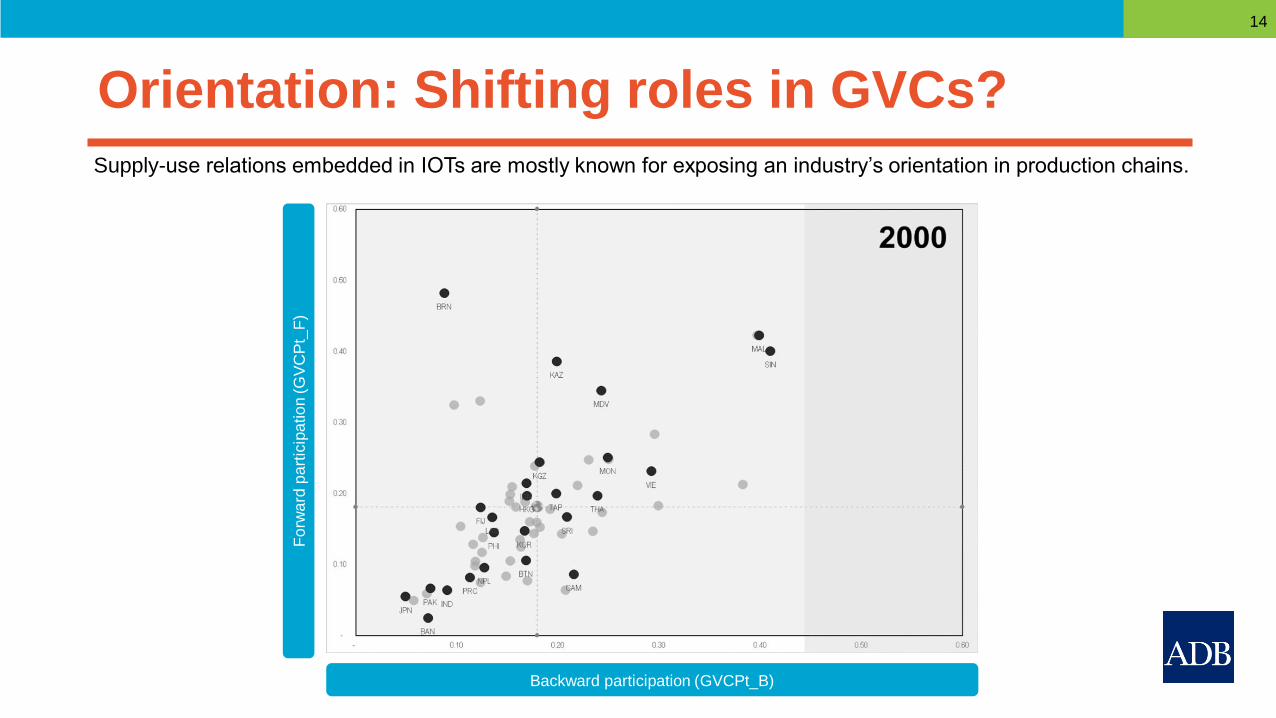
Orientation: Shifting roles in GVCs?
14
Supply-use relations embedded in IOTs are mostly known for exposing an industry’s orientation in production chains.
Backward participation (GVCPt_B)
Fo
rwa
rd p
art
icip
atio
n (G
VC
Pt_
F)

Orientation: Shifting roles in GVCs?
15
Graphs show % of value added attributed to simple and complex GVCs by sector in East Asia & Pacific
Textiles
Electronics
Transport eqpt.
Business services

Shape: Relational dimension of GVCs
16
Size Speed Orientation Shape Length
Breadth Depth Position

Shape: Relational dimension of GVCs
17
The global value chain zoo: spiders, snakes, and hybrid “snikers”: Diakantoni and others 2017, based on
Baldwin and Venables 2010 explain how trade costs could accumulation at each succession in the supply chain.

Shape: Relational dimension of GVCs
18
2000 2004 2007 2011 2014
US
’ exp
ort
s t
o P
RC
PR
C’s
exp
ort
s t
o U
S
Value added in exports of
respective economies (VAX_G)
US: 74% (2014)
PRC: 46% (2014)
“Third country” effects(value-added contribution of other
countries or FVA)
Trade in computer, electronics, and optical equipment
Bilateral perspective: US-PRC’s trade balance in the context of GVC

Shape: Relational dimension of GVCs
19
Geography of supply chains. While the image of a chain implicitly projects a succession of sequential steps, most supply chains
are not linear but are defined by a hub and spoke pattern.

Length: Are GVCs getting longer?
20
Size Speed Orientation Shape Length
Breadth Depth Position

-
1.00
2.00
3.00
4.00
5.00
6.00
- 1.00 2.00 3.00 4.00 5.00 6.00
• APLs: Indication of economic “distance” between two economies
• Longer chains compound transmission shocks, which could partly explain why complex GVCs are more affected than traditional
trade activities during periods of slowdown. In addition, length could also relate to a country’s exposure to a demand shock.
• Why are GVCs getting longer in “crisis” periods?
Length: Are GVCs getting longer?
21
2000
2017 Lengthening
(takes more
“steps” to get to
the final stage)
Shortening (takes
less “steps” to get
to the final stage) 2.9
2.92
2.94
2.96
2.98
3
3.02
3.04
3.06
3.08
2000 2007 2008 2009 2010 2011 2012 2013 2014 2015 2016 2017
Comparison of bilateral APL indices (2000 vs 2017) Global APL from 2000 to 2017

Breadth: Are GVCs reaching far enough?
22
Size Speed Orientation Shape Length
Breadth Depth Position

Breadth: Are GVCs reaching far enough?
23
2000 2017
Country perspective: Indonesia’s expanding role in value added trade (2000 versus 2017)

Shares of intra-and inter-regional GVC activities in manufacturing (%)
Factory Asia Factory Europe Factory NAFTA
Breadth: Are GVCs reaching far enough?Rise of Factory Asia. Data shows the higher the degree of economic integration in regional production networks, the higher the
intra-regional GVC activities.
Source: GVC Development Report 2019

Breadth: Are GVCs reaching far enough?
25
Flow of Domestic Value-Added (F) Generated in Asia’s Exports Production that is Sent to Asia, All Sectors, 2000 vs. 2018
2000 2018
Rise of Factory Asia. Data shows the higher the degree of economic integration in regional production networks, the higher the
intra-regional GVC activities.

Depth: Intensity of global value chain trade
26
Size Speed Orientation Shape Length
Breadth Depth Position

Depth: Intensity of global value chain trade
27
Ba
ck
wa
rd G
VC
pa
rtic
ipa
tio
nF
orw
ard
GV
C p
art
icip
ati
on
It is no surprise that GVC integration is becoming deeper for many developing economies and has matured in some.
(Note: 1 represents the average participation for East Asia and the Pacific.)
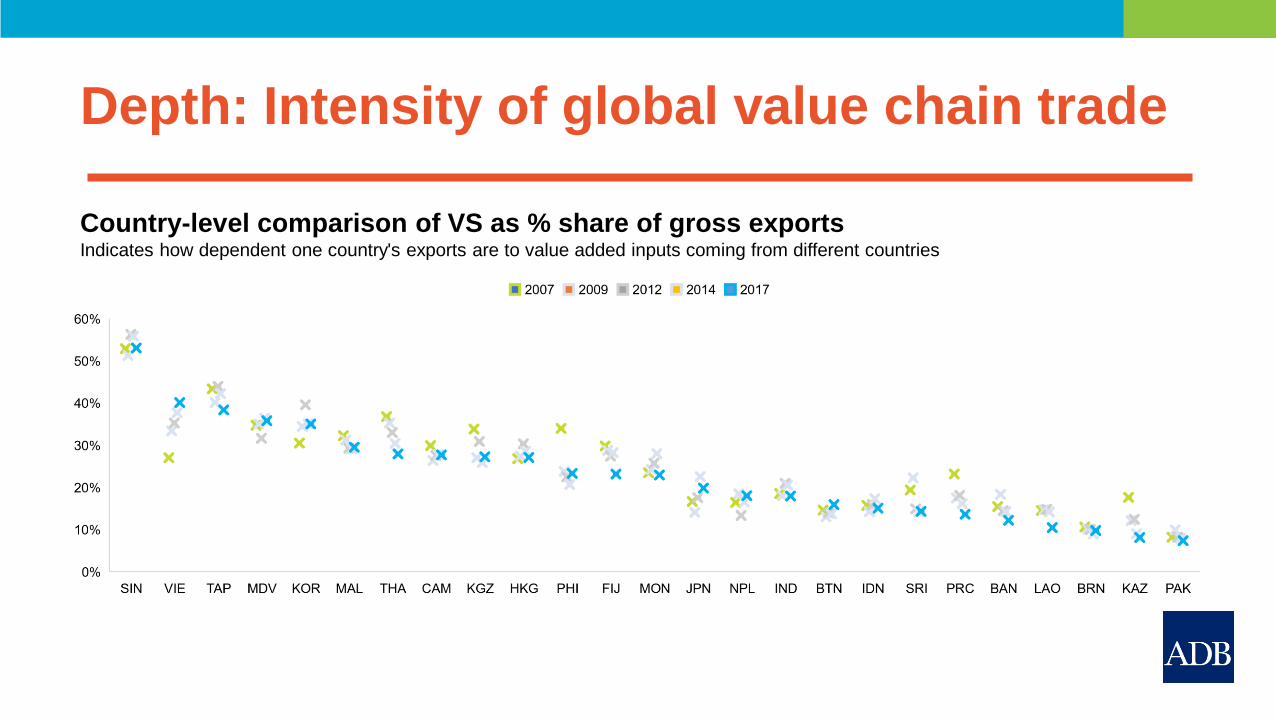
Depth: Intensity of global value chain trade
Country-level comparison of VS as % share of gross exportsIndicates how dependent one country's exports are to value added inputs coming from different countries

Depth: Intensity of global value chain trade
FV
A_
INT
AS
% S
HA
RE
OF
VS
(N
OR
MA
LIZ
ED
TO
AV
E.)
PDC AS % SHARE OF VS (NORMALIZED TO AVE.)
Deepening and lengthening of value
chains from vertical specialization
perspective, Asia, 2007-2017
Asia’s regional value chains are evolving.
Cross-country comparisons reveal varied
patterns.
PRC has grown in length and has become
more involved in intermediate goods trade
While other resource-intensive economies,
including small open economies have
historically relied on foreign value added
inputs.

Depth: Intensity of global value chain trade
20172007
2000 2007
PRE-CRISIS POST-CRISIS
HKG
SIN
MON
KAZ
TAP
THA
SRI
MALVIE
FIJ
JPN CAM
KOR
NPL
KGZ
PHI
PRCBTN
LAO
IDN
BAN
IND
0%
5%
10%
15%
20%
25%
30%
35%
40%
45%
50%
0% 10% 20% 30% 40% 50%
HKG
SIN
MON
KAZ
TAP
THA
SRI
MDVMAL
VIE
FIJ
JPN
CAM
KOR
NPL
KGZ
PHI
PRC
BTN
LAO
IDN
BAN
IND
0%
5%
10%
15%
20%
25%
30%
35%
40%
45%
50%
0% 10% 20% 30% 40% 50%
Vertical specialization performance of Asian economies: Case of Manufacturing

Depth: Intensity of global value chain trade
20172007
2000 2007
PRE-CRISIS POST-CRISIS
HKG
SINMONKAZ
TAP
THA
SRI
MDV
MAL
VIE FIJ
JPN
CAM
KOR
NPL
KGZ
PHIPRC
BTN
LAO
IDN
BAN
IND
PAK
BRN
0
0.05
0.1
0.15
0.2
0.25
0.3
0.35
0.4
0.45
0.5
0 0.1 0.2 0.3 0.4 0.5
HKG
SIN
MON
KAZ
TAP
THA
SRI
MDV
MAL
VIE
FIJ
JPN
CAM
KOR
NPL
KGZ
PHI
PRC
BTN
LAO
IDN
BAN
IND
PAK
BRN
0
0.05
0.1
0.15
0.2
0.25
0.3
0.35
0.4
0.45
0.5
0 0.1 0.2 0.3 0.4 0.5
Vertical specialization performance of Asian economies: Case of Services

7%14%
44%
26%20%
66%
46%
57%
27%31%
41%
17%
32%24%
45%
20%
53%
25% 22% 25%
38%
12%
32%
15% 15%
56% 39%
28%
43%
45%
11%
23%
16%
36% 28%
26%
40%
26%
28%
20%
26%
7%
23% 27% 22%
15%
26%
14%
12% 13%
30%
39%
19%21%
22%
9%
13%9%
18%
18%10%
18% 16%19%
5%
20%
4%
16% 14% 15% 4%
18%9%
9% 6%
0%
10%
20%
30%
40%
50%
60%
70%
80%
90%
100%
BRN KAZ PAK LAO BTN BAN PRC SRI IDN JPN FIJ MON IND KGZ NPL MAL CAM PHI THA KOR MDV TAP VIE SIN HKG
DVA_FIN DVA_INT DVA_INTrex RDV
Depth: Intensity of global value chain trade
% share of DVA_B in gross exports of manufacturing sectors, 2017

Position: Locating value in production stages
33
Size Speed Orientation Shape Length
Breadth Depth Position
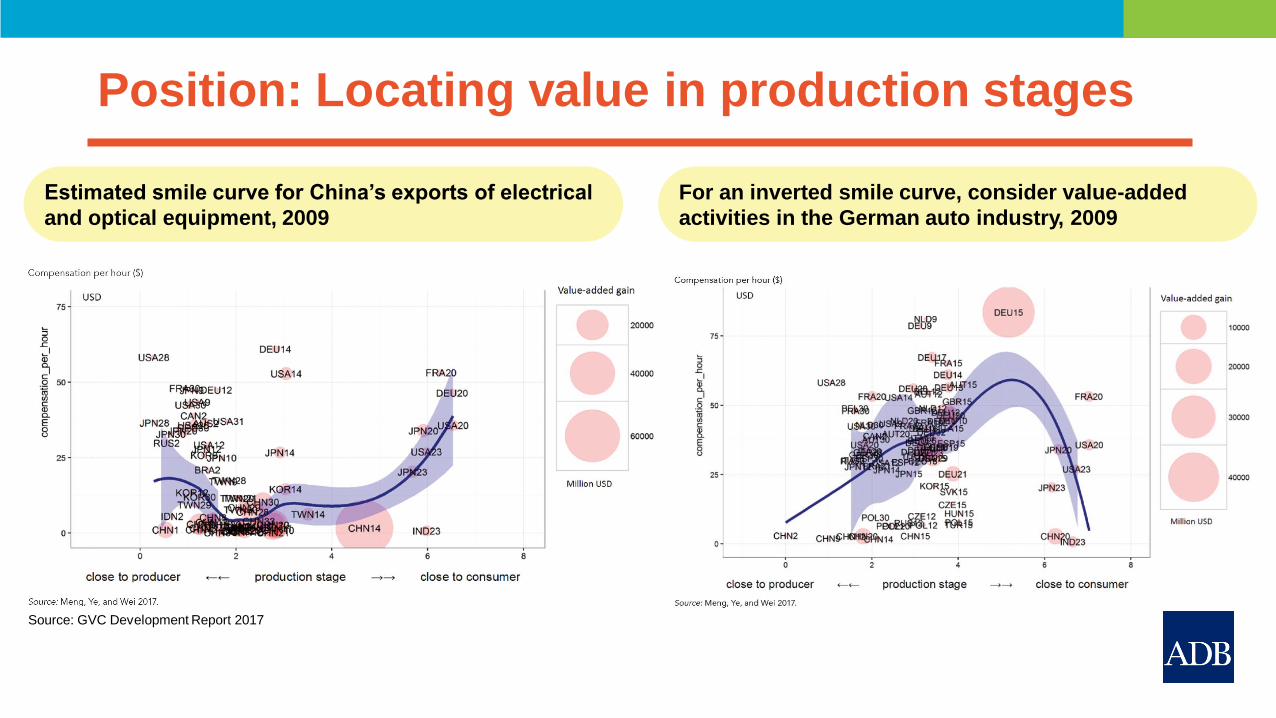
Position: Locating value in production stages
Estimated smile curve for China’s exports of electrical
and optical equipment, 2009
For an inverted smile curve, consider value-added
activities in the German auto industry, 2009
Source: GVC Development Report 2017

0
1
2
3
4
5
6
7
0 1 2 3 4 5 6 7
Upstreamness Index (2007 vs. 2017)
World DevAsia-World Intra-Asia
Position: Locating value in production stages
35
Domestic Cross-border trade
Year: 2007
Ye
ar:
20
17
Average upstreamness indices are generally declining for Asia as it shifts to downstream segments of the value chain;
Position is relative; a lot of heterogeneity is observed at the bilateral-sector levels

Position: Locating value in production stages
36
Thailand’s Textile sector is relatively more
downstream compared to average countries in
those same sectors.
Thailand’s transport equipment sector is relatively
more upstream compared to the average country
involved in that sector.
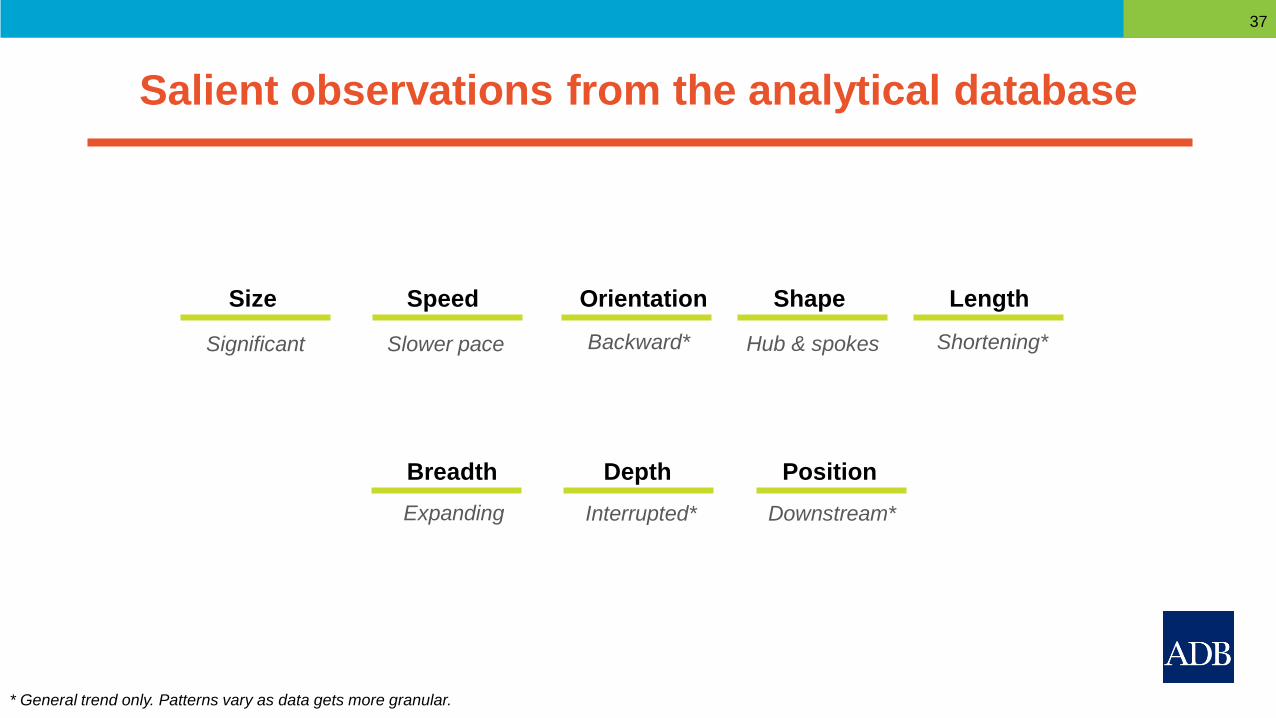
Salient observations from the analytical database
37
Size Speed Orientation Shape Length
Breadth Depth Position
Significant Slower pace Backward* Hub & spokes Shortening*
Expanding Interrupted* Downstream*
* General trend only. Patterns vary as data gets more granular.

Salient observations from the analytical database
1. GVCs are a growing component of production
2. But could be slowing down as economic activities turn inward
3. GVCs are more regional than global. The presence of Factory Asia has grown with a backward-linkage orientation in the era of mass production.
4. GVCs became more networks than chains. Economies tapped into the trade potential by integrating themselves into GVC hubs
5. But signs point to shortening value chains as demand were “reshored”
6. Deepening value chains were interrupted as risks moved “offshore”
38

Presence of Factory Asia, Factory North
America, & Factory Europe
GVCs are less linear than “chains”; they often
pertain to network of buyers, and suppliers
managed by a lead firm (see Gereffi)
Trade in tasks versus trade in goods; Trade in
sources of comparative advantage
The “shape” of value chains differ from product
to product (e.g. iPhones vs German
automobiles)
Services contribute significant value added to
manufactured goodsImports can be a source of competitiveness for
exports; It is easier to join GVCs than build an
entire chain on your own
D. Ricardo’s unit of analysis (countries)
changed as GVCs denationalized comparative
advantage
Countries with high labor productivity will have
higher wages and still be low-cost producers
Spillovers/ feed through effects are amplified;
these effects could either be beneficial or
harmful.
Some more observations from the analytical database
More “networks” than
“chains”More “regional” than “global”
What you do matters more
than what you sell
Some “smiles” can “frown” Intangibles within tangibles “Import to Export”
Firms, not countriesLow unit labor costs vs.
low labor costs
Risks too, not just
opportunities
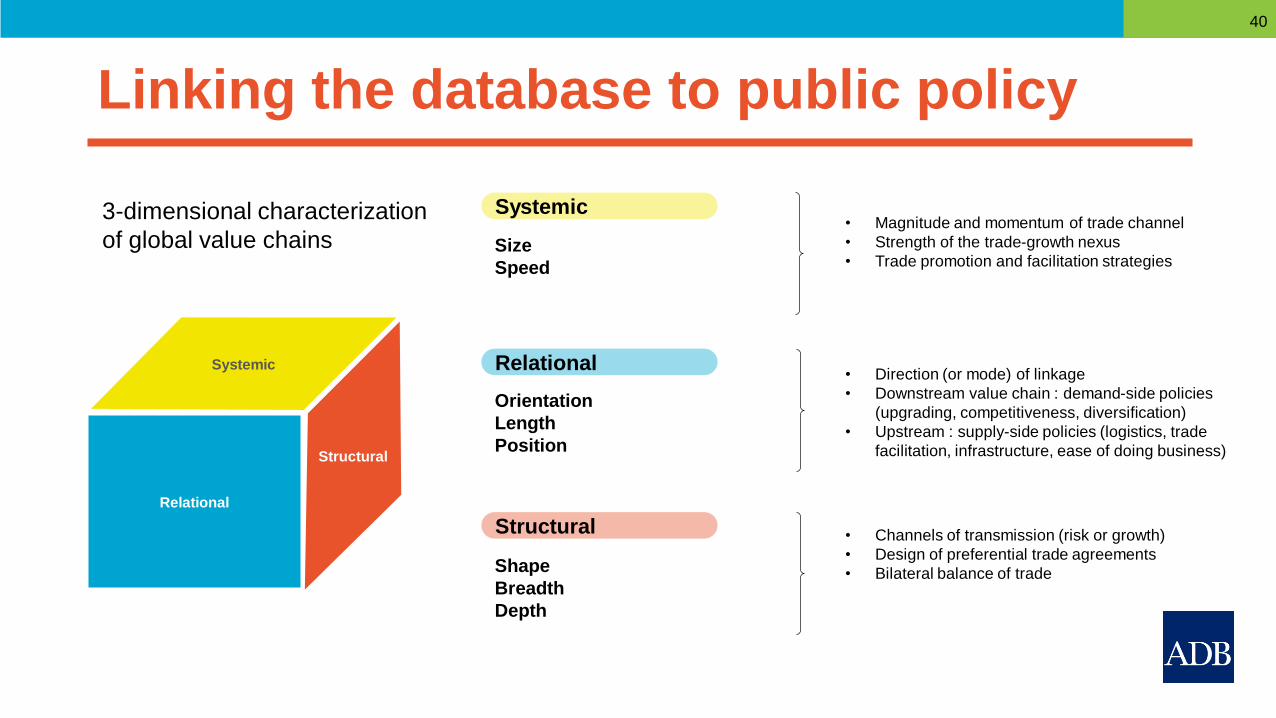
Linking the database to public policy
40
Relational
Systemic
Structural
Size
Speed
Orientation
Length
Position
Shape
Breadth
Depth
Systemic
Relational
Structural
• Magnitude and momentum of trade channel
• Strength of the trade-growth nexus
• Trade promotion and facilitation strategies
• Direction (or mode) of linkage
• Downstream value chain : demand-side policies
(upgrading, competitiveness, diversification)
• Upstream : supply-side policies (logistics, trade
facilitation, infrastructure, ease of doing business)
• Channels of transmission (risk or growth)
• Design of preferential trade agreements
• Bilateral balance of trade
3-dimensional characterization
of global value chains

Linking the database to public policy
41
GVC matters for growth.
VS growth (X) positively correlated with
value creation growth (Y) in Developing
Asia (2007-2017)
“At-the-border” policies count
Logistics performance (X) positively
correlated with vertical specialization (Y),
2007-2016
As well as across- and behind-the-
border policies
Ease of doing business (trading across
borders and enforcing contracts) links with
GVC intensity

Linking the database to public policy
42
Especially when it comes to upgrading in global value chains
Asia’s revealed comparative advantage (RCA) based on domestic value added exports (black circles) and gross exports (white ci rcles), 2017
Heavy manufacturing sectors Services sectors

Linking the database to public policy
43
GVC integration expose the need for sustained regional cooperation
Source: Hoffman, Osnago, and Ruta 2017.
Trade & Investment (W)
Money & Finance (W)
Regional Value Chain (W)
Infrastructure &Connectivity (W)
Movement of People (W)
Institutional & SocialIntegration (W)
Africa Asia EU Latin America and Caribbean
Source: ADB ERIA Asia Pacific Regional Integration Index 2016
Deep preferential agreements and GVC trade mutually reinforce each other. Regional cooperation indices reveal areas where Asia and Latin America and
Caribbean could learn from each other.

Takeaways
• Input-output approaches to building analytical database
• Knowledge of GVCs are still growing
• How we measure GVCs are still evolving
• Converging versus diverging approaches (multiple angles)
• Strengthening statistical systems for policy use
• Data collaboration and integrated ecosystems
44
https://kidb.adb.org