insert title page - gbcma€¦ · 5.1 iwc sub-indices as a management aid 16 5.2 comments on the...
TRANSCRIPT
Front Cover:
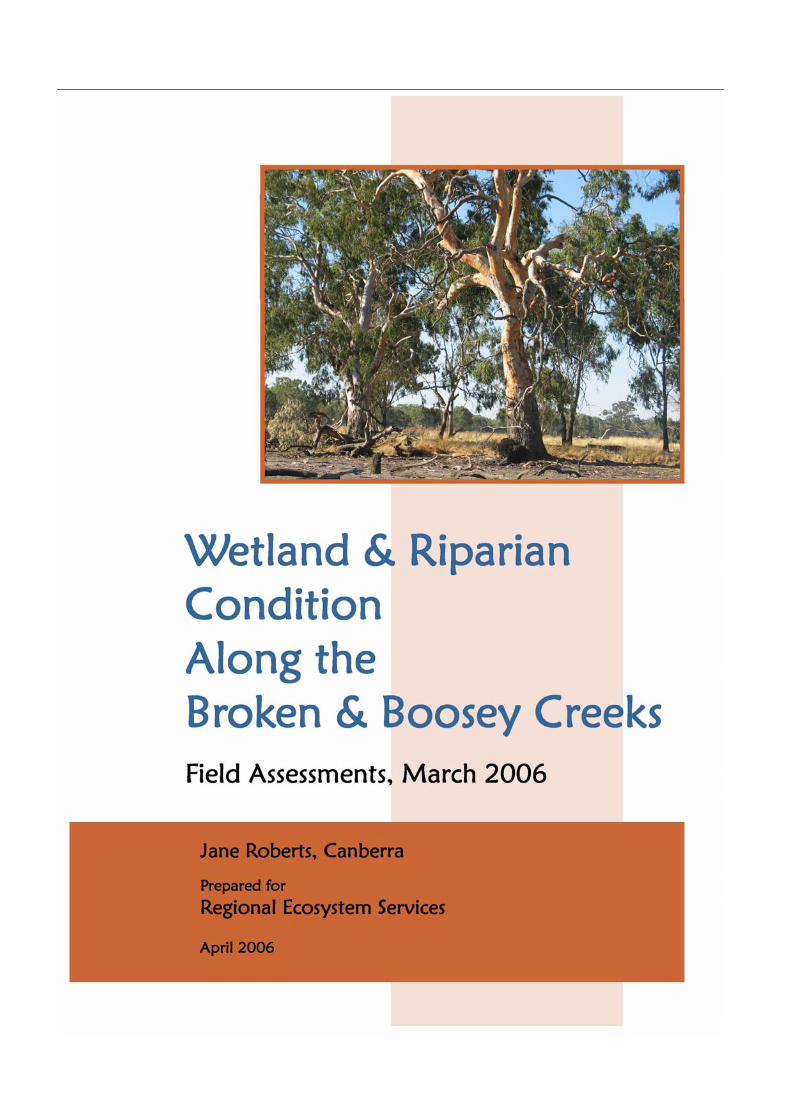
Magnificent River Red Gum
at Wetland Number 806965 on Nine Mile Creek,
6th March 2006.
Photograph:
Jane Roberts
Report:
Roberts, J. (2006). Wetland and riparian condition along the Broken and Boosey
Creeks: Field assessments, March 2006. Prepared for Regional Ecosystem
Services, Victoria. Report JR 09/2006. Canberra, ACT. April 2006.
Contact Details:
Jane Roberts
PO Box 6191. O’Connor , ACT 2602
02 6230 0320

Table of Contents
1. Introduction 1
1.1 Background 1
1.2 Wetlands in Study Area 1
1.3 Approach 3
2. Methods 5
2.1 Wetland Condition 5
2.2 Riparian Condition 5
2.3 Field Conditions 6
3. Results for Wetland Condition 7
3.1 Wetlands Assessed for Condition 7
3.2 Condition of 13 Wetlands 8
3.3 Understanding the Overall Assessment 9
3.4 Diversity of Wetland Vegetation 11
4 Results for Riparian Condition 12
4.1 Sites and Benchmark EVC 12
4.2 Riparian Condition 13
4.3 Problems with EVC Benchmark 13
5 Implications & Recommendations 16
5.1 IWC Sub-Indices as a Management Aid 16
5.2 Comments on the IWC 17
5.3 On Corrick’s Classification and Wetlands_1994 database 19
Recommendations 20
References 24
Photo Gallery 25
Appendix 1: Definitions of EVC Bioregional Status 27
Appendix 2: Wetland Size Classes 28
Appendix 3: Ecological Change 29
Appendix 4: Annotations to IWC 31


1
1. Introduction
1.1 Background Extensive clearing and intensive agriculture of the lowland areas associated with
the Broken, Boosey and Nine Mile Creeks within the Goulburn-Broken catchment
mean that many vegetation types are now endangered and many plant and
animal species are considered threatened. The area is rich in wetlands, some of
which are listed as significant, and some of these are in reserves. The area is
also rich in creeks giving a network of riparian zones, some of which are
reserved, notably in the Broken Boosey State Park.
The Goulburn-Broken Catchment Management Authority (GBCMA) is keen to
progress management of this area, and has engaged Regional Ecosystem
Services to prepare a Wetland Implementation Plan, as a planning guide. There
are nine tasks, Task A to Task I. Task E requires a description and a map of the
ecological values of vegetation of wetlands and riparian zones within the area,
drawing on existing information on condition and supplemented by new
information, to be collected in the field.
This document is a report on the field component for Task E.
1.2 Wetlands in Study Area The significance of wetlands within the study area and their diversity, as indicated
by the number and area of the main categories using Corrick’s classification, has
been summarised in Section 3 Ecological Values of the main report. The purpose
of the analysis below is to present and summarise two other characteristics
relevant to wetlands, namely size and ecological change.
Size, meaning area, is taken from the DSE database as given in the
Wetlands_1788 and Wetlands_1994 layers. Based on these, size class
distributions for three points in time (pre-settlement, 200 years later and a
decade after that) show the progressive diminution of numbers of wetlands in all
and particular size classes. The occurrence of wetlands in 2000 was determined
by inspecting aerial photography, for 2000.
Ecological change for individual wetlands is inferred from two attributes in the
DSE database, size and category of wetland at two times, pre-settlement and the
late 1980s (Wetlands_1788 and Wetlands_1994 layers in the DSE GIS). A
transition matrix is used to summarise the ‘fate’ of the 1788 wetlands.
Size Class
Wetlands in the Broken & Boosey Creek area are typically small. Nearly half of
Category 2 wetlands now and originally (48% and 49%) are in the 1-10 ha size
class. Category 3 wetlands are typically slightly bigger, with 38% and 52% of
wetlands now and originally being in the 11-25 ha size class (Figure A.2 in
Appendix 2).

2
Ecological Change
The types of ecological changes that can be determined from the two wetland
layers in the DSE database are change in wetland category and change in area.
Change in water regime is considered to be a greater ecological change at the
site level, but changes in area (especially reduction and complete losses) are
probably more important at the landscape level.
Wetlands in the Broken-Boosey Creek study area are mostly Freshwater Meadows
(Category 2 in Corrick’s classification) or Shallow Freshwater Marsh (Category 3
in Corrick’s classification); there is one Category 4 wetland. Net changes since
European settlement, as inferred from aerial photography and derived from
comparison of Wetlands_1788 and Wetlands_1994 databases, are a gross
reduction in number and area of Categories 2 and 3, and a gain in Category 5
wetlands (Table 4 in Main Report).
However, focusing on net changes in Category 2 and 3 wetlands, the Meadows
and Shallow Marshes, can mask changes such as from one type to another so a
transition matrix was compiled (Table A3a). This confirmed the trends described
by the net summary (it does not always do so) and added the following details
(Table A.3b):
No Change at all (same category, same area): total is 113 wetlands, of
which 96 are Category 2 wetlands and 16 are Category 3, with one Category 4
wetland. This implies that 52% of extant Category 2 wetlands are potentially
intact, but only 33% of extant Category 3 wetlands.
Smaller (same category, smaller area): total is 15 wetlands, of which 8 are
Category 2, and 7 are Category 3. In almost all of these, the lost area is more
than 1 ha (range is 4 to 23 ha for Category 2, and 3 to 72 ha for Category 3
wetlands) pointing to a substantial loss from some wetlands that are not readily
attributable to past mapping errors.
Bigger (same category, larger area): total is 7 wetlands, of which 6 are
Category 2 and 1 is Category 3. All increases are relatively small, range 1 to 6
ha; four of these are increases of 1-2 ha so are possibly due to mapping error but
three (all Category 2, range is 4 to 6 ha) are hard to account for.
Ecological Change (change in category): total is 9 wetlands, of which 4 were
originally Category 2 and 5 were originally Category 3. Four of these changed in
a way suggesting ‘wetter’ (Category 2 wetlands becoming Category 3 or Category
5: see Tables A.3a and A.3b) and five changed in a way suggesting ‘drier’
(Category 3 wetlands changed to Category 2). Only five changed in area: three
wetlands decreased by 10 to 57 ha. The largest wetland to change was 8025-
75835 (Rowan Swamp), from Category 3 to Category 2, and from 217 ha to 160
ha.
Complete loss: total is 90 wetlands, of which 71 were originally Category 2 and
19 were originally Category 3. For Category 2 wetlands, most of the losses were
relatively small wetlands with 33 (or 46%) being 10 ha or less; whereas for

3
Category 3 wetlands, most of the losses were in the next size class, 9 (or 43% of
losses) being 11-25 ha.
This analysis is a limited indication of ecological change; it is not definitive.
Other changes were noticed during field work, and some are noted in the IWC.
1.3 Approach Ecological Condition: The ecological condition of wetlands and of the floodplain
vegetation adjacent to major creeks was assessed using two techniques
recommended for use in Victoria: the Index of Wetland Condition (IWC) and
Habitat-hectares (Hab-ha). Both are designed for doing rapid appraisals in the
field, with some desk-top preparation. Both are referential, that is they compare
current condition of wetland or riparian vegetation against a reference condition.
Habitat-hectares is finalised and has been used widely in Victoria; in contrast,
the IWC is at an earlier stage of development and is yet to be fully tested in the
field (Janet Holmes, pers. comm. March 2006).
Assessments of ecological condition are done using descriptions of reference
condition that have been prepared for different vegetation types. In the case of
Habitat-hectares, these reference conditions vary slightly across Victoria so are
specific to particular bioregions. These descriptions include a range of
information on the vegetation itself, such as density and size classes of the
dominant species, floristics, structure, life-forms, cover and species richness, as
well as physical attributes of the vegetation as habitat, such as the amount of
fallen timber, and the amount of leaf litter.
The reference condition for different vegetation types is known as EVC (Ecological
Vegetation Class) Benchmark in Victoria. Benchmark descriptions for terrestrial
EVCs can be downloaded from the DSE web-site, and specific to a bioregion.
Benchmark descriptions for wetland EVCs were made available by Janet Holmes
of the Natural Resources Division within DSE as part of the training for IWC (see
below): benchmark descriptions for wetland EVCs are not specific to a bioregion.
Habitat-hectares: The rationale behind Habitat-hectares has been explained by
Parkes et al. (2003) and a stand-alone manual produced (DSE 2004). The
current edition of the manual is version 1.3, and this was used here.
Habitat-hectares is structured hierarchically, with 10 sub-indices in two groups;
one group of 7 sub-indices describe Site-Condition and has a theoretical
maximum score of 70 points; and the other group of 3 sub-indices describe the
Landscape Context, with a maximum score of 30 points. The value of the
hierarchical approach is that it is possible to inspect the scores for the individual
sub-indices; and to use these to guide strategy development and prioritise
resource allocations.
The final step (optional) in doing a habitat-hectares assessment for a particular
area of remnant vegetation is to convert the condition score to a habitat value
score, by multiplying scores by area for different EVCs within the remnant
vegetation. This assumes that the remnant vegetation has clear boundaries (ie is

4
an isolate) and has well-defined patches within it, and that habitat (terrestrial in
emphasis) value is the goal of the assessment. This is a situation that does not
apply well to strips of riparian vegetation, so this final step was not done.
Index of Wetland Condition: The Index of Wetland Condition returns a value
that can then be converted to one of four condition categories: Well Below
reference; Moderately Below reference, Slightly Below reference and Reference.
This value is the sum of six sub-indices: Wetland Catchment, Physical Form,
Hydrology, Water Properties, Soils, Biota. Each sub-index can also be given a
condition category. This hierarchical structure, like Habitat-hectares, is helpful in
indicating likely reasons for poor condition.
For IWC, author and project leader (Jane Roberts, Jennifer Hale) attended the
IWC Training day held by DSE at Lannigan’s Swamp on 3rd March 2006, along
with several other consultants and CMA personnel.

5
2. Methods
2.1 Wetland Condition As far as possible, the field workers followed the instructions and advice given by
DSE staff on the IWC Training Day and in the manual (DSE 2005 b).
Before field assessment, three maps were prepared, the bioregion identified
(Victorian Riverina for all potential field sites), and copies of all likely EVCs
assembled, as required. Likely EVCs were those listed for the two landscape
profiles relevant to the Broken-Boosey region: # 7 Lowland Grassy Plains –
Riverina Plains, and # 12 Riverine – Mid-Murray (Appendix 3 in DSE 2005 b).
Site Selection (wetlands): Wetlands targeted as potential field sites were
selected using the following criteria: present on the DSE Wetlands_1994 and
Wetlands_1788 databases (ie excluding Category 5 and Category 20 wetlands as
being the result of settlement); detectable on aerial photography of 2001; listed
in the brief. This resulted in a short list of 81 wetlands, most of which were
Category 2 (60 out of 81 wetlands) and about one third were comparatively
small, less than 10 ha.
A final criterion was access. A short list of potential field sites and their
landholders and contact details, some on private land and some on public land,
was provided by the Steering Committee. Wetlands on private land were visited
only with prior agreement from the landholder. Requests for permission to visit
the wetland were made by phone by Project Leader, Jennifer Hale, in the week
preceding field work. Several landholders refused permission.
After Field Assessment: Data sheets were checked subsequently for errors in
field, for consistent interpretation of IWC criteria, and to incorporate additional
information on hydrology. Field errors can be attributed to the mix of techniques
on the IWC data sheets (severity or intensity is sometimes additive, sometimes
multiplicative). Additional information on hydrology came from management
plans (for just some wetlands managed by Parks Victoria) and from ISC 2004
scores and reaches.
At all times, interpretation of IWC aimed at the whole wetland.
2.2 Riparian Condition Condition of the riparian vegetation was assessed using Version 1.3 of the
‘habitat-hectares’ method (Parkes et al. 2003), as set out in the Manual (DSE
2004). This differs from the brief which requests using the 2004 version of the
Index of Stream Condition (ISC). The change was made while in the field
following clarification with GBCMA that the emphasis should be on vegetation of
the floodplain adjacent to the channel, rather than on processes on the riverbank.
The Habitat-hectares method is in two parts (Section 1.3). The first part
assesses the ecological condition of the vegetation at the assessment site, using
seven sub-indices: Large Trees, Tree Canopy Cover, Lack of Weeds,

6
Understorey, Recruitment, organic Litter and Logs. The resulting Site Condition
score is what is reported here. The second part considers how the site fits into a
wider context, and this gives a Landscape Context score: this is best done using
a GIS rather than by field work (DSE 2004, p37). Completing the Site Landscape
score and calculating the final Habitat-hectares score presents logistical
challenges when working with riparian vegetation.
2.3 Field Conditions Field work was done over 4 days, from 4th to 7th March 2006, inclusive, following
one day training for IWC on Friday 3rd March, as required by DSE.
Due to the time of year, ie the end of summer and the beginning of autumn, and
the long dry conditions that have been prevailing in south-eastern Australia, most
of the wetlands were dry and only a few had water, either as a result of
irrigation-supply flows or the residual from a heavy rainfall earlier in 2006.
Such dry conditions are not suitable for assessing wetland condition using the
IWC. Although it is a requirement of the IWC that it can be used at any time of
the year (item 3, page 24, DSE 2005), many of the Wetland EVC Benchmarks
warn against their use during dry conditions in a section headed “Conditions when
the EVC should not be assessed”. Advice is given in different forms:
Should not be assessed if dry for a sustained period such as > 6 months and
floor of wetland is lacking evidence of aquatic plants or component species not
evident (EVC 653 Aquatic Herbland, EVC 810 Floodway Pond Herbland, EVC 819
Spike-sedge Wetland).
Vegetation condition may be underscored during prolonged dry periods: EVC
104 Lignum Swamp, EVC 291 Cane Grass Wetland. EVC 815 Riverine Swampy
Woodland, EVC 816 Sedgy Riverine Forest, EVC 817 Sedgy Riverine Forest /
Riverine Swamp Forest Complex.
“Discretion can be required during prolonged dry periods.” (EVC 292 Red Gum
Swamp) but with no clarifications on how to proceed or implications.
The contract required the field work to be done at this time, regardless of these
caveats.
7
3. Results for Wetland Condition
3.1 Wetlands Assessed for Condition A total of 13 wetlands were assessed, 12 by on-site field inspection and one from
a distance, ie from the road, using binoculars and maps (Wetland 521976).
The condition of this wetland is not based on an equivalent assessment as the
Biota sub-index (SI) was not done by on-site field inspection but by a mixture of
inference and generous assumption. Condition was inferred for that part of the
wetland used as a paddock, based on an assessment done on another wetland
that turned out to be a paddock. The condition of the remainder of the wetland
which was a red gum woodland had little effect on overall condition of the
wetland, whether given the maximum or minimum possible.
Photographs of selected wetlands and vegetation types are given in the Photo
Gallery, and details on how IWC was applied to individual wetlands are given in
Appendix 4 (Table A4).
All wetlands were within the Victorian Riverina bioregion.
Characteristics and Representativeness
The characteristics of these 13 wetlands, as taken from the Wetlands_1994
database in the DSE database, and how this relates to extant wetlands in the
study area, are set out below.
Category of wetland: Six were Category 2 wetlands on the DSE database, and
seven were Category 3 wetlands: These two categories account for nearly all
wetlands in the study area (Figure A2).
Size (area): In terms of their sizes as given in Wetlands_1994 layer, the
thirteen wetlands were in the larger size classes occurring in the Broken-Boosey
system: seven were in the 11-25 ha class (2 for Category 2, 5 for Category 3),
two were in the 26-50 ha class (both Category 2), two were in the 51-100 ha
class (1 for Category 2 and 3 respectively) and two were larger than 100 ha (both
Category 3). None of the wetlands sampled was in the 1-10 ha size class: this
was a result of the final criteria, access.
Geographic Spread: Although these were scattered through the study area,
only six of the 12 ISC reaches were sampled. Coverage was particularly limited
along the Broken Creek: no wetlands were assessed for ISC reaches 21 or 22 on
the lower Broken Creek, or for reaches 25 or 27 on the upper Broken Creek. One
wetland lay on an unnumbered part of Broken Creek, between R28 and R23; and
one lay on the boundary of R33 and R34 on upper Boosey Creek. This geographic
spread was a direct result of the final selection criteria, access to private property
and the distribution of public wetlands.
Ownership: Six wetlands were entirely on private land, four were on public
land and managed by Parks Victoria, and the remaining three were a mix of
private / public ownership.

8
Ecological Change: Most of the wetlands assessed (four Category 2, six
Category 3) are in the No Change category (see Background); two had a minor
change in area but not in type of wetland so could be considered No Change.
These are therefore consistent with current (Table A.3b). However one of the
wetlands has apparently changed considerably, reduced from 216 ha to 160 ha,
and changed from Category 3 to Category 2.
In summary, the Broken Boosey study area is characterised by just two
categories of wetlands, the Freshwater Meadows (Category 2) and the Shallow
Freshwater marshes (Category 3), in a range of size classes. Wetlands covered
in this field study covered these two categories and their size classes, with the
exception of the smallest size class, for reasons of access.
3.2 Condition of 13 Wetlands
Overall Condition
Scores generated in the IWC assessment are expressed as one of four categories
of condition: Reference, Slightly Below Reference, Moderately Below Reference,
and Well Below Reference. The thirteen wetlands generally rated quite well,
according to the IWC, with four wetlands equivalent to Reference, and six being
Slightly Below reference (Table 1). Although this is a positive result, there are
qualifications that should be considered (see below).
Table 1; Results of IWC assessment
Category Wetland Number & Name
Reference 4 7925 607991 Black Swamp
8025 910900 Moodies Swamp
8025 806965
8025 075835 Rowan Swamp
Slightly Below Reference 6 7925 436052
7925 619057
7925 607988
7925 600990
7925 653045
8025 002952 Lannigans
Moderately Below Reference 2 8025 921904
7925 521976
Well Below Reference 1 8025 930901
Total 13
Note that three of the highest-condition category wetlands are all managed for
conservation purposes (Table 1); in general, all of the assessed wetlands that

9
are managed at least in part for conservation rated fairly well, being either
equivalent to Reference or Slightly Below.
As stated above, these results cannot be considered as indicative of all wetlands
in the study area: Although possibly useful for relatively large Category 2 and
Category 3 wetlands, the inherent size-class bias in the sample means trends in
condition should not be considered indicative of smallest.
3.3 Understanding the Overall Assessment
Dissecting the Overall Assessment into Sub-indices
The IWC is intended as a tool to assist NRM agencies with management options,
by “comparing the relative effectiveness of different options in improving
condition (DSE 2006, p1). This requires understanding the make-up of the
overall assessment (below).
The IWC is the sum of six sub-indices (SI) which collectively describe how the
wetland has (or is presumed to have) changed or been changed.
Each sub-index is made up of a few to several scores and has a maximum value
of 20. Each can be considered as having a fine resolution if it is structured so
that it can return any number between 0 and 20, and a medium resolution if it
returns a spread of numbers between 0 and 20; sub-indices with fine and
medium resolution tend to have several parts to their scores. Conversely, a sub-
index has a coarse resolution if it returns only a few values between 0 and 20,
the examples being 0, 10 or 20 for Water Properties and Hydrology; such an
index has only a few or very few parts for scoring.
Catchment: Buffer zone around wetland (width, percentage of perimeter) and
activities within 250 m of buffer. High scores possible only if wetland has near
continuous buffer (native vegetation) AND land use adjacent is low impact, that is
nature conservation and native forestry. Resolution: fine.
Physical Form: Wetland area and benthic morphology. High scores possible
with minor reduction in area (relative to Wetlands_1788 layer) and minor
changes in bed-form. Resolution: fine.
Hydrology: Assesses whether water regime is substantially shifted relative to
natural, by using field observations (eg of structures on inlets and outlets) and
experience of observer. Resolution: coarse.
Water Properties: Evaluates if water is enriched or salinised (if fresh: the case
for naturally saline wetlands is not given). Resolution: coarse.
Soils: Evaluates extent and severity of disturbance to floor of wetland by
considering vehicles, cultivation, trampling etc. Resolution: medium.
Biota: Vegetation only. Vegetation is compared with benchmark descriptions for
wetland EVCs, more than one likely to be relevant. Resolution: fine.

10
Trends and Patterns in the Sub-Indices
As shown in the colour-coded summary table (Table 2), there are considerable
differences between sub-indices.
Table 2: Break-down of Wetland Condition into six sub-indices
Condition of sub-indices is based on their scores out of 20: Well-Below (5 or less); Moderately Below
(>5 to 10); Slightly below (>10 to 15); Reference (>15 to 20).
W
etla
nd
Cat
chm
ent
Ph
ysic
al F
orm
H
yrdo
logy
W
ater
pro
pert
ies
So
ils
B
iota
OVERALL Category
436052 Slightly Below 619057 Slightly Below 607988 Slightly Below 600990 Slightly Below 607991 Reference653045 Slightly Below 806965 Reference910900 Reference930901 Well Below921904 Moderately Below20952 Slightly Below 75835 Reference
521976 Moderately Below
Catchment is consistently in poor condition, with eight wetlands being
Moderately Below reference and two Well Below. It has a mean score of 9.2,
which is equivalent to Moderately Below.
Physical Form appears to be in consistently in better condition, being in
Reference condition for 11 out of 13 wetlands; Physical Form has a mean score
of 16.8 which is equivalent to Reference.
Water Properties and Hydrology also rate poorly, with eight and ten wetlands
respectively being Moderately Below. Their mean scores are 10.8 and 12.5,
which are both equivalent to Slightly Below reference; the mean scores are
pulled up because each SI also has three wetlands in Reference condition.
Soils is quite variable and has a mean score of 11.1 which is equivalent to
Slightly Below reference.
Biota (vegetation) also appears to be in very good condition across the
wetlands, being in Reference condition for seven wetlands. Biota has a mean
score of 15.2, which is equivalent to Slightly Below reference.

11
The implications of these are explored in Section 5.
Meeting Reference Condition for Wetlands:
Reference condition can, theoretically, be achieved either by consistently high
scores for all sub-indices or by mixing some very high (Reference) sub-indices
with less highly-rated ones. The experience here (Table 2) suggests that the
latter applies. The table shows that wetlands in Reference condition have at least
two (and as many as five) sub-indices in Reference condition. However, having
two or three sub-indices in Reference condition is not a guarantee that the whole
wetland will be in Reference condition, as shown by four wetlands whose
condition is either Slightly Below or Moderately Below (619057, 653045, 20952
and 521976).
3.4 Diversity of Wetland Vegetation A total of thirteen wetland EVCs were used as benchmarks for these 13 wetlands,
most being used at just one wetland (Table 3). Nearly all are of conservation
significance.
Table 3: EVCs used as benchmarks for assessing wetland condition
Number and name, how many times used in this study and its status in the Victorian Riverina bioregion,
as recently assessed and released by DSE (March 2006), for each of 13 EVC Benchmarks. Information on EVC group and status for Victorian Riverina bioregion was downloaded from DSE website (21st March
2006). Definitions of status are given in Table A.1 in Appendix 1.
EVC group EVC
Number
EVC Name Used in this study
Status for Victorian Riverina
Wetlands 104 Lignum Wetland One wetland Vulnerable
Riverine Grassy Woodlands or Forests
106 Grassy Riverine Forest One wetland Depleted
Wetlands 125 Plains Grassy Wetland One wetland Endangered
Wetlands 291 Cane Grass Wetland One wetland Vulnerable
Wetlands 292 Red Gum Swamp One wetland Endangered
Wetland 334 Billabong Wetland Aggregate One wetland Endangered
647 Plains Sedgy Wetland One wetland Not Listed
653 Aquatic Herbland One wetland Not listed
810 Floodway Pond Herbland One wetland Not Listed
815 Riverine Swampy Woodland One wetland Not Listed
Riverine Grassy Woodlands or Forests
816 Sedgy Riverine Forest One wetland Endangered
Riverine Grassy Woodlands or Forests
817 Sedgy Riverine Forest / Riverine Swamp Forest complex
One wetland Depleted
Wetlands 819 Spike-Sedge Wetland One wetland Rare

12
4 Results for Riparian Condition
4.1 Sites and Benchmark EVC Riparian vegetation was assessed at four sites (Table 4). Sites should be selected
following a randomisation procedure if it is intended to consider results as
representative of a reach or to report results at a reach-scale. In this case, site
selection was determined by access and time available, and did not follow any
randomisation procedure.
Only the first part of the Habitat-hectares score, the Site Condition score, is
reported here (Table 4). Scores range from low to good.
The EVC chosen for benchmarking the riparian vegetation was EVC 68 Creekline
Grassy Woodland. This EVC was chosen because it corresponded with the
location of the first site (Site A) and was then used to benchmark riparian
condition for the other three sites, some of which do not have any EVC recorded
for them, such as Site B (Figure 1), or for which there are no EVC benchmarks
yet released, such as EVC 259 Plains Grassy Woodland / Gilgai Wetland mosaic at
Site C. Problems with selecting and using the appropriate EVC benchmark EVC
are discussed further below.
Figure 1: Current EVC mapping for Sites A and B
Distribution of EVC patches near the junction of the Broken and Boosey Creeks, showing the two EVCs
occurring here: pink is EVC 803 Plains Woodland and green is Creekline Grassy Woodland. Sites A and B, indicated by stars, fall on EVC 68 and no EVC respectively. DSE website accessed 21 March 2006.

13
4.2 Riparian Condition The overall condition of the riparian vegetation, as indicated by the Site Condition
Score, ranged from average to good (Table 4).
The condition of each of the six components making up Site condition was
variable between the four sites. Only three components (Large Trees, Tree Cover
and Litter) included scores that were at or close to the maximum (Figure 2).
Conversely, Understorey and Logs were consistently low. This pattern is
consistent with many riparian sites in Victoria such as along the Glenelg River
(pers. obs.). Typically the overstorey of mature dominant eucalypts is present at
a suitable density although often as re-growth, and hence dependent attributes
such as cover and litter levels rate quite well. Conversely the understorey is
clearly degraded, having lost its structural complexity and species richness and
having an understorey of non-native species in its place, little to no recruitment
and a lack of fallen timber. This pattern can be generally attributed to a history
of stock access and timber removal, typically for firewood.
4.3 Problems with EVC Benchmark The advice, when preparing to do a habitat-hectares assessment (DSE 2004, p.4)
is to establish what range of EVCs are likely to be at each site by consulting the
EVC maps on the DSE database, both current and pre-1750 mapping. It is
recognised that there is a scale issue, and that when working with such small
patches of EVCs as at Sites A, C and D, it may be necessary to review each site at
a fine scale, eg 1:10,000. This is effectively too fine for the actual mapping, as
the data layers (EVC and river) are misaligned, and this can result in
misinterpretation. For example, Site A (Figure 1) has one EVC on the left bank
and another EVC on the right bank, with the two being separated by the creek-
line; in fact, EVC 68 should track the creek-line. The outcome was an over-
reliance on the misaligned map when choosing EVC Benchmark for this site,
rather than critically evaluating the options. Unfortunately, this error was then
perpetrated by aiming for consistency.
Other problems were also encountered with EVC Benchmarks, and all are
summarised below.
Lack of any current EVC being recorded at the assessment site, even though
tree cover was quite extensive, and therefore forcing the assumption that current
EVC is the same as the 1750-modelled EVCs. Site B.
Mis-alignment of data layers in the DSE database making it difficult to
determine where boundaries between EVCs are. Sites A, C and D.
No benchmark yet available for use: EVC 259 Plains Grassy Woodland / Gilgai
Wetland Mosaic at Site C; EVC 867 Shallow Sands Woodland / Plains Woodland
mosaic for the left bank of Site B and EVC 259 Plains Grassy Woodland / Gilgai
Wetland Mosaic for the right bank of Site B.

14
The outcome is that the assessments of riparian condition have not been made
against the correct EVC Benchmark. EVC 68 was used to benchmark all four
sites, whereas it would have been more appropriate to use EVC 55 (or EVC 803,
these are synonyms) at Site A; EVC 867 at Site B; EVC 259 at Site C; and EVC
55 / EVC 803 for Site D: of these, however, benchmark descriptions are only
available for EVC 55 / EVC 803. Sites A and D should be repeated.
Because the habitat hectares data sheets record the assessment, and not the
actual data, it is not possible to derive an assessment from existing field effort.

15
Table 4: Condition of Riparian Vegetation
Condition of riparian vegetation at four sites in the Broken Boosey State Park reported as Site Condition
score, using the habitat-hectares method (DSE 2003). Site Condition Scores are out of 70, but are also shown as percentage to make these easier to understand.
Site MGA reference Stream ISC Reach Number
Site Condition Score
A 0380756
6005179
Boosey R 32 39
( 56% )
B 0380491
6004714
Broken 39
( 56% )
C 0376534
6004453
R 24 51
( 73% )
D 0405885
5985947
Boosey 45
( 64% )
0 5 10 15 20 25 30
Large Trees
Tree Cover
Understorey
Weeds
Recruitment
Litter
Logs
Max Possible Score
Site A
Site B
Site C
Site D
Figure 2: Condition of different Site components
Condition of different components of riparian vegetation for each of four sites (A to D) in various shades
of blue, and also showing the maximum possible score (green).
16
5 Implications & Recommendations
5.1 IWC Sub-Indices as a Management Aid The IWC is intended to have value as a diagnostic tool and to inform NRM
agencies as to options for improving wetland condition. The sub-indices should
be useful as a guide to wetland managers and possibly as an aid in decision-
making. However, it would be unwise to simply accept the information
summarised above (Table 2) without first considering how the sub-indices are
designed and what information is actually being captured.
The following points are relevant.
Weighting: The IWC is structured and scored so that sub-indices are equally
weighted, that is, so that each sub-index has potentially the same influence on
wetland condition score. This was done deliberately (DSE 2005 a) but it implies
that each sub-index is equally reliable.
Resolution: Sub-indices with a coarse resolution can potentially return only a
few scores. Both the Hydrology SI and the Water Properties SI can score only 0,
10 or 20, which is equivalent to Well Below, Moderately Below or Reference.
Thus it is impossible under the current IWC for wetlands to be in Slightly Below
reference condition for water regime or water quality. here, both these SI are
typically rated as Moderately Below (Table 2).
Content of Wetland Catchment SI: The Catchment SI is generally in poor
condition, with most wetlands being Moderately Below reference. This sub-index
has two equally-weighted parts, buffer and adjacent land use. In terms of
improving the score for this Sub-Index, it would be easier and probably more
acceptable for GBCMA to focus on increasing the width or the length of the buffer
(perimeter of wetland) rather than changing adjacent land use. Eight wetlands
scored poorly for buffer (0 to 5 out of 10), the other three being all parks or
reserves with surrounding land. Improving the score for adjacent land use would
require converting agricultural enterprises within the 250 m area around each
wetland to ones considered Low Impact under the IWC (namely native forestry or
conservation).
Content of Biota SI: The Biota SI is typically in good condition, with nearly all
wetlands being in Reference condition or Slightly Below (Table 2), despite the
prolonged dry conditions. Within the Biota SI, each EVC unit is subject to four
assessments, all equally weighted and compared against the Benchmark for that
EVC: Critical life forms (a measure of vegetation structural diversity and species
richness combined); Weeds; Indicators of Altered Processes; Vegetation
Structure and Health.
Unlike Habitat-hectares, the IWC does not have any means of independently
determining what the reference EVC should be prior to making the condition
assessment. For Habitat-hectares, DSE made publicly available a map of what
the terrestrial and riparian (and a few instances of wetlands) vegetation probably
was back in 1750. Although not perfect, this gives a common ground and hence

17
a common standard to all practitioners; local experts can presumably fine tune
this, and justify as needed.
No such independent resource exists for wetlands, moreover the wetland
Benchmarks are a different kind of reference; they intend to describe wetland
vegetation as it would be under contemporary conditions of climate and season
but in the absence of anthropogenic disturbances. Thus a practitioner, visiting a
wetland and inspecting its vegetation, not only does a condition assessment but
uses what can be seen to select the EVC Benchmark against which it will be
compared. There must be, therefore, a relatively high correspondence between
the two which may account (in part) for the Biota scores.
In summary, IWC makes a wetland assessment, that assesses the contemporary
vegetation as a good example of a particular type of wetland vegetation that it
closely resembles. It does not, as can be done under Habitat-hectares, consider
how much that vegetation may have changed since settlement.
5.2 Comments on the IWC This section is not intended as a comprehensive review of the IWC however as
this is to be the official state-wide means of reporting on wetland condition, it is
worth recording the practical experience obtained for 13 wetlands in the Broken
Boosey system in March 2006.
Sensitivity of Biota SI to EVC Benchmark
The thirteen EVC benchmarks were chosen in the field in good faith, attempting
to apply the advice from the Training Day and the Manual and the EVC
Descriptions. However, it is clear in retrospect (Table A.4), that at least two of
these choices for benchmarks could have been better. For wetland 607991, it
would have been more appropriate to use EVC 810 Floodway Pond Herbland
instead of EVC 653; and for wetland 653045, it would have been more
appropriate to use EVC 172 Floodplain Wetland Aggregate instead of EVC 334.
This suggests that it is important to correctly establish in the field which is the
appropriate EVC benchmark to use. Paradoxically, however, on the few instances
where EVCs have been changed from one to another in the field, there has been
no change in the condition. This is consistent with advice received during the
IWC Training Day, that in instances where it is difficult to choose between two or
more EVCs for a site, it “doesn’t seem to matter which Benchmark you use”
(trainers, pers. comm., IWC Training Day). Most workers, however, prefer to
understand and implement a procedure consistently.
It is not easy to amend Biota SI scores after completing field work, as the IWC
data sheets do not record original data (eg number and cover of each life forms
etc). This is a limitation of the IWC in its current form.
Recommendation. Pending better advice from DSE on how to recognise which
wetland EVC benchmark is appropriate, and given the poor match using Indicator
Species and the lack of descriptions at different wet-dry phases, it is

18
recommended that when assessing wetland condition that field sheets be
developed and used that record actual observations.
Selecting the right EVC as the Benchmark in IWC
The Manual offers the following advice for selecting the EVCs to use as
Benchmark (DSE 2006).
“Guidance is based on potential wetland habitats in Victoria (Appendix
3). A number of sub-habitats are identified for each of the 16 potential
wetland habitats defined. These are illustrated on landscape profile
diagrams to show graphically the location of the sub-habitats in the
landscape. The EVCs associated with each sub-habitat are listed
(Appendix 3). Once potential EVCs have been determined for a wetland
with the aid of the landscape profile diagrams in Appendix 3, the
defining characteristics and indicator species for those EVCs can be
checked to confirm identification of the EVC or EVCs present at the
wetland.” (p7, DSE 2006).
Selecting the EVC to use as benchmark is clearly a hierarchical procedure, moving
from wetland habitat (choice of 16 across the state), to sub-habitat (taken from
landscape profile diagrams), to EVCs listed for each sub-habitat. The Broken
Boosey area falls within two wetland habitats: # 12 Riverine – Mid-Murray, and
# 7 Lowland Grassy Plains – Riverina Plains, the second being included on advice
of trainers on the IWC Training Day. No advice is given on what to do if there is
a poor match between the EVC so selected and the Indicator Species.
When reviewing the data sheets on completion of field work, it became apparent
that there were five instances when a different wetland EVC could have been
used (detailed in Table A.4 in Appendix 4), three of them involving red gum
woodland communities. These would have increased the number of EVCs even
further and would probably have resulted in a better ‘fit’ between species
observed on-site and those listed as Indicator Species under the General
Description in each benchmark (Table A.4 in Appendix 4).
This would have increased the number of EVCs by two and increased the
vegetation diversity (Table 6): neither of these EVCs are included in Landscape
Profiles #7 and #12.

19
Table 6: EVCs that could have been used as benchmarks
Additional EVCs that could have been used for assessing particular wetland vegetation types. Status of
these additional EVCs in the Victorian Riverina bioregion is taken from information recently released by DSE (March 2006) and downloaded from DSE website (21st March 2006). Definitions of status are given
in Table A.1 in Appendix 1.
EVC group EVC Number
EVC Name Status for Victorian Riverina
Alternative EVC Benchmarks (appropriate but not used)
(Presumably Wetlands)
172 Floodplain Wetland Aggregate Not Listed
Riverine Grassy Woodlands or Forest
295 Riverine Grassy Woodland Depleted
5.3 On Corrick’s Classification and Wetlands_1994 database Corrick’s classification of wetlands and the information in the wetlands database
are important parts of summarising and reporting on wetland resources within an
area, and wetland area in 1788 is an essential part of the IWC. Therefore, as
described above for the IWC, it is worth recording experience obtained during this
field assessment of 13 wetlands.
The great value of the Wetlands_1994 and Wetlands_1788 databases is their
extensive coverage and easily understood wetland classification (Corrick’s)
system. Because they are such an important resource, both the data set and the
classification system are accepted and rarely challenged. Implementing the IWC
required using Corrick’s classification and mapping, wetland and terrestrial EVCs,
and field observations in one exercise. Even though this assessment for GBCMA
was limited to only 13 wetlands, some differences and inconsistencies between
these information sources became apparent and are noted here.
Varying Reliability
Lignum and Cane grass are distinctive vegetation types. Cane grass at wetland
910900 (Moodie’s Swamp) is consistently recognised in all references: classified
as Category 3.03 by Corrick, modelled as EVC 291 in 1750, and recognised as
wetland EVC 291 during March 2006 condition study. Lignum at wetland 436052,
however, was not recognised as lignum in the DSE database, instead being
mapped as a Category 2.01 wetland (Meadow Herb), mapped as EVC 333 Red
Gum Wetland / Plains Grassy Wetland Mosaic and modelled as such for 1750
vegetation mapping, but during the wetland condition study of March 2006 was
seen to be lignum shrubland, and recognised as EVC 104 (see Figure 3, and
Recommendation [2] ).
20
Possible Errors
The accuracy and reliability for the Wetlands_1994 database is not provided,
neither is the date of field-truthing. This can make it hard to resolve
inconsistencies between mapping and field observations. Wetland 930901 is an
example of this from the March 2006 study of wetland condition. In the
database, this wetland is described as being 13 ha of Category 3.01 Shallow
Marsh – herb) and 4 ha of type 3.05 (Shallow Marsh Red Gum). When inspected
in March 2006, this wetland no longer existed, and the alleged area was under
cultivation. Moreover, the alleged area seemed an unlikely area for a wetland,
being on a gentle slope towards the top of a rise, upstream of wetland 921904,
and well above Moodie’s Swamp.
Recommendations
[1] EVC mapping
Accurate mapping and naming of extant wetland and riparian vegetation is
needed if GBCMA is going to continue with assessing wetland and riparian
condition. The current mapping is misleading on two counts.
First, as a description of the extent of vegetation of different types. This affects
the accuracy of summary statistics of resources, such as the percentage of an
EVC remaining and hence their conservation significance in the Broken Boosey
study area. For example, the extent of Cane Grass Wetland is currently 0 ha, and
the extent of Lignum Wetland is only 7 ha (Table 4 in main report). Including the
cane grass at Moodies Swamp (wetland 910900 covers approximately 181 ha)
and lignum shrubland (wetland 436052 covers about 57 ha) would result in a
substantial increase in the cover of these two vegetation types. In turn, this
would make the third Natural Resource Condition Target for vegetation1 (GBCMA
2003) more achievable !
1 The third target for vegetation, according to the Regional Catchment Strategy for the Goulburn Broken, is to: “Increase the cover of all endangered and applicable vulnerable EVCs to at least 15% of their pre-European vegetation cover by 2030”.

21
Figure 2: Riparian vegetation beside the Broken & Boosey Creeks
Extent of riparian vegetation and its density along the Broken and Boosey Creeks covering the same area
shown in Figure 1 and Sites A and B. Tree Density is shown in three shades of green, from lightest o darkest, corresponding approximately to: Dense, foliage density of 80% plus, and minimum patch size
of 5 ha; Medium, foliage density of 50-80%, minimum patch size of 1 ha; Scattered, tree cover of 10-
50%, minimum patch size of 1 ha, and gap of 0.1 ha. Downloaded from DSE Website, 21 March 2006.
Second, as a guide to what vegetation is actually there. According to the EVC
current mapping, most of the Broken Boosey State Park is cleared of vegetation
(Figure 1) whereas the Tree Density layer in the DSE Web site shows that for the
same area, the riparian zone is narrow but nearly continuous (Figure 2).
Repeating the vegetation mapping would be a large and costly process. Instead,
what is envisaged is that the GBCMA should explore the feasibility of making
more use of the Tree Density database or Tree Cover as a surrogate. These two
GIS layers are older than the EVC mapping but it should be feasible to do an
automated comparison between these to establish differences, and then develop
a protocol to determine whether the difference is an error, or due to clearing.
Recommendation: Review the tree/vegetation density thresholds used to
determine vegetation units for EVC mapping; re-analyse existing data on tree
density with view to field-truthing;
[2] Extent of Lignum
Shrublands of Tangled Lignum Muehlenbeckia florulenta (EVC 104 Lignum
Wetland) are recognised as Vulnerable in the Victorian Riverina bioregion, where
the bulk of this study was done (Table 3, this report). The discovery that wetland

22
436052 has about 57 ha of Lignum Wetland (Figure 3) is a considerable increase
in the area of this EVC, taking it to more than previously estimated for 1788.
Figure 3: EVC 104 Lignum Wetland at Wetland 436502, March 2006
Photograph taken in late summer during prolonged dry conditions. A few River Red Gums of similar stage have established amongst the lignum; between the shrubs are senescent introduced grasses.
Lignum is an important habitat for certain ducks and waterbirds when flooded.
Wetland 436052 may be the only Lignum Wetland in the study area, but it is not
the only occurrence of Tangled Lignum. It occurs as understorey under River Red
Gum at Black Swamp, and as understorey to Black Box along some creeks.
Tangled Lignum is worth special attention not just for its habitat value but
because the study area is close to the eastern margins of its distribution (Figure
4).

23
Figure 4: Lignum distribution from herbarium specimens
Location of herbarium specimens of Tangled Lignum Muehlenbeckia florulenta in south-eastern Australia.
Downloaded 21 March 2006 from Australia’s Virtual Herbarium.
Recommendation: The occurrence of Tangled Lignum Muehlenbeckia florulenta,
as a shrubland and as an understorey, within the study area should be located
and logged, and special attention given to protecting it and maintaining it.
[3] The Greatest Loss of Wetlands
Loss of wetlands is not surprising in a region, such as the Broken Boosey, that is
important for production and has a long history of settlement and agriculture.
These same characteristics make the task of safe-guarding the remaining
wetlands even more challenging. The size class analysis (Figure A2) shows not
only substantial losses for all wetlands but that losses since settlement vary
between wetland category. With Freshwater Meadows (Category 2), the losses
have been disproportionately greater in the smallest size class whereas with
Shallow Freshwater marshes they have been disproportionately greater in the 11-
25 ha size class (Figure A2). Because of the range of vegetation types
represented by these two categories and hence the range of functions and
habitats provided, there must be considerable implications at the landscape scale.
Temporary wetlands are a type of wetland in their own right and provide a
particular type of shallow-water habitat, sometimes on an irregular time-frame.
Recommendation: The original distribution of wetlands need to be evaluated to
understand their ecological significance within the region, and this information
can then be used to better guide the on-going maintenance and management of
the remaining wetlands. Points that should be considered are aggregation and
connectedness, and water regime.

24
References DNRE (2000). Kinnairds Swamp Environmental Management Plan (draft). Environmental Management
Group, Institute for Sustainable Irrigated Agriculture. Melbourne.
DSE (2004). Vegetation Quality Assessment manual. Guidelines for applying the habitat hectares scoring method. Version 1.3. Biodiversity and Natural Resources Division, Department of Sustainability
and Environment. October 2004.
DSE (2005 a). The Index of Wetland Condition. Conceptual framework and selection of measures. Department of Sustainability and Environment. November 2005.
DSE (2005 b). Index of Wetland Condition. Methods manual. preliminary draft. Department of
Sustainability, Victoria. November 2005.
DSE (2006). Index of Wetland Condition. Assessment of wetland vegetation. Version 2 – February 2006. Department of Sustainability, Victoria. Februrary 2006. Limited distribution. Made
available by DSE for people involved in the Training Day and beginning field assessments).
GBCMA (2003). Goulburn Broken Regional Catchment Strategy. Goulburn broken Catchment
Management Authority. November 2003.
Parkes, D., Newell, G. and Cheal, D. (2003). Assessing the quality of native vegetation: the “habitat
hectares” approach. Ecological Management and Restoration 4: S29-S38.
SKM (2005). Moodies Swamp Water Management Options - Stage Two: Workshop discussion of water
delivery options. Sinclair Knight Merz, Armadale, Victoria. April 2005

25
Photo Gallery
Figure 5: EVC 647 Plains Sedgy Wetland at Rowans Swamp
Extensive sedgeland of Carex tereticaulis with patches of Eleocharis acuta, showing the tangled tussocks
indicative of the very uneven ground underneath, with River Red Gum Woodland on higher ground. In
the Wetlands_1994 database, this area is mapped as Category 2.01 a Herb Meadow, surrounded by
extensive River Red Gum Meadow.
Figure 6; Wetland 80645 on Nine Mile Creek
Dam with spoonbills and egrets in one of the ‘pond’ areas in this wetland that is the bed of Nine Mile
Creek. This wetland was characterised by magnificent old and stately River Red Gums, strong zonation
patterns and the occurrence of several patches of Typha spp.

26
Figure 7: Regeneration at Wetland 436502
Dense River Red Gum regeneration dating from 1916, according to the long-term landholder, with sparse
occurrences of Tangled Lignum as understorey.
Figure 8: Spike-sedge at Wetland 619057
EVC 819 Spike Sedge wetland, showing vigorous Eleocharis acuta and soil cracking; the open areas are
vulnerable to weeds establishing during the dry phase (here the lighter green is introduced annual herb Heliotrope) but provides opportunity for wetland herbs when inundated and thus provides species and
structural diversity in the wet phase. Spike-Sedge Wetland is considered rare in the Victorian Riverina.
27
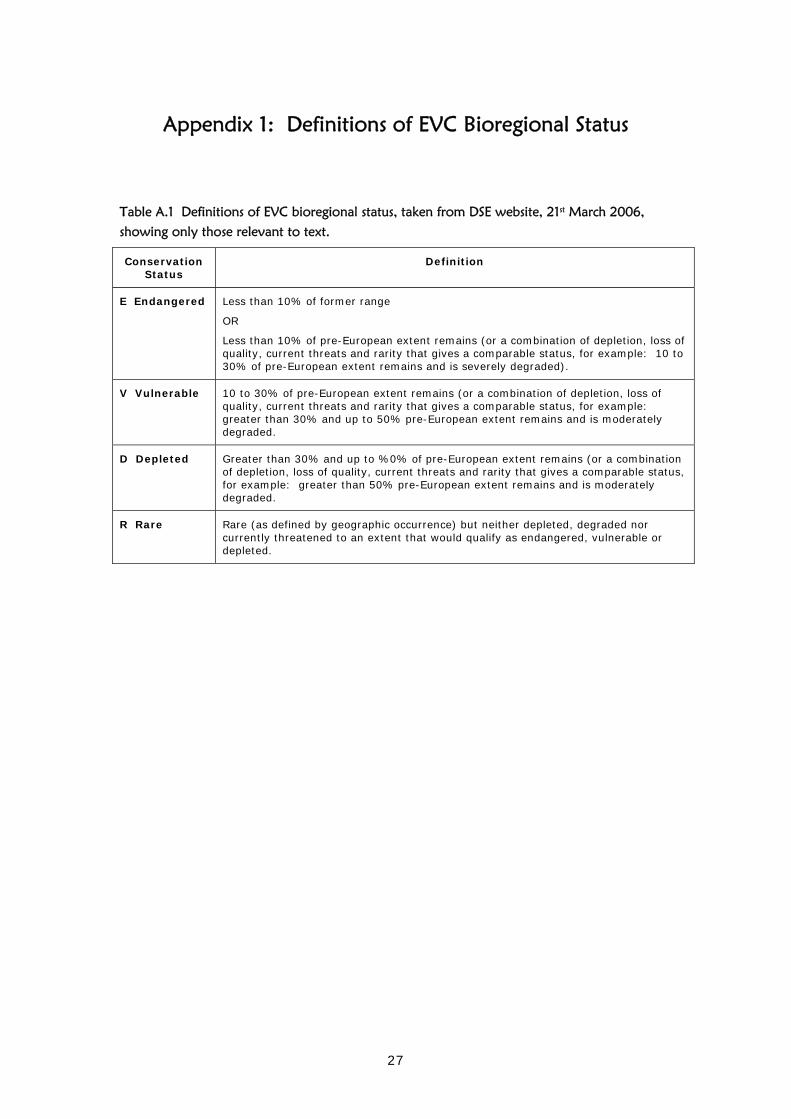
Appendix 1: Definitions of EVC Bioregional Status
Table A.1 Definitions of EVC bioregional status, taken from DSE website, 21st March 2006, showing only those relevant to text.
Conservation Status
Definition
E Endangered Less than 10% of former range
OR
Less than 10% of pre-European extent remains (or a combination of depletion, loss of quality, current threats and rarity that gives a comparable status, for example: 10 to 30% of pre-European extent remains and is severely degraded).
V Vulnerable 10 to 30% of pre-European extent remains (or a combination of depletion, loss of quality, current threats and rarity that gives a comparable status, for example: greater than 30% and up to 50% pre-European extent remains and is moderately degraded.
D Depleted Greater than 30% and up to %0% of pre-European extent remains (or a combination of depletion, loss of quality, current threats and rarity that gives a comparable status, for example: greater than 50% pre-European extent remains and is moderately degraded.
R Rare Rare (as defined by geographic occurrence) but neither depleted, degraded nor currently threatened to an extent that would qualify as endangered, vulnerable or depleted.

28
Appendix 2: Wetland Size Classes
Category 2 Wetlands
0
20
40
60
80
100
1-10 11-25 26-50 51-100 101-250
Size Class (ha)
Num
ber
on 1788 layer on 1994 layer on 2000 airphoto
Category 3 Wetlands
0
10
20
30
40
1-10 11-25 26-50 51-100 101-250
Size Class (ha)
Num
ber
on 1788 layer on 1994 layer on 2000 airphoto
Figure A.2: Changes in Size Classes of Wetlands
Number of wetlands by size class at three points in time: at time of European settlement, still existing approximately 200 years later and then less than a decade later. Data are taken from three sources: the
Wetlands_1788 and Wetlands_1994 layers in the DSE database, and the wetlands detectable on aerial
photography dates 2000 (see main report). Information for 2000 is not complete, as not all airphotos
were available at time of the analysis. 12 wetlands. Increases in numbers of wetlands for a given size class are due to changes in area.

29
Appendix 3: Ecological Change Table A.3a: Transition matrix showing change in wetlands
Transition matrix summarises changes to individual wetlands based on wetland categories and areas as given in DSE database. This is a comparison of Wetlands_1788 and Wetlands_1994 layers. It does not include wetlands shown as Category 20 in the Wetlands_1994 database.
Wetlands_1994
1788
Total for
1788 Category 2 Category 3 Category 4 Category 5 Not on 1994
Total for
1994
Category 2
185 110 2 2 71 114
Category 3
48 5 24 19 29
Category 4
1 1 1
Category 5
0 0
Not present
n.a. 1 1 19 21
Grand Total
234 116 27 1 21 90 165
GUIDE TO INTERPRETATION
[1] The column ‘Total for 1788’ shows that in 1788 there were 185 x Category 2, 48 x Category 3 and 1 x Category 4 wetlands giving a total of 234 wetlands.
[2] For Category 2 wetlands, out of the 185 present in 1788, more than half (1100 were still Category 2 in 1994 however two had changed to Category 3, and two had become Category 5, and a
total of 71 wetlands ‘disappeared’.
[3] Losses: Wetlands listed in 1788 layer but not detected in the 1994 layer are losses; there were 90 losses, 71 were Category 2 and 21 were Category 3. Conversely, Gains were wetlands not present
on 1788 layer but listed in 1994 layer, shown as the row labelled ‘Not present’: 2 Category 2, 1 Category 3 and 19 Category 5 wetlands.

30
Table A.3b: Transition matrix showing details of change in wetlands
Same transition matrix as in Table 3.1b but here giving details of the composition of each cell in the matrix. Entries in bold-italic blue are the wetlands that did not change from
1788 to 1994, as determined by analysis of the Wetlands_1788 and Wetlands-1994 data layers.
Wetlands_1994
1788
Total for 1788
Category 2 Category 3 Category 4 Category 5 Not on 1994
Total for
1994
Category 2
185 Same category, same area = 96
Same category, less area = 8
Same category, more area = 6
Change category, same area = 1
Change category, more area = 1
33 are 10 ha or less
25 are 11-25 ha
8 are 26-50 ha
5 are 51-100 ha
Category 3
48 Change category, same area = 3
Change category, less area = 2
Same category, same area = 16
Same category, less area = 7
Same category, more area = 1
7 are 10 ha or less
0 are 11 to 25 ha
3 are 26-50 ha
2 are 51 to 100 ha
Category 4
1 Same category, same area = 1
Category 5
0
Not present
n.a. 1 is 10 ha or less
1 is 10 ha or less 16 are 10 ha or less
3 are 11-25 ha
Total 234 116 27 1 21 90 165

31
Appendix 4: Annotations to IWC
Table A4: Annotated Results of Condition Assessment for 13 wetlands, in March 2006
Comments (below) are set out under specific headings. The observers referred to under “Impressions of observers” are the two field workers, Jane Roberts and Jennifer Hale.
Rationale or problems in selecting which EVC to use as reference in the Biota SI, are given under Benchmark EVCs: Benchmark EVCs comprise a name, a general Description and
a list of Indicator Species, “ some or all … should be present”. Altered Processes is one of four scores comprising the Biota SI.
Number & Condition
Comment
436052
Slightly Below
Impression of Observers: Wetland is under-rated by IWC, especially by EVC.
Benchmark EVC: EVC 104 Lignum Swamp for basin and EVC 106 Grassy Riverine Forest for red gum regeneration patches on higher surrounds were used as best options in terms of vegetation structure and growth-forms, but were poor matches for number of Indicator Species. In retrospect, EVC 295 Riverine Grassy Woodland may have been a more appropriate choice, on account of structure, understorey and more Indicator Species.
Biota SI: Assessed under dry conditions, which Benchmark admits potential for underscoring.
Note 1: Landholder has useful information on dates of Red Gum regeneration patches.
Note 2: Landholder maintains wetlands has always been lignum, is an early settlement family.
EVC mapping on DSE website: Extent of wetland not recognised for current EVC mapping, which notes only fragment of EVC 333 Red Gum Wetland / Plains Grassy Wetland mosaic; for 1750, whole wetland is modelled as EVC 333.
619057
Slightly Below
Comment: The IWC was not intended to be applied to constructed wetlands; it is difficult to apply to re-constructed wetlands.
Impression of Observers: High score for EVC 819 is deserved. Patchiness (clumps) of Eleocharis acuta had undisturbed cracking clay in-between, which is considered a positive. EVC 292 had much fallen timber, much leaf litter and some standing dead trees, all considered positive attributes although not covered in IWC.
Hydrology SI: Rated highly as recommendations made by DNRE (2000) aim to deliver a natural water regime. IWC interprets structures on in-flows and outflows as negative (does not accommodate compensatory structures); hence, simply following IWC would result in very low score of 0 for hydrology SI and change to overall wetland rating to Moderately Below.
Benchmark EVCs: EVC 819 Spike- Sedge Wetland and EVC 292 Red Gum Wetland were the only options in terms of structure and position in landscape, however both were poor matches for number of indicator species; reasons contributing to this were that EVC 292 was grazed by cattle, and no native grasses were visible over the fence.
Biota SI: Only assessed EVCs equivalent to 45% of wetland. For EVC 819, Nardoo Marsilea drummondii and Persicaria sp. (seedlings) were counted as
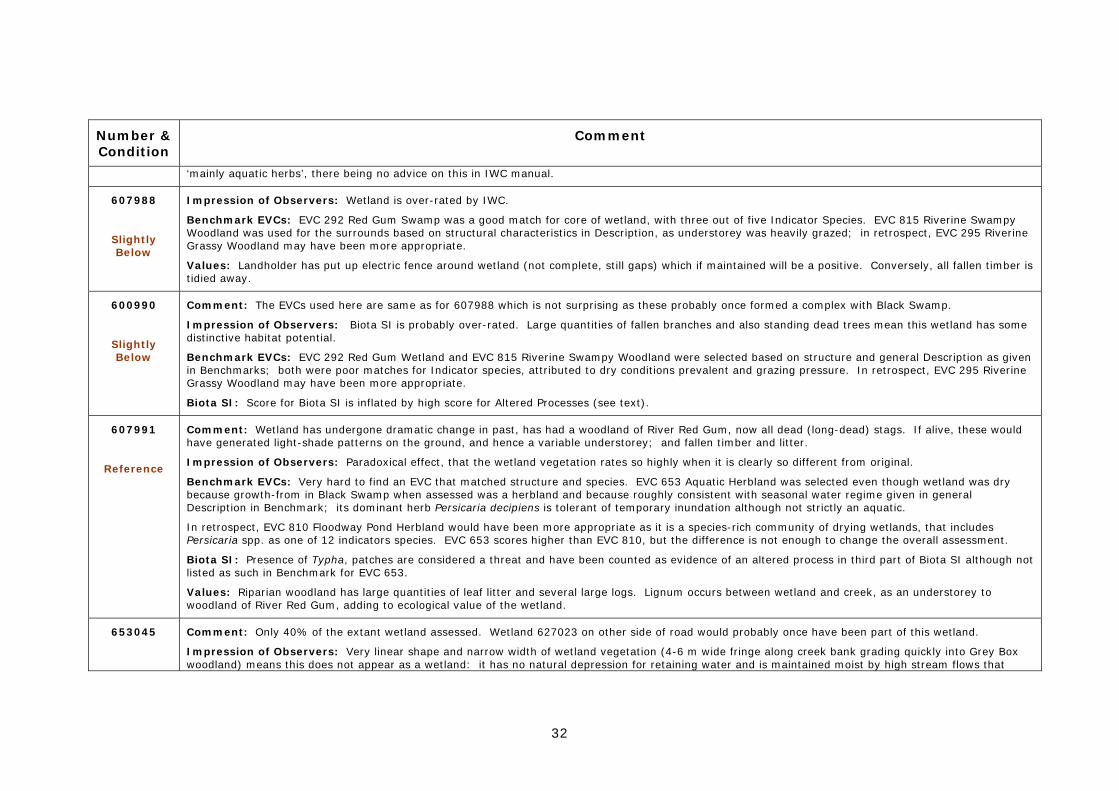
32
Number & Condition
Comment
‘mainly aquatic herbs’, there being no advice on this in IWC manual.
607988
Slightly Below
Impression of Observers: Wetland is over-rated by IWC.
Benchmark EVCs: EVC 292 Red Gum Swamp was a good match for core of wetland, with three out of five Indicator Species. EVC 815 Riverine Swampy Woodland was used for the surrounds based on structural characteristics in Description, as understorey was heavily grazed; in retrospect, EVC 295 Riverine Grassy Woodland may have been more appropriate.
Values: Landholder has put up electric fence around wetland (not complete, still gaps) which if maintained will be a positive. Conversely, all fallen timber is tidied away.
600990
Slightly Below
Comment: The EVCs used here are same as for 607988 which is not surprising as these probably once formed a complex with Black Swamp.
Impression of Observers: Biota SI is probably over-rated. Large quantities of fallen branches and also standing dead trees mean this wetland has some distinctive habitat potential.
Benchmark EVCs: EVC 292 Red Gum Wetland and EVC 815 Riverine Swampy Woodland were selected based on structure and general Description as given in Benchmarks; both were poor matches for Indicator species, attributed to dry conditions prevalent and grazing pressure. In retrospect, EVC 295 Riverine Grassy Woodland may have been more appropriate.
Biota SI: Score for Biota SI is inflated by high score for Altered Processes (see text).
607991
Reference
Comment: Wetland has undergone dramatic change in past, has had a woodland of River Red Gum, now all dead (long-dead) stags. If alive, these would have generated light-shade patterns on the ground, and hence a variable understorey; and fallen timber and litter.
Impression of Observers: Paradoxical effect, that the wetland vegetation rates so highly when it is clearly so different from original.
Benchmark EVCs: Very hard to find an EVC that matched structure and species. EVC 653 Aquatic Herbland was selected even though wetland was dry because growth-from in Black Swamp when assessed was a herbland and because roughly consistent with seasonal water regime given in general Description in Benchmark; its dominant herb Persicaria decipiens is tolerant of temporary inundation although not strictly an aquatic.
In retrospect, EVC 810 Floodway Pond Herbland would have been more appropriate as it is a species-rich community of drying wetlands, that includes Persicaria spp. as one of 12 indicators species. EVC 653 scores higher than EVC 810, but the difference is not enough to change the overall assessment.
Biota SI: Presence of Typha, patches are considered a threat and have been counted as evidence of an altered process in third part of Biota SI although not listed as such in Benchmark for EVC 653.
Values: Riparian woodland has large quantities of leaf litter and several large logs. Lignum occurs between wetland and creek, as an understorey to woodland of River Red Gum, adding to ecological value of the wetland.
653045
Comment: Only 40% of the extant wetland assessed. Wetland 627023 on other side of road would probably once have been part of this wetland.
Impression of Observers: Very linear shape and narrow width of wetland vegetation (4-6 m wide fringe along creek bank grading quickly into Grey Box woodland) means this does not appear as a wetland: it has no natural depression for retaining water and is maintained moist by high stream flows that

33
Number & Condition
Comment
Slightly Below
maintain saturated conditions, not necessarily by overbank flooding. Current plant communities are ‘new’ being result of high flows in summer in adjacent creek; these keep soil moist and result in strong but narrow zonation patterns of inundation tolerant herbs, grasses.
The Biota SI is over-rated.
Biota SI: EVC 334 Billabong Wetland Aggregate used as benchmark for zonation patterns, and EVC 816 Riverine Sedgy Forest for River Red Gum with Carex tereticaulis understorey, although number of Indicator species found was few. In retrospect, it may have been more appropriate to use EVC 172 Floodplain Wetland Aggregate instead of EVC 334.
806965
Reference
Impression of Observers: Wetland is in good condition; aesthetically is one of most pleasing, due to magnificent trees, and vigorous understorey in clear zoned bands.
Benchmark EVCs: EVC 810 Floodway Pond Herbland used as benchmark; this was best match for general Description; wetland had just two of twelve possible indicator species.
Biota SI: Presence of Typha, patches are considered a threat and have been counted as evidence of an altered process in third part of Biota SI, although not listed as such in Benchmark for EVC 810.
Values: Vigorous dense mono-specific zonations, overall pattern being distinct from other wetlands: Penny Royal Mentha pulegium, (introduced), Persicaria decipiens, Spiny Mud Grass Pseudoraphis spinescens, a mud-form vegetative milfoil Myriophyllum sp. with herbs Chenopodium pumilio on cracking clay.
910900
Reference
Comment: Wetland has changed through time: River Red Gums were cleared in late 1800s and water regime has been tinkered with intermittently since then through works on inflows, on Broken Creek and on silting problems (SKM 2005).
Hydrology SI; Rated as Moderately affected, due to changes in Broken Creek, and works and channelisation on Broken Creek and in-flowing channels, and risk of summer spills; this is despite the water regime recommended by SKM (2005).
Benchmark EVCs: EVC 291 Cane Grass Wetland selected as benchmark because its dominant species matches Indicator species, and fits general Description.
Biota SI: Would have achieved full score for Biota SI if the Benchmark accommodated descriptions for dry phase, instead of just wet phase.
Note: Grey Box has been establishing along shore, rather than over the lunette; this is indicative of an Altered Process at the interface of two vegetation types and as such would probably not be recognised under current IWC.
921904
Moderately Below
Comment: Assessment done on the remaining wetland.
Impressions of Observers: Rating as Moderately Below agrees with impressions of observers that this wetland is disturbed and partly degraded. But Biota SI is over-rated.
Benchmark EVCs: EVC 292 Red Gum Swamp used as benchmark due to woodland of Red Gums at site, and occurrence of Carex tereticaulis
Biota SI: Rating is high for area inspected, area with dense sedge understorey.

34
Number & Condition
Comment
930901
Well Below
Comment: Wetland does not exist, possibly a meadow may form in very wet years but field inspection and checking against map suggests flooding no longer happens. This is now a cultivated paddock, with stubble.
Impressions of Observers: Agrees with IWC Condition of Well Below Reference.
Wetland Condition: Assessment is based on Catchment SI, Physical Form SI, Soils SI and Biota SI: the other sub-indices (Hydrology and Water Properties) were not assessed but set to zero, on belief that flooding no longer occurs.
Benchmark EVC: No native vegetation remaining so no Benchmark EVC selected.
Biota SI: score of 7 is for cover of non-threatening Weeds (second of four parts in Biota SI)
20952
Slightly Below
Comment: This was site for Training Day for IWC. Time spent searching for plant species was about 2-3 times longer and more intensive than time expected for a whole wetland under IWC.
Impressions of Observers: The EVC chosen by trainers seemed inconsistent with field observations, which were that the wetland was not a forest but a woodland, with mature woodland form trees and no evidence of clearing to suggest it may have been a forest once. Several indicator species from EVC 282 Red Gum Wetland were noted, and from EVC 815 Riverine Swampy Woodland.
Wetland Condition: Wetland rated Slightly Below reference due to inadequate buffer (Catchment SI) and widespread pugging (Soils SI).
Hydrology SI: Score obtained during Training Day was revised downwards as part of post-fieldwork checks for consistency, but this had no effect on condition category for wetland.
Benchmark EVCs: Benchmarks selected by IWC trainers were EVC 817 Sedgy Riverine Forest and 125 Plains Grassy Wetland. The rationale was not clear.
Biota SI: Score for EVC 817 was highest possible (20 out of 20).
75835
Reference
Comment; Sedge tussocks in wetland were “perched”, occurring on mounds up to 15-20 cm tall, on cracking dry friable clay. It was not possible to conclude from field inspection whether this was a result of natural processes (tussocks, on cracking soils and water scour) or as a result of cattle movement (walking between tussocks) or some other process. There was no evidence of cattle pugging or of grazing on higher ground so the state of the basin floor was deemed to be natural. Wetland appeared to have received considerable flow of water in recent past: Carex tussocks were prostrated and aligned in similar direction, suggesting deep fast-flowing water had passed over the top.
Soils SI: High score (Reference) assumes soil condition is natural; if treated as an anthropogenic disturbance, condition for sub-index drops to moderately below reference but does not change overall Wetland Condition.
Benchmark EVCs: EVC 815 Riverine Swampy Woodland for red gum woodland on higher ground immediately around basin, for its woodland form and grassy understorey; EVC 647 Plains Sedgy Wetland for basin area, which was extensive dense Carex tereticaulis with some patches Eleocharis acuta.
521976
Comment: Inspection done from road and top of vehicle, using binoculars.
Impressions of Observers: Condition is probably fairly rated but as no on-site inspections, this may be unreliable, especially sub-indices.

35
Number & Condition
Comment
Moderately Below
Wetland Condition: Wetland is rated as Moderately Below reference
Physical Form SI and Soils SI: Extent of meadow in paddock is apparently unchanged, is clearly visible from change in plant cover; but paddock currently harvested and probably cultivated.
Biota SI: Estimated assuming a score of 7 for stubble in paddock area (as per 930901) and a generous maximum of 20 for River Red Gum area. There is no change to Wetland Condition if river red gum is scored as zero.
Benchmark EVCs: no site access so no Benchmark EVC selected.
Values: Large amount of fallen timber in red gum area.
Question Arising: Can cultivated paddocks provide shallow-water habitat in wet years or winter