insight enterprises, inc
TRANSCRIPT

Insight Proprietary & Confidential. Do Not Copy or Distribute. © 2021 Insight Direct USA, Inc. All Rights Reserved. 1Insight Proprietary & Confidential. Do Not Copy or Distribute. © 2021 Insight Direct USA, Inc. All Rights Reserved. 1
Insight Enterprises, IncCompany Overview

Insight Proprietary & Confidential. Do Not Copy or Distribute. © 2021 Insight Direct USA, Inc. All Rights Reserved. 2
Disclosures• Safe harbor statement
This presentation includes “forward-looking statements” within the meaning of the Private Securities Litigation Reform Act of 1995 related to Insight’s plans and expectations. Statements that are not historical facts, including statements about future trends in the IT market and our opportunities for growth, are forward-looking statements. These forward-looking statements are subject to assumptions, risks and uncertainties which could cause actual results or future events to differ materially from such statements. The Company undertakes no obligation to update publicly or revise any of the forward-looking statements, except as otherwise required by law. More detailed information about risk factors is included in today’s press release and discussed in the Company’s most recently filed periodic reports and subsequent filings with the Securities and Exchange Commission.
• Non-GAAP measuresThis presentation will reference certain non-GAAP financial information as ‘Adjusted’. A reconciliation of non-GAAP financial measures presented in this document to our actual GAAP results is attached to back of this presentation and included in the press release issued today, which you may find on the Investor Relations section of our website at investor.insight.com.

Insight Proprietary & Confidential. Do Not Copy or Distribute. © 2021 Insight Direct USA, Inc. All Rights Reserved. 3Insight Proprietary & Confidential. Do Not Copy or Distribute. © 2021 Insight Direct USA, Inc. All Rights Reserved. 3
Global Intelligent Technology Solutions™
provider that helps businesses run smarter.
We architect, design, implement and manage IT Solutionsthat enable digital readiness and drive business outcomes.

Insight Proprietary & Confidential. Do Not Copy or Distribute. © 2021 Insight Direct USA, Inc. All Rights Reserved. 4
Insight at a Glance Profile
30+ yearsEvolving in
dynamic industry
No. 4092020 Fortune 500
19 CountriesServing clients
around the globe
$8.3 Billion2020 Net Sales
9% 5 YR CAGR
$322 Million2020 Adjusted EFO*
18% 5 YR CAGR
$6.19 2020 Adj EPS*
22% 5 YR CAGR
Results
20%2020 Cloud GP to Total GP
48%2020 Services GP to Total GP
22%2020 Services Sales5 YR CAGR
Services
7,700+Sales and service
delivery professionals
11,000+Teammates Worldwide
4,400+Technical
Resources
Talent
All Financial Metrics through 12/31/2018 exclude PCM
* Adjusted Non-GAAP measure excludes severance and restructuring expense and other unique items. See Non-GAAP information section in the Appendix of this presentation.

Insight Proprietary & Confidential. Do Not Copy or Distribute. © 2021 Insight Direct USA, Inc. All Rights Reserved. 5
Adjusted EPS | Trend | 2015-2020
$2.29
$6.19
$0
$1
$2
$3
$4
$5
$6
$7
2015 2016 2017 2018 2019 2020
Adjusted EFO $ & % | Trend | 2015-2020
$ in Millions
$143.5
$322.4
2.7%
3.9%
0.0%
0.5%
1.0%
1.5%
2.0%
2.5%
3.0%
3.5%
4.0%
4.5%
$0
$50
$100
$150
$200
$250
$300
$350
2015 2016 2017 2018 2019 2020
Net Sales | Trend | 2015-2020 GP and Margin | Trend | 2015-2020
$ in Billions $ in Millions
$716.3 $743.1
$918.6$993.7
$1,138.1
$1,299.9
13.3% 13.5% 13.7%14.0%
14.7%
15.6%
10.0%
11.0%
12.0%
13.0%
14.0%
15.0%
16.0%
$0
$200
$400
$600
$800
$1,000
$1,200
$1,400
2015 2016 2017 2018 2019 2020
$5.4 $5.5
$6.7 $7.1$7.7
$8.3
$0
$1
$2
$3
$4
$5
$6
$7
$8
$9
2015 2016 2017 2018 2019 2020
Track Record of Growth
* Adjusted Non-GAAP measure excludes severance and restructuring expense and other unique items. See Non-GAAP information section in the Appendix of this presentation.
5- Year CAGR9.0%
5- Year CAGR12.7%
5- Year CAGR17.6%
5- Year CAGR22.0%

Insight Proprietary & Confidential. Do Not Copy or Distribute. © 2021 Insight Direct USA, Inc. All Rights Reserved. 6
Track Record of Innovation
Innovation Focus Areas
GEO Footprint Expansion
Hardware Lifecycle Services
Distribution and Integration Labs
Software Licensing Solutions
Innovation Focus Areas
Advanced Networking Solutions
Enterprise Software Integration Services
GEO and Category Expansion
Entry to Cloud and Digital Solutions
Innovation Focus Areas
Modern Workforce Solutions
Data Center and Cloud Services and Solutions
Digital Innovation Solutions
Expanded Delivery of Solutions and Services into Mid-Market
2017 and Beyond
Global Intelligent TechnologySolutions ProviderIT services
Mid 2000s - 20161980s through mid 2000s
Reseller
1988 1995 1997 2002 2006 2008 2011 2012 2015 2017 2018 2019 2020

Insight Proprietary & Confidential. Do Not Copy or Distribute. © 2021 Insight Direct USA, Inc. All Rights Reserved. 7
2020 Full Year Highlights• Completed integration of PCM
• Retired 9 ERP systems
• Exited year with approximately $70 million in annualized run rate cost savings, ahead of schedule to meet 2-year target
• Response to COVID-19 was solutions focused
• Modernized online experience ensured strong client engagement
• Invested in sales force and technical talent
• Hardware bookings started to recover
• Recognized for our continued focus on culture and employee benefits and leadership development

Insight Proprietary & Confidential. Do Not Copy or Distribute. © 2021 Insight Direct USA, Inc. All Rights Reserved. 8
Insight Recognition2020
No. 409
500Recognized on Gartner
Magic Quadrant for Managed Workplace
Services, North America
(fourth year in a row)
General Excellence, Best World Changing
Idea for North America & Spaces, Places and Cities
Human Rights Campaign Foundation 2020 Corporate Equality Index for LGBTQ-inclusive business practices
The Forrester Wave™: Midsize Agile Software Development Service Providers" 2019 report
2020 Forrester Wave for Computer Vision
CosultanciesNo. 1
No. 23 Fortune’s “2019
Best Workplaces in Technology”
No. 70Fortune’s “2019 Best Workplaces
for Diversity”
No. 6 Australia’s
“Best Places to Work 2020”
No. 8UK’s “Best
Workplaces in Tech 2020”
No. 2 Austria’s
“Best Places to Work 2020”
No. 20UK’s “Best
Workplaces 2020”
World’s Best Employers 2020
#27 among IT companies
#296 overall

Insight Proprietary & Confidential. Do Not Copy or Distribute. © 2021 Insight Direct USA, Inc. All Rights Reserved. 9
World’s MostAdmired Companies
Fortune 2021

Insight Proprietary & Confidential. Do Not Copy or Distribute. © 2021 Insight Direct USA, Inc. All Rights Reserved. 10
Our Solutions Align to Industry Trends andDrive Business Outcomes for our Clients
Digital Innovation
Engage customers & empower teams with digital experiences.
Cloud + Data CenterTransformation
Provide guidance, technical expertise and managed
services to solve IT challenges.
Connected Workforce
Connect and empower teams with technology
to work smarter.
Supply Chain Optimization

Insight Proprietary & Confidential. Do Not Copy or Distribute. © 2021 Insight Direct USA, Inc. All Rights Reserved. 11
Managed Tablet program for employee training helps global quick-service brand improve efficiency and customer experience
Future phases of the project will include food safety and shift management, allowing the client to achieve safer food handling and more efficient staffing, reducing costs and improving the customer experience.
After the successful pilot and new employee training strategy, Insight is now deploying 4,000+ devices to 850+ restaurants around the globe.
Successful pilot deployment to 100 restaurants after initial consultation and roadmap. Ongoing services include Insight’s Managed Deployment, Managed Mobility and Managed Workplace Services.

Insight Proprietary & Confidential. Do Not Copy or Distribute. © 2021 Insight Direct USA, Inc. All Rights Reserved. 12
Multi-year data center modernization project to result in new hybrid, multicloud environment by 2024
Multinational tech specialty glass, ceramics, & advanced optics, for industrial and scientific applications org. Includes consolidation of 3 major and 165 smaller data centers.
Initial IT Strategy and SnapStartworkshop to determine data, evaluate cloud & cost, assess compliance and governance, and workload evaluation of 3,200 applications.
Reduce dependence on current outsourcing provider and engage with Insight for workload management and IT operational managed services.

Insight Proprietary & Confidential. Do Not Copy or Distribute. © 2021 Insight Direct USA, Inc. All Rights Reserved. 13
Our Strategic Assets Support Continued Growth
Grow with solutions that drive business outcomes for clients
Continue to Innovate to capture share in high growth areas
Expand and Scale in strategic clients and markets
Optimize client experience and execution through operational excellence
Strategic Priorities
Innovation Led | Solution Area Expertise
Culture, People and Leadership
Global Reach and Scale
Diverse and Loyal Client and Partner relationships
Operational Rigor and Financial Health
•
•
•
•
Strategic Assets
Insight Proprietary & Confidential. Do Not Copy or Distribute. © 2021 Insight Direct USA, Inc. All Rights Reserved. 14
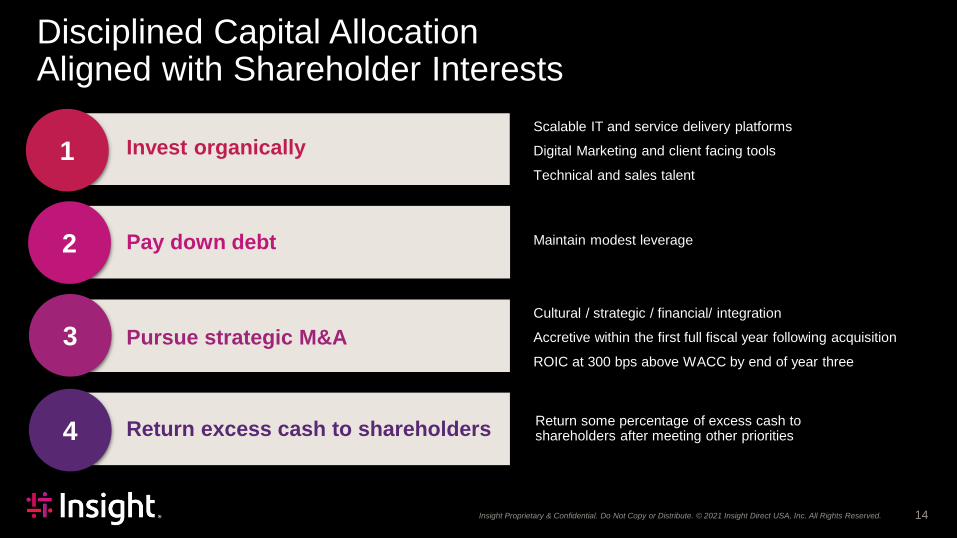
Disciplined Capital Allocation Aligned with Shareholder Interests
1 Invest organicallyScalable IT and service delivery platforms
Digital Marketing and client facing tools
Technical and sales talent
4 Return excess cash to shareholders Return some percentage of excess cash to shareholders after meeting other priorities
2 Pay down debt Maintain modest leverage
Pursue strategic M&ACultural / strategic / financial/ integration
Accretive within the first full fiscal year following acquisition
ROIC at 300 bps above WACC by end of year three3

Insight Proprietary & Confidential. Do Not Copy or Distribute. © 2021 Insight Direct USA, Inc. All Rights Reserved. 15
Key 5-Year Imperatives* to Deliver Value
5.0% – 5.5%Expand EBITDA
Margin
19% – 21%Optimize Return
on Invested Capital
50% – 52% Grow Services
Gross Profit as % of Total GP
Value Creation for Insight Shareholders,
Clients, Partners andTeammates
8% – 10% (CAGR)Grow Sales
Faster than the Market
*5-year CAGR base year is 2019

Insight Proprietary & Confidential. Do Not Copy or Distribute. © 2021 Insight Direct USA, Inc. All Rights Reserved. 16Insight Proprietary & Confidential. Do Not Copy or Distribute. © 2021 Insight Direct USA, Inc. All Rights Reserved. 16
Appendix
Insight Proprietary & Confidential. Do Not Copy or Distribute. © 2021 Insight Direct USA, Inc. All Rights Reserved. 17
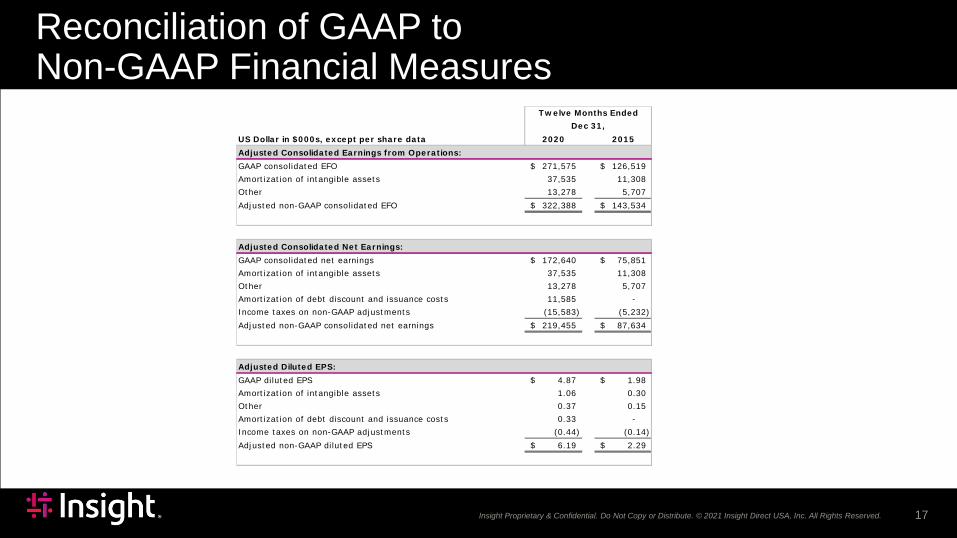
Reconciliation of GAAP to Non-GAAP Financial Measures
US Dollar in $000s, except per share data 2020 2015Adjusted Consolidated Earnings from Operations:GAAP consolidated EFO 271,575$ 126,519$ Amortization of intangible assets 37,535 11,308 Other 13,278 5,707 Adjusted non-GAAP consolidated EFO 322,388$ 143,534$
Adjusted Consolidated Net Earnings:GAAP consolidated net earnings 172,640$ 75,851$ Amortization of intangible assets 37,535 11,308 Other 13,278 5,707 Amortization of debt discount and issuance costs 11,585 - Income taxes on non-GAAP adjustments (15,583) (5,232) Adjusted non-GAAP consolidated net earnings 219,455$ 87,634$
Adjusted Diluted EPS:GAAP diluted EPS 4.87$ 1.98$ Amortization of intangible assets 1.06 0.30 Other 0.37 0.15 Amortization of debt discount and issuance costs 0.33 - Income taxes on non-GAAP adjustments (0.44) (0.14) Adjusted non-GAAP diluted EPS 6.19$ 2.29$
Twelve Months EndedDec 31,