installation effects on venturi tubes in wet-gas flow ... · venturi tubes are one of the most...
TRANSCRIPT

North Sea Flow Measurement Workshop
October 2017
1
Installation effects on Venturi tubes in wet-gas flow conditions
Emmelyn Graham, NEL
Michael Reader-Harris, NEL
Claire Forsyth, NEL
1 INTRODUCTION
Venturi tubes are one of the most common types of device used for wet-gas flow
measurement as they are a simple, robust and cost-effective flow meter. They also
form the main component in the majority of commercial wet-gas and multiphase flow
meters.
There are standards available for their use in wet-gas conditions; ISO/TR 11583 and
ISO/TR 12748. However, these mainly cover only 2-phase flows and horizontal
installation. The performance of Venturis in 3-phase conditions, including the impact
from using correlations derived for 2-phase flows, has more recently been
investigated.
Issues with straight upstream piping requirements for Venturis in wet-gas conditions
have been highlighted by industry as there is very little information available and
current recommendations are based on single-phase standards (ISO 5167-4). Long
straight upstream lengths increase manufacturing costs and reduce opportunities for
the use of Venturis in space-limited installations. In some cases they are installed with
much shorter straight upstream lengths with no knowledge about the errors induced.
NEL has conducted tests to investigate the effect of upstream installations on a
Venturi tube. The results indicate that the required upstream lengths were heavily
dependent on the flow conditions: in some cases the upstream lengths can be
significantly reduced and in other cases the measurement errors could be up to 9%.
Most correlations and research for using Venturis in wet-gas flows are for horizontal
installations; this has limited the use of Venturis in vertical installation. Many of the
commercial multiphase meters are installed in a vertical installation, and, using the
same hardware but different models, are used to meter wet-gas flows. NEL has
collected new wet-gas data on the impact of upstream effects on the vertical
installation of Venturis.
The data presented in this paper highlights and quantifies the impact of upstream
installations on Venturi tubes in wet-gas flows. It is anticipated that this will lead to
new research and form the basis on which the current wet-gas standards/best practice
may be updated to cover a wider range of installations. This should enable Venturi
tubes to be used in well defined installations with guidance available on the impact,
similar to the table in ISO 5167-4 for Venturis in single-phase flows.

North Sea Flow Measurement Workshop
October 2017
2
2 INSTALLATION EFFECTS BACKGROUND
The effect of common pipe installations upstream of Venturi tubes in wet-gas
conditions is not well understood and the impact on measurement errors has not been
quantified. NEL has completed a small pilot study to quantify the impact of different
installation effects using the equations of ISO/TR 11583 as the baseline.
This study has allowed the recommendations given in ISO/TR 11583 to be assessed
and provides information on upstream straight pipe length requirements in wet-gas
conditions. Manufacturers and end-users are keen to reduce upstream lengths for cost
and space considerations.
ISO/TR 11583 recommends that the reduced straight lengths outlined in ISO 5167-4
(those corresponding to 0.5% additional uncertainty) are not used and that where
possible, the longer straight lengths recommended in the standard are used in order to
minimise measurement uncertainty. For a β=0.6 Venturi tube, as was used in these
tests, ISO 5167-4 recommends that at least a 10D length of straight pipe is used
upstream of the meter for ‘zero additional uncertainty’.
ISO 5167-4 recommends that for research and calibration work, the required straight
lengths outlined in the standard are at least doubled, to minimise measurement
uncertainty.
3 HORIZONTAL EXPERIMENTAL TEST SET-UP
A Venturi tube (β=0.6, D=0.10236 m) was installed in NEL’s wet-gas facility and
underwent testing with an upstream bend combination placed at various diameters
upstream of the meter (6D, 10D and 17D). The number of upstream diameters was
measured from the final curved portion of the downstream end of the bend to the
Venturi’s upstream pressure tapping.
Tests without a bend were also performed. These tests had 35D of straight pipe
upstream of the Venturi. Throughout the tests, schedule 40 pipes were used to ensure
no ‘step’ in the geometry when fluid was flowing through the various straight sections
of pipe into the Venturi. The only point at which the internal diameter of the pipe
varied was in the U-bend.
Gas (nitrogen) and oil (kerosene substitute Crownsol D75) flow rates were varied to
correspond to gas densiometric Froude numbers (Frg) of 1.5 and 3.0 across a range of
Lockhart-Martinelli parameters (X=0-0.3). The data were then analysed according to
ISO/TR 11583, allowing comparison of the standard’s predicted gas mass flow rate
with the reference data.
The majority of tests were performed at 15 barg; however, selected tests were
performed at 30 and 60 barg to investigate pressure (i.e. density ratio) effects. A 60
barg test with a gas Froude number of 4.5 was also performed.
Figures 1 and 2 show the test setup.

North Sea Flow Measurement Workshop
October 2017
3
Figure 1 Photograph of the installation effects test. The bend combination is 10D
upstream of the Venturi tube.
Figure 2 Photograph of the installation effects test. The bend combination is 10D
upstream of the Venturi tube.

North Sea Flow Measurement Workshop
October 2017
4
4 HORIZONTAL RESULTS AND DISCUSSION
4.1 Upstream Straight Length Requirements
The results showed that under certain conditions, an upstream bend could have a
significant impact on the results obtained using the standard if there was not a
sufficient length of straight pipe upstream of the Venturi. As shown in Figure 3
(Frg=1.5, 15 barg), as the upstream straight length between the bend and Venturi
decreased, the size of the errors measured (comparing predicted gas mass flow rate
from standard with reference value) increased, particularly at higher liquid loadings.
For example, at Frg=1.5 and 15 barg, when X=0.3, the error at 17D was 2.5%, but
when the straight length was reduced to 6D, the error increased to 8.6%.
-2.00
0.00
2.00
4.00
6.00
8.00
10.00
0.00 0.01 0.02 0.05 0.10 0.20 0.30
Re
l E
rro
r in
Pre
dic
ted
Ga
s M
ass
Flo
w u
sin
g I
SO
TR
11
58
3 (
%)
X (-)
6D
10D
17D
No bend
Figure 3 Effect of upstream straight lengths on gas mass flow rate error using
ISO/TR 11583 for various liquid loadings (X) at 15 barg and Frg=1.5
4.2 Effect of Liquid Loading (X)
The liquid loading was important, and the effect of an upstream bend became more
significant as X increased. As X increased, larger lengths of straight pipe were
required for the data to fall within the standard uncertainty limits. This can be seen in
Figure 4.
For example, at low liquid loadings (X=0.01 and X=0.02) all data lay within the
standard’s uncertainty, including at 6D, which is lower than the standard’s 10D
recommendation. For X=0.05 and X=0.1, this minimum distance increased and 10D
was required for data to fall within the standard. Beyond X=0.1, this distance
increased further and at least 17D of straight length pipe was required for data to fall
within the standard. Therefore at Frg=1.5 and 15 barg, at least 17D of straight length

North Sea Flow Measurement Workshop
October 2017
5
was required upstream of the meter for the data to fall within the standard across the
full range of liquid loadings (X=0-0.3) tested.
-4
-2
0
2
4
6
8
10
0.0 0.1 0.2 0.3
Re
l Err
or
in P
red
icte
d G
as
Ma
ss F
low
usi
ng
IS
O T
R 1
15
83
(%
)
Lockhart-Martinelli parameter, X (-)
ISO 11583 Uncert
limits
No bend- Frg=1.5, 15
barg
6D- Frg=1.5, 15 barg
10D- Frg=1.5, 15 barg
17D- Frg=1.5, 15 barg
Figure 4 Effect of upstream straight lengths on gas mass flow rate error using
ISO/TR 11583 for various liquid loadings (X) at 15 barg and Frg=1.5
4.3 Effect of Pressure
The test pressure was also important; as the pressure was increased the bend appeared
to have a much less significant impact on the results. For example, as shown in Figure
5, at 30 barg and Frg=1.5, the effects of the bend found at 15 barg and Frg=1.5 were
not observed. At higher pressures, annular/ annular mist flow are more likely to occur.
-4
-2
0
2
4
6
8
10
0.0 0.1 0.2 0.3
Re
l E
rro
r in
Pre
dic
ted
Ga
s M
ass
Flo
w u
sin
g
ISO
TR
11
58
3 (
%)
Lockhart-Martinelli parameter, X (-)
ISO 11583 Uncert
limits
No bend- Frg=1.5,
15 barg
6D- Frg=1.5, 15 barg
6D- Frg=1.5, 60 barg
10D- Frg=1.5, 15
barg
17D- Frg=1.5, 15
barg
17D- Frg=1.5, 30
barg
Figure 5 Effect of upstream straight lengths and pressure on gas mass flow rate
error using ISO/TR 11583 for various liquid loadings (X) at 30 and 60 barg and
Frg=1.5. 15 barg and Frg=1.5 data are shown for comparison.

North Sea Flow Measurement Workshop
October 2017
6
4.4 Effect of Gas Froude Number
The gas Froude number appeared very important and the effects found for Frg=1.5 at
15 bar were not seen for Frg=3.0 at 15 bar as shown in Figure 6.
-4
-3
-2
-1
0
1
2
3
4
0.0 0.1 0.2 0.3
Re
l Err
or
in P
red
icte
d G
as
Ma
ss F
low
usi
ng
IS
O T
R 1
15
83
(%
)
Lockhart-Martinelli parameter, X (-)
ISO 11583 Uncert
limits
No bend- Frg=3.0,
15 barg
6D- Frg=3.0, 15 barg
10D- Frg=3.0, 15
barg
Figure 6 Effect of upstream straight lengths on gas mass flow rate error using
ISO/TR 11583 for various liquid loadings (X) at 15 barg and Frg=3.0
4.5 Effect of Bend Orientation
The orientation of the bend appeared to have little impact, as shown in Figure 7. At
Frg=3.0 and 15 barg, the data obtained with the bend (10D) installed vertically
compared very well to the data obtained with the horizontal 10D installation.
-4
-3
-2
-1
0
1
2
3
4
0.0 0.1 0.2 0.3
Re
l Err
or
in P
red
icte
d G
as
Ma
ss F
low
usi
ng
IS
O T
R 1
15
83
(%
)
Lockhart-Martinelli parameter, X (-)
ISO 11583 Uncert
limits
10D- Frg=3.0, 15 barg
10D vertical- Frg=3.0,
15 barg
Figure 7 Effect of upstream straight lengths and bend orientation on gas mass
flow rate error using ISO/TR 11583 for various liquid loadings (X) at 15 barg
and Frg= 3.0.

North Sea Flow Measurement Workshop
October 2017
7
5 CONCLUSIONS OF HORIZONTAL INSTALLATION EFFECTS
The experimental results showed that under certain conditions, an upstream bend
could have a significant impact on the results obtained using the ISO/TR 11583 if
there was not a sufficient length of straight pipe upstream of the Venturi. This resulted
in large errors between the predicted gas mass flow rate using the standard ISO/TR
11583 and reference measurement, compared with when there was no bend present.
The effects of an upstream bend were most notable at shorter upstream straight
lengths before the Venturi, lower gas Froude numbers, lower test pressures and higher
liquid loadings, with larger errors being found at these conditions. The results showed
that under certain conditions, larger lengths of straight pipe than those recommended
by the standard were required. The bend’s orientation appeared to have little impact
on the results. Further investigation is necessary to clarify this.
6 INTRODUCTION TO VERTICAL TESTING
The behaviour of Venturi tubes installed vertically in wet-gas conditions is not well
understood. There is little published work on the area, and the impact of a vertical
installation on measurement errors and uncertainty has not been quantified. NEL has
completed a small pilot study to quantify the impact of a vertical installation using
ISO/TR 11583 (which was developed for horizontal flow) to see if it can be
adequately applied to a vertical installation. There is increasing interest in installing
Venturi meters in vertical installations, similar to multiphase meter installations.
There is no mention of the impact of vertical installations in ISO/TR 11583, and it is
hoped that testing on vertical configurations can allow recommendations for vertical
installation and its impact on uncertainty to be established.
7 VERTICAL EXPERIMENTAL TEST SET-UP
A Venturi tube (β=0.6, D=0.10236 m) was installed vertically after a blind-tee in
NEL’s wet-gas facility and underwent testing. There was no straight length of vertical
pipe before the meter (Figure 8).

North Sea Flow Measurement Workshop
October 2017
8
Figure 8 Vertical Venturi tube installation
Three-phase testing took place with gas (nitrogen) and oil (kerosene substitute
Crownsol D75) flows, gas and water flows or gas + water + oil flows (with 50% water
cut). Flow rates were varied to correspond to a range of gas densiometric Froude
numbers (Frg) between 1.5 and 5.5 being tested across a range of Lockhart-Martinelli
parameters (X=0.05 to 0.3).
Testing was performed at pressures ranging from 15.9 to 57.0 barg, and various
Froude numbers (usually two) were tested at each pressure. The data were then
analysed according to ISO/TR 11583, allowing comparison of the standard’s predicted
gas mass flow rate with the reference data.
In 2014, the meter was installed vertically with 30D of straight vertical pipe before the
meter. The vertical data collected in these current tests were for similar conditions to
these previous studies, allowing comparisons to be made.
The test criteria that were covered are summarised in Table 1.
North Sea Flow Measurement Workshop
October 2017
9
TABLE 1
TESTS PERFORMED
Liquid Pressure (barg) Frg Density Ratio
Oil (0% WC) 15.9 31.1 57.0
1.5, 2.5 1.5, 4.0, 4.5
1.5, 5.5
0.024 0.046 0.084
Water (100% WC) 20.1 39.1 57.0
1.5, 2.5 1.5, 4.5 1.5, 5.5
0.024 0.046 0.067
Oil + Water (50% WC)
18.0 35.0 57.0
1.5, 2.5 1.5, 4.5
5.5
0.024 0.046 0.074
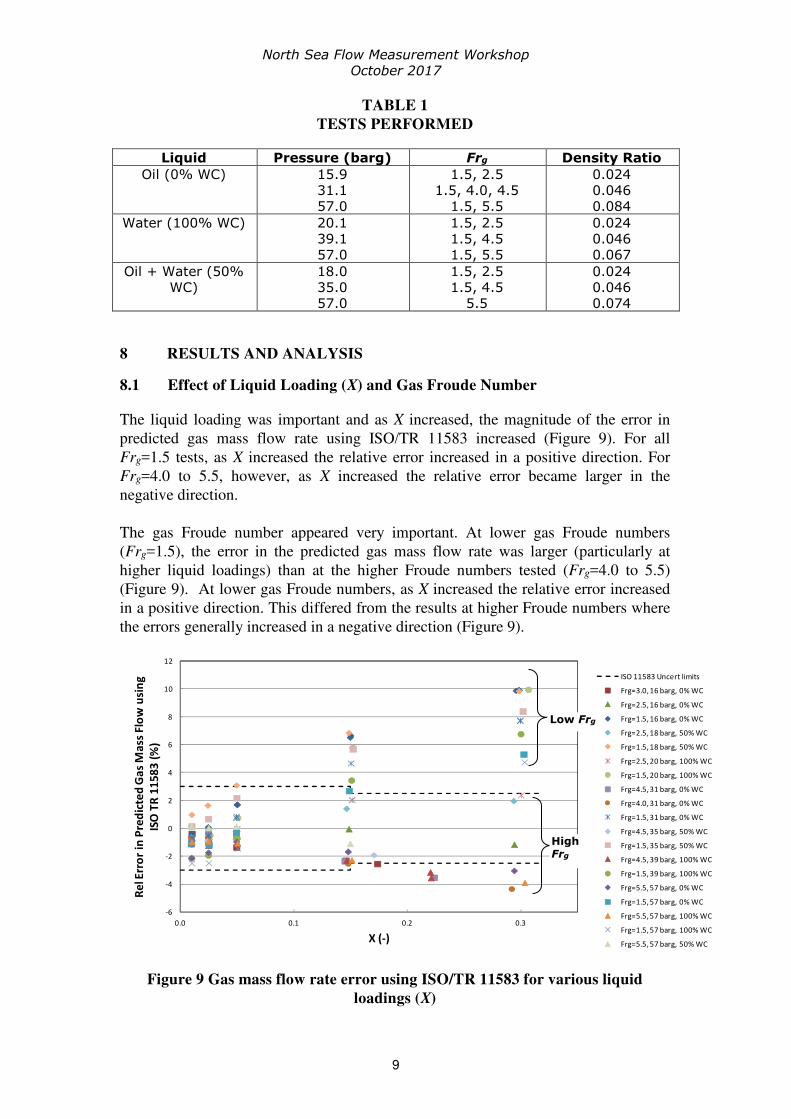
8 RESULTS AND ANALYSIS
8.1 Effect of Liquid Loading (X) and Gas Froude Number
The liquid loading was important and as X increased, the magnitude of the error in
predicted gas mass flow rate using ISO/TR 11583 increased (Figure 9). For all
Frg=1.5 tests, as X increased the relative error increased in a positive direction. For
Frg=4.0 to 5.5, however, as X increased the relative error became larger in the
negative direction.
The gas Froude number appeared very important. At lower gas Froude numbers
(Frg=1.5), the error in the predicted gas mass flow rate was larger (particularly at
higher liquid loadings) than at the higher Froude numbers tested (Frg=4.0 to 5.5)
(Figure 9). At lower gas Froude numbers, as X increased the relative error increased
in a positive direction. This differed from the results at higher Froude numbers where
the errors generally increased in a negative direction (Figure 9).
-6
-4
-2
0
2
4
6
8
10
12
0.0 0.1 0.2 0.3
Re
l Err
or
in P
red
icte
d G
as
Ma
ss F
low
usi
ng
ISO
TR
11
58
3 (
%)
X (-)
ISO 11583 Uncert limits
Frg=3.0, 16 barg, 0% WC
Frg=2.5, 16 barg, 0% WC
Frg=1.5, 16 barg, 0% WC
Frg=2.5, 18 barg, 50% WC
Frg=1.5, 18 barg, 50% WC
Frg=2.5, 20 barg, 100% WC
Frg=1.5, 20 barg, 100% WC
Frg=4.5, 31 barg, 0% WC
Frg=4.0, 31 barg, 0% WC
Frg=1.5, 31 barg, 0% WC
Frg=4.5, 35 barg, 50% WC
Frg=1.5, 35 barg, 50% WC
Frg=4.5, 39 barg, 100% WC
Frg=1.5, 39 barg, 100% WC
Frg=5.5, 57 barg, 0% WC
Frg=1.5, 57 barg, 0% WC
Frg=5.5, 57 barg, 100% WC
Frg=1.5, 57 barg, 100% WC
Frg=5.5, 57 barg, 50% WC
Figure 9 Gas mass flow rate error using ISO/TR 11583 for various liquid
loadings (X)
Low Frg
High Frg

North Sea Flow Measurement Workshop
October 2017
10
The effects seen are probably due to the meter being installed vertically, rather than
the Venturi being installed vertically directly after the blind-tee and change in flow
direction. This is discussed in more detail in Section 9.3, where the results are shown
to compare closely to previous tests where 30D of straight vertical pipe was installed
between the change in flow direction and the Venturi.
8.2 Effect of Test Pressure and Density Ratio
The test pressure and density ratio were also important and as the pressure/ density
ratio was increased, the gas mass flow error generally decreased, particularly at larger
liquid loadings. This brought data closer to falling within the standard’s uncertainty
limits. For example, as shown in Figure 10, at 57 barg, X=0.15 and Frg=1.5, the data
fell within the standard but in the equivalent tests at lower pressures (and density
ratios) the data fell outwith the standard.
-4
-2
0
2
4
6
8
10
12
0.0 0.1 0.2 0.3
Re
l Err
or
in P
red
icte
d G
as
Ma
ss F
low
usi
ng
ISO
TR
11
58
3 (
%)
X (-)
ISO 11583 Uncert limits
Frg=1.5, 16 barg, 0% WC,
DR=0.024
Frg=1.5, 18 barg, 50% WC,
DR=0.024
Frg=1.5, 20 barg, 100% WC,
DR=0.024
Frg=1.5, 31 barg, 0% WC,
DR=0.046
Frg=1.5, 35 barg, 50% WC,
0% WC, DR=0.046
Frg=1.5, 39 barg, 100% WC,
0% WC, DR=0.046
Frg=1.5, 57 barg, 0% WC, 0%
WC, DR=0.084
Frg=1.5, 57 barg, 100% WC,
0% WC, DR=0.067
Figure 10 Effect of pressure on gas mass flow rate error using ISO/TR 11583 for
various liquid loadings (X) and pressures at Frg=1.5
8.3 Comparisons of Upstream Effects on Vertical Installations
The same Venturi tube was installed in a vertical orientation with 30D straight pipe
upstream and tested under 2-phase conditions using nitrogen and oil in 2014 [1].
Refer to Figure 11 for comparison photographs of the different installations.
Figures 12 and 13 compare the Venturi tube over-readings for 31 barg and 16 barg,
respectively, for the two different vertical installations. The results indicate that
upstream installation effects for the vertical orientation of the Venturi tube are
minimal.
Lower pressures
Intermediate pressures
Higher pressures

North Sea Flow Measurement Workshop
October 2017
11
Figure 11 Photographs showing the installation of the Venturi directly after a
blind-T and with 30D straight upstream pipe (tested in 2014).
1
1.1
1.2
1.3
1.4
1.5
1.6
1.7
0.0 0.1 0.2 0.3
Ov
er-
rea
din
g (
-)
Lockhart-Martinelli parameter, X (-)
Frg=1.5, 31 barg, 0% WC
Frg=4.0, 31 barg, 0% WC
2014- Frg=1.5, 31 barg, 0% WC
2014- Frg=3.5, 31 barg, 0% WC
2014- Frg=4.5, 31 barg, 0% WC
Figure 12 Comparing over-readings between the vertical Venturi tube installed
downstream of a blind-T and with 30D upstream straight pipework (2014 data).
Pressure 31 barg.
Venturi

North Sea Flow Measurement Workshop
October 2017
12
1
1.1
1.2
1.3
1.4
1.5
1.6
1.7
1.8
0.0 0.1 0.2 0.3
Ov
er-
rea
din
g (
-)
Lockhart-Martinelli parameter, X (-)
Frg=3.0, 16 barg, 0% WC
Frg=2.5, 16 barg, 0% WC
Frg=1.5, 16 barg, 0% WC
2014- Frg=3.0, 16 barg, 0% WC
2014- Frg=2.5, 16 barg, 0% WC
2014- Frg=1.5, 16 barg, 0% WC
Figure 13 Comparing over-readings between the vertical Venturi tube installed
downstream of a blind-T and with 30D upstream straight pipework (2014 data).
Pressure 16 barg.
9 CONCLUSIONS OF VERTICAL INSTALLATION EFFECTS
The experimental results showed that under certain conditions, a vertical installation
will have a significant impact on the results obtained using the standard ISO/TR
11583. This resulted in large errors between the predicted gas mass flow rate using
ISO/TR 11583 and the reference measurement. This caused the data to fall outwith the
standard’s uncertainty limits under certain conditions. This implies that the standard is
not applicable to vertical installations without modification of the equations.
The effects of the vertical installation were most notable at lower gas Froude numbers,
lower test pressures and higher liquid loadings, with larger errors being found at these
conditions.
The data were compared with previous vertical tests done in 2014 using the same
meter. For the 2014 installation, there was 30D of straight pipe between the change in
flow direction to vertical and the Venturi. This differed from the work outlined in this
report where the Venturi was placed directly after the change in flow direction.
The 2016 data compared well to the 2014 tests, particularly for the lower gas Froude
numbers and higher liquid loadings. This was where the data fell outwith the
standard’s uncertainty limits and gas mass flow rate errors were high. The similarity
between the 2014 data and 2016 data suggests that the length of straight vertical pipe
before the meter has little impact on the results but that the meter’s vertical
orientation has a significant impact: 30D of straight pipe appeared to make little
difference compared with when there was no straight length. This differed from the
study in horizontal conditions where the straight length before the meter was
important and 17D of straight pipe before the Venturi was needed to bring data within
ISO/TR 11583 for some upstream conditions to those studied in the vertical tests.

North Sea Flow Measurement Workshop
October 2017
13
Based on the findings of this pilot study, additional work is required to allow ISO/TR
11583 to be modified for vertical installations. Further work on the requirements for
straight vertical pipe before the vertical Venturi are also required.
10 REFERENCES
[1] Graham, E. et al., “Performance of a vertically installed Venturi tube in wet-
gas conditions”, North Sea Flow Measurement Workshop, St. Andrews,
Scotland, Oct 2014
APPENDIX
Definitions of Wet-Gas Flow
For this research, wet-gas flow is defined as the flow of gas and liquids with a
Lockhart-Martinelli parameter, X, in the range 0 < X ≤ 0.3.
The Lockhart-Martinelli parameter, liq
gas
gas
liq
m
mX
ρρ ,1= (1)
where mliq and mgas are the mass flow rates of the liquid and gas phase respectively
and ρliq and ρgas are the densities of the liquid and gas phase respectively. In this work
the density of the gas phase is that at the upstream pressure tapping, ρ1,gas.
The gas densiometric Froude number, Frgas, is a dimensionless number directly
proportional to the gas velocity. It is defined as the square root of the ratio of the gas
inertia if it flowed alone to the gravitational force on the liquid phase.
Gas densiometric Froude number, gas 1,gas
gasliq 1,gas
vFr
gD
ρρ ρ
=−
(2)
where vgas is the superficial gas velocity, g is the acceleration due to gravity and D is
the pipe internal diameter.
The superficial gas velocity is given by gas
gas1,gas
mv
Aρ= (3)
where A is the pipe area.
The gas-to-liquid density ratio, DR, is defined as
1,gas
liq
DRρρ
= (4)
The corrected gas mass flowrate, mgas, is given by
(5)
φρε wetgaswetd
gas
pCEAm
∆= ,12

North Sea Flow Measurement Workshop
October 2017
14
3% for 0.15
2.5% for 0.15 < 0.3
X
X
≤ ≤
where E is the velocity of approach factor defined below, Ad is the Venturi-tube throat
area, C is the discharge coefficient, εwet is the gas expansibility in wet-gas conditions,
∆pwet is the actual (wet-gas) differential pressure and φ is the wet-gas over-reading or
correction. εwet was determined from ISO 5167-4 [1] using the actual value of
pressure ratio.
The velocity of approach factor, E, is defined as 4
1
1
E
β=
− (6)
where β is the diameter ratio of the Venturi tube (diameter at throat / diameter of
pipe).
ISO/TR 11583 Corrections for Venturi Tubes
The wet-gas discharge coefficient can be derived using this equation:
gas,th-0.05 = 1-0.0463e min 1,
0.016
Fr XC
(7)
where the throat Froude number (Frgas,th) is calculated as:
gasgas,th 2.5
FrFr
β= (8)
The over-reading is 2
Ch1 C X Xφ = + + (9)
where CCh accounts for the density ratio and is given by the following equation:
liq 1,gas
Ch1,gas liq
n n
Cρ ρ
ρ ρ
= +
(10)
The value of n was determined to be:
0.8 /2 2max(0.583 0.18 0.578 ,0.392 0.18 )gasFr Hn eβ β−= − − − (11)
where H is a parameter to account for the effect of the liquid properties on the over-
reading. H = 1 for liquid hydrocarbon, H = 1.35 for water at ambient temperature and
H = 0.79 for liquid water in wet-steam flow (hence at elevated temperatures). For
oil/water mixtures, interpolation is used to obtain an appropriate H value.
The correlation can be used to determine the gas mass flowrate for the following
Venturi tube parameters and wet-gas conditions:
0.4 ≤ β ≤ 0.75
0 < X ≤ 0.3
3 < Frgas,th with an uncertainty of
0.02 < ρ1,gas/ρliq
D ≥ 50 mm