institut für mathematik & informatik, freie universität...
TRANSCRIPT

VL Algorithmische BioInformatik (19710)
WS2013/2014
Woche 14 - Mittwoch
Tim Conrad
AG Medical Bioinformatics
Institut für Mathematik & Informatik, Freie Universität Berlin
Vorlesungsthemen
Part 1: Background Basics (4)
1. The Nucleic Acid World
2. Protein Structure
3. Dealing with Databases
Part 2: Sequence Alignments (3)
4. Producing and Analyzing Sequence Alignments
5. Pairwise Sequence Alignment and Database Searching
6. Patterns, Profiles, and Multiple Alignments
Part 3: Evolutionary Processes (3)
7. Recovering Evolutionary History
8. Building Phylogenetic Trees
Part 4: Genome Characteristics (4)
9. Revealing Genome Features
10. Gene Detection and Genome Annotation
Part 5: Secondary Structures (4) 11. Obtaining Secondary Structure from Sequence 12. Predicting Secondary Structures Part 6: Tertiary Structures (4) 13. Modeling Protein Structure 14. Analyzing Structure-Function Relationships Part 7: Cells and Organisms (6) 15. Proteome and Gene Expression Analysis 16. Clustering Methods and Statistics 17. Systems Biology
Tim Conrad, VL Algorithmische Bioinformatik, WS2013/2014 2
Buch: 15.2

Vorlesungsthemen
Heute: Proteomics I • Einleitung Methodik: 2D Gel
Electrophoresis und Mass Spec
Montag: Proteomics II • Einleitung Algorithmik: Wie
analysiert man Mass Spec Daten?
Tim Conrad, VL Algorithmische Bioinformatik, WS2013/2014 3
Colebatch et al (2002) Functional Genomics: tools of the trade. New Phytol 153: 27-36.

mRNA coding for Protein A
Protein A
DNA
Main idea: • Proteins are the „work horses“ in a cell but hard to measure • Last time: use number of mRNAs as proxy instead • This time: try to measure proteins anyway

Same Genome, different Proteome
Why Proteomics?
Contrarily to the static Genome, the Proteome is highly dynamic!
Tim Conrad, VL Algorithmische Bioinformatik, WS2013/2014 5
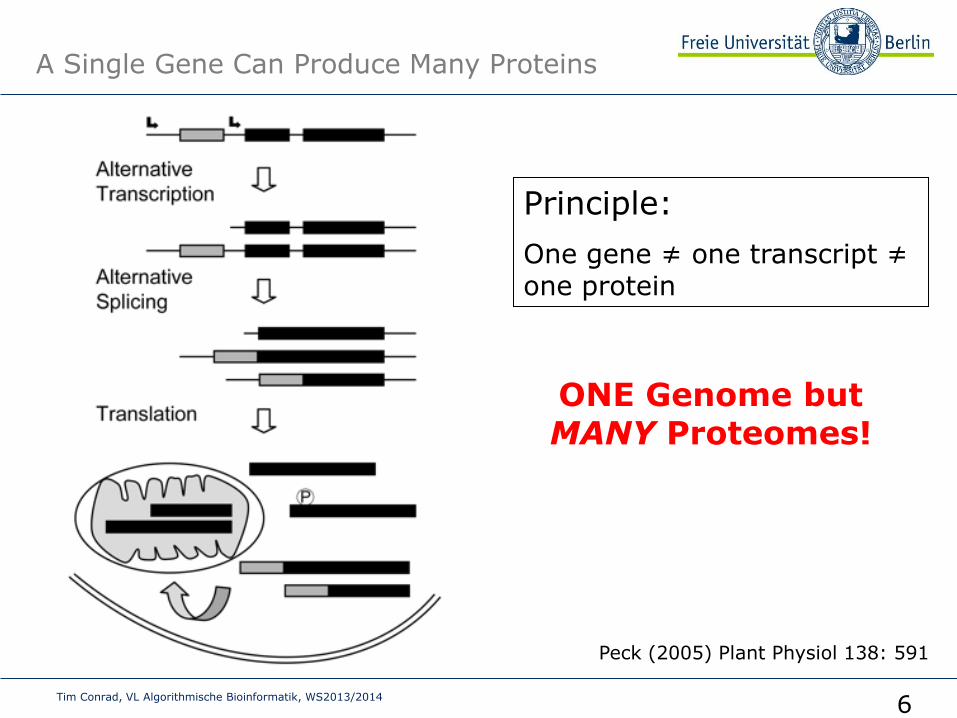
A Single Gene Can Produce Many Proteins
Peck (2005) Plant Physiol 138: 591
Principle:
One gene ≠ one transcript ≠ one protein
ONE Genome but MANY Proteomes!
Tim Conrad, VL Algorithmische Bioinformatik, WS2013/2014 6
Tim Conrad, VL Algorithmische Bioinformatik, WS2013/2014
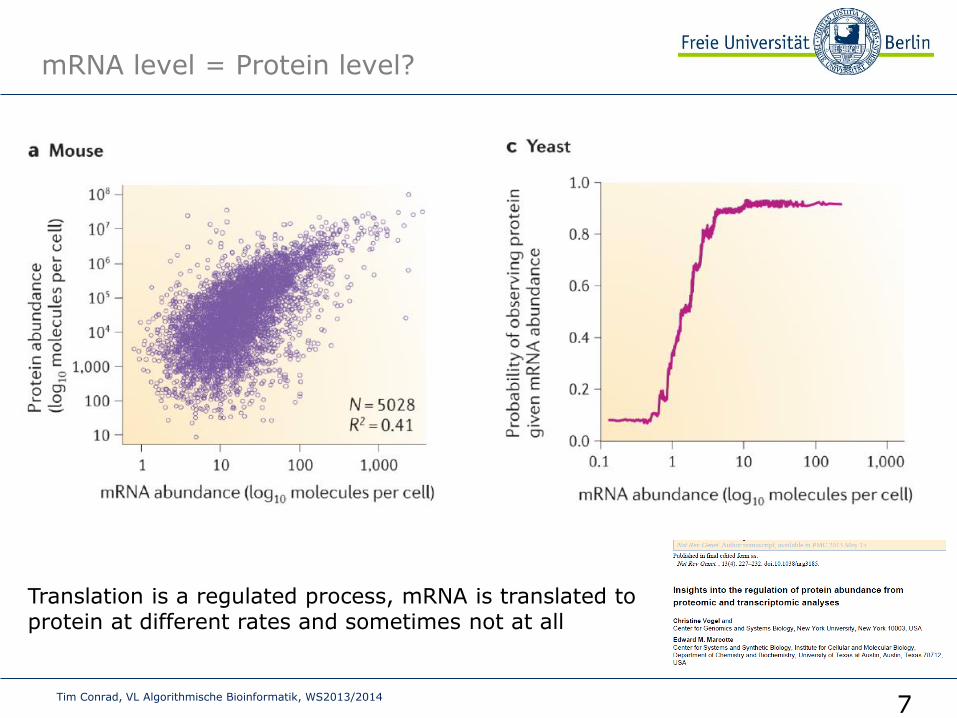
mRNA level = Protein level?
Translation is a regulated process, mRNA is translated to protein at different rates and sometimes not at all
7

Genome vs. proteome
Tim Conrad, VL Algorithmische Bioinformatik, WS2013/2014 8
• Human Genome = 20 – 30.000 genes
• Human Proteome = 300.000 to 1.200.000 protein variants
• Genome – static; proteome - dynamic;
• „… there is only a 0.4 correlation between global mRNA and protein expression..”
• PTMs: • Phosphorylation, Acetylation, Methylation, Hydroxy amino
acids, Acylation, Myristic acid, Palmitic acid, Prenylation, Farnesol, Geranylgeranol, Nitrosylation, Oxidation, Other oxidation: loss of SH, Dityrosine formation, Isoaspartate, Glycation variable, Glycoxidation variable, Lipid peroxide adduction variable, … (more than 300 known)
Proteome - Definition
“If the genome is a list of the
instruments in an orchestra, the
proteome is the orchestra playing a
symphony.” R. Simpson
Proteins and Proteomics: A Laboratory Manual (2003)
Tim Conrad, VL Algorithmische Bioinformatik, WS2013/2014 9

The goals of proteomics
• Proteomics aims to simultaneously
characterize all proteins in biological
samples
• Identify / sequence the proteins and
determine their relative abundances
• Characterize their posttranslational
modifications
• Determine the three dimensional
structure
• Identify the interactions between
proteins
• Follow all the above during development,
in response to hormonal stimuli, in
health and disease, etc.
Tim Conrad, VL Algorithmische Bioinformatik, WS2013/2014 10
Science 291 (2001) 1221.

The Scope of Proteomics
• Protein identity (mutant protein)
• Protein quantity (up or down)
• Protein post-translational modifications (up or down)
• Protein structure
• Protein-protein interaction
• Protein localization
The change in any protein property may cause functional
abnormality and might be relevant to pathogenesis.
Tools
• 2D Gel Electrophorese
• Protein (antibody) array
• Mass Spectrometry
Tim Conrad, VL Algorithmische Bioinformatik, WS2013/2014 11

Proteins Are The Key to Understanding Disease
~30,000 Genes
RNA DNA
Transcription
Genome Transcriptome
> 1,000,000 Proteins
Proteins Modified Proteins
Translation Post-Translation Modification
Proteome
Biological Function
x 5 to 50 functional
links per protein
Tim Conrad, VL Algorithmische Bioinformatik, WS2013/2014 12
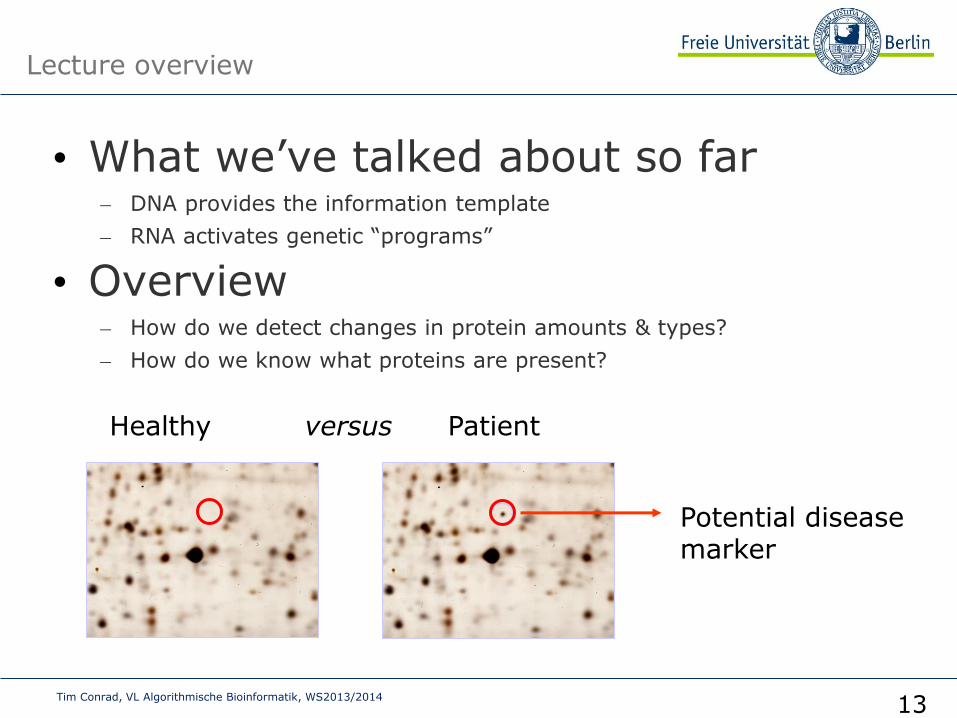
Lecture overview
• What we’ve talked about so far – DNA provides the information template
– RNA activates genetic “programs”
• Overview – How do we detect changes in protein amounts & types?
– How do we know what proteins are present?
Healthy versus Patient
Potential disease marker
Tim Conrad, VL Algorithmische Bioinformatik, WS2013/2014 13


• Proteomics
• The 2-D gel technology
• Extracting quantitative information
– Image analysis of 2-D gels
• Comparison with microarrays
Overview
Tim Conrad, VL Algorithmische Bioinformatik, WS2013/2014 15

2D Gel Electrophoresis
• Simultaneous
separation and
detection of ~2.000
proteins on a 20x25
cm gel
• Up to 10.000
proteins can be seen
using optimized
protocols
Tim Conrad, VL Algorithmische Bioinformatik, WS2013/2014 16

WT EXP
Differential proteomics
Tim Conrad, VL Algorithmische Bioinformatik, WS2013/2014 17

Why 2D GE?
• Oldest method for large scale
protein separation (since
1975) and still most popular
• Permits simultaneous
detection, display,
purification, identification,
quantification
• Robust, reproducible, simple
and cost effective
• Modestly scalable &
somewhat parallelizable
• Provides data about pI, MW,
protein quantity
Tim Conrad, VL Algorithmische Bioinformatik, WS2013/2014 18
Buch 15.12 (p.613)
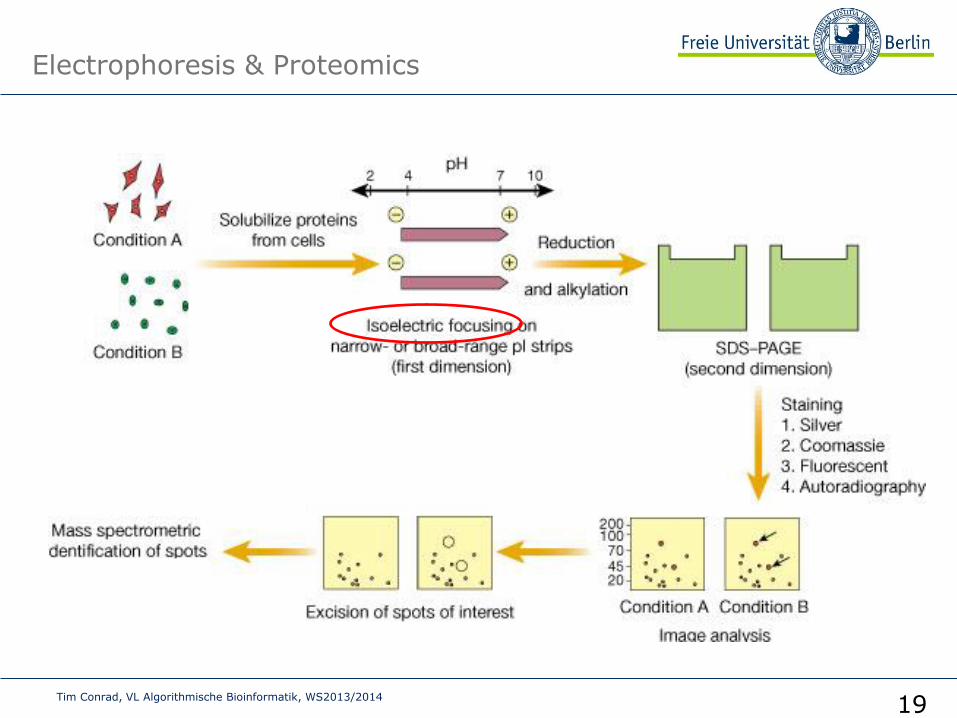
Electrophoresis & Proteomics
.
Tim Conrad, VL Algorithmische Bioinformatik, WS2013/2014 19

• Proteomics
• The 2-D gel technology
• Extracting quantitative information
– Image analysis of 2-D gels
• Comparison with microarrays
Overview
Tim Conrad, VL Algorithmische Bioinformatik, WS2013/2014 20

Proteomics
DNA
mRNA
Production Modification Degradation
Localisation
Interaction
ACTIVITY
P
TDP
Co-factors
2-D gels
Tim Conrad, VL Algorithmische Bioinformatik, WS2013/2014 21
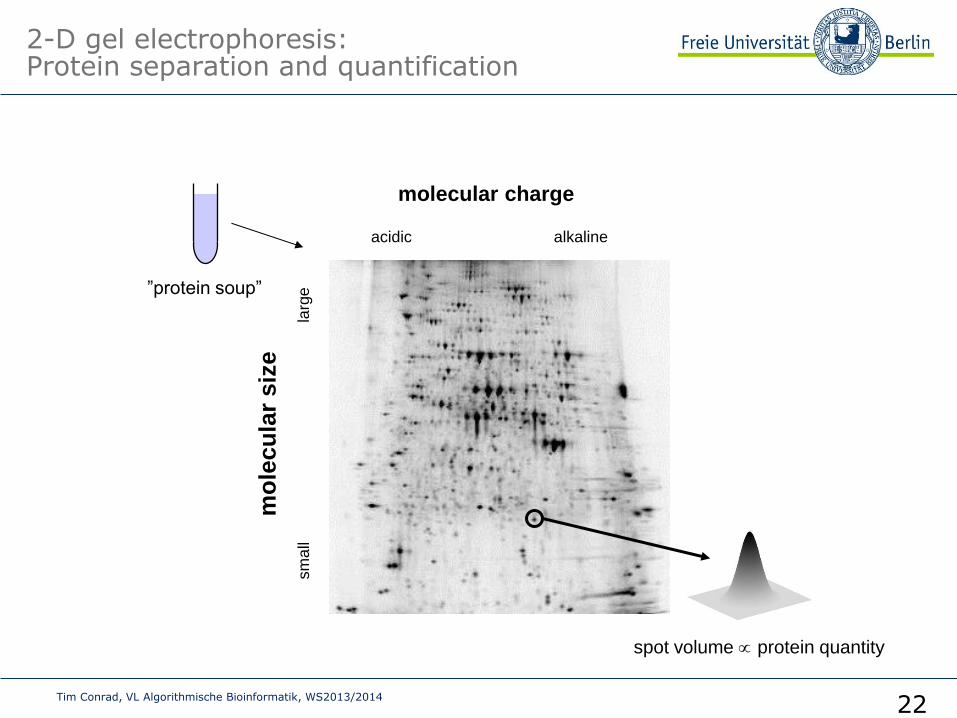
2-D gel electrophoresis: Protein separation and quantification
”protein soup”
spot volume protein quantity
mo
lecu
lar
siz
e
molecular charge
acidic alkaline
sm
all
larg
e
Tim Conrad, VL Algorithmische Bioinformatik, WS2013/2014 22

WT EXP
Differential proteomics
Tim Conrad, VL Algorithmische Bioinformatik, WS2013/2014 23

A typical 2-D gel experiment
statistical analysis
conclusions
protein extracts
biological experiment control treatment
2-D gel images
2-D gel electrophoresis
quantified data
image analysis
25211511
225221215211
125121115111
mmmm zzzz
zzzz
zzzz
matrix with
spot volume
data
rows: proteins
(many)
columns: gels
(few)
experimental design
Example:
Tim Conrad, VL Algorithmische Bioinformatik, WS2013/2014 24
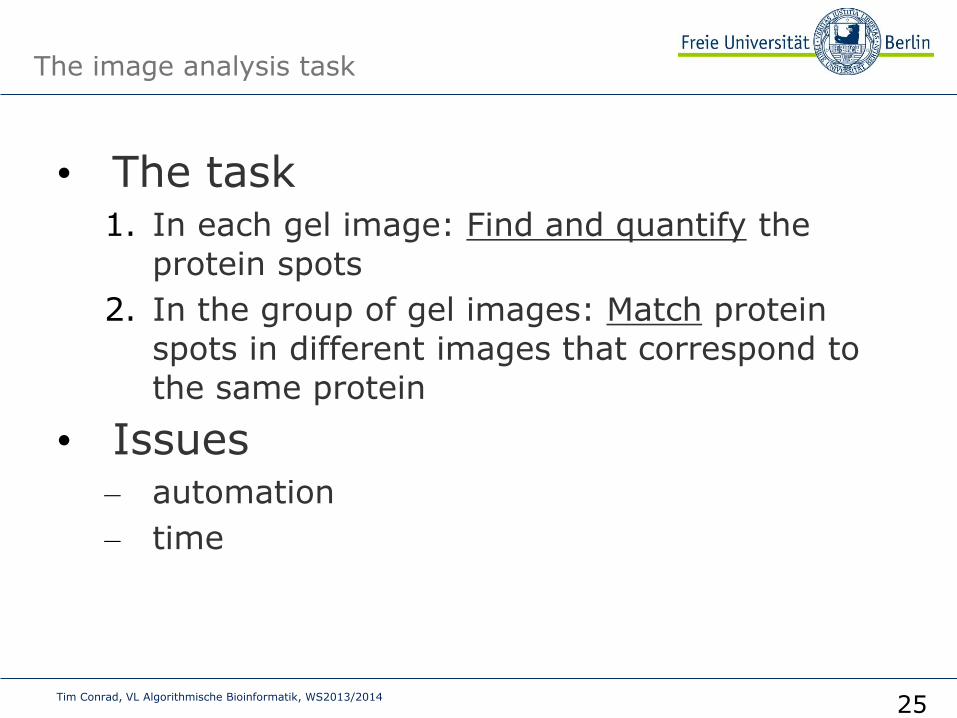
The image analysis task
• The task 1. In each gel image: Find and quantify the
protein spots
2. In the group of gel images: Match protein
spots in different images that correspond to
the same protein
• Issues – automation
– time
Tim Conrad, VL Algorithmische Bioinformatik, WS2013/2014 25
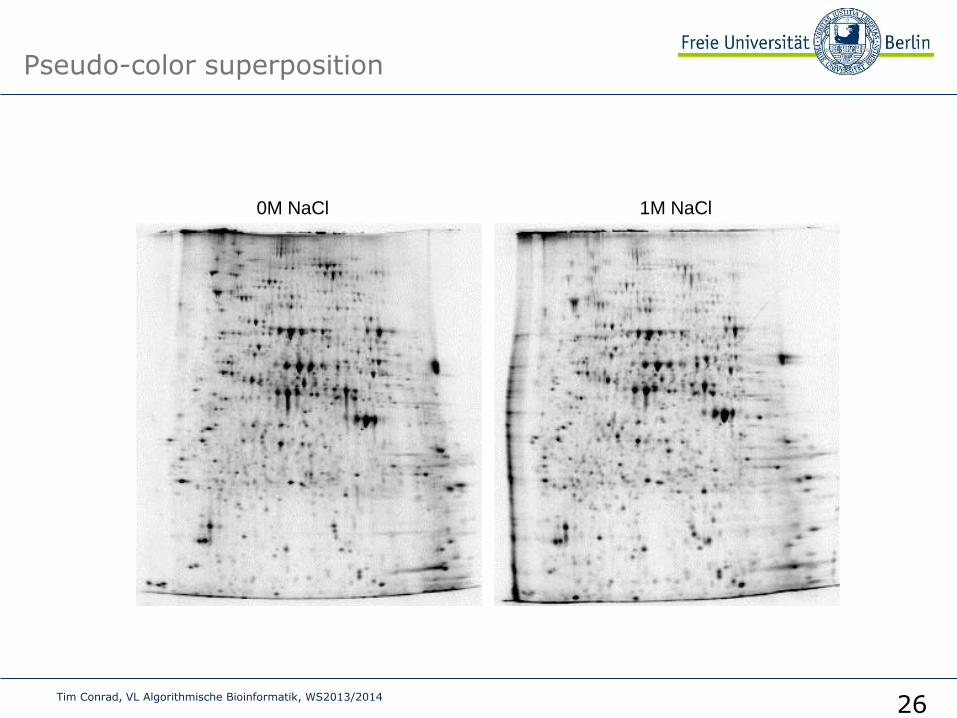
Pseudo-color superposition
0M NaCl 1M NaCl
Tim Conrad, VL Algorithmische Bioinformatik, WS2013/2014 26

OM NaCl 1M NaCl
Pseudo-color superposition
Tim Conrad, VL Algorithmische Bioinformatik, WS2013/2014 27

(red: 0M NaCl, blue: 1M NaCl)
Pseudo-color superposition
Tim Conrad, VL Algorithmische Bioinformatik, WS2013/2014 28

The standard solution – workflow
In each gel image 1. Background subtraction
2. Spot detection
3. Spot quantification
In the group of gel images 4. Spot pattern matching
Tim Conrad, VL Algorithmische Bioinformatik, WS2013/2014 29

1. Background subtraction
Before After
- =
Tim Conrad, VL Algorithmische Bioinformatik, WS2013/2014 30
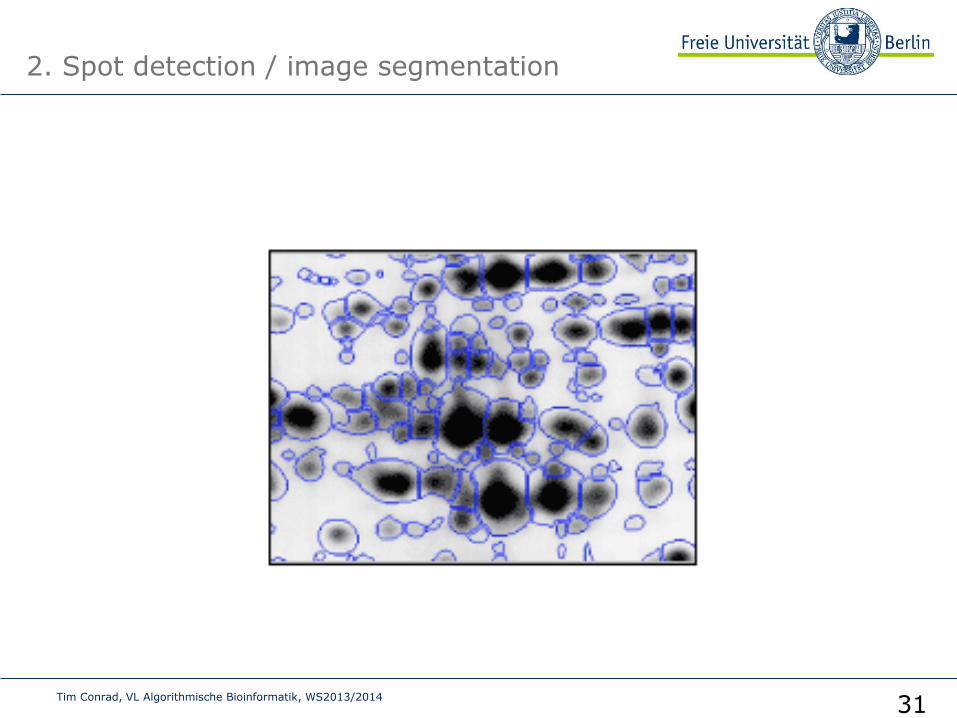
2. Spot detection / image segmentation
Tim Conrad, VL Algorithmische Bioinformatik, WS2013/2014 31
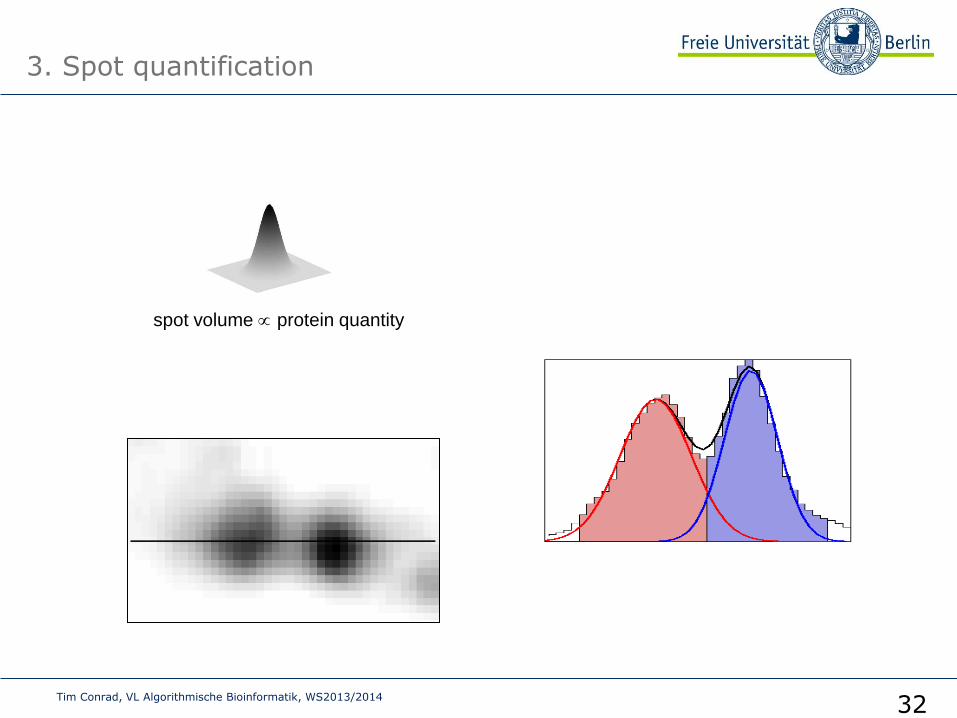
3. Spot quantification
spot volume protein quantity
Tim Conrad, VL Algorithmische Bioinformatik, WS2013/2014 32

4. Spot pattern matching
Tim Conrad, VL Algorithmische Bioinformatik, WS2013/2014 33
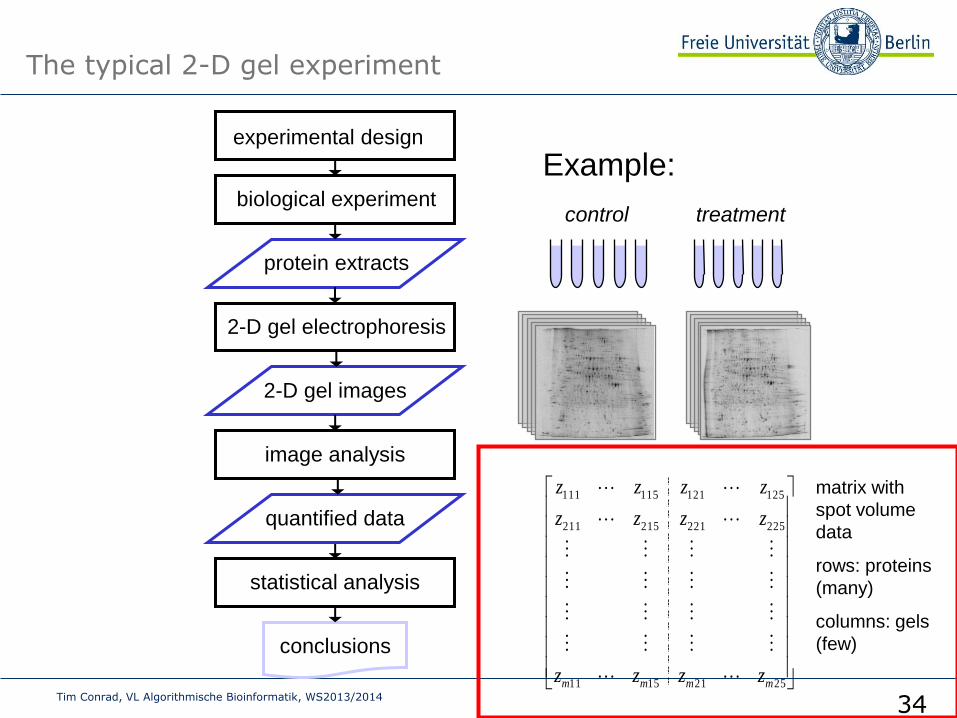
The typical 2-D gel experiment
statistical analysis
conclusions
protein extracts
biological experiment control treatment
2-D gel images
2-D gel electrophoresis
quantified data
image analysis
25211511
225221215211
125121115111
mmmm zzzz
zzzz
zzzz
matrix with
spot volume
data
rows: proteins
(many)
columns: gels
(few)
experimental design
Example:
Tim Conrad, VL Algorithmische Bioinformatik, WS2013/2014 34

Limitations
• Technological
– hydrofobic proteins
don’t dissolve
– limited pI/size
coverage
– limited
labeling/staining
• Image analytical
– Limited global
matching efficiency
of automatic
algorithms
– Need for time
consuming manual
guidance
– ”The image analysis
bottle-neck”
Tim Conrad, VL Algorithmische Bioinformatik, WS2013/2014 35

Limited global matching efficiency
Voss and Haberl (2000)
Tim Conrad, VL Algorithmische Bioinformatik, WS2013/2014 36
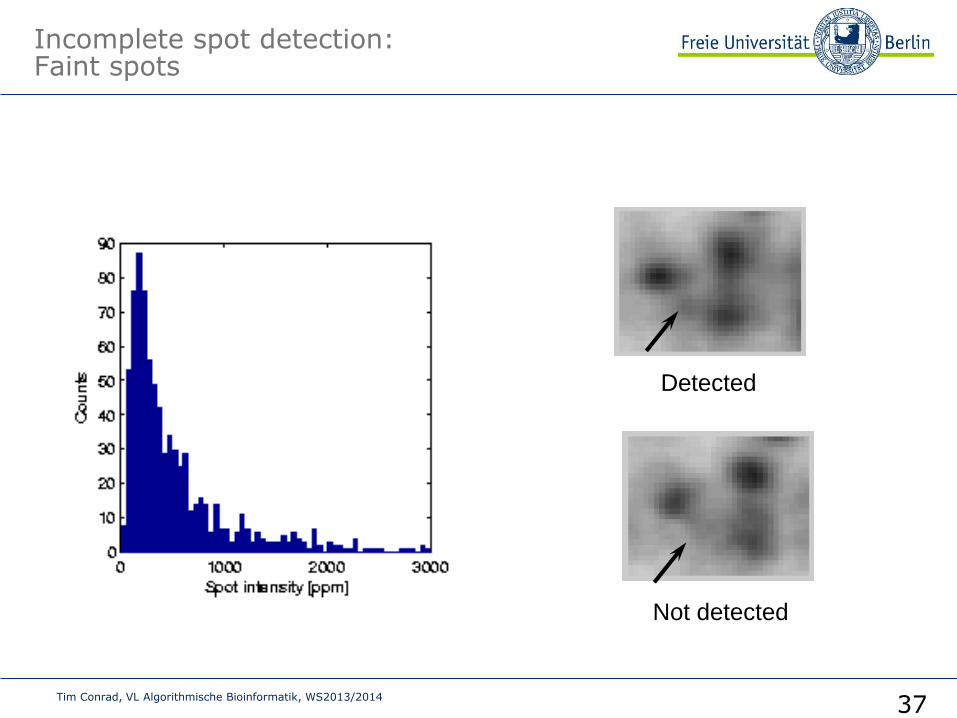
Incomplete spot detection: Faint spots
Detected
Not detected
Tim Conrad, VL Algorithmische Bioinformatik, WS2013/2014 37

Incomplete spot detection: Close spots
Tim Conrad, VL Algorithmische Bioinformatik, WS2013/2014 38

Variability
normal 1M NaCl
normal 1M NaCl
bio
log
ical re
plic
ation
s
growth condition
Tim Conrad, VL Algorithmische Bioinformatik, WS2013/2014 39

Variance versus mean dependence
• A dot in the plot:
– the measurement of one
protein
• The quadratic dependence
indicates a multiplicative
error structure
(2x5 gel set; normal growth condition)
slope=2 variance mean2
Tim Conrad, VL Algorithmische Bioinformatik, WS2013/2014 40
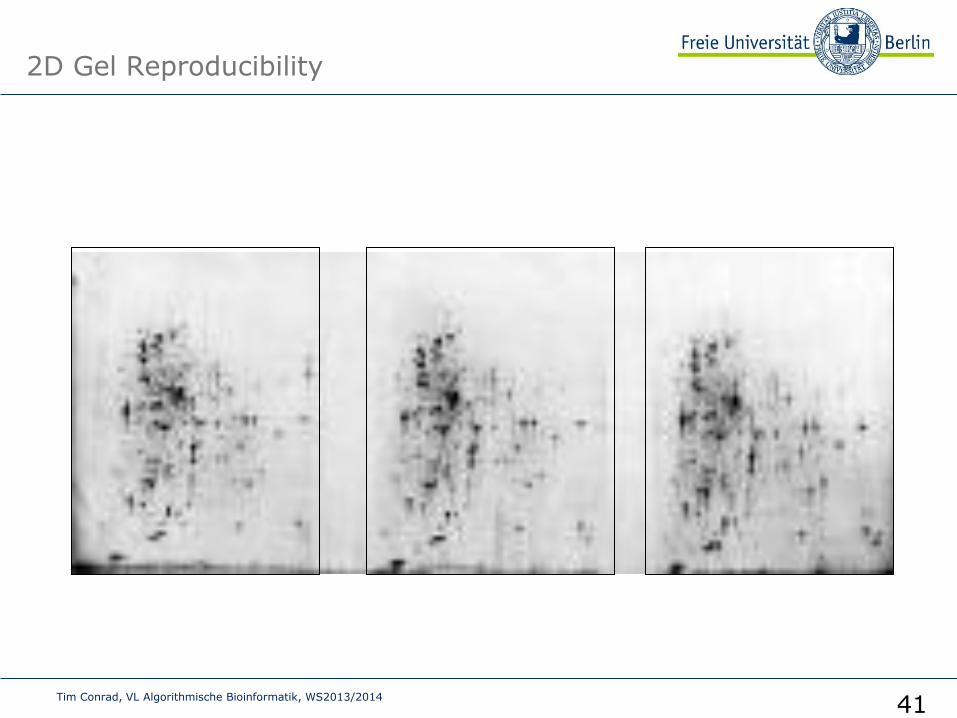
2D Gel Reproducibility
Tim Conrad, VL Algorithmische Bioinformatik, WS2013/2014 41

• Proteomics
• The 2-D gel technology
• Extracting quantitative information
– Image analysis of 2-D gels
• Comparison with microarrays
Overview
Tim Conrad, VL Algorithmische Bioinformatik, WS2013/2014 42
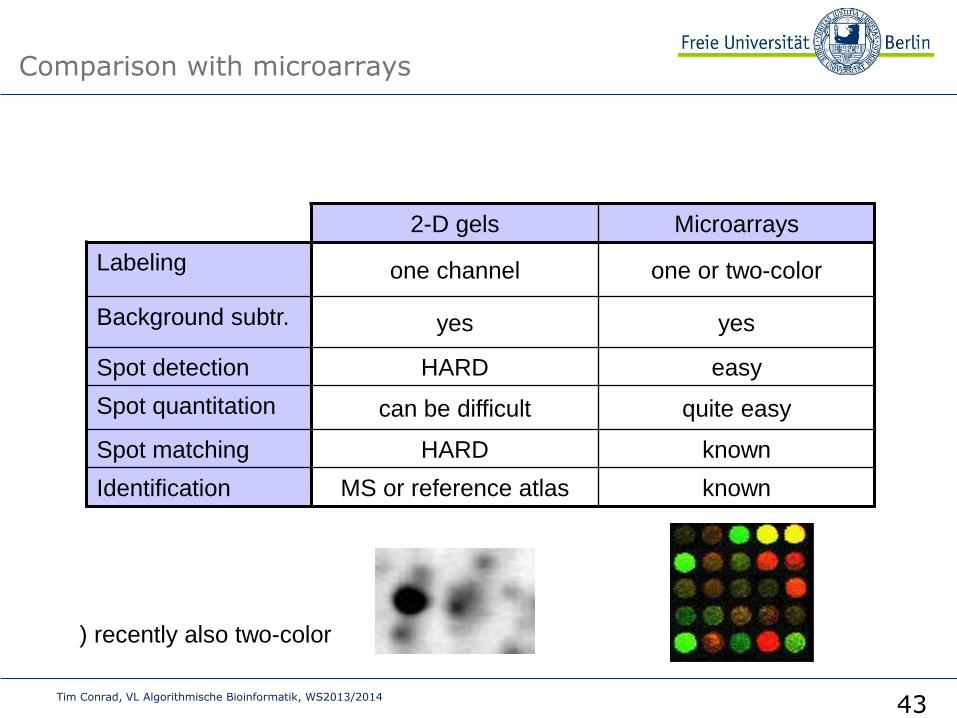
Comparison with microarrays
2-D gels Microarrays
Labeling one channel one or two-color
Background subtr. yes yes
Spot detection HARD easy
Spot quantitation can be difficult quite easy
Spot matching HARD known
Identification MS or reference atlas known
) recently also two-color
Tim Conrad, VL Algorithmische Bioinformatik, WS2013/2014 43

Advantages and Disadvantages of 2D GE
• Provides a hard-copy
record of separation
• Allows facile quantitation
• Separation of up to 9000
different proteins
• Highly reproducible
• Gives info on Mw, pI and
post-trans modifications
• Inexpensive
• Limited pI range (4-8)
• Proteins >150 kD not
seen in 2D gels
• Difficult to see
membrane proteins
(>30% of all proteins)
• Only detects high
abundance proteins
(top 30% typically)
• Time consuming
Tim Conrad, VL Algorithmische Bioinformatik, WS2013/2014 44
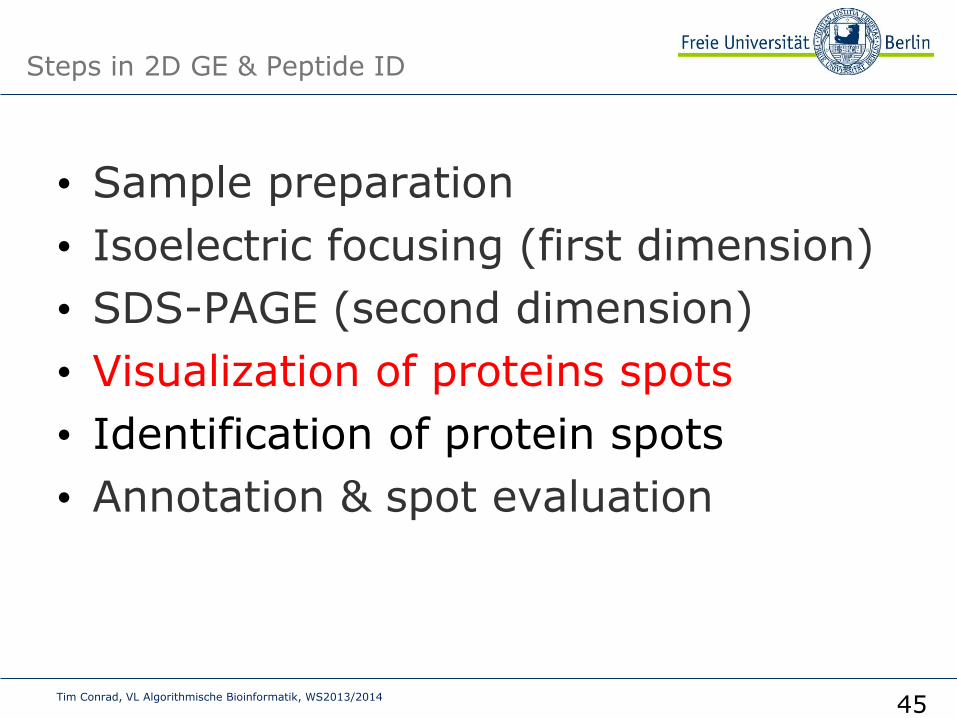
Steps in 2D GE & Peptide ID
• Sample preparation
• Isoelectric focusing (first dimension)
• SDS-PAGE (second dimension)
• Visualization of proteins spots
• Identification of protein spots
• Annotation & spot evaluation
Tim Conrad, VL Algorithmische Bioinformatik, WS2013/2014 45

WT EXP
Differential proteomics
Tim Conrad, VL Algorithmische Bioinformatik, WS2013/2014 46

2D GE - Idea
Buch 15.14 (p.616) Tim Conrad, VL Algorithmische Bioinformatik, WS2013/2014
47
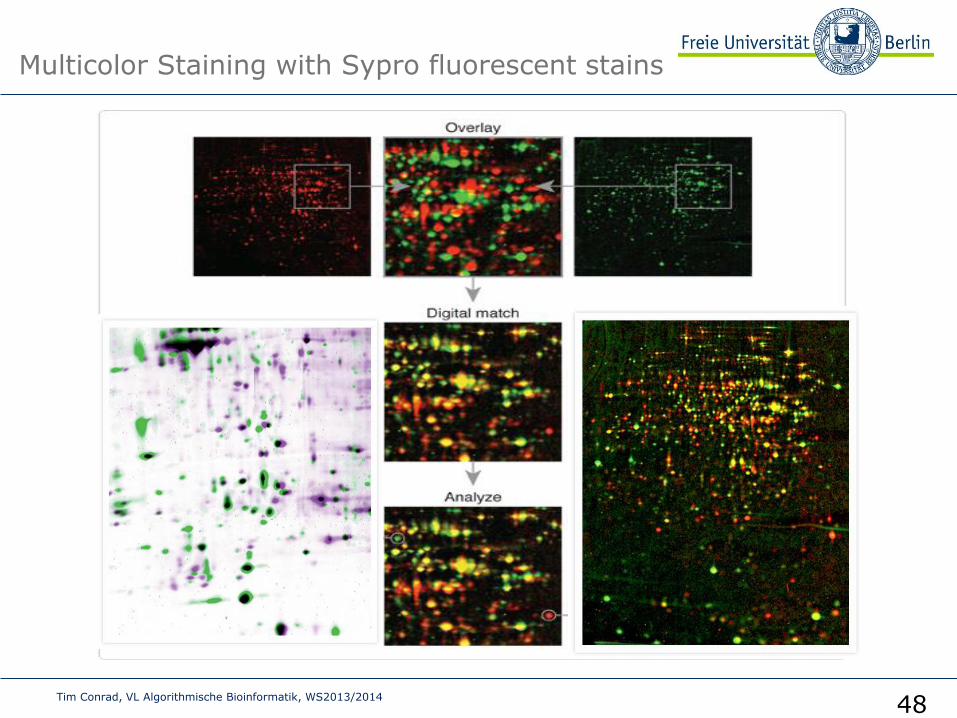
Multicolor Staining with Sypro fluorescent stains
Tim Conrad, VL Algorithmische Bioinformatik, WS2013/2014 48

Buch 15.20 (p.620) Tim Conrad, VL Algorithmische Bioinformatik, WS2013/2014
49
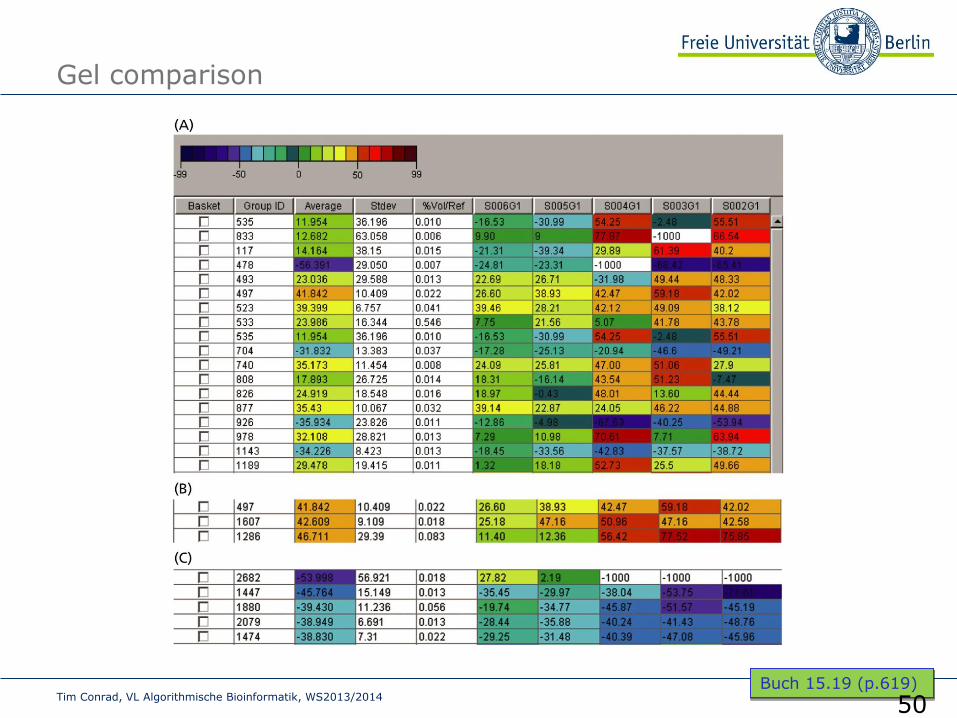
Gel comparison
Buch 15.19 (p.619) Tim Conrad, VL Algorithmische Bioinformatik, WS2013/2014
50

Expression levels „healthy“ vs. „diseased“
Buch 15.15 (p.617) Tim Conrad, VL Algorithmische Bioinformatik, WS2013/2014
51


WT EXP
Differential proteomics
Tim Conrad, VL Algorithmische Bioinformatik, WS2013/2014 53

Identifying the proteins
Trx
p53
G6PDH
Gel punch
Tim Conrad, VL Algorithmische Bioinformatik, WS2013/2014 54

Summary
Buch 15.21 (p.622) Tim Conrad, VL Algorithmische Bioinformatik, WS2013/2014
55

Mass Spectrometry
• Analytical method to measure the
molecular or atomic weight of samples
Tim Conrad, VL Algorithmische Bioinformatik, WS2013/2014 56

MS Principles
• Find a way to “charge” an atom or molecule
(ionization)
• Place charged atom or molecule in a magnetic
field or subject it to an electric field and measure
its speed or radius of curvature relative to its
mass-to-charge ratio (mass analyzer)
• Detect ions using
microchannel plate or
photomultiplier tube
Tim Conrad, VL Algorithmische Bioinformatik, WS2013/2014 57

Mass Spec Principles
Ionizer
Sample
+
_
Mass Analyzer Detector
Tim Conrad, VL Algorithmische Bioinformatik, WS2013/2014 58

Typical Mass Spectrometer
Tim Conrad, VL Algorithmische Bioinformatik, WS2013/2014 59
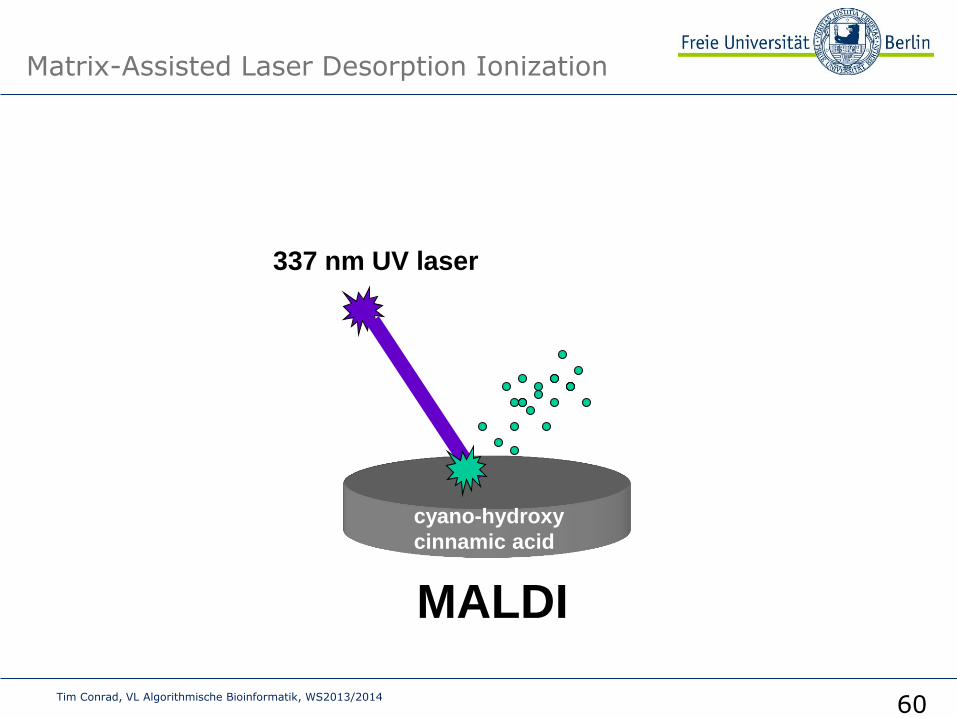
Matrix-Assisted Laser Desorption Ionization
337 nm UV laser
MALDI
cyano-hydroxy
cinnamic acid
Tim Conrad, VL Algorithmische Bioinformatik, WS2013/2014 60

MALDI Ionization
+ +
+
+
-
- -
+ +
+
+
-
- - - + +
Analyte
Matrix
Laser
+
+ +
• Absorption of UV radiation
by chromophoric matrix and
ionization of matrix
• Dissociation of matrix,
phase change to super-
compressed gas, charge
transfer to analyte molecule
• Expansion of matrix at
supersonic velocity, analyte
trapped in expanding matrix
plume
(explosion/”popping”)
+
+
+
Tim Conrad, VL Algorithmische Bioinformatik, WS2013/2014 61
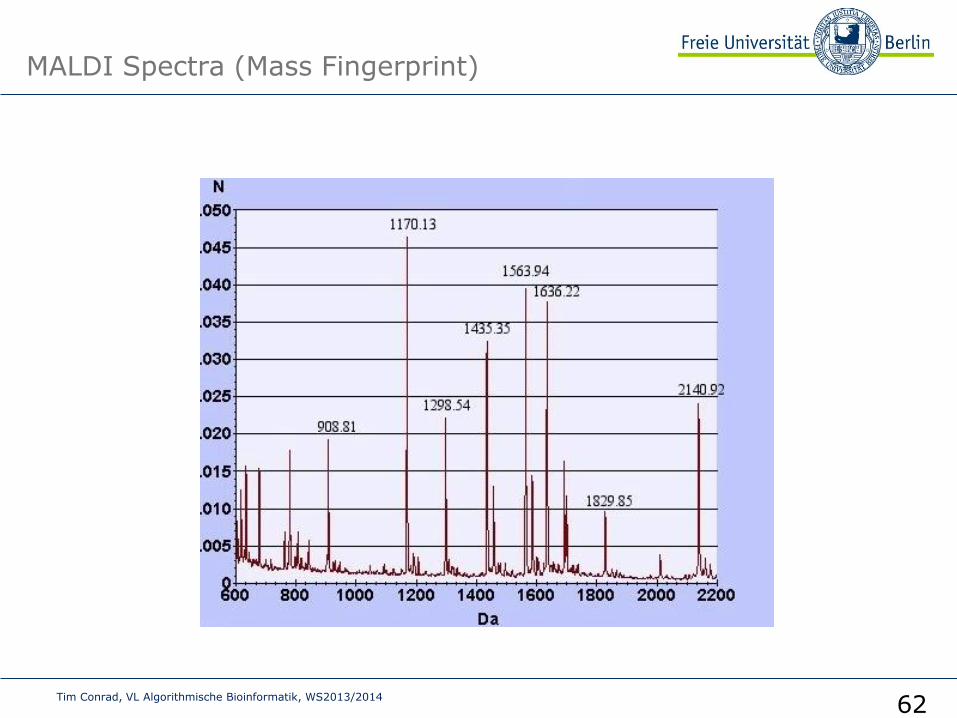
MALDI Spectra (Mass Fingerprint)
Tumor
Tim Conrad, VL Algorithmische Bioinformatik, WS2013/2014 62

Summary
Buch 15.21 (p.622) Tim Conrad, VL Algorithmische Bioinformatik, WS2013/2014
63

Tim Conrad
AG Medical Bioinformatics
www.medicalbioinformatics.de
Mehr Informationen im Internet unter
medicalbioinformatics.de/teaching
Vielen Dank!
Weitere Fragen