instrumental neutron activation analysis (inaa)...atoms decay via beta minus decay which converts a...
TRANSCRIPT

Instrumental Neutron Activation Analysis (INAA)
Overview:
Unlike most analytical techniques INAA requires no chemical processing of the samples,
therefore it is described as Instrumental NAA rather than radiochemical NAA. This
characteristic has several advantages:
(1) Rapid, i.e., less labor required to prepare samples.
(2) Precludes the possibility of contaminating the samples.
As shown in Fig. 1 (Periodic Table), in terrestrial sediments INAA typically obtains
precise abundance data (i.e. duplicate analyses agree within 5%) for many elements, typically
occurring as trace elements in the parts per million (by weight) range.
The concept of INAA is to produce radioactive isotopes by exposing the samples to a
high flux of neutrons in a nuclear reactor. These isotopes typically decay by beta decay and in
the process gamma rays (electromagnetic radiation) with discrete energies are emitted). These
discrete energies are the fingerprint for an isotope. Note that this technique determines
abundance of isotopes, but because isotopic abundances of most, at least high atomic number,
elements are constant in natural materials, isotopic abundance is readily translated to elemental
abundances.
Gamma rays arise from transitions between nuclear energy levels whereas X-rays arise
from transitions between electron energy levels. An advantage of gamma rays is that many are
much more energetic than X-rays; therefore gamma rays are less readily absorbed and matrix
corrections (see lecture on electron microprobe) are not usually important.
1

H He 1 2
Li Be
Na Mg
K Ca Sc Ti V Cr Mn Fe Co Ni Cu Zn Ga Ge As Se Br
Al Si
B C N
P
O
S
F
Cl Ar
Ne
Kr
XeITe SbSn
Pb Bi Po At Rn
In
Tl
CdAg
Au Hg
Pd
PtIr
RhRu
OsRe
Tc Mo
W
NbZrYSr
Ba La Hf Ta
AcRaFr
Cs
Rb
Ce Pr Nd Pm Sm Eu Gd Tb Dy Ho Er Tm Yb Lu
Th Pa U Np Pu Am Cm Bk Cf Es Fm Md No Lr
IA IIA
IIIA IVA VA VIA VIIA
3 4
11 12
19 20
37 38 39 40 41
21 22 23 24 25 26 27 28 29 30 31 32
13 14
5 6 7 8 9 10
18171615
33 34 35 36
42 43 44 45 46 47 48 49 50 51 52 53 54
55 56 57
58 59 60 61 62 63 64 65 66 67 68 69 70 71
72 73 74 75 76 77 78 79 80 81 82 83 84 85 86
87 88 89
90 91 92 93 94 95 96 98 99 100 103101 10297
VIII IB IIB
IIIB IVB VB VIB VIIB 0
Figure 1. Abundance of the elements highlighted in color can be precisely determined by INAA of natural materials, such as soils, sediments and rocks. Since only 10 elements (Na, Mg, K, Ca, Ti, Mn, Fe, Al and O) are major elements in most rocks and soils, INAA is principally a technique used for analyses of trace elements.
Periodic Table of the Elements.
Figure by MIT OCW.

Absorption of a neutron by a nucleus increases the N/P ratio (N = neutron, P = proton).
Since stable isotopes are characterized by restricted N/P ratios, typically unity at low N+P and
increasing to >1 as N+P increases (Fig. 2), the addition of neutrons creates radioactive isotopes
which decay by beta minus decay.
20 40 60 80 100 120 140 160 Number of Neutrons (N)
Figure 2. Z (number of protons = atomic number) vs. N (number of neutrons) in stable nuclides (orange dots). Note that for stable nuclides with Z and N < 20, Z = N, but as Z and N increase the Z/N of stable nuclides decreases.
Figure by MIT OCW.
0
10 20
30
40
50
60
70
80
90
100 110
Num
ber o
f Pro
tons
(Z)
N = Z
3
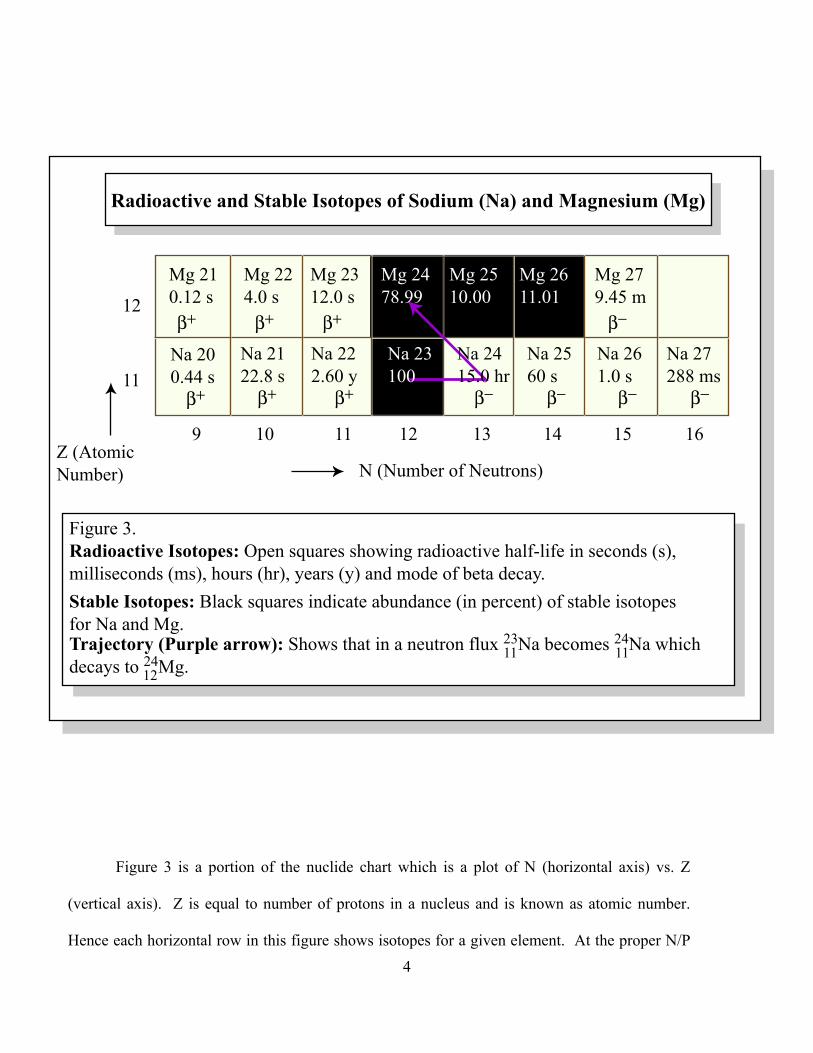
Radioactive and Stable Isotopes of Sodium (Na) and Magnesium (Mg)
12
11
9 10 11 12 13 14 15 16 Z (Atomic
N (Number of Neutrons)Number)
Figure 3.Radioactive Isotopes: Open squares showing radioactive half-life in seconds (s),milliseconds (ms), hours (hr), years (y) and mode of beta decay.Stable Isotopes: Black squares indicate abundance (in percent) of stable isotopes for Na and Mg.Trajectory (Purple arrow): Shows that in a neutron flux 23Na becomes 24Na which decays to 12
24Mg. 11 11
Mg 21 Mg 22 Mg 23 Mg 24 Mg 25 Mg 26 Mg 27 0.12 s 4.0 s 12.0 s 78.99 10.00 11.01 9.45 m �+ �+ �+ �−
Na 20 Na 21 Na 22 Na 23 Na 24 Na 25 Na 26 Na 27 0.44 s
�+ 22.8 s
�+ 2.60 y
�+ 100 15.0 hr
�− 60 s
�− 1.0 s
�− 288 ms
�−
Figure 3 is a portion of the nuclide chart which is a plot of N (horizontal axis) vs. Z
(vertical axis). Z is equal to number of protons in a nucleus and is known as atomic number.
Hence each horizontal row in this figure shows isotopes for a given element. At the proper N/P
4

ratio the isotopes are stable but as N/P increases (or decreases) relative to the optimum ratio the
isotopes are radioactive. Note that odd Z elements typically have only 1 stable isotope; for
example Z=9 (Fluorine) and Z=11 (Sodium).
In order to understand the principles of INAA, look at Figure 3, find 23Na , the only11
23Nastable isotope of NA. Now consider what happens when 11 is in a nuclear reactor? U fission
leads to a source of neutrons (typical neutron flux ~2 x 10 13 N/cm2 sec). Although in theory
multiple neutrons (N) can be absorbed, the probability of N absorption is very small, measured in
units of 10-24cm-2, and most commonly only one N is absorbed. Therefore:
23Na + N → 24 Na + prompt gamma rays 11 11
but 24Na is radioactive via beta minus decay
-24 Na → 2412Mg + β + υ + gamma rays 11
t1/2 (half-life) = 15 hrs
Note that effectively a neutron has been converted into a proton with formation of a beta
particle (β-1) , a neutrino (υ) and gamma rays ( ). Gamma rays, like X-rays, are electromagnetic
radiation (photons) with quantized, i.e., discrete energies which are characteristic of a nucleus.
Hence, they are “detector of specific nuclei”.
5
γ
γ

Excited states after N absorption Excited states of 24Mg, (green dashed lines). their de-excitation leads to gamma
rays (red arrows).
24 Na11
Beta decay
99+%
0.09%0.002%
.003%
5.22
4.23
4.12
1.3685
Ground State24 12 Mg
Mev
(mill
ion
elec
tron
volts
) Mev
Ground State
Figure 4. Nuclear energy level diagram for 24Mg showing the excited states populated during beta decay of 24Na.
12 11
Notes: (1) During de-excitation of 24Mg not all transitions are allowed. Moreover because Beta decay preferentially populates specific excited states, the relative intensity of diffrent gamma rays varies; the highest intensity gamma rays arise from deexcitation of the 4.12 mev state. (2) We use gamma rays arising from de-excitation of 24Mg energy levels to detect 23Na.
(3) Typically, the energy of gamma rays is much larger (mev) than that of X-rays (<100 kev); therefore matrix effects are usually not important for INAA.
Figure by MIT OCW.
Figure 4 shows a simplified energy level diagram for 24Mg which is created by12
radioactive decay of 24Na. You can see that gamma rays are created by transitions between
6
nuclear energy levels of 24Mg and that the number of these gamma rays are proportional to the 12
number of 23Na nuclei in the sample. Note that all transitions between energy levels are not
allowed so the intensity of specific gamma rays differs. In this case the most intense gamma rays
arise from the transitions from 1.3685 mev (million electron volts) level to the ground state and
from the 4.12 level to 1.37 level (i.e. a 2.75 mev gamma ray).
In detail, neutrons created in a nuclear reactor by fission of U have high energy
(described as fast) and are less readily absorbed than lower energy neutrons (described as
thermal); e.g., the neutron capture cross-section (i.e., probability of neutron absorption) for
Cd is highest for thermal neutrons (Figure 5a). Hence within a nuclear reactor the high energy
fission neutrons are reduced in energy before they impact our samples (Figure 5b). Therefore we
are typically doing INAA with thermal neutrons.
7

10-2 10-1 1 10 102
Neutron energy (eV) Figure 5a. Neutron cross-section, i.e. probability of neutron absorption, as function of neutron energy for113Cd.
103
113Cd
Note that cross section is highest for low energy neutrons.
Neu
tron
capt
ure
cros
s-se
ctio
n (1
0-24
cm2 )
104
103
102
10
1
Neutron Energy Spectrum
Neu
tron
Ener
gy (e
V)
1010
108 Fast
106
104
102
1
10-2
Intermediate
Thermal
Neutron Density
Figure 5b. Because cross section is higher for low energy neutrons, the fast (high energy) neutrons created during fission of U in a reactor are thermalized, i.e. lowered in energy, for INAA.
Figures by MIT OCW. 8

Radioactive Decay
If N is the number of radioactive nuclei the decrease in N with time is given by a first order rate
dNlaw = −λN where λ is the decay constant. Integration of this equation yields:
dt
1n N = -λt + C
assume at t = o that N = No, then ln N = -λt + ln No
ln (N/No) = -λt
N = No e-λt
This is the decay equation showing the exponential decrease in N with time.
The definition of half-life t1/2 is given by
N = 0.5 = e−λt1/ 2
N0
ln 0.5 = -λt1/2
or
ln2 0.693 t1/2 = =
λ λ
9

THE FUNDAMENTAL EQUATION FOR NAA
Consider an isotope A; in the nuclear reactor, it absorbs a neutron (N).
(1) A + N → A* + γ (prompt gamma rays) where A* designates radioactive. A*
atoms decay via beta minus decay which converts a N (neutron) to a P (proton)
thereby creating a stable isotope of B, a negative electron, an antineutrino (v) and
gamma rays (γ’s).
(2) A*→B + e-1 + v + γ.
So in the nuclear reactor we form A* and it decays. Hence, A* with time is given by an
equation for accumulation = production in reactor – disappearance by decay.
That is.
(3) dA*
= φσAo − λA* wheredt
φ = neutron flux in neutrons/cm2 sec
σ = cross section, i.e., probably of absorbing neutrons in cm2
λ = decay constant
Ao = original number of A put into reactor
This equation can be integrated to obtain
(4) A* = φσAo (1− e−λtirrad )λ
A* = φσAo (1− e−0.693t irrad /t1/2 )λ
The term within parentheses is called the Saturation Factor “S” because when
(a) tirrad>>t1/2, S = 1
(b) tirrad<<t1/2, e-λt~1-λt, so
(5) A* = φAo σ tirrad
10

Assessing Gamma Ray Intensity
Now we typically do not assess gamma ray intensity until several days after the
irradiation and we “count”, i.e. assess gamma ray intensity, several samples sequentially. Hence
we need to correct to a common time. This is done using
Ao =A*eλt (as derived before from dA* = −λ A* )
dt
dA* We measure A* over a period of time, typically 2 to 5 hours so what we measure is . Since
dt
dA* = λA*
dt
equation 4 becomes:
dA* (0.693tdecay) /t1/2 (6) = φσAo(S)edt
(7) Note that:
ωgm(a) Ao = ( )(NAVO)(Isotopic Abundance).At.ωt
Also we need terms for efficiency of detector (ε) and gamma ray yield (Y).
(b) Our unknown to be determined is the amount by weight of the element being analyzed
in the sample (i.e., ω gm).
In fact flux, cross-section and detector efficiency are not precisely known; therefore
isotopic abundance, proportional to weight of element in grams, is determined by comparing the
activity of the unknown with the activity of a standard whose concentration of the element of
dA* interest is well known (note activity is dt
and not the “activity” commonly used in
thermodynamics). Therefore, we use the equation
(dA* /dt)unknown = (dA* /dt) standard
(wt. element)unknown (wt. element) standard
11

and solve for (wt element)unknown; using such an equation, the terms φ, σ etc. cancel out. This
approach is used for many other analytical techniques, e.g., atomic absorption and inductivity
coupled mass spectrometer (to be discussed).
Because a standard is most reliable when it is similar in composition to the unknown (i.e.,
a study of clay-rich sediment should use a clay-rich standard, etc.), the preparation of standards
of various types with known trace element concentrations is not a trivial task. Typically such
standards are purchased from organizations that specialize in preparation of such materials. Two
sources are:
1) United States Geological Survey for standard rocks, sediments, etc.; see
“Geochemical Reference Materials and Certificates” at USGS Web site.
2) National Institute for Standards and Technology (NIST). They supply Standard
Reference Materials (SRMs) ranging widely in composition, e.g., metals, ores, leaves,
fly ash, silicate glasses and water with known abundances of various trace elements.
12

Obtaining the electronic signal that is a measure of isotopic abundance
We know that gamma rays with discrete energies are created by beta minus decay which
occurs upon creating a radioactive isotope with a high N/P ratio. Now we consider how does an
electronic signal arise when gamma rays interact with matter, i.e. a detector.
Gamma rays can interact with the detector material (typically Ge) in several different ways,as indicated in Figure 6 which shows the possible interactions of an incident gamma rayinteracting with a single atom of Ge (32 electrons). Specifically, they are:
a) Photoelectric effect
b) Compton Scattering
c) Pair production
d) Bremsstralung
Our objective is for all of the gamma ray energy to be deposited in our detector; this is
typically accomplished by the photoelectric effect or multiple Compton scattering events.
13

6a. Photoelectric Effect
� + Ge x-raysIncident
e
6a. The photoelectric effect is the interaction between a gamma ray and an orbital electron with almost complete transfer of energy to the electron occurs.For detection of gamma rays the detector (i.e., the target material) is usually a Germanium (Ge) semi-conductor; therefore Ge X-rays are created subsequent to formation of the Ge photoelectron. A small proportion of the energy of theincident gamma ray is used to overcome the ionization potential of the electron:The remainder appears as kinetic energy in the electron. This interaction is mostlikely to occur with orbital shells close to the nucleus (especially the K-shell).The vacancy left by the ionized electron is filled by an electron falling from thenext higher shell, simultaneously emitting the characteristic K x-rays of germanium.Thus, photoelectric interactions always yield characteristic x-rays of the detectormaterial. Energies of the both ionized electron and x-ray are usually absorbed byfurther ionization of detector atoms.However, there is a possibility that the x-raysmay escape from the detector without further interaction. The total energy thenabsorbed within the detector equals the full energy of the incident gamma photonless the energy of germanium x-ray (12 keV for a Ge K-line). This event is calledan escape peak, and is observed as a subsidiary peak at an energy 12 keV belowthe principal gamma photon line.
Figure by MIT OCW.
14

e
6b. Compton Scattering
γIncident
Scattered γ with lower energy than incident γ
θ
6b.Compton Scattering: Compton scattering results from an inelastic collision between gamma-ray and (most probably) an outer orbital electron, in which only part of the gamma energy is transferred to the electron. The remainder is reirradiated as a lower energy gamma-ray emitted so that both total energy and momentum are preserved. Maximum transfer of energy results from a head-on interaction following which the secondary gamma-ray is emitted at 180o to the first. The secondary gamma photon can itself be absorbed by further Compton or photoelectric interactions. However, there is a probability that this gamma will itself escape from the detector. The detected event then corresponds to the full energy of the incident photon less that of the Compton escape gamma-ray. Compton scattering in the detector is the main cause of the high background continuum below the energies of principal gamma photopeaks recorded on germanium detectors.
Figure by MIT OCW.
15

511 keV
annihilatione e+
( > 1022 keV ) �
�
511 keV �
Incident
6c. Pair Production
6c. Pair Production: Pair production only occurs when incident gamma-rays exceed 1022 keV. There is then a small probability that interaction in the strong electromagnetic field surrounding the nucleus will result in complete transmutation of gamma photon energy into an electron-positron pair. Such particles lose their kinetic energy by further collision with atoms in the detector and then spontaneously annihilate to generate two 511 keV gamma-rays emitted at 180o to one another. If one of these annihilation photons escapes from the detector, an event detected at 511 keV below the parent photopeak (single annihilation escape peak). If both are lost, double annihilation escape peak is detected at 1022 keV below the parent gamma line. If the electron-positron pair escape the detector or if pair production occurs in matter surrounding the detector, annihilation radiation of energy 511 keV will be detected. Pair production is not a significant interaction for incident radiation below 2000 keV.
Figure by MIT OCW.
16
17
Matrix of germanium atoms
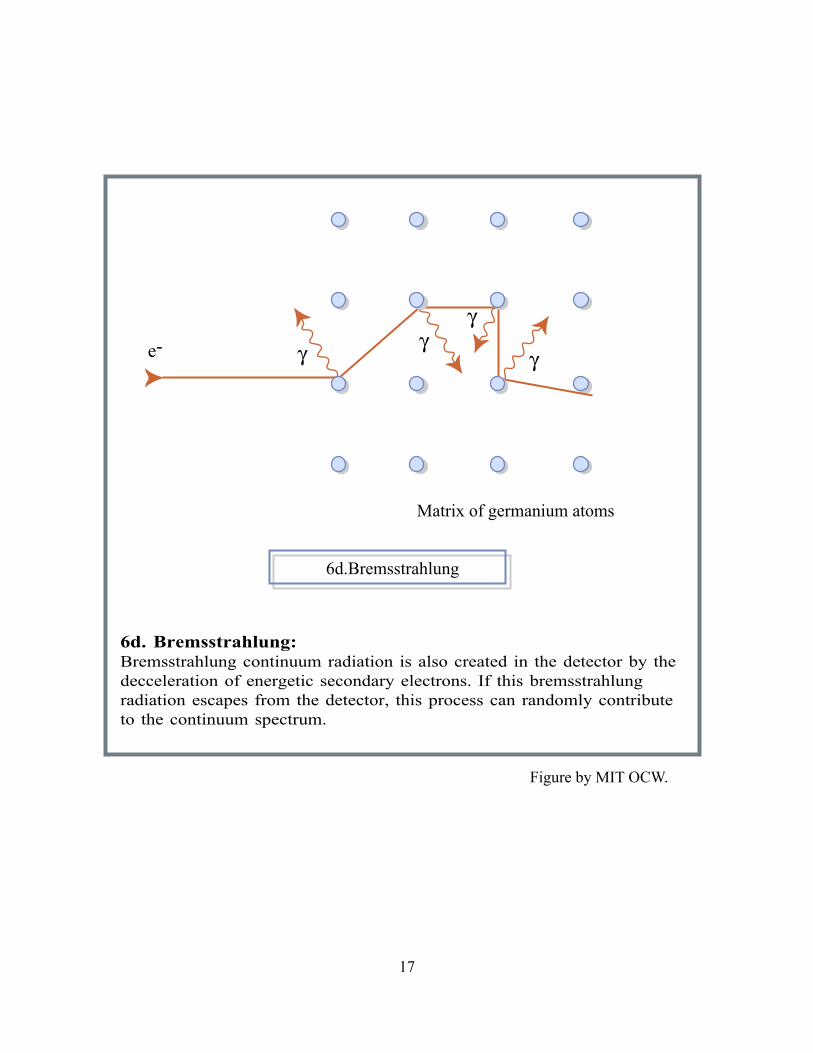
6d.Bremsstrahlung
e- γ γγ
γ
6d. Bremsstrahlung:Bremsstrahlung continuum radiation is also created in the detector by the decceleration of energetic secondary electrons. If this bremsstrahlung radiation escapes from the detector, this process can randomly contribute to the continuum spectrum.
Figure by MIT OCW.
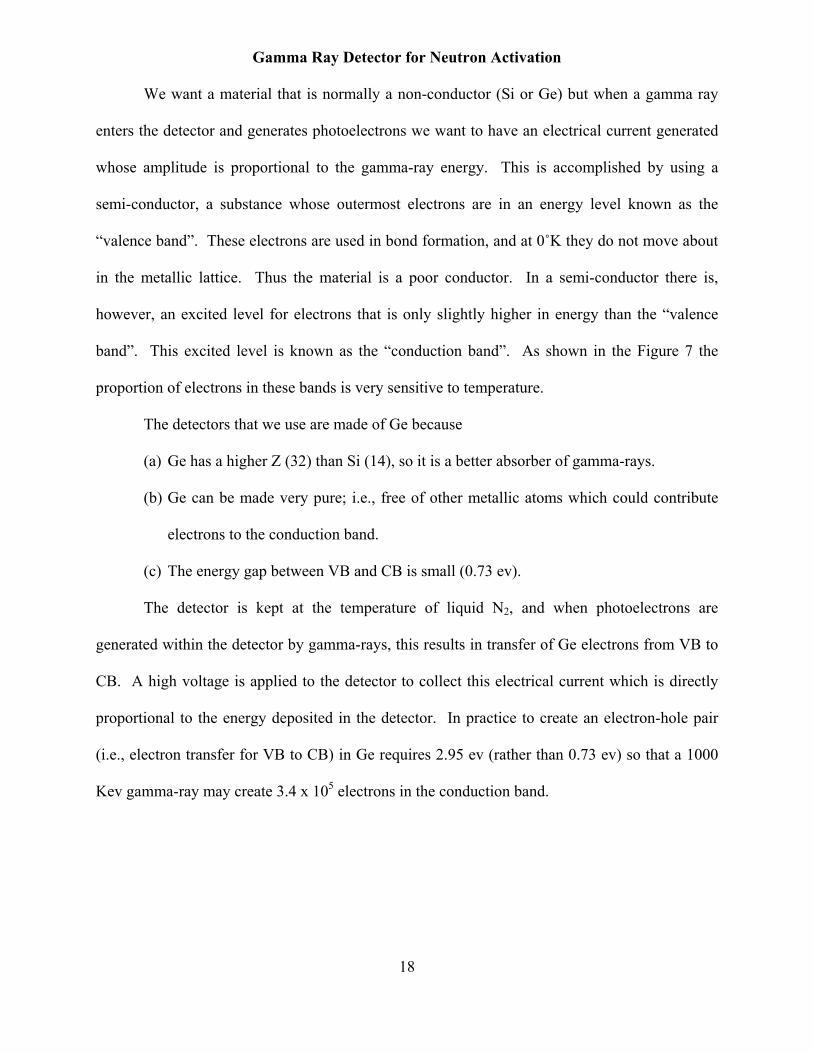
Gamma Ray Detector for Neutron Activation
We want a material that is normally a non-conductor (Si or Ge) but when a gamma ray
enters the detector and generates photoelectrons we want to have an electrical current generated
whose amplitude is proportional to the gamma-ray energy. This is accomplished by using a
semi-conductor, a substance whose outermost electrons are in an energy level known as the
“valence band”. These electrons are used in bond formation, and at 0˚K they do not move about
in the metallic lattice. Thus the material is a poor conductor. In a semi-conductor there is,
however, an excited level for electrons that is only slightly higher in energy than the “valence
band”. This excited level is known as the “conduction band”. As shown in the Figure 7 the
proportion of electrons in these bands is very sensitive to temperature.
The detectors that we use are made of Ge because
(a) Ge has a higher Z (32) than Si (14), so it is a better absorber of gamma-rays.
(b) Ge can be made very pure; i.e., free of other metallic atoms which could contribute
electrons to the conduction band.
(c) The energy gap between VB and CB is small (0.73 ev).
The detector is kept at the temperature of liquid N2, and when photoelectrons are
generated within the detector by gamma-rays, this results in transfer of Ge electrons from VB to
CB. A high voltage is applied to the detector to collect this electrical current which is directly
proportional to the energy deposited in the detector. In practice to create an electron-hole pair
(i.e., electron transfer for VB to CB) in Ge requires 2.95 ev (rather than 0.73 ev) so that a 1000
Kev gamma-ray may create 3.4 x 10⁵ electrons in the conduction band.
18

- - - - - - - - -
A B C
Germanium Semi-Conductor Detector
Conduction band
Forbidden energy 0.73 eV band
Valence band
Figure 7. KEY:- Shading indicates valence band fully occupied by electrons. Arrows indicates transfer of electrons from valence to conduction band.
Schematic behavior of a semiconductor crystal:
A: Perfect (intrinsic) semi-conductor at 0oK. The valence band is fully occupied by electrons, and the conduction band is empty, in this state the semiconductor cannot conduct.
B: Semiconductor at room temperature. There is significant thermal excitation of electrons from valence (+symbol) to conduction band (- symbol); in this state the semiconductor will conduct.
C: Semiconductor cooled to temperature of liquid N2 (77oK). Relatively few electrons (-) are excited from valence band (+) to conduction band (-). Consequently, the Ge detector serves as a conductor, and an electrical current is generated, only when gamma rays emitted by the radioa ctive sample interact with the detector and create Ge photoelectrons which populate the conduction band. The number of electrons in the conduction band is proportional to the energy of the gamma ray.
Figure by MIT OCW.
19
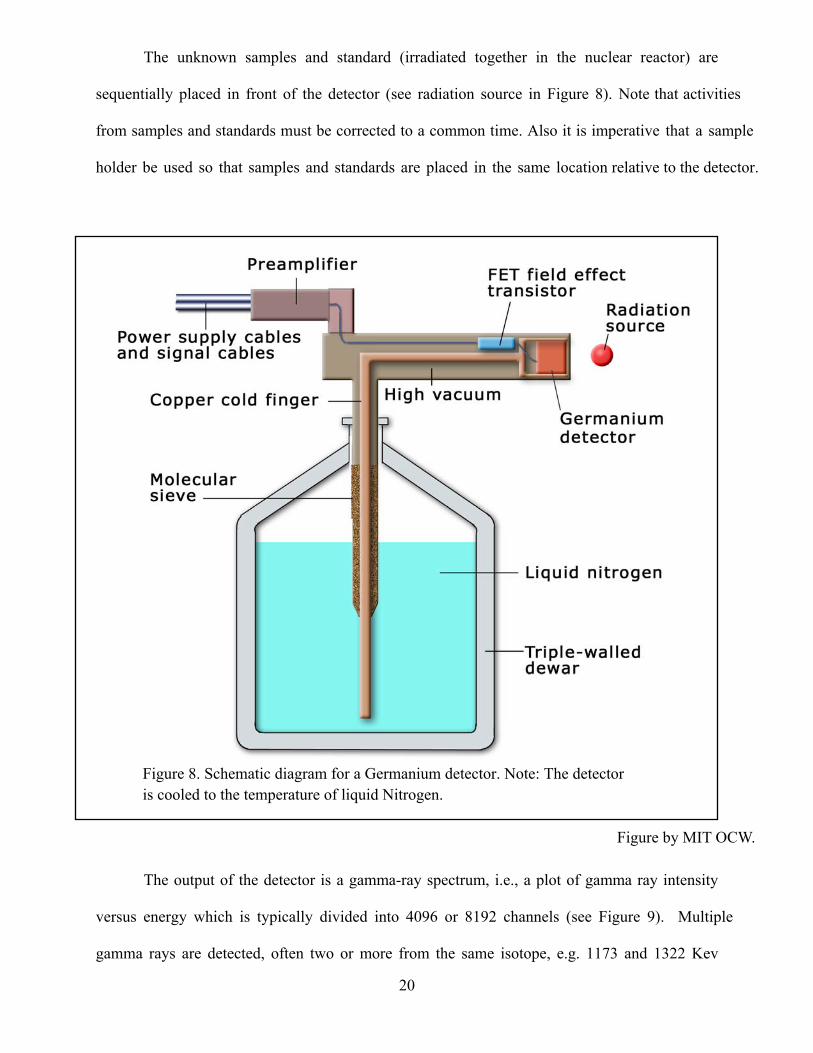
The unknown samples and standard (irradiated together in the nuclear reactor) are
sequentially placed in front of the detector (see radiation source in Figure 8). Note that activities
from samples and standards must be corrected to a common time. Also it is imperative that a sample
holder be used so that samples and standards are placed in the same location relative to the detector.
Figure 8. Schematic diagram for a Germanium detector. Note: The detector is cooled to the temperature of liquid Nitrogen.
Figure by MIT OCW.
The output of the detector is a gamma-ray spectrum, i.e., a plot of gamma ray intensity
versus energy which is typically divided into 4096 or 8192 channels (see Figure 9). Multiple
gamma rays are detected, often two or more from the same isotope, e.g. 1173 and 1322 Kev
20

peaks of 60Co. The area beneath these peaks is integrated, typically using computer code, for
both samples and standard, and this area is proportional to isotope abundance.
Important aspects of typical gamma-ray spectrums from natural materials (e.g. cayenne
pepper in Fig. 9) are:
(1) Many peaks are crowded together at low energy but there are isolated peaks at higher
energy (>500 Kev). Hence energy resolution of detectors is an important
characteristic; resolution is a measure of the ability to distinguish between peaks that
are similar in energy. Generally large, more efficient Ge detectors have lower energy
21

resolution than small, less efficient detectors. Therefore an INAA facility typically
has several Ge detectors varying in efficiency and resolution capabilities (Fig. 10).
(2) A unique feature of gamma ray spectra is that detectors have well-defined energy
resolution capabilities, but there is also the concept of time resolution; that is two
isotopes may have gamma rays with very similar energies but quite different half
lifes. Hence, by delaying the time of counting after irradiation for several days or
even weeks, one can wait for the intensity of the gamma ray from the relatively short
half-life isotope to dissipate. Consequently, INAA facilities typically determine
activities at several times, perhaps 1, 7, 15 and 30 days after irradiation.
22

Summary Comments on Instrumental Neutron Activation
Advantages
1) INAA is sensitive for a variety of trace elements that have proper nuclear characteristics, e.g.,
rare-earth elements, As, Hf, Ta, Co, Cr, Sc. For major oxides, in sediments and rocks the
main use is for determining Na2O abundance.
2) For rocks and sediments no sample dissolution or chemical procedures are required for INAA;
hence there is no blank, i.e., contamination, problems and the process is not labor intensive.
3) Analyze for many elements simultaneously.
4) Precision is variable, 1-5% is typical. Precision and data quality can often be evaluated by
using several different gamma rays for a given element. Also one has the capability of both
time and energy resolution.
5) Accuracy is controlled by use of standard materials; i.e. we compare the intensity of signal
from unknown to that of a sample with known concentrations.
Disadvantages
1) Need access to nuclear reactor and gamma ray detectors.
2) Must work with low level radioactivities.
3) Good for some specific elements, but probably not all that may be of interest.
4) Precision is unlikely to be better than 1%.
Sources of Error
1) Counting statistics – you cannot do better than N±√N with errors propagated for peak and
background areas in unknown and known (N is number of events recorded for a given gamma
ray.)
2) Matrix effects are typically negligible if we use gamma rays with energy >80 kev.
3) Major error source (which can be controlled) is geometry; i.e. one must have a reproducible
location of sample and standard with respect to detector.
23

12.119 INAA Assignment March 21, 2008
1. The weights of empty vial, empty vial + sample powder were taken 6 times. Calculate the standard deviation. Using the formula for the propagation of errors, calculate the error in the weight of the sample powder.
Weights (in grams) of the empty vial, weighed separately for 6 times.
1.14470, 1.14475, 1.14472, 1.14476, 1.14478, 1.14475
Weights (in grams) of the vial + sample powder, weighed separately for 6 times.
1.35041, 1.35040, 1.35029, 1.35018, 1.35026, 1.35035
2. Arsenic is determined in river sediment samples. The abundance of As in the standard is 145 ppm. The gamma-ray energy of 76As is 559 keV. The gamma peak areas of the sample and standard are respectively, 32699, and 1533496 for the same counting times. The delays from the end of irradiation for the sample and the standard counting are 5.953 d, and 4.252 d. The weights of the sample and standard are 0.38476 g and 0.41669 g. Calculate the abundance in the sample. Estimate the propagation of errors. You may use the weighing error from problem 4 above.
3. A standard has been analyzed 10 times. Nd is one of the Rare Earth Elements. Its measured abundance values (in ppm) are 24.0 + 0.7, 23.7 + 0.7, 24.0 + 0.5, 24.3 + 0.9, 23.7 + 1.0, 24.3 + 1.0, 24.0 + 0.7, 23.8 + 0.6, 24.0 + 0.7, 24.7 + 0.9.
1

The reference value of this standard is 24.7 + 0.3. Calculate the precision and accuracy of this measurement. Express the precision and accuracy in percentage. 4. Two elements Molybdenum and Antimony are of interest in a study. What are the radioisotopes that can be used for the thermal neutron activation analysis. Provide all the relevant information of the X + N = Y + gammas reaction, identify the parent and daughter nuclei, the activation cross section,the half-life of the daughter product, and the predominant gamma-ray energy for identification. 5. A filter sample was brought to the reactor for analysis. The gamma spectrum revealed significant gamma-ray peaks of energy
320 KeV, 1368 keV and 2754 keV. Identify the content (elements) of the sample. Suggested Text Book: Table of Nuclides Appendix D, p 606 -650, Gamma-ray sources Appendix E 651-660, Nuclear and Radiochemistry by G. Friedlander, J. Kennedy, E. S. Macias, J. M. Miller QD601.F911 1981
P. Ila MIT-EAPS
2