instrumentation and controls for agricultural and
TRANSCRIPT
AC 2008-1490: INSTRUMENTATION AND CONTROLS FOR AGRICULTURALAND BIOLOGICAL ENGINEERING STUDENTS
George Meyer, University of Nebraska-LincolnGEORGE MEYER, Professor, has taught graduate and undergraduate classes that involve plantand animal growth and environmental factors, modeling, and instrumentation and controls forboth agricultural and biological systems engineering students for 29 years. He has receivednational paper awards and recognition for his work in distance education and has receiveduniversity teaching awards. His current research include measurement and modeling of cropwater stress, fuzzy logic controls for turf irrigation management, and machine vision detection,enumeration, and plant species identification for spot spraying control and precision agriculture.
© American Society for Engineering Education, 2008
Page 13.753.1

Instrumentation and Controls for Agricultural and Biological
Engineering Students
Abstract
Modern biological, biomedical, and agricultural systems use electronic sensors,
instrumentation, and computers for acquisition of scientific data and for process
control. Instrumentation is used for commercial product development, testing, and
for basic research. An engineering course which addresses measurement principles,
sensors, software, and characteristics of instrumentation and control systems with a
variety of hands-on student activities will be discussed. This is a required course for
two ABET accredited biological and agricultural engineering degree programs.
Students of both programs participate and interact within this single course. The
course assumes the student to be a junior, senior, or first year graduate student who
has had an introductory electronics course and has completed a majority of the core
and elective courses. The focus of student hands-on activities is through computer
programming and hardware applications. Examples are presented in a draft book
written by the instructor, who has taught this class for twenty years. Weekly
laboratory activities include electrocardiogram, pulse oximetry, fuzzy logic
temperature and humidity control, human exercise machines and energy exchange,
insect detection and counting with optical sensors, pH controllers, and water flow
measurements from small to large scale. Some activities are web-based bringing
local research projects and instrumentation to the classroom. Student teams also
develop semester projects starting at midterm. Those projects are presented as
papers and posters during an annual department open house. A summary of
selected student projects for the past four years and student assessments will be
discussed.
Keywords: Courseware, biological systems, sensors, electronics, measurements, controls.
Page 13.753.2
Course Concept
Modern agricultural, biological, and biomedical instrumentation all use electronic sensors, analog
and digital circuits, computers and microcontrollers for scientific measurements and process
control. Instrumentation is used for commercial product development, testing, and basic research.
The course described in this paper introduces basic measurement theory, applications of
instrumentation and controls along with features of basic biological, environmental, and
mechanical sensors. Sensors and transducers include contact, non-contact, mechanical, thermal,
optical, ultrasonic, and other devices. A number of instrumentation books are currently available,
either as monographs (Webster, 1999, Nachtigal, 1990, Mitchell, 1983, and others), textbooks
(Daly, 1993, Carr, 1996, and others), or small, but significant paperbacks (Turner and Hill, 1999
and Ramsey 1996). Monographs are best used as library reserve resource materials. Some books
feature a programming language for instrumentation and controls. Examples are Khalid (2000),
Olansen and Rosow (2002), Travis and Kring (2006), and Khoo (1999). Many text books depend
on the student’s background to understand the material presented. A new text book being
completed by the author also provides the student of this discipline an opportunity to understand
and gain practical experience with modern measurement equipment, data acquisition, and digital
control systems. The course assumes that the student is a junior, senior pre-engineer, or a
first–year graduate student.
Thirteen topic areas of the course are presented in Table 1. The student begins with a study during
week 1, the analysis of static and dynamic signals using an oscilloscope. Background is further
enhanced by learning about features and capabilities of signal processing circuitry and digital
acquisition. From that background, the student can select modern data logging equipment
according to specifications which work best for obtaining measurement information for the
problem at hand. Automation of measurements not only includes hardware but software.
LabVIEW® (www.ni.com or National Instruments, Austin, TX) programming is introduced using
Bishop (2006). During the first five weeks, there is a concurrent and intensive introduction to
LabVIEW and a review of fundamental instrumentation electronics. Instructional modules and
examples are also available at various web-sites for demonstrating and simulating electronic
circuits and responses. Many instrumentation textbooks cover analog and digital principles for
instrumentation but in different orders and formats (e.g. Johnson, 2006, Northrop, 1997).
Reinforcement of principles and introduction to practical instrumentation and control examples
are offered through hands-on laboratory exercises, demonstrations, and preparation of a final team
project. Laboratory exercises include experiments with temperature sensing, fluid flow,
stress-strain, displacement, load-cell, ultra sound, and optical sensors. Computer interfacing with
instrumentation is presented and includes the use of serial and parallel circuits, universal serial bus
(USB), analog-to-digital, digital-to-analog, networking, and Bluetooth wireless applications. The
team project begins at mid semester and is selected and approved from either a furnished list or
according to student emphasis interests.
The new book in addition to measurement and sensor fundamentals emphasizes the use of an
instrumentation programming language. Such a language should include both graphical or object
oriented manufacturer interface support and script programming for specialized computations and
control. LabVIEW as an example has a powerful parallel-like, data flow software system. The
latest version can be facilitated by new multi core processors for better performance. LabVIEW
Page 13.753.3

also provides script programming which has distinctive customizing advantages. Mathscript® as
a subset of MATLAB® script (The Mathworks, Natick, MA) is primarily a top-down
computational language, with a number of special functions for processing large data sets and
arrays. (Our students learn MATLAB as freshman.) Mathscript is especially useful for adaptive
modeling, where real time data drives a model. Examples include plant water use measurements
using a first law energy balance or preprocessing data and inputs to a proportional-integral
-differential or a fuzzy logic controller. Psychrometric calculations for a sensible, latent heat, and
radiation analyses of heat exchange from a moist surface is best handled by Mathscript.
Table 1. Instrumentation and Controls - Schedule of Topics.
Tentative Weekly Schedule of Topics – Fall 2007
Week 1 Measurements for Physical and Biological Systems –
Oscilloscope.
Week 2 Analog signal conditioning.
Week 3 LabVIEW Exercises (Bishop).
Week 4 Digital signal processing (NI, MCC, and LabJACK).
Week 5 LabVIEW Exercises (Bishop).
Week 6 Sound and Ultrasound measurements.
Week 7 Thermal Sensors and Temperature Transducers.
Week 8 Force and Strain Sensors.
Week 9 Velocity and Flow Sensors.
Week 10 Optical Sensors and Machine Vision (NI IMAQ®).
Week 11 Introduction to Fuzzy Controls (NI Controls Add-on).
Week 12 Introduction to Classical Controls.
Week 13 Final Controls: Stepper motors, modutrols, and actuators
(time permitting).
Over the years, it had become apparent that many instrumentation textbooks have been written for
special audiences in various fields of engineering. There has also been a recent proliferation of
instrumentation monographs, many of which are included in the reference list. Monographs and
refereed instrumentation papers are certainly of interest to senior agricultural and biological
engineers, but may not provide the practice exercises needed. If one searches the internet, they will
find numerous commercial sensors and instrumentation sites, and possibly be overwhelmed by the
plethora of technical information. Sufficient background and experience to evaluate and select
such systems is what is really needed.
The course provides the student the opportunity to operate modern electronic measurement
equipment, including an oscilloscope, data acquisition, microcontrollers, and digital control
systems. The course assumes the student has had a basic physics course and has taken most of the
core agricultural and biological systems engineering courses. This course addresses practical
instrumentation and control systems through hands-on laboratory exercises, in-class
Page 13.753.4
demonstrations, and a semester student team project. Student teams present their projects as
posters during the annual Department Open House in December.
Course Objectives
The objectives and expected outcomes of this course are to1:
1. learn the technical language, terms, and definitions for electronic sensors and instrumentation.
Acquire technical skills for selecting and using electronic sensors and modern data-logging
equipment. (knowledge),
2. develop an understanding of the physical mechanisms of basic sensors and how they interact
with the measurand in biological, biomedical, and agricultural applications. (comprehension),
3. enhance the ability to select components, design, assemble, and operate measurement systems
for specific applications (application),
4. learn basic analytical and research skills to aid in selecting and applying instrumentation for
specific applications, first by understanding the process, and then applying the measurement
system (Analysis),
5. provide the student the opportunity to design, develop and present a specific measurement
system relative to his /her area of technical interest and choice (synthesis),
6. provide the opportunity to use and improve oral and written communication skills to describe
the development, evaluation, and performance of an electronic instrumentation system.
Provide the basis for understanding the need for life-long learning of new measurement
systems (evaluation).
Laboratory Exercises
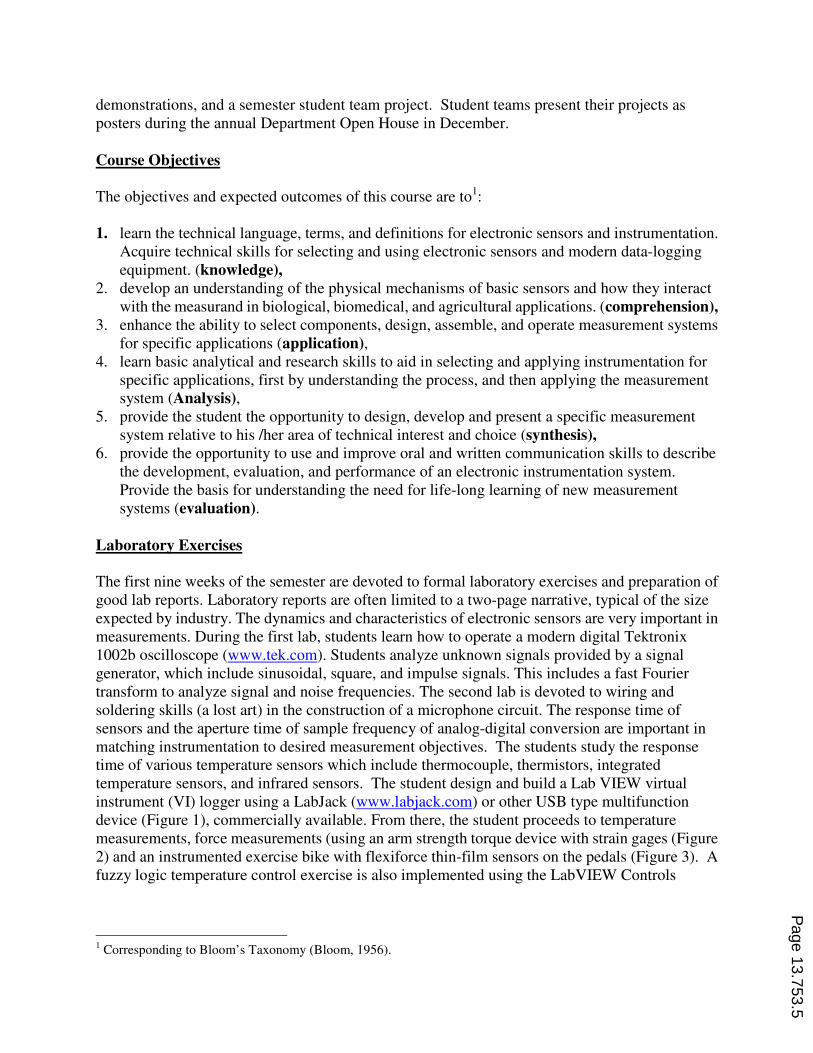
The first nine weeks of the semester are devoted to formal laboratory exercises and preparation of
good lab reports. Laboratory reports are often limited to a two-page narrative, typical of the size
expected by industry. The dynamics and characteristics of electronic sensors are very important in
measurements. During the first lab, students learn how to operate a modern digital Tektronix
1002b oscilloscope (www.tek.com). Students analyze unknown signals provided by a signal
generator, which include sinusoidal, square, and impulse signals. This includes a fast Fourier
transform to analyze signal and noise frequencies. The second lab is devoted to wiring and
soldering skills (a lost art) in the construction of a microphone circuit. The response time of
sensors and the aperture time of sample frequency of analog-digital conversion are important in
matching instrumentation to desired measurement objectives. The students study the response
time of various temperature sensors which include thermocouple, thermistors, integrated
temperature sensors, and infrared sensors. The student design and build a Lab VIEW virtual
instrument (VI) logger using a LabJack (www.labjack.com) or other USB type multifunction
device (Figure 1), commercially available. From there, the student proceeds to temperature
measurements, force measurements (using an arm strength torque device with strain gages (Figure
2) and an instrumented exercise bike with flexiforce thin-film sensors on the pedals (Figure 3). A
fuzzy logic temperature control exercise is also implemented using the LabVIEW Controls
1 Corresponding to Bloom’s Taxonomy (Bloom, 1956).
Page 13.753.5

Add-on as shown in Table 2 (Ross, 2004, Mamdani, 1974, and Zadeh, 1965) 2.
Figure 1. Block diagram for the LabJack data logger virtual instrument (VI).
Figure 2a. Front Panel for the Arm Wrestler
virtual instrument (VI).
Figure 2b. Instrumentation Amplifier (courtesy:
www.labjack.com).
Table 1. Linguistic Antecedents and Consequences for a Temperature Fuzzy Controller. Current Temperature is:
oC
1 Temperature
Change Far Below Near Below Set Point Near Above Far Above
Fast decrease
(F-D)
I-100 or
High heat, Fan2
Off
I-100 or
Medium Heat
Fan Off
I-50 or
Medium Heat
Fan Off
I-50 or
Low Heat
Fan On
N_C or
Heat Off
Fan On
Slow Decrease
(S-D)
I-100 or
High Heat
Fan Off
I-50 or
Low Heat
Fan Off
I-50 or
Low Heat
Fan On
N_C or
Low Heat
Fan Off
R-50 or
Heat Off
Fan On
No Change (NC) I-50 or
Medium Heat
Fan Off
I-50 or
Low Heat
Fan On
N_C or
Heat Off
Fan Off
R-50 or
Heat Off
Fan On
R-50 or
Heat Off
Fan On
Slow Increase
(S-I)
R-50 or
Medium Heat
N_C or
Low Heat
R-50 or
Heat Off
R-50 or
Heat Off
R-100 or
Heat Off
2 Mention of commercial products or trade names are for reference only and not to the exclusion of others that might
be suitable.
Page 13.753.6

Fan Off Fan Off Fan On Fan On Fan On
Fast Increase (F-I) N_C or
Low Heat
Fan Off
R-50 or
Low Heat
Fan On
R-50 or
Heat Off
Fan On
R-100 or
Heat Off
Fan On
R-100 or
Heat Off
Fan On 1 Relative to the set-point.
2 Equipment used.
1. LabJack U12 Logger (www.labjack.com).
2. Type J thermocouple with monolithic thermocouple amplifier and cold junction.
3. Infrared temperature Sensor
4. A handheld independent digital voltage meter.
5. Thermos filled with ice and hot water and a precision alcohol thermometer to measure and check
thermocouple readings.
6. An infrared black-body plate to check infrared sensor readings.
7. Digital-to-Analog (DAC) Control Unit for 110-volt, lamp heater.
8. On-Off Control Unit for the Fan.
Figure 3. Front Panel of a LabVIEW exercise bike virtual instrument (VI).
Student Team Projects
The final six weeks of the class are devoted to student team projects. Team student
instrumentation and controls projects are selected from a prescribed list provided by the instructor.
The students developed the projects as a group and presented them as posters at an annual
Department open house. The open house includes invited other students, alumni, faculty,
administrators and potential employers. Team sizes are either two or three members. The
principles of Michaelsen, et al. (2004 and 2007) are considered in team group planning and
facilitation. The final written term paper was graded according to the instrument shown in
Page 13.753.7

Appendix B. A brief summary description of selected projects for the years 2004 -2007 are given
below. The major pieces of electronic equipment are also given.
1. Ultrasonic Measurement of Water Levels with an Embedded System (2007).
The area of ground water and surface water interactions is an important political issue in
Nebraska. The most well known example is that of the Republican River basin in Southwest
Nebraska where irrigators have been asked to shut down wells due to a perceived impact on
ground water base flow and hence surface water flows in the River as it flows into Kansas. It is
very likely that there are periods during an irrigation season where ground water levels are
adequate to provide base flow to rivers and streams. Basic equations are described in
hydrogeologic literature that can be used to estimate ground water discharge into a river or
stream. In general, these equations consider factors such as aquifer hydraulic conductivity, stream
bed conductance, and the relative water levels between the river and the adjacent ground
water. By applying real time monitoring of the relative water levels between a river or stream and
it’s adjacent ground water, it would be possible to immediately assess if a ground water to surface
water discharging or recharging condition was occurring.
Equipment: Basic Stamp 2® with 32 MHz processor (www.parallax.com), ultrasound range finder
transducer, serial Bluetooth to a laptop computer, LabVIEW 8.2.1 (VISA).
2. Development of an acoustics based instrumentation system for eggshell quality
monitoring (2007).
Eggshell quality is an important factor in egg production. Shells with varying strengths are
preferred for different applications. For example, table eggs require strong shell to prevent
handling damages; where as hatching eggs require thin shell to facilitate gas exchange and the
chick to crack the shell during the hatching process. Another problem with automated egg
production line is detecting eggs with defects such as cracks, blood spots and meat spots. Cracked
eggs are more vulnerable to bacterial infections; where as eggs with blood spot or meat would
potentially degrade their value. The procedure used for eggshell quality assessment, candling, is a
subjective, tedious, time consuming process and it requires skilled personnel. At times, it is very
hard or even impossible to perceive tiny cracks on the shell by human inspectors. Hence, it is
important to detect eggs with unfit shells and remove them from further incubation, and
processing. The objective of this project was to develop an acoustics based (either impulse
response or ultra sound) instrumentation setup for investigating eggshell strength and detecting
eggshell defects.
3. The Energy Balance of Turf Grass System in an Environmental Chamber (2007)
This team project was an investigation and measurement of the energy components for latent
and sensible heat and the radiation balance for flats of irrigated and non-irrigated blue grass turf.
Continuous measurements of temperature, humidity, canopy temperature, and short and long wave
radiation were taken in Chase Hall environmental chamber simulating an early Spring day. The
energy balance was based on the first law of Thermodynamics, but included estimates of stomata
and aerodynamic resistances. A web-based instrumentation demonstration and a webcam were
presented at the open house using a laptop with wireless internet connection.
Page 13.753.8

Equipment: Measurement Computing® USB-5203 (Norton, MA), LabJack U12, temperature and
relative humidity probe, infrared temperature sensors, thermocouples, pyranometers, wet-bulb
psychrometers, thin film load cell lysimeters for flats, web cam, and LabVIEW 8.2.1 and IMAQ®.
4. An Automatic Water Turbidity Sensor (2006).
Water quality measurements using optical sensors for waster water treatment discharged water.
Using the broken pipe VI exercise, the team actuated a check valve to take a sample from a water
line and deposit it into a holding container. Using an optical sensor a reading was taken on total
suspended solids in the sample based upon light scattered transmitted or reflected. The project
required analysis of wavelengths, calibration of sensors and error analysis.
Equipment: LabJACK U12, commercial turbidity kit, photo diodes, solid state relay, water tank,
and LabVIEW 8.
5. Control of an Ethanol Fermentation Process (2006).
A fermentation process in continuous production of ethanol requires monitoring and maintaining
parameters such as temperature, pH, and flow rate. Fermentation by yeast requires optimum
temperature in the range of 37oC, and pH of 5. The temperature can be controlled by switching on
or off a heater system. The pH can be controlled by adding acid or NaOH. These adjustments
have to be done rapidly to improve the efficiency of the fermentation process. Both
proportional-integral-derivative (PID) controller and fuzzy logic controller were compared for
controlling the process variables. Control accuracies and response timings of both controllers
were reported. LabVIEW and the Controls add-on were used for building the controls to monitor
the process.
Equipment: LabJACK U12, two solid-state relays (SSR), thermocouple cold bridge modules, flow
meter, and LabVIEW 8.
6. Design and Implementation of LabVIEW Software in a Functional Home Security System
(2006).
As part of the semester project, the group decided to design a functional home security system
using LabVIEW software. The difference between the proposed security system and the ones
commercially available is that the proposed system can be operated using a home PC and adapted
to any complex infrastructure of a modern home. In addition to ease of adaptation, customization
of the signals will be possible through voice instruction and warnings; the voice could be from the
users instead of a preset audio file playback. Status of the system could be monitored from an
intranet or internet connection. The scope of this project is limited to a two room house with one
window in each room.
Equipment: LabJACK U12, microphone, motion sensor, 2-solid state relays (SSR), notebook
computer, and LabVIEW 8.
Page 13.753.9

7. Optical insect/beetle detection trap (2006)
This team designed and tested a three-sensor optical insect/beetle detection and enumeration
system. An express virtual instrument counter was programmed with an analog voltage logger
and was used to threshold pulse counts using cockroaches passing through the device.
Equipment: LabJACK U12, photo diodes, resistors, 1.5-inch diameter PVC tube, and LabVIEW 8.
8. An Analysis of the Quarter Scale tractor for Strength under Dynamic Loading (2005)
An important aspect of the national quarter-scale tractor design competition was correct sizing of
structural components to meet strength requirements while minimizing material, cost, and weight.
The 2005 quarter scale tractor was designed using the Solid Works® (Concord, MA) design
program, so a theoretical analysis of frame stresses was also accomplished, but needed
experimental verification. Using a, the team strategically placed strain gauges on different parts of
the tractor frame to determine actual stress and strains, during a dynamic loading test. With
this data, more accurate predictions of the strength and integrity of this year’s tractor design were
achieved.
Equipment: Campbell Scientific CR5000 (Logan, UT), strain gage amplifier, and strain gages.
9. Ergonomic Improvements to an On-the-go Weed Scouting System (2005)
A certified commercial crop consultant is currently scouting and mapping weeds and providing
herbicide recommendations to growers. His system uses an all-terrain-vehicle (ATV) and a
hand-held portable-data-acquisition device (PDA) along with a global positioning system (GPS)
to record visually sighted weeds and estimated populations. This team project developed a simple
hand control, switches, and LED species indicators for data entry to improve the efficiency and
accuracy of the weed mapping process. The method for traversing tram lines for visual assessment
of weeds continues to be a successful enterprise by the crop consultant and is featured at:
(http://www.deere.com/en_US/ag/pdf/furrow/2007/summer_07_F0702816.pdf).
Equipment: Motorola 6811 embedded controller with switch and LED interface.
10. Analyzing Heat Loss during Water Induced Hypothermia (2005)
Hypothermia is a drop in the human core temperature associated with heat loss from the body.
Hypothermia is experienced widely during outdoor activities every year. In this project, infrared
measurements of skin and ambient temperatures were taken of a subject under two conditions,
with and without a wet suit in a cold swimming pool. Comparing these two temperature sets, heat
loss rates was computed. This analysis helped to demonstrate the effectiveness of a wet suit and
their benefit to swimmers in cold water. The equations of DuBois and DuBois (1961) were used
for body surface area.
Equipment: Hand-held infrared thermometer, air temperature and humidity meter. Page 13.753.10

11. Determination of Pear Quality Using Machine Vision and an Electronic Nose (2004).
Marketable fruit quality is a subjective set of measurable quality factors, and represents a major
problem for human graders, in determining how these factors should be combined for grading
decisions. This project used an electronic nose and machine vision as a fusion method for
determining fruit ripeness and/or quality. To do the classification, fuzzy inference systems were
trained using the nose to recognize different aromas, based on ripeness and/or quality. Machine
vision was used to analyze color and shape and develop criteria for fruit quality and/or ripeness.
The end goal was to use multi-sensor data acquisition to determine fruit quality/ripeness using the
various input parameters.
Equipment: Cyrano electronic nose (Cyrano Sciences, inc., Pasadena, CA), color digital camera,
MATLAB with Fuzzy Logic, and Image Processing Toolboxes.
12. Mice Detection Using Sounds (2004).
The purpose of this project idea was to detect rodents or rodent activity using sound in food storage
areas. The project will use the sound card of a personal computer as a sensor. Computer programs
were written to first record and then analyze laboratory mice noises and vocalizations. The animal
sounds were analyzed as a particular range of frequencies that are distinguishable when
graphically analyzed. The main difficulty of the project was to determine this range of
frequencies. A final goal of this project was to develop a method to detect not only the presence,
but possibly the exact location of rodents.
Equipment: Camcorder to record mice sounds and computer with an audio card and software.
Student Acceptance
Class size has ranged from 20 to 33 students. Student reaction to this class has been very good.
The overall class score was (3.01+0.15 /4.0). The overall instructor score was (3.46+0.48 /4.0).
Students were quite complimentary about the course and that the instructor did a good job. The
material was considered very relevant. Examinations were fair, but long. Improvements could be
made in the new textbook. Posters at the open house were well-done. Project reports were
well-written.
Bibliography
1. Bishop, R.H., 2006. LabVIEW 8 Student Edition. Prentice Hall, Upper Saddle River, NJ.
2. Bloom , B. S., 1956. Taxonomy of Educational Objectives: The Classification of Educational Goals. Susan
Fauer Company, Inc., pp.201-207.
3. Carr, J.J., 1996. Elements of Electronic Instrumentation and Measurement, Prentice Hall, Englewood Cliffs,
NJ.
4. Dally, J.W., W.F. Riley, and K.G. McConnell, 1993. Instrumentation for Engineering Measurements, Second
Edition. John Wiley and sons, inc., New York.
5. DuBois, D. and E.F. DuBois, 1961. A formula to estimate the approximate surface area if weight and height
are known. Archives of Internal Medicine, 17:863-871.
6. Johnson, C.D., 2006. Process Control Instrumentation Technology (8th
Edition). Pearson, Prentice Hall.
Columbus, OH.
Page 13.753.11

7. Khalid, S.F., 2000. LabWindows/CVI Programming for Beginners. Prentice Hall, Upper Saddle River, NJ.
8. Khoo, M.C.K., 1999. Physiological Control Systems. IEEE Press, NY.
9. Mamdani, E., 1974. Application of fuzzy algorithms for control of a simple dynamic plant Proc. IEEE,
1585-1588.
10. Michaelsen, L.K., D.X. Parmelee, K.K. McMahon, and R.E. Levine. 2007. Team-Based Learning for Health
Professions Education: A Guide to Using Small Groups for Improving Learning, Stylus Publishing, Sterling
VA.
11. Michaelsen, L.K., A.B. Knight, and L.D. Fink. 2004. Team-Based Learning: A Transformative Use of Small
Groups in College Teaching, edited by Stylus Publishing, Sterling VA.
12. Mitchell, B.W., 1983. Instrumentation and Measurement for Environmental Sciences. American Society of
Agricultural Engineers, St. Joseph, MI.
13. Nachtigal, C.W., 1990. Instrumentation and Controls, Fundamentals and Applications. John Wiley and sons,
NY.
14. National Instruments: LabVIEW Fuzzy Logic for G Toolkit Reference Manual. 1997.
15. Northrop, R.B., 1997. Introduction to Instrumentation and Measurements. CRC Press, NY.
16. Olansen, J.B. and E. Rosow, 2002. Virtual Bio-Instrumentation. Biomedical, Clinical, and Healthcare
Applications in LabVIEW. Prentice Hall, NY.
17. Ramsay, D.C., 1996. Principles of Engineering Instrumentation, John Wiley and sons, NY.
18. Ross, T.J., 2004. FUZZY LOGIC with Engineering Applications. John Wiley & Sons, NY.
19. Travis, J. and J. Kring, 2006. LabVIEW for Everyone. Prentice Hall, NY.
20. Turner, J. and M. Hill, 1999. Instrumentation for Engineers and Scientists. Oxford Science Press, NY.
21. Webster, J.G., 1999. The Measurement, Instrumentation, and Sensors Handbook. CRC and IEEE Press.,
Baca Raton, FL.
22. Zadeh, L., 1965. Fuzzy Sets, Inf. Control 8:338-353.
Appendix A
Catalog
Description:
Instrumentation and Controls (3 cr) Lec 2. Lab 2. Prereq: Analysis and design of instrumentation and
controls for agricultural and biological production, management, and processing. Theory of sensors
and transducers, analog and digital electrical control circuits, and the interfacing of computers with
instruments and controls. Emphasis on signal analysis and interpretation for improving system
performance.
Text Books: LABVIEW 8 Student Edition (includes Version 8.2 SW) National Instruments, Inc. by Robert
Bishop, The University of Texas at Austin. ISBN: 0-13-199918-4, Publisher: Prentice Hall,
Copyright: 2007.
Instrumentation and Controls For Agricultural and Biological Engineering Applications
using LabVIEW® as a Software Support System (Draft) by G.E. Meyer.
Format: This course is 3 credits (2 weekly lectures and a two-hour laboratory).
Page 13.753.12

Appendix B. FINAL REPORT - SCORE SHEET – 125 Points
CATEGORIES POSSIBLE
POINTS
POINTS
GIVEN
COMMENTS
SIGNED LETTER OF TRANSMITTAL Report must be signed by all team members,
signifying all have contributed!
REPORT CONTENT AND FORMAT
Summary - Single descriptive paragraph or abstract. 5
Background and Literature Review - Cites useful
literature, previous instrumentation approaches, and
describes purpose and impact of the project.
15
Objectives - Overall objective and 1-2 sub objectives. 5
Procedure/ Methods - Sensors used. Data acquisition
method. Appropriate equations, units, numbered, and
cited. Refers to sample calculations or results in
appendix. Support with pictures, figures and/or tables, as
appropriate.
20
Results and Discussion - Reports details and results of
development efforts, methods, testing, with table and
figure support.
20
Conclusions - Appropriate conclusions that match
objectives. Suggestions for future work.
10
References (Complete citations - ASAE method). 5
Figures and Tables - Appropriate amount of significant
digits, information displayed, correctly justified, labeled,
footnotes, and captions in the correct position.
Landscapes attached correctly to the report. Stands by
themselves.
10
Appendices - Appropriate supporting material. Examples:
computer code used, manufacturer’s specific sheets,
sample calculations, samples of raw data, and cost data
(not required, unless requested).
10
OVERALL REPORT APPEARANCE 0
Neatness and Writing Quality - Proper spacing,
justification, proper grammar, correct spelling, and page
numbers. Drawings and sketches are neat and properly
labeled.
15
Overall Creativity - Shows interest and enthusiasm in
project.
10
FINAL TOTAL SCORE 125
Page 13.753.13