insurance & the challenges of economic uncertainty 4 th annual european insurance industry...
TRANSCRIPT

Insurance & the Challenges of Economic Uncertainty
4th Annual European Insurance Industry Conference
London, U.K.
26 November 2002
Robert P. Hartwig, Ph.D., CPCU, Senior Vice President & Chief EconomistInsurance Information Institute 110 William Street New York, NY 10038Tel: (212) 346-5520 Fax: (212) 732-1916 [email protected] www.iii.org
If you would like a copy of this presentation, please give me your business card with e-mail address
Download at http://www.iii.org

Presentation Outline
Challenges of Economic Uncertainty
• Economic Origins & Geopolitical Instability
• Exogenous (External Influences)
• Endogenous (Internal Influences)
• Conclusions
• Q&A

The Impacts & Implications
• IMPACTS:
• Volatile revenue streams
• Volatile underwriting results
• Volatile investment returns
• Inconsistent financial performance
• IMPLICATIONS:
Low Return on Equity
Unattainable Cost of Capital
Mergers and Acquisitions Difficult

ECONOMIC OVERVIEW
Weak/Weakening Growth
Geopolitical Uncertainty
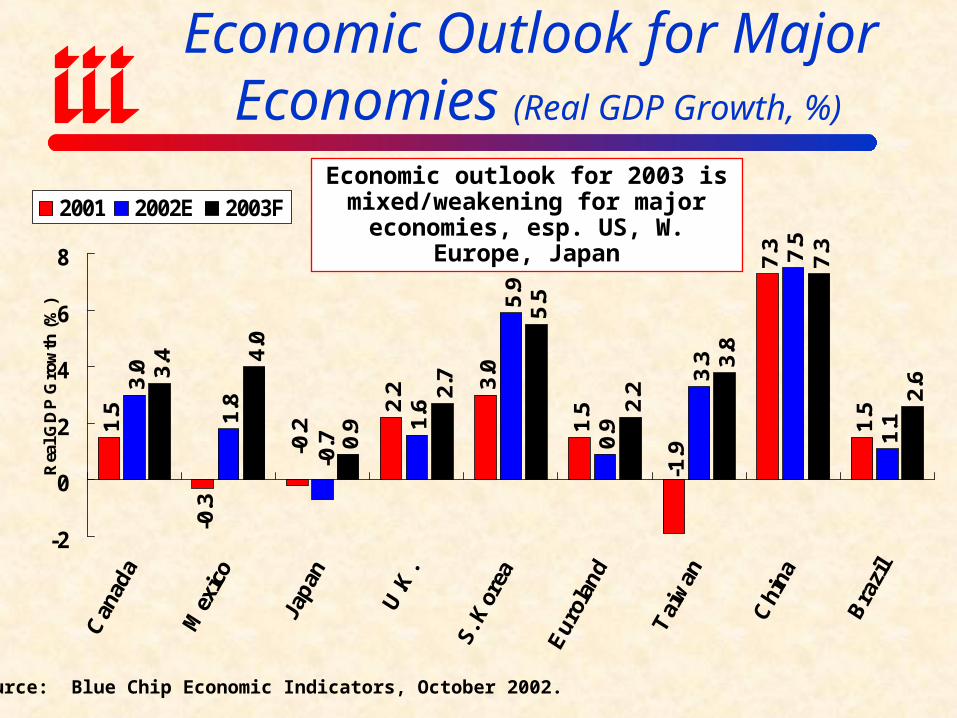
Economic Outlook for Major Economies (Real GDP Growth, %)
1.5
-0.3
2.2 3.
0
1.5
7.3
1.5
3.0
1.8
1.6
5.9
0.9
3.3
7.5
1.1
3.4 4.
0
0.9
2.7
5.5
2.2
3.8
7.3
2.6
-0.2
-1.9-0.7
-2
0
2
4
6
8
Rea
l GD
P G
row
th (
%)
2001 2002E 2003F
Source: Blue Chip Economic Indicators, October 2002.
Economic outlook for 2003 is mixed/weakening for major economies,
esp. US, W. Europe, Japan

4.4%3.5%
2.5%
5.7%
8.3%
4.8%5.6%
2.2%
1.0%
-0.6%
-1.6%
-0.3%
5.0%
1.1%
2.4%3.0%2.7%
-2%
-1%
0%
1%
2%
3%
4%
5%
6%
7%
8%
9%
10%
U.S. Real GDP Growth
Source: US Department of Commerce, Blue Economic Indicators 10/02, Insurance Information Institute.
Economy is experiencing sluggish growth following the
recession of 2001
(first recession since 1990/91)

14.4%
16.2%15.0%
13.0%
10.2%9.0%
11.9%
13.4%14.6%
13.9%
14.1%
14.0%13.7%15.2%
10.4%
10.0%
0%
2%
4%
6%
8%
10%
12%
14%
16%
18%
All US Industries
Return in Equity: Fortune 5001987–2002E
Source: Insurance Information Institute; Fortune
Profitability among the Fortune 500 has fallen during the difficult economic
period of the past 2-3 years.

Impact of Recession on US Non-Life Premiums and Profitability (1970-2001)
7.5%
5.7%
-1.8%
-0.4%
4.3% 4.6% 4.2%4.1%
8.6%
4.6%
6.8%
9.0%9.6%
11.4%
-4%
-2%
0%
2%
4%
6%
8%
10%
12%
14%
Inflation (CPI) NWP Growth(unadj.)
Real NWPGrowth
ROE--P/CInsurers*
ROE--AllIndustries*
ROE--Banks* ROE--DiversifiedFinancial*
Recession Years (1970; 74-75; 80-82; 90-91;2001)
Non-Recession Years (all other years, 1970-2001)
*GAAP return on equity, adjusted for inflation; Bank data 1952-2001; Div. Fin. 1987-2001Source: Insurance Information Institute

Geopolitical Instability Remains High
War on Terrorism
Terrorists & Terrorism
Expansion of War Is Iraq Next?

MANIFESTATIONS OF ECONOMIC UNCERTAINTY ON
GLOBAL INSURANCE INDUSTRY:
Profitability
Underwriting Performance
Ratings/Downgrades
Management Shifts
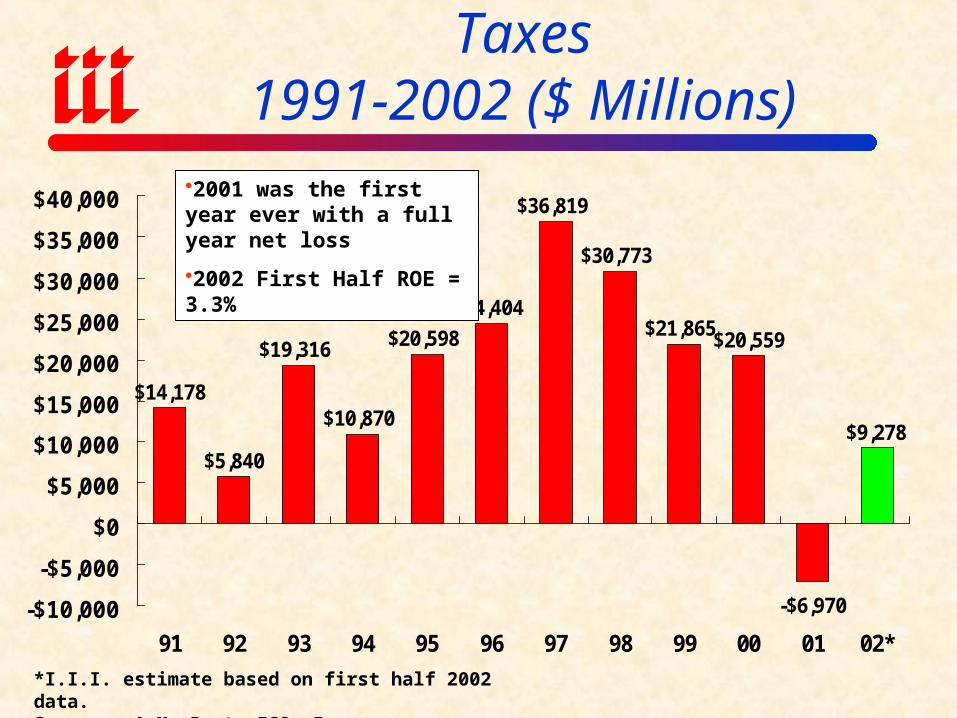
US Non-Life Net Income After Taxes1991-2002 ($ Millions)
$14,178
$5,840
$19,316
$10,870
$20,598
$24,404
$36,819
$30,773
$21,865$20,559
-$6,970
$9,278
-$10,000
-$5,000
$0
$5,000
$10,000
$15,000
$20,000
$25,000
$30,000
$35,000
$40,000
91 92 93 94 95 96 97 98 99 00 01 02*
*I.I.I. estimate based on first half 2002 data.Sources: A.M. Best, ISO, Insurance Information Institute.
2001 was the first year ever with a full year net loss
2002 First Half ROE = 3.3%

-5%
0%
5%
10%
15%
20%
ROE Cost of Capital
ROE vs. Cost of Capital: US Non-Life 1991 – 2002
Source: The Geneva Association, Ins. Information Inst.
There is an enormous gap between the industry’s cost of capital and its rate of return
14.6
pts
7.9.
pts
US P/C insurers have missed their cost of capital by an
average 6.7 points since 1991

Gap Between Required and Actual UW Result Needed to Achieve Target ROE
As a % of Premium
-16
-14
-12
-10
-8
-6
-4
-2
0
U.S. Canada U.K. France Germany
(%)
Note: US, Canada are 2000 data, 1999 for all othersSource: Swiss Re, sigma 5/01.
Most major insurer markets missing target ROEs by wide margins
even before 11 September

0%
5%
10%
15%
20%
25%
30%
19
78
19
79
19
80
19
81
19
82
19
83
19
84
19
85
19
86
19
87
19
88
19
89
19
90
19
91
19
92
19
93
19
94
19
95
19
96
19
97
19
98
UK Switzerland France Germany
Cost of Capital: Non-Life Insurers:1978 – 1998
*
Source: Kielholz, Walter, “The Cost of Capital for Insurance Companies,” The Geneva Papers on Economic Activity, v 25, no. 1, January 2000.

0%
2%
4%
6%
8%
10%
12%
14%
16%
18%
20%
19
75
19
76
19
77
19
78
19
79
19
80
19
81
19
82
19
83
19
84
19
85
19
86
19
87
19
88
19
89
19
90
19
91
19
92
19
93
19
94
19
95
19
96
19
97
19
98
19
99
20
00
Non-Life US Non-Life Canada
Return on EquityUS vs. Canada: 1975 – 2000
*
Source: Insurance Information Institute; Insurance Bureau of Canada.

95
100
105
110
115
120
70 72 74 76 78 80 82 84 86 88 90 92 94 96 98 00
02**
P/C Industry Combined Ratio
2001 = 115.7
2002E = 105.0*
Combined Ratios
1970s: 100.3
1980s: 109.2
1990s: 107.7
2000s: 110.4
*Based on first half 2002 results
Sources: A.M. Best; III

Growth in Premium Volume:Life vs. Non-Life*
2000 vs. 1999
7.610.2
29.4
3.8
20.0
0.6
-5
0
5
10
15
20
25
30
US Canada U.K. Germany France Japan
(% Growth)
Non-Life Life
*Growth rates based on premium volume in local currencies.Source: Swiss Re, sigma 6/01.
Life insurance growth led the way in the 1990s
through 2000. Non-Life growth will lead the way for some time to come.

0%
5%
10%
15%
20%
25%
19
70
19
72
19
74
19
76
19
78
19
80
19
82
19
84
19
86
19
88
19
90
19
92
19
94
19
96
19
98
20
00
20
02
*Estimate based on first half 2002 results.Source: A.M. Best, Insurance Information Institute
Growth in Net Premiums Written (All US Non-Life Lines)
2000: 5.1%
2001: 8.1%
2002: 12.0(est.)
The underwriting cycle went AWOL in the 1990s.
It’s Back!

Ratings Downgrades: Swarms of Downgrades Stinging Insurers
Reasons for Recent Downgrades
of Insurers Worldwide
• Asbestos
• Reserve Deficiencies
• Management Issues (e.g., transitions)
• Reinsurance Uncollectibles
• Investment Write-Downs
• Adverse Development
• Missed/Shifting Earnings Targets

Large Number of Senior Management Changes: Symptomatic of Underlying Difficulties
Senior Management Changes at Many Companies
• American Re AMP Ltd. Annuity & Life Re
• Assicur. Generali AXA Corp Solutions Caliber One
• CA State FundChubb Cigna
• C N A Credit Suisse Employers Re
• General Star Gerling MLP
• Mutual Risk Mgmt OneBeacon Royal & SunAlliance
• Royal America Safeco St. Paul
• Scor Swiss Life Trenwick
• Zurich
Source: Morgan Stanley as of Nov. 8, 2002.

SOURCES OF VOLATILITY & UNCERTAINTY
Exogenous & Endogenous Factors

EXOGENOUS INFLUENCES
Catastrophic LossInvestment Volatility
Crisis in Corporate GovernanceExcessive Litigiousness
Health Care Cost InflationTerrorism
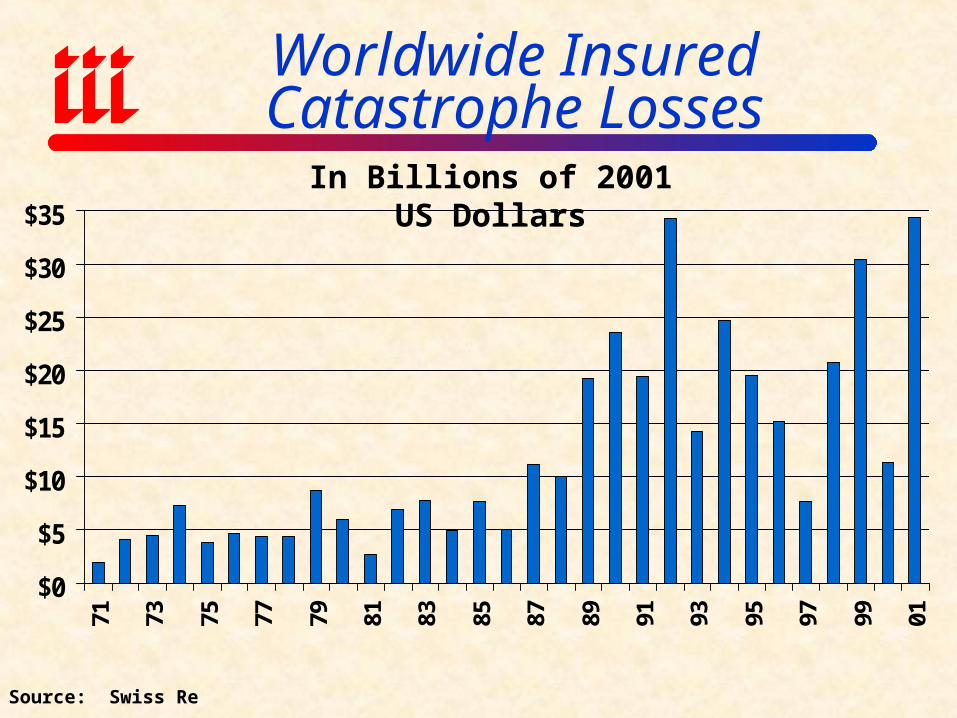
Worldwide InsuredCatastrophe Losses
$0
$5
$10
$15
$20
$25
$30
$35
71 73 75 77 79 81 83 85 87 89 91 93 95 97 99 01
Source: Swiss Re
In Billions of 2001 US Dollars

U.S. InsuredCatastrophe Losses
$7.5
$2.7$4.7
$22.9
$5.5
$16.9
$8.3 $7.3
$2.6
$10.1$8.3
$4.3
$28.1
$4.1
0
5
10
15
20
25
30
89 90 91 92 93 94 95 96 97 98 99 00 01 02*
*Estimate through October 2002.Note: 2001 figure includes $20.3B for 9/11 losses reported through 12/31/01. Includes only business and personal property claims, business interruption and auto claims.Source: Property Claims Service, Insurance Information Institute
$ BillionsCAT Losses for 2001 Set a Record
•20 events (lowest since 1969)•1.5 million claims
•9/11: $20.3B = 51,000 claims

International Stock Markets:YTD Performance (%)
As of 12 November 2002
-40
-30
-20
-10
0
U.S. Canada U.K. France Germany Italy Japan
(% YTD Return)
Source: Dow Jones
The slide in equity markets has been felt more acutely by European and life
companies because of the higher proportion of equities held.

-30%
-20%
-10%
0%
10%
20%
30%
40%
19
70
19
72
19
74
19
76
19
78
19
80
19
82
19
84
19
86
19
88
19
90
19
92
19
94
19
96
19
98
20
00
20
02
*
*As of November 1, 2002.Source: Ibbotson Associates, Insurance Information Institute
US: Total Returns for Large Company Stocks: 1970-2002*
Headed for 3rd consecutive year of decline for stocks
Last happened 1939-1941
Stocks account for just 21% of p/c insurer investments

P/C Industry Investments,by Type (as of Dec. 31, 2001)
Other5%
Bonds66%
Real Est. & Mortgages
1%
Common Stock21%
Cash & ST Secs.6%
Preferred Stock1%
Bond Holdings, by Type
Industrial & Misc. 32.5%
Special Revenue 30.5%
Governments 18.0%
States/Terr/Other 15.4%
Public Utilities 3.1%
Parents/Subs/Affiliates 0.5%
Source: A.M. Best, Insurance Information Institute
Common stock accounts for about 1/5 of invested
assets

$0
$9
$18
$27
$36
$45
75 76 77 78 79 80 81 82 83 84 85 86 87 88 89 90 91 92 93 94 95 96 97 98 99 00 01 02
U.S. Net Investment Income
Facts
1997 Peak = $41.5B
2000= $40.7B
2001 = $37.7B
2002E = $35.8B
Source: A.M. Best, Insurance Information Institute
Bil
lion
s
(US
$)
Investment income in 2002 is expected to fall 5% due primarily to historically low interest rates

0%
2%
4%
6%
8%
10%
12%
14%
16%
3-Month T-Bill 1-Yr. T-Bill 10-Year T-Note
U.S. Interest Rates: Lower Than They’ve Been in Decades
*Average for week ending November 1, 2002.Source: Board of Governors, Federal Reserve System; Insurance Information Institute
1. Historically low interest rates are the primary driver behind lower investment yields. Nevertheless, overall insurer investment performance outpaces all major market indices and almost every major category of mutual fund.
2. 66% of the industry’s invested assets are in bonds

Falling Interest Rates Mean Lower Bond Yields for Years to Come
3-Month Yields
3.06%
4.44%
3.65% 3.65% 3.65%
0.10%0.0%
1.0%
2.0%
3.0%
4.0%
5.0%
Canada Japan U.K. Germany France Euroland
Most Recent 2002Year Ago
Source: Blue Chip Economic Indicators, October 2002.
Interest rates are down globally. More room to fall in Europe than
in US or Japan

Accounting Problems are Getting Many Companies into Trouble
•Enron was tip of an iceberg
•Major implications for insurers (p/c and life)

Corporate Governance: Expensive and Hard-Learned Lessons
• Crisis of Confidence—skepticism is on the rise Ratings agencies Analysts Regulators
Investors/Creditors Employees Lawmakers
• Regulatory/Legislative Fallout Unclear SEC is “rudderless”
Enormous number of investigations under way
SEC, State Attorneys General, IRS, DoJ, etc.
Most new SEC cases are against large companies
Many competing reforms from Congress, SEC, A.G.’s., NYSE, NASDAQ, etc.
Collectively are likely to help, at least somewhat
• SEC, Administration & Congressional proposals vary
• Surge in shareholder suits well underway

Financial Restatements Filed
116
160
215233
270
0
50
100
150
200
250
300
1997 1998* 1999* 2000 2001
*ApproximateSources: Huron Consulting Group
The number of financial restatements is rising
even thought the number of publicly traded
companies is falling.

Serious Implications for Insurers
• Insurers exposed to a wide variety of risks:
Investment risk (as institutional investors)
Insurance risk (surety, D&O, E&O, etc.)
Litigation risk (as both plaintiff & defendant)
Accounting Risk
Regulatory risk

Enron-Related Losses for Insurers
Source: Loss estimates from Morgan Stanley as Feb. 8, 2002; Insurance Information Institute.
Surety26%
Multiple7%
D&O1%
Fin. Guarantee
2%Investment
64%
Total Exposure (Life & Non-Life): $3.796 BillionEnron is the biggest bankruptcy in US history ($31B+)
Equity/debt widely-held as S&P 500 company
Biggest impact in institutional investors/creditors
11 Congressional investigations
56 suits against officers & directors
Will spark similar suits

Average U.S. Jury Awards1994 vs. 2000
419759
187 333
1,140 1,185
1,744
1,168
1,727
269698
3,482 3,566
6,817
$0
$1,000
$2,000
$3,000
$4,000
$5,000
$6,000
$7,000
Overall BusinessNegligence
VehicularLiability*
PremisesLiability
MedicalMalpractice
WrongfulDeath
ProductsLiability
($00
0)
1994 2000
Source: Jury Verdict Research; Insurance Information Institute.

Cost of U.S. Tort System($ Billions)
Source: Tillinghast-Towers Perrin; Insurance Information Institute estimates for 2001/2002 assume tort costs equal to 2% of GDP. 2005 forecasts from Tillinghast.
$129 $130$141 $144 $148
$159 $156 $156$167 $169 $179
$198 $204
$298
$0
$50
$100
$150
$200
$250
$300
$350
90 91 92 93 94 95 96 97 98 99 00 01* 02E* 05F
Tort costs consumed 2.0% of GDP annually on average since 1990, expected to rise to 2.4% of GDP by 2005!
Tort costs equaled $636 per person in 2000!
Expected to rise to $1,000 by 2005

Who Will Pay for the US Asbestos Mess?
Source: Tillinghast-Towers Perrin; Insurance Information Institute
US Insurers30%Asbestos
Defendants39%
Foreign Insurers
31%
Estimated Total US Settlements & Expenses = $200 billion
$78 billion $60 billion
$62 billion

Non-Malignant Asbestos Claimants File Most Claims, Get Most $$$
DISTRIBUTION OF CLAIMS
1991-2000
ALLOCATION OF COMPENSATION
1991-2000Lung & Other
Cancers7%
Non-malignant
90%
Meso-thelioma
3%
Source: RAND, Tillinghast-Towers Perrin
Lung & Other
Cancers18%
Non-malignant
65%
Meso-thelioma
17%

THE CHALLENGE OF TERRORISM

Sept. 11 Industry Loss Estimates($ Billions)
Life$2.7 (7% )
Aviation Liability
$3.5 (9% )
Other Liability$10.0 (25% )
Biz Interruption$11.0 (27% )
Property -WTC 1 & 2$3.5 (9% )
Property - Other
$6.0 (15% )
Aviation Hull$0.5 (1% )
Event Cancellation$1.0 (2% )
Workers Comp$2.0 (5% )
Consensus Insured Losses Estimate: $40.2BSource: Insurance Information Institute

Insured Loss Estimates (updated through September 13, 2002)
0
500
1000
1500
2000
2500
3000
3500
$ M
illi
ons
Source: Morgan Stanley, Insurance Information Institute as of September 13, 2002.
Top 20 Groups (pre-tax, net of reinsurance, $ millions)
NOTES:
*Includes $474 mil for American Re
**Includes $289 mil for Converium
***Insurer is bankrupt

Industry Losses Under Proposed Federal Backstop Using 9/11 Scenario
(as proposed/interpreted as of 10/18/02)
$8.75$12.50
$18.75$1.125
$10.
575
$15.
75
$18.
00
$0
$5
$10
$15
$20
$25
$30
Year 1 Year 2 Year 3
($ B
illi
ons)
Industry Retention Surcharge Layer Co-Reinsurance Layer
Source: Insurance Information Institute.
$1.75B Industry Co-Share
Assumes $30B Commercial Prop & WC Loss, $125B “At Risk” Commercial DPW
$2.0B Industry Co-Share
$0.925B Industry Co-Share
$0.125B Industry Co-Share
Total Ind. Loss: $10.875B $14.25B $19.675B

Top 5 Costliest Terrorist Attacks (by insured property loss*)
*Includes business interruption and aviation hull losses.Source: Swiss Re; Insurance Information Institute.
$20,300
$907 $744 $725 $671$0
$5,000
$10,000
$15,000
$20,000
9/11 TerroristAttacks
Bomb NearNatWestTower inLondon
IRA Car BombNear
ManchesterMall
Bomb in WTCGarage
Bomb inLondon
FinancialDistrict
$ Millions, Adjusted to 2001 Price Level
9/11/01
3,056 Killed
4,000 Injured
4/24/93
1 Killed
54 Injured
6/15/96
0 Killed
228 Injured
2/26/93
6 Killed
725 Injured
4/10/92
3 Killed
91 Injured
Oklahoma City bombing in 1995 cost insurers $145 million, killed 166, 467 injured

489487498
565
635612
666
605
375
437
565
363
431
322
440
296304274
395
426
348
250
300
350
400
450
500
550
600
650
700
81 83 85 87 89 91 93 95 97 99 01
Total International Terrorist Attacks(1981-2001)
The number of terrorist attacks in 2001 actual declined!
Source: US Department of State

11 11
24
84
45
0
121
11
21
42
128
37
13
52
21
49
14
111
31
0
4853
35
122
26
2
85
55
98
31
192
20
0
3033
68
3
194
29
4
17
72
0
25
50
75
100
125
150
175
200
96 97 98 99 00 01
International Terrorist Attacks by Region, 1996-2001
Source: US Department of State

ENDOGENOUS INFLUENCES
CyclicalityCapacity/Capital
Reserve DeficienciesPricing
Mergers & Acquisitions

Length of Underwriting Cycle, Selected Countries*
12.03
12.01
10.19
7.39
7.07
5.79
5.73
5.18
4.84
0 3 6 9 12 15
Netherlands
Malaysia
France
U.S.
Japan
Canada
Spain
Australia
Italy
Cycle Length (Years)
Sources: J. Lamm-Tenant and M. Weiss, “International Insurance Cycles” Rational Expectations/Institutional Intervention, Journal of Risk and Insurance, September 1997; R. Chen, K. Wong and H. Lee, “Underwriting Cycles in Asia,”, ibid, March 1999.
*Study found no cycles evident in Austria, Denmark, S. Korea or Taiwan.

RESTORE & REBUILD
DESTROYEDCAPACITY
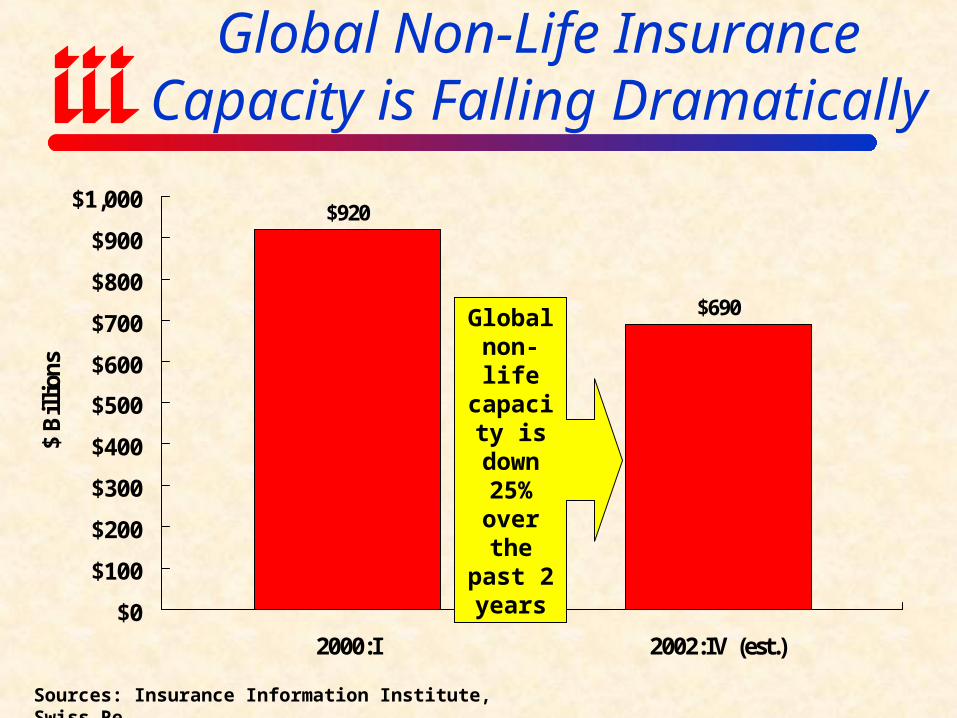
Global Non-Life Insurance Capacity is Falling Dramatically
$920
$690
$0
$100
$200
$300
$400
$500
$600
$700
$800
$900
$1,000
2000:I 2002:IV (est.)
$ B
illi
ons
Sources: Insurance Information Institute, Swiss Re
Global non-life capacity is down
25% over the past 2 years

50%
75%
100%
125%
150%
175%
19
90
19
91
19
92
19
93
19
94
19
95
19
96
19
97
19
98
19
99
20
00
20
01
US Canada Germany France
Capital Funds as a Percentage of Net Premium
*
Source: Swiss Re.
Global capital ratios are shrinking

$0
$50
$100
$150
$200
$250
$300
$350
75 76 77 78 79 80 81 82 83 84 85 86 87 88 89 90 91 92 93 94 95 96 97 98 99 00 01 02
Policyholder Surplus: 1975-2002*
*As of June 30, 2002Source: A.M. Best, Insurance Information Institute
Bil
lion
s
(US
$)
Surplus (capacity) peaked at $336.3 Billion in mid-1999 and has fallen by 15.9% ($53.4 billion) to $282.9 billion since then.
•Surplus fell 2.3% in the 1st half of 2002
•Surplus is now lower than at year-end 1997.
“Surplus” is a measure of underwriting capacity. It is analogous to “Owners Equity” or “Net Worth” in non-insurance organizations

Capital Raising by Non-Life InsurersWorldwide Since Sept.11, 2001*
$20,492
$11,442
$16,437
$4,872
$0
$5,000
$10,000
$15,000
$20,000
$25,000
$30,000
2001 2002*
($ M
illi
on
s)
Completed Pending
$25.4 Billion$27.9 Billion
*As of September 13, 2002.
Source: Morgan Stanley, Insurance Information Institute.
14 Pending 38 Pending
40 Completed 33 Completed
Capital Raising by P/C Insurers Since 9/11 Totals $53.2B

Capital Myth: US P/C Insurers Have $300 Billion to Pay Terrorism Claims
"Target" Commercial*$100 billion
33%
Other Commercial$50 billion
17%
Personal$150 billion
50%
Total PHS = $298.2 B as of 6/30/01
= $282.9 B as of 6/30/02
*”Target” Commercial includes: Comm property, liability and workers comp; Surplus must also back-up on non-terrorist related property/liability and WC claimsSource: Insurance Information Institute
Only 33% of industry surplus backs up “target” lines

U.S. Reserve Deficiency, by Line(AY 1992-2001, as of 12/01)
-$0.8-$1.8
-$4.1
-$6.2
-$9.1
-$3.8
-$0.8
-$17.8 -$18.0
-$1.9
-$20
-$18
-$16
-$14
-$12
-$10
-$8
-$6
-$4
-$2
$0HO PPA Liab CA Liab WC CMP Med Mal*
SpecialLiab
OtherLiab*
XS LiabReins
ProdLiab*
*Occurrence and claims madeSource: Morgan Stanley
Estimated Deficiency
Total Excluding A&E: $64 Billion
A&E Deficiency: $55 Billion
Total Including A&E: $120 Billion

US: Commercial Rate SurveyThird Quarter 2002
Rate Increases By Line of BusinessRate Increases By Line of Business NoNo
Change Up 1-10% 10-20% 20-30% 30-50% 50%-100% >100%Change Up 1-10% 10-20% 20-30% 30-50% 50%-100% >100%
Comm. Auto 6% 18% 37% 24% 12% 0% 0%
Workers Comp 9% 16% 27% 23% 13% 2% 0%
General Liability 8% 13% 38% 28% 9% 1% 0%
Comm. Umbrella 4% 9% 12% 27% 27% 11% 5%
D&O 4% 9% 21% 16% 18% 16% 3%
Comm. Property 8% 9% 30% 23% 21% 5% 0%
Business Interr. 13% 17% 31% 20% 6% 2% 0%
Surety Bonds 16% 13% 17% 20% 2% 0% 1%
Med Mal 5% 3% 5% 6% 17% 11% 19%
Source: Council of Insurance Agents and Brokers

US: Average Price Change of Commercial Insurance Renewals
(Pre-9/11)
9.5%
13.5%
8.8%
10.0%
12.0%
11.0%
8.9%
6.1%
9.5%
8.0%
8.3%
7.9%
9.0%
-1.6%
-1.2%
-0.4%
-7.0%
-6.0%
-11.0%
-6.0%
-10.0%
-7.0%
-3.0%
1.4%
0.8%
3.5%
3.2%
3.2%
2.8%
4.1%
-2.1%
-2.8%
-1.8%
0.2%
-5.0%
-4.4%
-3.5%
-4.3%
-6.6%
-4.1%
-2.0%
-13%
-11%
-9%
-7%
-5%
-3%
-1%
1% 3% 5% 7% 9% 11%
13%
E&S
Umbrella
Workers' Comp
Commercial Property
CMP
General Liability
Commercial Auto
Spring 2001 Fall 2000 Spring 2000 Fall 99 Spring 99 Fall 98
Source: Conning

100110
120130140
150160
170180190
200210220
230240
250260
89 90 91 92 93 94 95 96 97 98 99 00 01 02*
Rate On Line Index(1989=100)
Source: Guy Carpenter * III Estimate
Prices rising, limits falling: ROL up significantly

Insurance Mergers and Acquisitions
7.1 6.9 8.6 5.0 8.5 12.527.0
40.856.2
41.755.7
6.6
41.5
243 246
171 188149
221
349382
433
109
300
295
468
$0
$20
$40
$60
$80
$100
$120
$140
$160
$180
89 90 91 92 93 94 95 96 97 98 99 00 01 02*
Val
ue
of M
& A
s ($
Bill
ion
s)
0
100
200
300
400
500
600
Nu
mb
er o
f M
& A
s
Value of Deals Number of Deals
Source: Compiled from Conning & Company reports.
1998: 565 deals valued at $165.4 B
Number of M&As was down 39.4% during the first half of 2002 vs. first half 2001.
Value of deals was down 80.8%.
None of the top deals were in the P/C sector

Insurance Information Institute On-Line
Download or view this presentation at: http://www.iii.org