integrated annual report 2017tfg-integratedreport2017.co.za/...integrated_annual_report_2017.pdf ·...
TRANSCRIPT

INTEGRATED ANNUAL
REPORT 2017

CONTENTS
INVESTMENT CASE IFCKey performance indicators and salient features 1
ABOUT THIS REPORT 2Scope and boundary of the report 4
Chairman’s report 8
OUR PROFILE 12Our corporate profile 14
Our business model 16
Our timeline 22
Our footprint 24
Our corporate structure 26
Our brands 28
Our people 38
Our stakeholders 40
OUR OPERATING ENVIRONMENT 44Our operating context 46
Our material matters 48
OUR STRATEGY AND PERFORMANCE 52Chief Executive Officer’s report 54
Chief Financial Officer’s report 58
Strategy performance review 64
PERFORMANCE REVIEW 76Retail operations 78
Credit 80
Customer value-added products 82
OUR GOVERNANCE PROFILE 84Supervisory Board of Directors 86
Operating Board of Directors 90
Corporate governance report 92
Audit Committee report 103
Social and Ethics Committee report 109
Nomination Committee report 115
Risk Committee report 116
Remuneration Committee report 119
SUMMARY CONSOLIDATED FINANCIAL STATEMENTS 138Summary consolidated statement of financial position 140
Summary consolidated income statement 141
Summary consolidated statement of comprehensive income 142
Summary consolidated statement of changes in equity 143
Summary consolidated cash flow statement 145
Summary consolidated segmental analysis 146
Selected explanatory notes to the summary consolidated financial statements 147
APPENDICES 152Appendix 1: Definitions 154
Appendix 2: 10-year statistics 156
Appendix 3: Consolidated performance table 160
Appendix 4: Subsidiary companies 162
Appendix 5: Shareholdings of The Foschini Group Limited 163
Appendix 6: Exchange rate and share performance information 165
Appendix 7: BBBEE compliance report 166
NOTICE OF ANNUAL GENERAL MEETING 168Important dates and times 170
Notice of annual general meeting 171
Application to participate electronically in the annual general meeting 181
Form of proxy 183
ADMINISTRATION AND SHAREHOLDERS’ CALENDAR IBC
INVESTMENT CASE
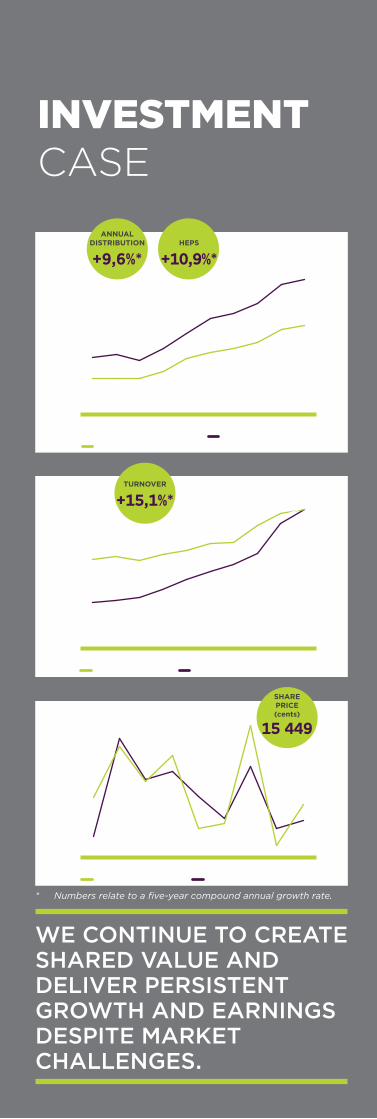
WE CONTINUE TO CREATE SHARED VALUE AND DELIVER PERSISTENT GROWTH AND EARNINGS DESPITE MARKET CHALLENGES.
0
4 000
8 000
12 000
16 000
20 000
2017201620152014201320122011201020092008
0
200
400
600
800
1 000
1 200
Share price at year end (cents)Annual distribution (cents)
HEPS (cents)
Shareprice
(cents)Other(cents)
ANNUAL DISTRIBUTION
+9,6%*HEPS
+10,9%*
0
5 000
10 000
15 000
20 000
25 000
20172016201520142013201220112010200920080
500
1 000
1 500
2 000
2 500
3 000
3 500
Number of employees Turnover (Rm) Number of outlets
Turnover/Employees Outlets
TURNOVER
+15,1%*
-30,0%
-20,0%
-10,0%
0,0%
10,0%
20,0%
30,0%
40,0%
50,0%
60,0%
70,0%
80,0%
201720162015201420132012201120102009
Growth in TFG share price Growth in JSE General Retailers Index
* Numbers relate to a five-year compound annual growth rate.
SHARE PRICE (cents)
15 449

INVESTMENT CASE
ABOUTTHIS REPORT
OUR PROFILE
OUR OPERATINGENVIRONMENT
OUR STRATEGY AND PERFORMANCE
Our mission is to achieve our vision by providing innovative products and creative customer experiences, and by leveraging our portfolio of diverse brands to differentiate our offering. Our talented and engaged people will always be guided by our values, social conscience and customer-centric mindset.
At the core of TFG is its customers: We are committed to successful growth by delivering superior service to our customers to whom we offer unrivalled choice, quality and value throughout our portfolio of leading desirable brands.
Our brand essence is OPPORTUNITY. We create opportunities that allow our employees to grow and succeed in an environment of support, collaboration and respect.
Ultimately, through superior service and product offering to our customers, as provided by our engaged, talented employees, we are committed to deliver consistent shared value to our stakeholders. Shared economic value is delivered, in particular to our shareholders, through continuous growth in total shareholder return. Shared societal value is delivered to all our stakeholders through investment in our sustainability efforts (driven by our sustainability strategy) and our corporate social investment (CSI) projects.
Structured according to our strategic pillars of Customer, Leadership, Profit and Growth, our investment proposition is as follows:
LEADERSHIP• Commitment to our values of PRIDE²: Passionate
about service, Resilience, Integrity, Dignity and Respect, Empowerment and Excellent Performance
• Experienced executive management team (average of 21 years’ service)
• Unique growing multi-brand Group structure creates career opportunities for key talent and ensures optimised succession planning
• Ongoing structured talent development and strong performance management culture
• We believe that the youth is the future leaders and it is our collective responsibility to train and develop them into leaders who will positively impact our future
• Our CSI mission is to “Educate to Empower (E2E)” across educational levels – from early childhood development to post-school education
CUSTOMER• Through our 22 fashion-forward brands trading
out of 3 328 outlets in 34 countries globally, we offer our customers clothing (men, ladies and kids), jewellery, cellphones, accessories, cosmetics, sporting and outdoor apparel, and homeware and furniture
• Ten of our brands are available to our customers online at www.tfg.co.za (TFG Africa), as well as at www.phase-eight.com, www.whistles.com and selected other partner sites (TFG International)
• A successful loyalty programme Rewards & More for TFG Africa customers with over 10,3 million cash and credit customers across Africa
• A customer base spanning various markets from value to upper market (South African LSM 5 – 10 group)
• Cash to credit turnover ratio of 61:39 (TFG Africa: 51:49)
• Credit currently offered to our customers in South Africa as well as in Namibia, Botswana, Lesotho and Swaziland
• Full in-house credit management capability for our TFG Africa customers supported by a 1 500-seat call centre
OUR VISION IS TO BE THE LEADING FASHION LIFESTYLE RETAILER IN AFRICA WHILST GROWING OUR INTERNATIONAL FOOTPRINT.
PROFIT• Market-leading in-house capabilities for store
design and upgrades, fashion design and manufacturing
• Well-developed fabric and pattern optimisation systems
• Our quick response capabilities provide the ability to repeat “winners” in-season and the quick interpretation of in-demand trends and fashion
• The Group has a natural currency hedge through TFG International’s growing contribution
• Protecting our income streams through the diversification of our footprint across numerous economies
• Continuously seeking to optimise cost-efficiencies• Five-year headline earnings per share from
continuing operations’ compound growth rate of 10,9% (excluding acquisition costs)
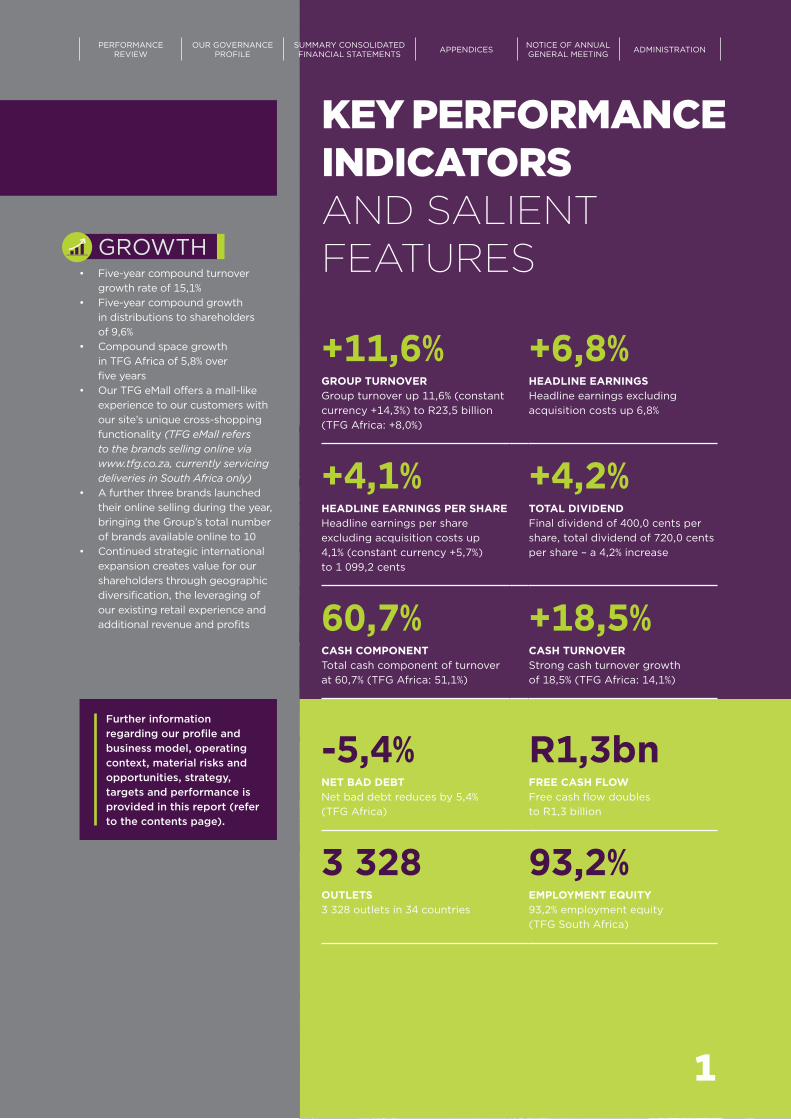
KEY PERFORMANCE INDICATORS AND SALIENT FEATURES
+11,6% +6,8%GROUP TURNOVERGroup turnover up 11,6% (constant currency +14,3%) to R23,5 billion (TFG Africa: +8,0%)
HEADLINE EARNINGSHeadline earnings excluding acquisition costs up 6,8%
+4,1% +4,2%HEADLINE EARNINGS PER SHAREHeadline earnings per share excluding acquisition costs up 4,1% (constant currency +5,7%) to 1 099,2 cents
TOTAL DIVIDENDFinal dividend of 400,0 cents per share, total dividend of 720,0 cents per share – a 4,2% increase
60,7% +18,5%CASH COMPONENT Total cash component of turnover at 60,7% (TFG Africa: 51,1%)
CASH TURNOVERStrong cash turnover growth of 18,5% (TFG Africa: 14,1%)
-5,4% R1,3bnNET BAD DEBTNet bad debt reduces by 5,4% (TFG Africa)
FREE CASH FLOWFree cash flow doubles to R1,3 billion
3 328 93,2%OUTLETS3 328 outlets in 34 countries
EMPLOYMENT EQUITY93,2% employment equity (TFG South Africa)
GROWTH• Five-year compound turnover
growth rate of 15,1%• Five-year compound growth
in distributions to shareholders of 9,6%
• Compound space growth in TFG Africa of 5,8% over five years
• Our TFG eMall offers a mall-like experience to our customers with our site’s unique cross-shopping functionality (TFG eMall refers to the brands selling online via www.tfg.co.za, currently servicing deliveries in South Africa only)
• A further three brands launched their online selling during the year, bringing the Group’s total number of brands available online to 10
• Continued strategic international expansion creates value for our shareholders through geographic diversification, the leveraging of our existing retail experience and additional revenue and profits
Further information regarding our profile and business model, operating context, material risks and opportunities, strategy, targets and performance is provided in this report (refer to the contents page).
PERFORMANCEREVIEW
OUR GOVERNANCEPROFILE
SUMMARY CONSOLIDATED FINANCIAL STATEMENTS APPENDICES NOTICE OF ANNUAL
GENERAL MEETING ADMINISTRATION
1

TFG INTEGRATED ANNUAL REPORT 2017 www.tfglimited.co.za2 TFG INTEGRATED ANNUAL REPORT 2017 www.tfglimited.co.za2
INVESTMENT CASE
ABOUTTHIS REPORT
OUR PROFILE
OUR OPERATINGENVIRONMENT
OUR STRATEGY AND PERFORMANCE
Scope and boundary of the report 4
Chairman’s report 8

33
PERFORMANCEREVIEW
OUR GOVERNANCEPROFILE
SUMMARY CONSOLIDATED FINANCIAL STATEMENTS APPENDICES NOTICE OF ANNUAL
GENERAL MEETING ADMINISTRATION
ABOUT THIS REPORT

TFG INTEGRATED ANNUAL REPORT 2017 www.tfglimited.co.za4
INVESTMENT CASE
ABOUTTHIS REPORT
OUR PROFILE
OUR OPERATINGENVIRONMENT
OUR STRATEGY AND PERFORMANCE
ELEMENT AND PURPOSE TARGET AUDIENCE WEBSITE LINK
Annual financial statements 2017 Shareholders, investor community and analysts
www.tfglimited.co.za/investor-relations/financial_results
Detailed King III compliance checklist setting out TFG’s application of the governance principles and giving explanations of where these are not fully applied
Relevant stakeholders www.tfglimited.co.za/investor-relations/integrated reporting centre
The Foschini Group Limited Remuneration Committee charter
Shareholders, investor community and analysts
www.tfglimited.co.za/investor-relations/integrated reporting centre
Sustainability overview report detailing our sustainability strategy, focus areas and non-financial data
Relevant stakeholders www.tfglimited.co.za/sustainability/sustainability overview
SCOPE ANDBOUNDARY OF THE REPORTABOUT THIS REPORTWe are pleased to present our shareholders with the 2017 integrated annual report for The Foschini Group Limited and its subsidiaries (collectively referred to as “TFG” or “the Group”).
The report covers the financial year from 1 April 2016 to 31 March 2017 and includes our footprint across TFG Africa (Botswana, Ghana, Kenya, Lesotho, Namibia, South Africa, Swaziland and Zambia) and TFG International (United Kingdom, Ireland and 24 other international countries) under the various TFG retail brands. All data applies to the Group, unless specifically indicated otherwise.
The report aligns with the following requirements:
• The King Code of Governance for South Africa 2009 (King III) – the assessment of the King IV principles is in progress and the required disclosures will be included in our integrated annual report for financial year ending March 2018
• The Companies Act of South Africa, No. 71 of 2008, as amended
• The International Integrated Reporting Council’s <IR> Framework (referred to as “the Framework”)
In accordance with the stated objectives of integrated reporting, our report focuses on those matters that have a material impact on TFG’s ability to create and sustain value, and outlines how these matters have been integrated into and considered against our business strategy, risks and opportunities, while considering stakeholder perspectives. Matters were identified using the Framework’s process guidance and apply to both TFG Africa and TFG International, albeit with different levels of likelihood and impact. Read more about our process and relevant matters on page 48.
Although we have further refined the report’s structure for 2017, all data which collectively provides a consolidated review of the Group’s financial, social, economic and environmental performance, remains comparable and consistent other than indicated below.
KEY MATTERS FOR 2017The following key matters should be taken into account while reading the report and making assessments of our performance and prospects as they may affect the comparability of financial and non-financial information:
• The acquisition of Whistles in March 2016 impacts the comparability of our Group results as follows:– Whistles’ trading for the full 2017 financial year
is included in the Group’s 2017 results.– No profit or loss relating to Whistles was included
in the 2016 results as the acquisition was effective 23 March 2016, the end of our financial year.
– Their at-acquisition statement of financial position was consolidated as at 31 March 2016.
• On 3 February 2017, the Group acquired 100% of the inventory and the brand of Damsel in a Dress Limited, which continues to trade as Damsel in a Dress. Two months’ trading have been included in our 2017 results.
Read more about the impact and scope of these events in the Chief Financial Officer’s report on page 58.
OUR REPORTING SUITEGuided by the Framework, this report aims to be a concise communication, with content developed according to the principle of materiality as indicated above. The investor centre on our website www.tfglimited.co.za provides additional information, aimed at a wider stakeholder community, and consists of the following:

5
PERFORMANCEREVIEW
OUR GOVERNANCEPROFILE
SUMMARY CONSOLIDATED FINANCIAL STATEMENTS APPENDICES NOTICE OF ANNUAL
GENERAL MEETING ADMINISTRATION
Feedback on and requests for printed copies of the integrated annual report can be addressed to the Company Secretary whose contact details are on the inside back cover of this report.
Should you elect to receive regular investor-related electronic communication from TFG, kindly provide your email address by emailing our Investor Relations department at [email protected].
NAVIGATIONAL ICONSThe following icons are used throughout the report to improve ease of reference, highlight connectivity and direct readers to additional information:
AFRICA Information specific to TFG Africa, which refers to our activities on the African continent (Botswana, Ghana, Kenya, Lesotho, Namibia, South Africa, Swaziland and Zambia)
INTERNATIONAL Information specific to TFG International, which refers to our activities outside the African continent (United Kingdom, Ireland and 24 other international countries)
A material matter to TFG as identified for the purpose of our 2017 integrated annual report
Page reference
Website reference (www.tfglimited.co.za unless otherwise specified)
TFG’s strategic pillars:
Customer
Leadership
Profit
Growth
DISCLAIMER
This report contains certain forward-looking statements regarding the results and business activities of TFG, which by their nature involve risk and uncertainty because they relate to events and depend on circumstances that may or may not occur in the future.
These forward-looking statements have not been reviewed or reported on by the Group’s external auditors.

TFG INTEGRATED ANNUAL REPORT 2017 www.tfglimited.co.za6
INVESTMENT CASE
ABOUTTHIS REPORT
OUR PROFILE
OUR OPERATINGENVIRONMENT
OUR STRATEGY AND PERFORMANCE
SCOPE AND BOUNDARY OF THE REPORT CONTINUED
INDEPENDENT ASSURANCEIn respect of the 2017 financial year, we obtained external assurance of the following aspects of our integrated annual report:
ELEMENTS ASSURED OUTPUT FROM ASSURANCE STATUS ASSURANCE PROVIDER
FinancialAnnual financial statements External audit report Audited KPMG Inc.EmpowermentBBBEE credentials BBBEE scorecard verified at level 7 Assured Empowerdex
The Group has not commissioned additional external assurance of the non-financial information provided in this report other than what is indicated above.
GOVERNANCEThe Group adheres to the principles of good governance such as ensuring the reliability and completeness of the information contained in the integrated annual report. The integrated annual report is reviewed extensively by TFG’s senior management and executives prior to approval by the Supervisory Board.
APPROVALThe Audit Committee recommended the approval of the integrated annual report and the annual financial statements to the Supervisory Board. The Supervisory Board reviewed and assessed the content of the integrated annual report and believes that it presents the material matters that impact the Group and that it is a fair representation of TFG’s integrated performance.
The Supervisory Board approved the 2017 integrated annual report on 29 June 2017.
M Lewis A D Murray Chairman CEO

7
PERFORMANCEREVIEW
OUR GOVERNANCEPROFILE
SUMMARY CONSOLIDATED FINANCIAL STATEMENTS APPENDICES NOTICE OF ANNUAL
GENERAL MEETING ADMINISTRATION

TFG INTEGRATED ANNUAL REPORT 2017 www.tfglimited.co.za8
INVESTMENT CASE
ABOUTTHIS REPORT
OUR PROFILE
OUR OPERATINGENVIRONMENT
OUR STRATEGY AND PERFORMANCE
During the 2017 financial year, our Group has continued to grow and expand through the following key initiatives:
• The further roll-out of our online offering through the launch of Foschini cosmetics, Markham and Fabiani
• The opening of an additional 331 outlets while closing 128 less profitable outlets
• The continued integration of Whistles into TFG International
• The acquisition of Damsel in a Dress (February 2017)• The post-year-end acquisition of 14 G-Star Raw
franchise stores in Australia• The post-year-end acquisition of 100% of the share
capital of the Retail Apparel Group Pty Ltd (RAG), a leading speciality menswear retailer in Australia and New Zealand
Against this backdrop, I am pleased to introduce our 2017 integrated annual report.
INTEGRATED REPORTINGThe integrated annual report provides a holistic view of our Group, its activities and the broader societal matters that impact our business. Through the report, we strive to communicate all the factors that materially affect our ability to create value for all our stakeholders over time. As we seek to constantly improve the integrated reporting, we continued to make further refinements to this year’s report.
We believe we provide sufficient context in the report to enable our stakeholders to understand the key socio-economic, governance and environmental trends that may affect the Group and to appreciate, from a balanced perspective, the impact of our operations on the resources and relationships we rely on in order to create value for our stakeholders.
In reading the report, I would like to draw your attention to the fact that, while the Group is geographically diversified across 34 countries, the commentary in this report remains primarily focused on the African (and in particular South African) operating environment as this continues to be the most significant geographic region for the Group. Furthermore, certain Group products and services such as credit and customer value-added products are not available internationally. Various key performance indicators such as broad-based black economic empowerment (BBBEE) targets and sustainability initiatives like local supply chain development are also unique to our South African operating environment.
ECONOMY AND OPERATING ENVIRONMENTThe challenging conditions in South Africa, and the political and associated volatility internationally referred to in last year’s integrated annual report, continued through the 2017 financial year. In addition, the troubling political developments in South Africa have led to further constrained economic growth and, in these circumstances, our results both domestically and internationally are particularly pleasing.
The ineffective and corrupt leadership that the country is currently experiencing is negatively impacting confidence and growth. This reduces the resources available to government and the private sector to alleviate the three structural ills of poverty, unemployment and inequality that the government claims it wishes to address. The art of leadership in this context is to strike the right balance between fundamental change and the maintenance of confidence. In the interest of all South Africans, it is to be hoped that a new generation and type of leadership can be found that possesses the wisdom, ability and vision to strike this delicate balance and resist the populism that will lead to inevitable economic decline of which there are many examples for all to see.
CHAIRMAN’SREPORT

9
PERFORMANCEREVIEW
OUR GOVERNANCEPROFILE
SUMMARY CONSOLIDATED FINANCIAL STATEMENTS APPENDICES NOTICE OF ANNUAL
GENERAL MEETING ADMINISTRATION
As a member and keen supporter of the CEO initiative, TFG associates itself with the comments on corruption, state institution governance and economic policy made in its statement of 10 June 2017:
“The CEO initiative has always maintained that true, sustainable economic empowerment and transformation will only be achieved through structural reforms that drive inclusive growth. Populist policies that focus on short-term solutions with no regard for the liabilities that we bestow on future generations will only result in the economy slipping further away from providing opportunities that benefit all who live in the country.
If we are to prevent further negative impacts, it is of crucial importance that we continue with our fiscal plan and apply strict discipline in managing the country’s finances. We also need to demonstrate to investors that we are serious about dealing with corruption and improving governance and service delivery at our state-owned institutions, which would enable these organisations to work for the benefit of all who live in South Africa and not place further strain on the fiscus.”
The implementation of the Affordability Regulations in South Africa have had, and will continue to have, a severe impact on our credit turnover but also across the retail industry. TFG considers itself a responsible and professional granter of credit. Many creditworthy consumers are being impacted as they can no longer access credit responsibly. The Group feels so strongly about this that it, together with two other major listed retailers, has initiated legal action against the National Credit Regulator (NCR) and Department of Trade and Industry (dti) in connection with the Affordability Regulations. The matter is due to be heard in the High Court on 7 August 2017.
REVIEW OF THE YEARDespite the backdrop of the tough economic environment referred to above, the Group had a satisfactory result for the year with growth in headline earnings per share excluding acquisition costs of 4,1%. The Supervisory Board is pleased with this performance of the Group during the year.
Good progress was also made on various strategic initiatives during the year. Further international expansion, in pursuit of long-term growth, was made with the Damsel in a Dress, G-Star Raw Australia and RAG acquisitions, while expansion into Africa continued with the opening of our first outlet in Kenya. The Group also continued its e-commerce roll-out with the online launch of Foschini cosmetics, Markham and Fabiani, bringing the total number of brands selling online to 10.
The expansion of our Group has required greater focus on the development of entrepreneurial skills of our executive and senior management to ensure that sufficient leadership capacity is created to continue to grow the business. Further information in this regard can be found in Our people on page 38.
Post year-end, on 31 May 2017, the Group officially opened its newly renovated and expanded clothing factory in Caledon. We are excited about the opportunities it will create for the Group, as well as for the local community and local clothing manufacturing industry. Further information on the Caledon factory is provided on page 72.
MICHAEL LEWIS
NOTWITHSTANDING THE MANY UNCERTAINTIES,
CLEAR STRATEGIES ARE IN PLACE WHICH,
UNDER THE DIRECTION OF SOUND LEADERSHIP,
ENSURE THAT THE GROUP IS WELL POISED
FOR FUTURE SUCCESS.

TFG INTEGRATED ANNUAL REPORT 2017 www.tfglimited.co.za10
INVESTMENT CASE
ABOUTTHIS REPORT
OUR PROFILE
OUR OPERATINGENVIRONMENT
OUR STRATEGY AND PERFORMANCE
CHAIRMAN’S REPORT CONTINUED
GOVERNANCE AND LEADERSHIPTFG remains committed to the highest standards of corporate governance, with accountability and transparency being key guiding principles in all business activities conducted. As is outlined in more detail in the Corporate governance report on page 92, the Group fully supports the governance principles contained in King III, King IV and the Listings Requirements of the JSE. Our detailed compliance with the King III principles is available on our website.
We are in the process of assessing the principles of King IV and will include the required corporate governance disclosures in our integrated annual report for the year ending 31 March 2018.
PROSPECTSThe multiple uncertainties mentioned above will add further caution to our planning of the Group’s future growth and funding requirements. However, the Supervisory Board believes that the strategic initiatives undertaken over the last three years position the Group well to deliver increased shareholder value over the medium to long term. Clear strategies are in place which, under the direction of sound leadership, ensure that the Group is well poised for future success.
APPRECIATIONOn behalf of the Supervisory Board I would like to thank:
• Doug Murray for his outstanding leadership of the Group during the year;
• the senior executive team members for their skilled and professional management;
• all our employees for their excellent performance, commitment and hard work during the year;
• our customers for their continued loyal support; • our shareholders for their support and confidence
in the future of the Group; • our suppliers, advisors and business associates for
their contribution to the growth of the business; and • my fellow directors for their insight, guidance
and valuable input.
Michael Lewis Chairman
29 June 2017
TFG mourns the passing of Eliot Osrin,
a former Chairman and non-executive director
of our Group, on 15 February 2017.
Eliot played an inspiring role in the growth
of TFG for 31 years, 12 of those as Chairman.
After retiring in 2009, his energy, guidance and
support were still felt. He will be greatly missed
and all at TFG extend their condolences to the
Osrin family.
ELIOT OSRIN

PERFORMANCEREVIEW
OUR GOVERNANCEPROFILE
SUMMARY CONSOLIDATED FINANCIAL STATEMENTS APPENDICES NOTICE OF ANNUAL
GENERAL MEETING ADMINISTRATION
11

TFG INTEGRATED ANNUAL REPORT 2017 www.tfglimited.co.za12 TFG INTEGRATED ANNUAL REPORT 2017 www.tfglimited.co.za12
INVESTMENT CASE
ABOUTTHIS REPORT
OUR PROFILE
OUR OPERATINGENVIRONMENT
OUR STRATEGY AND PERFORMANCE
Our corporate profile 14
Our business model 16
Our timeline 22
Our footprint 24
Our corporate structure 26
Our brands 28
Our people 38
Our stakeholders 40

1313
PERFORMANCEREVIEW
OUR GOVERNANCEPROFILE
SUMMARY CONSOLIDATED FINANCIAL STATEMENTS APPENDICES NOTICE OF ANNUAL
GENERAL MEETING ADMINISTRATION
OUR PROFILE

TFG INTEGRATED ANNUAL REPORT 2017 www.tfglimited.co.za14
INVESTMENT CASE
ABOUTTHIS REPORT
OUR PROFILE
OUR OPERATINGENVIRONMENT
OUR STRATEGY AND PERFORMANCE
OUR CORPORATEPROFILETFG is a diverse group with a successful portfolio of 22 leading fashion retail brands across various lifestyle and merchandise categories. We are one of the foremost independent chain-store groups in South Africa, with the company established in 1924 and listed on the Johannesburg Stock Exchange (JSE) in the general retailers sector since 1941.
Our retail brands detailed on pages 31 to 37 offer clothing, jewellery, cellphones, accessories, cosmetics, sporting and outdoor apparel and equipment, and homeware and furniture from value to upper market segments. The majority of our turnover is in the form of cash sales to customers, with the balance being from our own in-house credit offering. Currently, credit is offered to our customers in South Africa as well as in Namibia, Botswana, Lesotho and Swaziland. In addition to retail turnover, revenue is also generated from interest received on customers’ store cards and through various customer
value-added products. For a graphical representation of our 2017 turnover split by cash and credit turnover, as well as by merchandise category, market segment and geography, please refer to the graphs below.
TFG’s footprint comprises 3 328 outlets in 34 countries spanning five continents with more than 23 400 employees. In addition, 10 of our brands offer goods for sale through our e-commerce channels. South Africa and Namibia are TFG Africa’s most significant markets, with the United Kingdom, including Ireland, being the most significant market for TFG International.
Our product offering is sourced both locally and offshore. A key differentiator is our in-house design and manufacturing facility, which coordinates production through our own factories and various independent cut, make and trim (CMT) factories.
KEY FACTS:
31 MARCH 2017
31 MARCH 2016
Market capitalisation (Rm) 33 912,9 30 459,2Market price per share at year end (cents) 15 449 14 144Average market price per share for the year (cents) 14 832 14 452Average daily trade volume for the year (number of shares) 1 451 242 1 148 194Number of beneficial shareholdings 7 935 7 572
CASH VS CREDIT* TURNOVER
CONTRIBUTION
TURNOVER BY MARKET SEGMENT
CONTRIBUTION
MERCHANDISE CATEGORY
CONTRIBUTION TO TURNOVER
TURNOVER BY GEOGRAPHIC*
SEGMENT CONTRIBUTION
CREDIT39,3%
TFG INTERNATIONAL19,7%
CASH60,7%
TFG AFRICA80,3%
MID TO UPPER MARKET26,0%
VALUE MARKET11,9%
UPPER MARKET28,4%
MID MARKET33,7%
JEWELLERY6,3%
HOMEWARE AND FURNITURE6,1%
COSMETICS4,8%
CLOTHING74,6%
CELLPHONES8,2%
* Credit turnover in TFG Africa only.
* Includes online turnover as well as turnover from outlets.

15
PERFORMANCEREVIEW
OUR GOVERNANCEPROFILE
SUMMARY CONSOLIDATED FINANCIAL STATEMENTS APPENDICES NOTICE OF ANNUAL
GENERAL MEETING ADMINISTRATION
• Passionate about service We passionately and truly believe that the customer comes first
• Resilience We have the courage of our convictions and the boldness to
constructively challenge
• Integrity Our word is our honour, we are honest and ethical
• Dignity & respect We treat everyone the way we want to be treated
• Empowerment We embrace diversity and create equal opportunity for all in
a supportive environment
• Excellent performance We are accountable and drive performance in a creative and
innovative way
OUR VISION, MISSION AND VALUES
At TFG, we believe that the success of our vision and mission, as defined in our Investment case on the inside front cover, will be determined by how we treat our customers as well as fellow employees. We have taken those values that we regard as most important and created PRIDE2.
We believe that teamwork, coupled with professionalism in all aspects of retailing, will continue to be the foundation for the future.
PRIDE
OUR STRATEGY AT A GLANCE
Further information on our strategy and our performance against our strategic objectives can be found in our Strategy performance review on page 64, while further information on our sustainability strategy can be found in our Sustainability overview report, which is available on our website.
Our Group strategic objectives, focused on achieving our vision and mission, are centred around four key pillars. These strategic objectives are:
STR
ATE
GIC
PIL
LAR
CUSTOMER LEADERSHIP PROFIT GROWTH
STR
ATE
GIC
OB
JEC
TIV
E
We will deliver superior customer experiences
across our retail brands
We will enhance customer insights through the
intelligent use of data
We are committed to embedding a
performance-based culture that will ensure
that we attract, retain and develop the best talent in
the industry
Our brands will optimise their supply chain
capability, including their suppliers, buying processes and quick
response
We will optimise the flow of goods from source to customer to enhance the
customer experience
We will enhance return on capital employed (ROCE) by optimising profitability and capital management
We will be the leading lifestyle retailer in Africa
whilst growing our international footprint
We will deliver an integrated, secure
omnichannel customer experience across our
various brands
OLDER GIRLS ABBOTT KINNEY S3
KIDS SMALL FRAME 413 x 298mm.indd 2 08/06/2016 12:03
Linked to our business strategy is our shared value sustainability strategy. The focus area of our sustainability strategy is local supply chain development, supported by four enablers, namely:
• employee empowerment;• resource efficiency;• socio-economic development; and• governance, ethics and accountability.

TFG INTEGRATED ANNUAL REPORT 2017 www.tfglimited.co.za16
INVESTMENT CASE
ABOUTTHIS REPORT
OUR PROFILE
OUR OPERATINGENVIRONMENT
OUR STRATEGY AND PERFORMANCE
OURBUSINESS MODELOur business model describes the activities that transform our resources, through a range of business processes, into outputs and outcomes that guide us towards our vision of being the leading fashion lifestyle retailer in Africa whilst growing our international footprint. It is a process that creates value for all stakeholders (read more about this in the section on outcomes) while delivering on our strategic objectives over the short, medium and long term.
TFG creates value for customers by providing them with an unrivalled choice at various price points through our portfolio of leading desirable merchandise and by delivering superior service to our customers, either when they visit one of our 3 328 outlets, or when they purchase from one of our online sites.
TFG’s value creation approach is based on the concept of shared value, which aims to address economic and social issues directly in the countries in which we operate. Shared value innovates across the value chain to increase productivity and create new markets or enabling environments. To qualify as shared value, initiatives must produce measurable results in both financial and social terms.
TFG differentiates itself from other retailers through its unique portfolio of brands, geographic spread andcustomer retention initiatives. This provides us with the ability to respond to our operating environment inways that ensure growth and profitability. Read more about our operating environment and retail trendson page 46.
17
PERFORMANCEREVIEW
OUR GOVERNANCEPROFILE
SUMMARY CONSOLIDATED FINANCIAL STATEMENTS APPENDICES NOTICE OF ANNUAL
GENERAL MEETING ADMINISTRATION
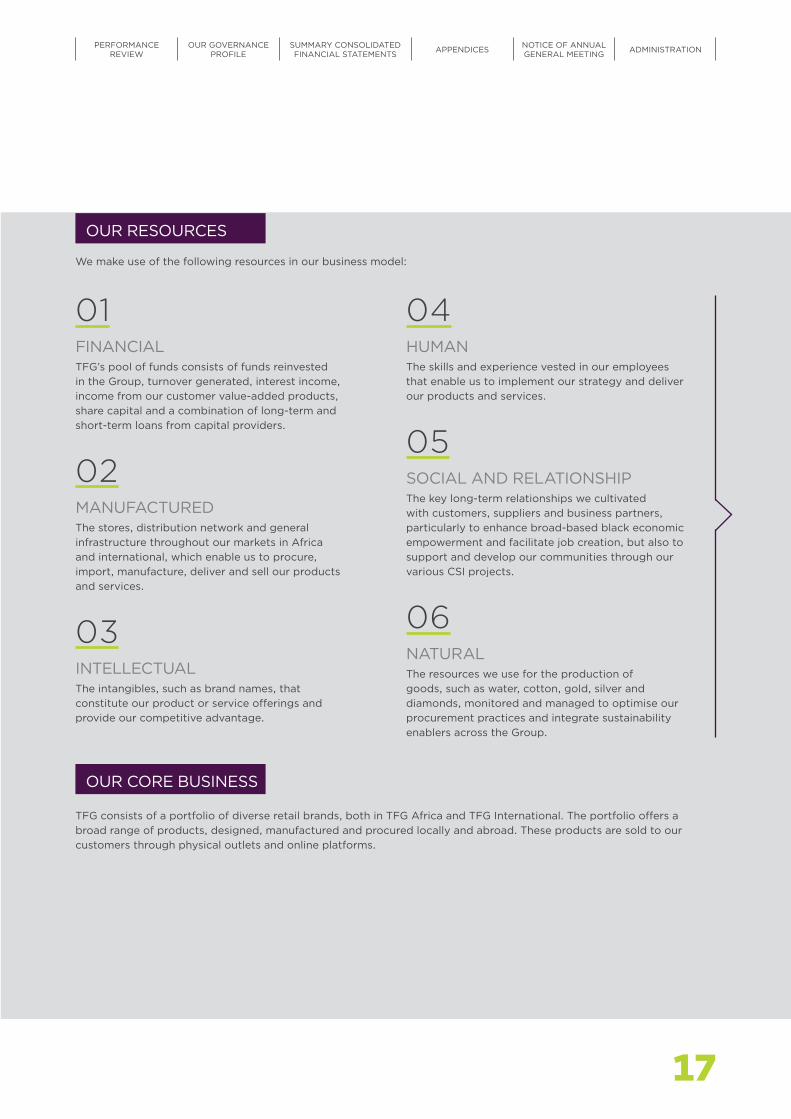
We make use of the following resources in our business model:
OUR RESOURCES
OUR CORE BUSINESS
TFG consists of a portfolio of diverse retail brands, both in TFG Africa and TFG International. The portfolio offers a broad range of products, designed, manufactured and procured locally and abroad. These products are sold to our customers through physical outlets and online platforms.
01FINANCIALTFG’s pool of funds consists of funds reinvested in the Group, turnover generated, interest income, income from our customer value-added products, share capital and a combination of long-term and short-term loans from capital providers.
02MANUFACTUREDThe stores, distribution network and general infrastructure throughout our markets in Africa and international, which enable us to procure, import, manufacture, deliver and sell our products and services.
03INTELLECTUALThe intangibles, such as brand names, that constitute our product or service offerings and provide our competitive advantage.
04HUMANThe skills and experience vested in our employees that enable us to implement our strategy and deliver our products and services.
05SOCIAL AND RELATIONSHIPThe key long-term relationships we cultivated with customers, suppliers and business partners, particularly to enhance broad-based black economic empowerment and facilitate job creation, but also to support and develop our communities through our various CSI projects.
06NATURALThe resources we use for the production of goods, such as water, cotton, gold, silver and diamonds, monitored and managed to optimise our procurement practices and integrate sustainability enablers across the Group.

TFG INTEGRATED ANNUAL REPORT 2017 www.tfglimited.co.za18
DE
SIG
N A
ND MANUFACTUR
ING
Within each of the TFG Africa retail trading divisions, turnover levels are strategically forecasted and stock purchases are planned in accordance with the planned levels of turnover. A portion of the required stock is procured upfront, both from local suppliers and through imports. The remainder of stock is procured through the utilisation of replenishment and quick response models and processes (mainly local procurement), based on actual trading patterns and sales trends. TFG Design and TFG Manufacturing, including our Prestige factories, are strategically aligned to this model and provide the majority of our quick response apparel.
Trading divisions within TFG International procure their own stock based on similar methodology described above, except for replenishment. In place of replenishment, our UK divisions have an open-to-buy policy, which allows for flexibility and freedom within season.
TFG Design supplies approximately 20% of TFG Africa’s local clothing procurement. The manufacturing of clothing designed by TFG Design is split equally between TFG Manufacturing (Prestige) and other local cut, make and trim (CMT) factories whom they have strategic alliances with.
Prestige’s manufacturing is done in two factories, namely Maitland and newly expanded Caledon. In-house manufacturing increases the quick response capability for TFG Africa.
TFG International has a strong emphasis on design with c80% seasonal requirements managed by their own in-house design team. They have an established process for selecting fabrics and picking up on trends to develop into their signature styles. Manufacturing is done by an established long-term supply base.
OUR BUSINESS MODEL CONTINUED
BUSINESS ACTIVITIES
PR
OCUREMENT
RSA
LOGISTICS
TFG Africa’s distribution of goods throughout South Africa and into African markets is managed via eight distribution centres. A mixed model of own and outsourced road transport is applied. Online order dispatch is managed through an outsourced third party from two warehouses.
Warehousing and distribution for TFG International is based on an outsourced model.
2017 statistics related to units distributed via TFG Africa distribution centres:• 10,27 units transported per litre
of fuel used• 1,43% logistics costs as a %
of turnover• 60,1 million units picked by the
distribution centres
AFRICA
» Sustainability overview report – localisation of supply chain (online)
» Chief Financial Officer’s report – managing exchange rates on page 58
» Risk Committee report – weakening economy leading to collapse of key suppliers on page 116
Read more ...» Sustainability overview report –
localisation of the supply chain (online)
» Strategy performance review – Caledon factory on page 72
» Risk Committee report – the loss of head office buildings or distribution centres and dependency on key suppliers on page 116
Read more ...» Sustainability overview report –
resource efficiency (online)» Risk Committee report – the loss of
head office buildings or distribution centres on page 116
Read more ...
INVESTMENT CASE
ABOUTTHIS REPORT
OUR PROFILE
OUR OPERATINGENVIRONMENT
OUR STRATEGY AND PERFORMANCE
• Quick response units represent 43% of total TFG manufactured units (2016: 34%)
• Prestige Clothing’s Maitland and Caledon factories employs 961 employees (2016: 949)
TFG DESIGN 20%
OTHER SUPPLIERS80%
LOCAL CLOTHING
PROCUREMENTAFRICA
SOUTH AFRICA35%
IMPORTS65%
CLOTHING PROCUREMENT
AFRICA
UNITED KINGDOM52%
IMPORTS48%
CLOTHING PROCUREMENT
INTERNATIONAL
0
10 000
20 000
30 000
40 000
50 000
60 000
70 000
80 000
2017*2016201520142013
TOTAL DISTRIBUTION CENTRE m2
58 1
63
58 1
63
58 1
63
58 1
63
70 7
71
* An expanded distribution centre opened in Midrand, Johannesburg in order to be closer to our customers, which improves speed and agility.

19
PERFORMANCEREVIEW
OUR GOVERNANCEPROFILE
SUMMARY CONSOLIDATED FINANCIAL STATEMENTS APPENDICES NOTICE OF ANNUAL
GENERAL MEETING ADMINISTRATION
TFG has developed into a leading fashion lifestyle retailer by leveraging:
• Broad retail experience• Continued expansion of footprint• Strong operational support• Market-leading store design
capabilities
The Group has 2 589 outlets in TFG Africa, which constitute 79,8% of total retail turnover. These outlets are leased on longer-term contracts with an average period of five years. Outlets sell physical products, accept returns and transact with customers through a TFG-developed point-of-sales system. All employees in outlets are employed by TFG either on a full-time or contract/casual basis.
• 18,5% growth in cash turnover• 2,3% growth in credit turnover
The publishing portfolio publishes 15 different lifestyle magazines. TFG Africa customers have the option to subscribe to these magazines via their accounts or by purchasing them from selected retail stores nationwide. The insurance portfolio offers a product range that comprises long and short-term insurance products. The 15 products on offer are available mainly to account holders. Account holders can also purchase airtime and data contracts from One2One (O2O), a division of TFG Africa.
TFG Africa has a customer rewards programme, Rewards & More, providing benefits to its customers. Members of the programme earn vouchers every time they make a purchase at any TFG outlet, which is redeemable on their next purchase. They also benefit from exclusive offers and birthday vouchers. All account holders are automatically registered on the programme while cash customers may choose to register.
• 2,7 million active credit Rewards & More customers (2016: 2,9 million)
• 7,6 million active cash Rewards & More customers (2016: 5,4 million)
• 15 publications available• 15 insurance products available
CUSTOM
ER V
ALUE
-ADDED PRODUCTS AND REWARDS
RETAIL
STRATEGIC RESPONSE: Profit Customer Growth Leadership
Merchandising, such as visual elements and displays, is executed through brand teams, with promotions determined by a team consisting of planners, buyers and marketers. Consumer credit applications are processed in store, online or telephonically with a 2 050-seat call centre, providing customer application and day-to-day service support, as well as value-added product marketing.
The Group has 739 outlets in TFG International, which constitute 14,8% of total retail turnover. These outlets consist of stores and concessions, with stores leased on contract with an average period of nine years. Concessions are arrangements with key department store partners from whom the Group occupies an agreed floor space area (referred to as “mat”) dedicated to our product.
Ten brands trade through online platforms. Online turnover constitutes 5,4% of total retail turnover.
» Performance review: Retail operations on page 78» Risk Committee report – operational risks impacting the retail trading environment
on page 116» Our footprint on page 24» Our brands on page 28
Read more ...» Performance review:
Customer value-added products on page 82
Read more ...
0
50
100
150
200
250
20172016201520142013
TFG International (as from 2016)TFG Africa
165
195209 206
125108
146
New outlet openings
IN STORE VS ONLINE
TURNOVER CONTRIBUTION
ONLINE5,4%
IN STORE94,6% CASH VS CREDIT
TURNOVER CONTRIBUTION
CREDIT39,3%
CASH60,7%
AFRICA

TFG INTEGRATED ANNUAL REPORT 2017 www.tfglimited.co.za20
The outcomes of our business activities include the internal and external consequences for our stakeholders and our resources, acknowledging that these can be positive or negative, and collectively result in the value that we create over time. The value that we have created during the year is detailed below with further information in Our stakeholders on page 40.
BUSINESS MODEL OUTCOMES
TRADE-OFFS
VALUE CREATED PER STAKEHOLDER GROUP
01FOR CUSTOMERS: • Providing a choice of local and international brands that
are desirable, innovative and creative• Giving access to responsible and affordable credit
02FOR MERCHANDISE SUPPLIERS, LANDLORDS, CONCESSION PARTNERS AND KEY SERVICE PROVIDERS: • Creating a profitable and sustainable market• Developing an ethical local supply chain and
optimised logistics• Ensuring a reliable tenant with a long-term
location strategy
03FOR EMPLOYEES:• Investing in employee training and development• Providing a rewarding work environment• Offering market-related compensation• Rewarding performance
OUR BUSINESS MODEL CONTINUED
In our strategic and tactical business decisions, we have to prioritise some resources and some stakeholder outcomes above others. Examples of these decisions include:
We have more than one brand offering in each market segment – each with a different investment requirement. Due to limited financial resource availability, brand support will be directed in favour of the brand that is able to generate the greatest returns for the Group. The trade-off
Outputs of the TFG business model consist of the following:
PRODUCTS AND SERVICES
Our products and services include clothing, homeware and furniture, jewellery, cosmetics and cellphones, sold through 22 brands in 34 countries.
Read more about these in the Our brands section on page 28.
They also include 15 magazines and 15 insurance products offered to our customers in TFG Africa. Read more about these in the Performance review: Customer value-added products on page 82.
BY-PRODUCTS AND WASTE
In all our business activities, we focus on reducing manufacturing waste and implementing lean systems. We maintain high levels of efficiency and waste reduction in TFG Manufacturing operations and actively promote lean principles in our partnerships with our CMT factories.
OUTPUTS
» Read more about our waste management activities in the 2017 Sustainability overview online.
INVESTMENT CASE
ABOUTTHIS REPORT
OUR PROFILE
OUR OPERATINGENVIRONMENT
OUR STRATEGY AND PERFORMANCE
RESOURCE EFFICIENCYOver the last three years, carbon emission intensities reduced per:
EMPLOYEE
5,0%
SQUARE METRE
7,4%EBITDA
12,7%

21
PERFORMANCEREVIEW
OUR GOVERNANCEPROFILE
SUMMARY CONSOLIDATED FINANCIAL STATEMENTS APPENDICES NOTICE OF ANNUAL
GENERAL MEETING ADMINISTRATION
will create value for the brand and customers but might reduce financial resources available for other brands or shareholders in the short term.
When we aim to attract, retain and develop the best talent, there is a trade-off between hiring less experienced employees at a lower employment cost and the impact of their lower experience levels and additional training costs required.
04FOR COMMUNITIES: • Providing small business support• Promoting entrepreneurial opportunities• Providing employment in local communities
05FOR GOVERNMENT AND REGULATORS:• Participating in the development of and supporting
new regulations and legislation• Participating in initiatives to improve competitiveness
of the industry• Contributing to fiscal revenue through our
tax payments
06FOR SHAREHOLDERS:• Delivering long-term returns supported by
good governance

TFG INTEGRATED ANNUAL REPORT 2017 www.tfglimited.co.za22
0
5 000
10 000
15 000
20 000
0
5 000
10 000
15 000
20 000
25 000
Centsper share Rm
OURTIMELINE
INVESTMENT CASE
ABOUTTHIS REPORT
OUR PROFILE
OUR OPERATINGENVIRONMENT
OUR STRATEGY AND PERFORMANCE
ACQUIRED LAUNCHED TURNOVER CLOSING SHARE PRICE
1993 Sterns acquired
1994 DonnaClaire launched
1996 Sportscene
acquired
1999 Pages rebranded as Exact
1999 RCS established
2000 Matrix launched
OUR HISTORY AT A GLANCEGeorge Ivan Rosenthal founded TFG in 1924. He started out in clothing retail in America, but showed interest in other markets when the boom days in America ended. His research showed that, while South Africa was very much an underdeveloped country, it had a traditional fondness for American goods and know-how, and so he set sail for South Africa with little money, a lot of confidence and a grand plan. When naming his company, he decided on an old Italian name, Foschini.
He found that Johannesburg was one of the best shopping areas and started leasing premises. On 27 November 1925, the first Foschini store opened on Pritchard Street, Johannesburg and more stores across South Africa soon followed. For the first time, South African women had access to fashion garments – garments that were affordable, well made, up to date and accessible to a wider public.
Foschini had arrived.
He continued to expand the business and within two years after opening, Foschini had nine branches across South Africa. In 1941, George registered Foschini Dresses (Pty) Ltd on the Johannesburg Stock Exchange, the first clothing retailer to do so.
Since then, the Group has continued to grow. Today, it consists of 22 brands in over 3 300 outlets in 34 countries selling a broad range of merchandise categories to customers both in store and online.
1924 Founded
1941 Listed on the JSE
1958 Stanley Lewis buys major shareholding
1967 American Swiss Watch Company acquired
1968 Markham acquired
1969 Pages launched
BEFORE 1993
JSE historical data only available
from 1996–2017
2000 Totalsports acquired

23
0
5 000
10 000
15 000
20 000
0
5 000
10 000
15 000
20 000
25 000
Centsper share Rm
2005 Luella launched
2005@homelivingspace launched
2004 Duesouth launched
2010 Foschini Limited changed to TFG Limited
2011 Charles & Keith franchise partnership
2011 Fabiani and franchise rights for G-Star Raw acquired
2001 Fashion Express launched
2001@home launched
2012 Prestige Clothing
acquired
2012 hi launched
2013 Matrix
rebranded as Mat & May
2014 Luella incorporated within Foschini stores
2015 Phase Eight
acquired
2015 RCS disposal
2015 Launch of @home
and hi online shopping
2016 Franchise rights for Colette acquired
2016 Fashion Express rebranded as The FIX
2016 Franchise rights for Next acquired
2016 Whistles acquired
2016 SODA Bloc launched
2016 Launch of Totalsports, Sportscene and Duesouth onlineshopping
2017 Damsel
in a Dress acquired
2017 Launch of Foschini
cosmetics, Markham and Fabiani
online shopping
2017 Expansion of Caledon
factory
2017 DonnaClaire
rebranded as Donna
PERFORMANCEREVIEW
OUR GOVERNANCEPROFILE
SUMMARY CONSOLIDATED FINANCIAL STATEMENTS APPENDICES NOTICE OF ANNUAL
GENERAL MEETING ADMINISTRATION

INVESTMENT CASE
ABOUTTHIS REPORT
OUR PROFILE
OUR OPERATINGENVIRONMENT
OUR STRATEGY AND PERFORMANCE
09
13
USA
177 Limpopo
Mpumalanga
KwaZulu-Natal
Eastern Cape
North West
Northern Cape
Free State
Western Cape
Gauteng
OUR FOOTPRINT
TFG TRADES THROUGH 3 328 OUTLETS IN 34 COUNTRIES,WITH A PORTFOLIO OF 22 FASHION LIFESTYLE BRANDS
186
277
746142
160
98
408212
TFG’s number of stores
TFG’s number of concessions
TFG’s footprint
Ghana
Spain
Mexico
TFG INTEGRATED ANNUAL REPORT 2017 www.tfglimited.co.za24

98
05
07
02
47
29
02
04
02
10
01
02
08377
04
14
01
06
01 08
02
152
01
03
09
05 01
16
02
01
20
35
1
12
2 406
12
739TFG INTERNATIONAL OUTLETS
Qatar
Iran
Swaziland
South Africa
Lesotho
Hong Kong
Japan
Malaysia
UAEBahrain
Netherlands
Germany
Macau
Italy
Latvia
Estonia
Norway
UK and Ireland
Sweden
Switzerland
Kuwait
Saudi Arabia
Ghana
NamibiaBotswana
Australia
Singapore
2 589TFG AFRICA OUTLETS
Belgium
Spain
Zambia
Kenya
E-COMMERCE
25
14,8%Contribution to turnover
Contribution to turnover
5,4%
Contribution to turnover
79,8%
PERFORMANCEREVIEW
OUR GOVERNANCEPROFILE
SUMMARY CONSOLIDATED FINANCIAL STATEMENTS APPENDICES NOTICE OF ANNUAL
GENERAL MEETING ADMINISTRATION

TFG INTEGRATED ANNUAL REPORT 2017 www.tfglimited.co.za26
OUR CORPORATE STRUCTURE
INVESTMENT CASE
ABOUTTHIS REPORT
OUR PROFILE
OUR OPERATINGENVIRONMENT
OUR STRATEGY AND PERFORMANCE
SUPERVISORY BOARDTHE FOSCHINI GROUP LIMITED
CHIEF EXECUTIVE OFFICER
OPERATING BOARD
THE RETAIL TRADING BRANDS ARE SUPPORTED BY A NUMBER OF CENTRALISED SERVICE FUNCTIONS
EMPLOYEES FACILITIES
TFG Human Resources TFG Services
ACCOUNTING AND
GOVERNANCE
SUPPLY CHAIN
SYSTEMS
TFG Finance & Advisory*
TFG Internal Audit
Prestige Clothing
TFG Design
TFG Logistics
TFG Merchandise Procurement
TFG Infotec
MARKETING EXPANSION
TFG Marketing
E-commerce
TFG Africa
TFG Property
CREDITCUSTOMER
VALUE-ADDED PRODUCTS
FINANCIAL SERVICES
PROVIDE GROUP-WIDE CREDIT-RELATED PRODUCTS
AND SERVICES TO TFG AFRICA CUSTOMERS
INTERNATIONAL OPERATIONS
LOCAL MANAGEMENT STRUCTURE WITH THEIR OWN, INDEPENDENT,
CENTRALISED SUPPORT FUNCTIONS
CENTRALISED FUNCTIONS
* TFG Finance & Advisory comprises the Group Finance and Reporting, Tax and Treasury, Enterprise Risk, Legal, Compliance, Mergers and Acquisitions as well as Company Secretarial functions.

27
RETAIL TRADING DIVISIONS
@HOME
EXACT
THE FIX
FOSCHINI DIVISION
INTERNATIONAL DIVISION
JEWELLERY DIVISION
MARKHAM DIVISION
SODA BLOC
SPORT DIVISION
TFG MOBILE
E-COMMERCE
PERFORMANCEREVIEW
OUR GOVERNANCEPROFILE
SUMMARY CONSOLIDATED FINANCIAL STATEMENTS APPENDICES NOTICE OF ANNUAL
GENERAL MEETING ADMINISTRATION
TFG INTEGRATED ANNUAL REPORT 2017 www.tfglimited.co.za28
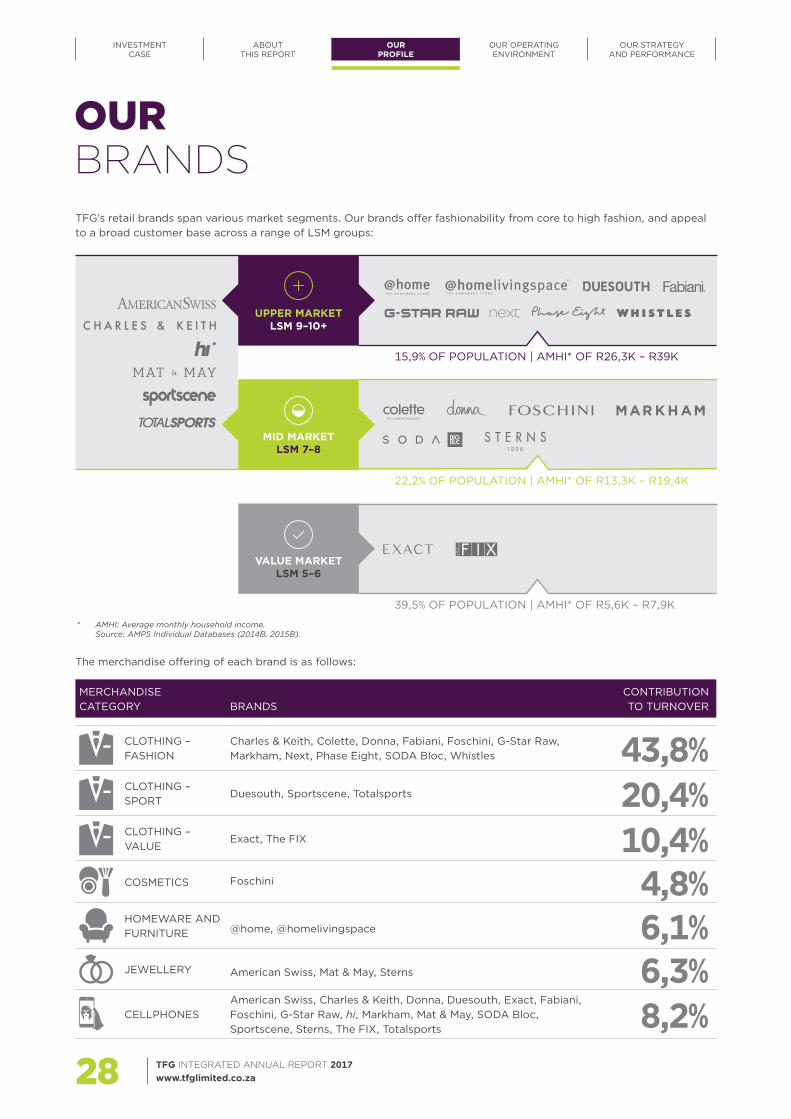
TFG’s retail brands span various market segments. Our brands offer fashionability from core to high fashion, and appeal to a broad customer base across a range of LSM groups:
INVESTMENT CASE
ABOUTTHIS REPORT
OUR PROFILE
OUR OPERATINGENVIRONMENT
OUR STRATEGY AND PERFORMANCE
22,2% OF POPULATION | AMHI* OF R13,3K – R19,4K
UPPER MARKETLSM 9–10+
MID MARKETLSM 7–8
15,9% OF POPULATION | AMHI* OF R26,3K – R39K
VALUE MARKETLSM 5–6
39,5% OF POPULATION | AMHI* OF R5,6K – R7,9K
MERCHANDISE CATEGORY BRANDS
CONTRIBUTION TO TURNOVER
CLOTHING – FASHION
Charles & Keith, Colette, Donna, Fabiani, Foschini, G-Star Raw, Markham, Next, Phase Eight, SODA Bloc, Whistles 43,8%
CLOTHING – SPORT
Duesouth, Sportscene, Totalsports 20,4%CLOTHING – VALUE
Exact, The FIX 10,4%COSMETICS Foschini 4,8%HOMEWARE AND FURNITURE @home, @homelivingspace 6,1%JEWELLERY American Swiss, Mat & May, Sterns 6,3%CELLPHONES
American Swiss, Charles & Keith, Donna, Duesouth, Exact, Fabiani, Foschini, G-Star Raw, hi, Markham, Mat & May, SODA Bloc, Sportscene, Sterns, The FIX, Totalsports 8,2%
The merchandise offering of each brand is as follows:
OUR BRANDS
* AMHI: Average monthly household income. Source: AMPS Individual Databases (2014B, 2015B).

29
PERFORMANCEREVIEW
OUR GOVERNANCEPROFILE
SUMMARY CONSOLIDATED FINANCIAL STATEMENTS APPENDICES NOTICE OF ANNUAL
GENERAL MEETING ADMINISTRATION

TFG INTEGRATED ANNUAL REPORT 2017 www.tfglimited.co.za30
OUR BRANDS CONTINUED
OUTLETS BY BRAND 2017
The footprint of each brand is as follows:
TOTALOUTLETS
3 328
Next
Colette
hi
G-Star Raw
Charles & Keith
Fabiani
Mat & May
@homelivingspace
SODA Bloc
Duesouth
@home
Donna
Whistles
Sterns
The FIX
American Swiss
Sportscene
Exact
Totalsports
Foschini
Markham
Phase Eight
337
600
331
317
287
277
239
197
182
139
105
91
70
30
27
26
25
14
12
12
8
2
INVESTMENT CASE
ABOUTTHIS REPORT
OUR PROFILE
OUR OPERATINGENVIRONMENT
OUR STRATEGY AND PERFORMANCE

31
PERFORMANCEREVIEW
OUR GOVERNANCEPROFILE
SUMMARY CONSOLIDATED FINANCIAL STATEMENTS APPENDICES NOTICE OF ANNUAL
GENERAL MEETING ADMINISTRATION
@home offers a comprehensive range of premium fashion homeware needed to equip and decorate a stylish modern home.
Men and women of all age groups
2017: 912016: 89
Duesouth offers apparel, footwear, equipment and technology to the informed, urban adventurer who shares a passion for the freedom of the outdoors.
Men and women aged 25 – 35
2017: 70 2016: 54
@homelivingspace offers a comprehensive range of contemporary homeware and furniture for lounge, dining, bedroom, office and outdoor.
Men and women of all age groups
2017: 27 2016: 26
Fabiani offers high-quality fabric and exceptionally cut suits and is renowned for its combination of style, quality, passion and the unexpected pop.
Men aged 25 – 40
2017: 25 2016: 22
BRAND OVERVIEW
UPPER LSM CATEGORY
Brand offering Target audience Number of outlets

TFG INTEGRATED ANNUAL REPORT 2017 www.tfglimited.co.za32
OUR BRANDS CONTINUED
UPPER LSM CATEGORY
G-Star Raw offers authentic denim wear and is renowned for its fusion of high-level craftsmanship with street-level edge.
Men and women aged 20 – 35
2017: 122016: 10
Phase Eight offers stylish and contemporary daywear, bridal wear, occasion wear, evening wear, holiday wear and accessories and is renowned for its high-quality fabric used for an impeccable cut and fit.
Women aged 35 – 55
2017: 6002016: 542
Next offers exquisitely designed and premium quality apparel and accessories for children, inspired by the latest trends.
Boys and girls aged 0 – 12
2017: 2 2016: 2
Whistles offers contemporary fashion and is renowned for its quality and luxury detail.
Women and men aged 25 – 45
2017: 139 2016: 121
INVESTMENT CASE
ABOUTTHIS REPORT
OUR PROFILE
OUR OPERATINGENVIRONMENT
OUR STRATEGY AND PERFORMANCE
Brand offering Target audience Number of outlets

33
PERFORMANCEREVIEW
OUR GOVERNANCEPROFILE
SUMMARY CONSOLIDATED FINANCIAL STATEMENTS APPENDICES NOTICE OF ANNUAL
GENERAL MEETING ADMINISTRATION
MID TO UPPER LSM CATEGORY
American Swiss offers luxury jewellery, watches and accessories and is renowned for its inspirational, exciting and indulgent retail experience.
Men and women of all age groups
2017: 239 2016: 238
hi offers a range of connected lifestyle products and is renowned for its must-have mobile technology hardware and related accessories, including cellular phones, notebooks, tablets, headphones, accessories, data, prepaid and contract airtime.
Men and women of all age groups
2017: 12 2016: 4
Charles & Keith offers international footwear, handbags and accessories and is renowned for its unique fashion-forward collection for the urban trendsetter.
Women aged 18 – 40
2017: 14 2016: 13
Mat & May offers lifestyle accessories, including leather bags, wallets, sunglasses and cellphones for the urban, fashion-savvy consumer.
Men and women aged 25 – 40
2017: 26 2016: 26
Brand offering Target audience Number of outlets

TFG INTEGRATED ANNUAL REPORT 2017 www.tfglimited.co.za34
OUR BRANDS CONTINUED
MID TO UPPER LSM CATEGORY
Sportscene offers sports-inspired footwear, apparel and accessories and is renowned for its blend of street-credible sports brands.
Men and women aged 18 – 25
2017: 277 2016: 256
Totalsports offers a broad range of apparel, footwear and equipment that focuses on football, running, fitness and rugby.
Men and women of all age groups
2017: 317 2016: 299
INVESTMENT CASE
ABOUTTHIS REPORT
OUR PROFILE
OUR OPERATINGENVIRONMENT
OUR STRATEGY AND PERFORMANCE
Brand offering Target audience Number of outlets

35
PERFORMANCEREVIEW
OUR GOVERNANCEPROFILE
SUMMARY CONSOLIDATED FINANCIAL STATEMENTS APPENDICES NOTICE OF ANNUAL
GENERAL MEETING ADMINISTRATION
MID MARKET LSM CATEGORY
Colette has become the essential destination for accessories and is renowned for jewellery and statement bags that embrace the pace of fast fashion.
Women aged 18+
2017: 8 2016: 6
Foschini offers good value smart, casual, denim, leisurewear, accessories, lingerie, footwear, cellphones, cosmetics, fine jewellery and kids’ wear, and is renowned for its fashionable and contemporary clothing in a modern environment.
Women aged 18 – 40Children aged 2 – 14
2017: 331^ 2016: 287
Donna offers smart casual clothing, accessories, lingerie, footwear, cellphones and cosmetics that are dedicated to fuller-figure women and is renowned for its plus-size expertise.
Women of all age groups
2017: 105* 2016: 100
Markham offers on-trend smart and casual wear, including footwear, accessories, cellphones and fragrances and is renowned for its cool, youthful, fresh, vibrant and fun environment.
Men aged 18 – 35
2017: 337 2016: 323
Brand offering Target audience Number of outlets
* Includes four conversions from The FIX outlets.^ Includes 33 conversions from The FIX outlets.

TFG INTEGRATED ANNUAL REPORT 2017 www.tfglimited.co.za36
OUR BRANDS CONTINUED
MID MARKET LSM CATEGORY
SODA Bloc offers denim, tees, dresses, skirts, shorts, gadgets and stationery, shoes and accessories to kit out tweens and is renowned for its coolest fashion fits for their generation.
Boys and girls aged 9 – 16
2017: 30 2016: 15
Sterns offers contemporary and classic bridal and gift jewellery and is renowned for its exceptional quality, craftsmanship and design.
Men and women of all age groups
2017: 182 2016: 184
INVESTMENT CASE
ABOUTTHIS REPORT
OUR PROFILE
OUR OPERATINGENVIRONMENT
OUR STRATEGY AND PERFORMANCE
Brand offering Target audience Number of outlets

37
PERFORMANCEREVIEW
OUR GOVERNANCEPROFILE
SUMMARY CONSOLIDATED FINANCIAL STATEMENTS APPENDICES NOTICE OF ANNUAL
GENERAL MEETING ADMINISTRATION
VALUE LSM CATEGORY
Exact offers great value everyday essentials and is renowned for its trend-appropriate range of quality, well-priced contemporary fashion for the whole family.
Men, women and children
2017: 287 2016: 274
The FIX offers on-trend fashion, footwear and accessories and is renowned for its hot products at great prices.
Women aged 18 – 35
2017: 197* 2016: 234
Brand offering Target audience Number of outlets
* During the 2017 financial year, 37 outlets were converted to other brands within the Group.

TFG INTEGRATED ANNUAL REPORT 2017 www.tfglimited.co.za38
INVESTMENT CASE
ABOUTTHIS REPORT
OUR PROFILE
OUR OPERATINGENVIRONMENT
OUR STRATEGY AND PERFORMANCE
OUR PEOPLE
Highlights
Overview of performance
• The TFG Employee Value Proposition (EVP) was launched during the financial year, and OPPORTUNITY was identified as our unique brand proposition. Multiple career paths are offered at TFG through robust succession planning.
• Continued low labour turnover at senior management and executive levels is indicative of the Group’s strong EVP.
• The introduction of a new talent acquisition model for TFG Africa reduces time to hire and direct recruitment costs.
The Group’s vision of being the leading fashion lifestyle retailer in Africa whilst growing our international footprint can only be achieved through our talented and engaged people who are guided by our values, social conscience and customer-centric mindset. To enable our employees to fulfil their duties, TFG Human Resources has provided the following support during the past financial year:
• Continued investment in our people is essential for competitive advantage. Through our development and leadership programmes, we equip our people with key skills and tools to ensure successful careers.
• We continue to prioritise talent management activities. This includes biannual talent reviews, as well as ensuring a readily available pipeline of talent through our Youth Opportunity team for all key and critical skills.
• Our high-performing teams are evaluated through a robust performance management system. Over the last year, we have introduced additional criteria, and a different format for feedback that is linked to our Group’s business strategy (refer to our Remuneration Committee report on page 119 for further information in this regard).
• We promote health, safety and well-being in all our work environments and the wellness strategy focuses on physical, emotional and financial needs.
• South African operations are supported by three clinics and three satellite clinics, as well as a wellness helpline managed by social workers who give support and advice.
• Additional benefits have been introduced for longer-serving flexitime workers in line with legislative requirements.
• In partnership with Old Mutual, Incon and Discovery, our South African head office and distribution centre employees are able to participate in focused wellness days. Our store-based employees are able to participate in wellness days organised in a number of shopping centres through collaboration with Retailers Unite.
• 206 outlets opened in TFG Africa and 689 new jobs created
• 125 outlets opened in TFG International resulting in 131 new jobs created
• Youth Opportunity team established in TFG Africa facilitating valuable work experience for the unemployed youth– 40 vacation work experiences– 9 external bursaries granted– 11 internal bursaries granted – 148 internship opportunities– 446 learnership opportunities
• The TFG Retail Academy was launched and 394 customer-facing employees participated. The Academy includes a number of skills programmes funded by the SETA and many of these programmes lead to a qualification.

39
PERFORMANCEREVIEW
OUR GOVERNANCEPROFILE
SUMMARY CONSOLIDATED FINANCIAL STATEMENTS APPENDICES NOTICE OF ANNUAL
GENERAL MEETING ADMINISTRATION
• TFG International offers Bupa health checks to their head office team as well as occupational health visits and wellness programmes.
• HIV/AIDS management programmes provide free counselling, testing, treatment and support, and promote non-discriminatory practices for all employees in South Africa.
• Benefits for TFG International:– TFG is committed to ensure that all employees
enjoy benefits in their home countries. At minimum, benefits are as required by legislation, but we focus on going beyond this to be the employer of choice in all territories in which we are active. Being an employer of choice is a divisional objective TFG Human Resources aspires to in order to achieve the Group strategic objective of Leadership.
• Employee relations:– Our values and code of ethics guide how we do
business. We are committed to a workplace that is free from discrimination and we ensure fair and ethical practices for all our employees.
– We strive to comply with all relevant labour laws in all territories where we trade.
– In TFG Africa, we engage with a number of unions and we have collective bargaining with four unions across the countries.
– No time was lost due to industrial action for the reporting period.
Risk and opportunities
• Attraction and retention of key skills are addressed through:– Talent search strategy– New recruitment system to be implemented– Establishment of Youth Opportunity team that
pipelines good talent for future vacancies– Continued focus on skills development through
the retail and merchant academies– Excellent diverse career opportunities
• High crime levels in African operations resulting in trauma, particularly in our customer-facing environment, are addressed through: – Employee helpline offering counselling and
trauma debriefing– Training for line managers and HR practitioners
• Employee engagement:– Supaloud employee engagement surveys,
applicable to employees in TFG Africa, have traditionally been conducted every alternate year since 2010 to measure how engaged our employees feel at TFG.° Research has shown that employee
engagement feedback should be elicited more regularly, preferably in an “always on” way, because positive employee engagement (especially in our customer-facing environments of retail outlets and financial services call centres) has a direct positive impact on customer satisfaction and on increasing sales turnover.
° In 2016, a “Voice of Customer” (VoC) platform was introduced across the majority of TFG retail brands in order to constantly measure customer satisfaction. It was agreed that a “Voice of Employee” (VoE) platform will be implemented in July 2017 so that more regular employee engagement feedback is available.

TFG INTEGRATED ANNUAL REPORT 2017 www.tfglimited.co.za40
OURSTAKEHOLDERS
INVESTMENT CASE
ABOUTTHIS REPORT
OUR PROFILE
OUR OPERATINGENVIRONMENT
OUR STRATEGY AND PERFORMANCE
on partnerships, including relationships with national employer bodies, trade unions, government ministries, higher education and revenue services, and relationships with our various suppliers. By working effectively with these stakeholders, we will not only contribute towards improving the lives of our customers, but also enhance our supply chain – particularly in support of our sustainability strategy focus on localisation – and its ability to support the competitive advantage of our brands.
We believe that value creation depends on the interactions of many stakeholders. Our intent in engaging with our primary stakeholders is summarised as follows:
The Supervisory Board is the ultimate custodian of the corporate reputation of TFG and its relationships with stakeholders. Therefore, the Board acknowledges the importance of proactive engagement.
Our stakeholder engagement approach is based on the principle of shared value. We want to create partnerships with a strong focus on public/private sector collaboration, knowing that our ability to succeed as a business is based
Engagement intent: To understand and respond to their preferences through a strong customer relationship management focus, our Rewards & More programme and online platforms, and to enhance our insights of our customers through the use of intelligent data.
Our customers are a strategic priority, as they provide our income through the sales of our products and services. We aim to offer them a diverse range of fashion, lifestyle and homeware offerings through brand experiences that encompass their channel of preference.
We address their concerns through our call centre, digital media and in-store assistance. Customers’ most frequently raised specific issues relating to in-store experiences or credit queries. They also engage with us regarding merchandise and fashion trends.
Customers form part of communities, which we support through our extensive social investment projects and, in South Africa, through our supplier and enterprise development programmes.
Shareholders
Customers
Engagement intent: To maintain a positive relationship with current and potential investors through our transparent reporting, and to ensure consistency in our trading performance and return on investment.
Shareholders, as our major source of capital, require sustainable growth. We meet their expectations through consistent performance delivery and dividend payments, and by implementing a strategy that creates shared value and ensures sustainability. We engage with shareholders and lenders through presentations, roadshows and meetings where we receive feedback and discuss their matters of interest.

41
Employees
Suppliers
Government and regulators
Engagement intent: To maximise employee productivity, innovation and efficiency, and to retain talent by investing in training and development. We want to provide a rewarding work environment with market-related remuneration, attractive incentive schemes and supportive environments that contribute towards making us an employer of choice.
We engage with our 23 470 employees daily to facilitate employee empowerment (one of our sustainability focus areas) by driving transformation, leadership and skills development, and to promote a sustainable employee pipeline through learnerships, bursaries and workplace
experiences. We invest in people through training and skills development, technology upgrades, market research and brand support, and by opening new outlets. Read more about our people and our various employee-focused initiatives on page 38 and about remuneration in the Remuneration Committee report on page 119.
Employee engagement focus areas include communication about human resource policies, remuneration and performance management. As per our Leadership strategic pillar, we are committed to embedding a performance-based culture that attracts, retains and develops the best talent in the industry.
Engagement intent: To actively engage with suppliers to maximise buying efficiencies, improve speed to market and reduce potential external risks while remaining cost-effective.
TFG’s suppliers consist of merchandise suppliers and non-merchandise suppliers, including service providers, landlords and concession partners. Partnerships with our suppliers are key in ensuring that we deliver merchandise of high standards, at the right price, in locations convenient to our customers.
TFG’s primary sustainability focus is on local supply chain development. This enables economic empowerment, job creation and socio-economic improvement, and also supplies us with a sustainable source of quality merchandise.
Through supplier take-on procedures and audits, and international supplier societal audits, we ensure that we source ethically and that suppliers are able to invest over the long term.
The TFG Merchandise Procurement division oversees and ensures responsible management of, and quality assurance in, procurement practices. A formal process is in place to evaluate existing and potential suppliers, and to monitor supplier performance. Further information on our local supply chain development and ethical sourcing can be found in our Sustainability overview report on our website as well as in our Social and Ethics Committee report on page 109 of this report.
Engagement intent: To maintain constructive relationships with key government departments, closely monitor policy developments and submit comments on new legislation, either directly or through industry bodies.
Government requires businesses to participate in growing the economy, to create jobs and to comply with all applicable regulatory requirements. We engage with government through industry associations such as the Retail Association and the National Clothing Retail Federation of South Africa. We provide input into
proposed legislation and attend meetings at Parliament, attend workshops and adhere to all relevant laws in the applicable countries.
Engagement with our stakeholders provides valuable input into what TFG considers as material. We believe that continued engagement with our stakeholders will ensure that we remain a competitive, sustainable business.
Read more about our material matters on page 48.
PERFORMANCEREVIEW
OUR GOVERNANCEPROFILE
SUMMARY CONSOLIDATED FINANCIAL STATEMENTS APPENDICES NOTICE OF ANNUAL
GENERAL MEETING ADMINISTRATION

TFG INTEGRATED ANNUAL REPORT 2017 www.tfglimited.co.za42
OUR STAKEHOLDERS CONTINUED
INVESTMENT CASE
ABOUTTHIS REPORT
OUR PROFILE
OUR OPERATINGENVIRONMENT
OUR STRATEGY AND PERFORMANCE
The table below sets out the value added per stakeholder group according to our 2017 financial results – a measurement that illustrates the monetary value created, for example, by remuneration, taxes and
Value-added statement
finance charges. TFG creates non-financial value for stakeholders by providing lifestyle brands, information sharing, training and various other forms of products, services and support.
2017Rm %
2016Rm %NOTE
Retail turnover 23 548,7 21 107,5
Paid to suppliers for goods and services (15 489,0) (13 729,9)
Value added 8 059,7 100,0 7 377,6 100,0
Applied as follows: Employees Remuneration to employees 3 669,8 45,5 3 210,8 43,5
Providers of capital To lenders as finance charges 607,4 7,6 509,0 6,9
To shareholders as dividends 1 509,0 18,7 1 327,6 18,0
Taxation Taxation 845,9 10,5 954,8 13,0
Reinvested Reinvested in the Group to finance future expansion and growth 1 1 427,6 17,7 1 375,4 18,6
Employment of value added 8 059,7 100,0 7 377,6 100,0
NOTES TO THE VALUE-ADDED STATEMENT 1. Reinvested in the Group to finance future
expansion and growth Depreciation and amortisation 540,3 6,7 464,7 6,3
Deferred taxation 44,9 0,6 82,3 1,1
Retained income 842,4 10,4 828,4 11,2
1 427,6 17,7 1 375,4 18,6
2. State taxes
Direct taxation as above 845,9 954,8
Net value-added taxation 650,4 515,0
Employees taxation 564,5 473,3
Channelled through the Group 2 060,8 1 943,1

43
PERFORMANCEREVIEW
OUR GOVERNANCEPROFILE
SUMMARY CONSOLIDATED FINANCIAL STATEMENTS APPENDICES NOTICE OF ANNUAL
GENERAL MEETING ADMINISTRATION
TFG INTEGRATED ANNUAL REPORT 2017 www.tfglimited.co.za44
INVESTMENT CASE
ABOUTTHIS REPORT
OUR PROFILE
OUR OPERATINGENVIRONMENT
OUR STRATEGY AND PERFORMANCE
Our operating context 46
Our material matters 48

45
PERFORMANCEREVIEW
OUR GOVERNANCEPROFILE
SUMMARY CONSOLIDATED FINANCIAL STATEMENTS APPENDICES NOTICE OF ANNUAL
GENERAL MEETING ADMINISTRATION
OUR OPERATING
ENVIRONMENT

TFG INTEGRATED ANNUAL REPORT 2017 www.tfglimited.co.za46
INVESTMENT CASE
ABOUTTHIS REPORT
OUR PROFILE
OUR OPERATINGENVIRONMENT
OUR STRATEGY AND PERFORMANCE
OUR OPERATING CONTEXTTFG’s operating context is best explained with reference to its geographic spread as illustrated below:
TURNOVER BY GEOGRAPHIC SPREAD
As indicated above, our exposure is mostly in South Africa, followed by the United Kingdom (England, Scotland, Wales and Ireland). All geographic locations had challenging trading conditions during the year as a result of local and global factors, as well as uncertain economies. The key factors that impacted the Group during the year were:
Global
• Varying symptoms of economic and political uncertainty were evident across the globe, with defining moments ascribed to president Donald Trump’s election in the United States, the United Kingdom’s decision to leave the European Union, and elections in the rest of Europe.
• While China is in a gradual slowdown, several emerging markets are dealing with the consequences of lower commodity demands. This has significantly affected growth in many African countries whose economies are commodity driven.
• Diverging views of climate change outcomes are disrupting collective efforts to mitigate risks. This is already evident in unprecedented droughts and flooding and has a direct impact on, for example, food security and inflation, putting pressure on consumers’ disposable income.
• In most economies, weak growth impacts customer spending and leads to accelerated technological innovation as retailers pursue growth and customers search for value and convenience. Consequently, retail formats are changing and on-demand fulfilment is becoming a business qualifier. Customers are seeking new products and experiences as a condition for engagement and loyalty.
• As retail competition intensifies, traditional models are disrupted and the pressure on pricing and margins increases. On the other hand, economic volatility and exchange rate impacts are drivers of product inflation.
• Global fashion trends include a deceleration in watches and jewellery, while athleisure is one of the fastest-growing clothing categories. Other noteworthy trends include genderless fashion offerings and significant growth in the plus-size fashion segment. The responsible consumption trend is also driving launches of environmentally and socially conscious fashion.
FASHION RETAIL INDUSTRY TRENDS*
TFG IN
TERNATIONAL
TFG AFRICA
TFG AFRICA
TFG IN
TERNATIONAL
MARCH 2017SOUTH AFRICA75%
OTHER AFRICAN COUNTRIES5%
UNITED KINGDOM AND IRELAND16%
OTHER INTERNATIONAL COUNTRIES4%
AFRICA
INTERNATIONAL
MARCH 2016SOUTH AFRICA78%
OTHER AFRICAN COUNTRIES5%
UNITED KINGDOM AND IRELAND14%
OTHER INTERNATIONAL COUNTRIES3%
AFRICA
INTERNATIONAL
* Source: The State of Fashion 2017 (The Business of Fashion and McKinsey & Company); Global Powers of Retailing 2017 (Deloitte).

47
PERFORMANCEREVIEW
OUR GOVERNANCEPROFILE
SUMMARY CONSOLIDATED FINANCIAL STATEMENTS APPENDICES NOTICE OF ANNUAL
GENERAL MEETING ADMINISTRATION
• The political uncertainty in South Africa has ultimately led to the downgrade of South Africa’s sovereign rating to sub-investment grade (“junk status”) by rating agencies Standard & Poor’s, Fitch and Moody’s. This has further constrained economic growth and exacerbated high levels of unemployment.
• The upward interest rate cycle from the previous financial year (a total of 125 bps between July 2015 and March 2016) has stabilised and there were no interest rate increases during the current year.
• Although the Rand strengthened against both the GBP and USD currencies during the year, it remains volatile.• Increased complexity of the regulatory environment and the interpretation thereof has led a to conservative
trading approach.• The implementation of the Affordability Regulations, that became effective towards the end of September 2015,
negatively impacted credit turnover across the South African retail industry.
* Prime lending rate at 31 March (South African Reserve Bank).^ Annual headline consumer price inflation (Statistics South Africa).# Gross domestic product – growth rate based on constant 2010 prices, seasonally adjusted and annualised (Statistics South Africa).
South Africa
Our response
• We continue to invest in our Rewards & More loyalty programme, which is aimed at stimulating cash and credit sales in TFG Africa.
• Our diversification across cash and credit turnover, geography, portfolio of brands and merchandise categories positions us well for future growth.
• Our investment in group analytics provides direct input into optimising strategies for our TFG Africa retail trading divisions. Further information on the benefit of the Group Analytics team is provided in the Performance review: Credit on page 80.
• We expand and enhance our customers’ omnichannel experience in South Africa and the United Kingdom.
• We enhance existing customer value-added products and expand the portfolio to ensure we continue to meet our changing customer needs.
CPI^
6,1%(March 2016:
6,3%)
GDP# (DEC 2016)
0,3%(Dec 2015:
1,3%)
INTEREST RATE*
10,5%(March 2016:
10,5%)
• The political and economic uncertainty relating to the outcome and impact of Brexit negotiations remains a factor in the UK economy.
• The interest rate reduced from 0,5% to 0,25% during August 2016. Although this rate is likely to remain flat in the short term, the higher inflation currently being experienced could result in a rate hike.
• The Pound remains weak and volatile compared to its pre-Brexit levels. • The increased complexity of the UK regulatory environment and the interpretation thereof has led to a conservative
trading approach.• Rapid swing towards online shopping within the United Kingdom in particular.
** Official bank rate (Bank of England).^^ Annual consumer price inflation (House of Commons Library).## Real gross domestic product, seasonally adjusted, percentage change on year (House of Commons Library).
United Kingdom
CPI^^
2,3%(March 2016:
0,5%)
GDP## (DEC 2016)
1,8%(Dec 2015:
2,2%)
INTEREST RATE**
0,25%(March 2016:
0,5%)
To provide further context for our operating environment, Our corporate profile on page 14 gives a breakdown of our exposure in terms of merchandise categories, cash and credit turnover and capital market exposure.

TFG INTEGRATED ANNUAL REPORT 2017 www.tfglimited.co.za48
INVESTMENT CASE
ABOUTTHIS REPORT
OUR PROFILE
OUR OPERATINGENVIRONMENT
OUR STRATEGY AND PERFORMANCE
As a result of these workshops, the material matters below were identified as most relevant to the 2017 financial year and these were evaluated against our strategic risk register.
Matters were identified using the <IR> Framework’s process guidance and apply to both TFG Africa and TFG International, albeit with different levels of likelihood and impact. The material matters, set out below, are grouped according to their nature and indicate the following:
• an increasing or constant level of likelihood and impact; and
• the applicable term for the material matter.
TFG’s material matters are a combination of risks, opportunities and issues that can, directly or indirectly, affect the Group’s ability to create sustainable value in the short, medium and long term.
With our expanding footprint and changing dynamics in our external operating environment, we casted a wider net among our business units for input into the material matters, following an externally facilitated workshop with key internal stakeholders. This included revisiting our previously identified material matters and running two further workshops with a range of specialists and senior managers, including TFG International.
OPERATIONAL
TREND
TERM* S – M
TREND
TERM* S – M
FINANCIAL LOSS DUE TO CRIME AND SHRINKAGE
EXCHANGE RATE VOLATILITY
Retailers over the world battle with continued high levels of crime. South African retailers in particular battle with shoplifting, burglaries and armed robbery. These are operational security challenges, mainly at store and warehouse level, and are best managed through a culture of zero tolerance and high awareness among employees.
Read more about our risk management response to this material matter in the Risk Committee report on page 116.
Exchange rate volatility has a significant impact on profitability for TFG and affordability for customers. The global financial instability therefore impacts purchasing power and could limit our ability to remain price competitive. The geographic diversification of revenue streams, currencies and supply chain initiatives assist in mitigating this. Our policy in respect of purchasing forward cover is reviewed regularly to ensure it remains relevant and provides the best possible protection against currency fluctuations for committed and future orders.
Read more about the impact of a volatile exchange rate in the Chief Financial Officer’s report on page 58.
OUR MATERIAL MATTERS

PERFORMANCEREVIEW
OUR GOVERNANCEPROFILE
SUMMARY CONSOLIDATED FINANCIAL STATEMENTS APPENDICES NOTICE OF ANNUAL
GENERAL MEETING ADMINISTRATION
49
STRATEGIC
TREND
TERM* M – L
TREND
TERM* S – M
UNCERTAINTY OF ECONOMIC AND POLITICAL CLIMATE
FASHION TRENDS AND SUPPLY CHAIN
TFG is predominantly exposed to uncertain and, at times, unstable economic and political environments in South Africa and the United Kingdom. This typically results in constrained growth and, in the case of South Africa, consumers are facing rising debt costs following the country’s sovereign downgrade. A stagnant economic climate negatively affects TFG’s customers’ purchasing power and influences their ability to settle accounts.
Brexit and acts of terrorism impacted investor confidence in Europe while youth unemployment and social inequality remain concerning in South Africa as the country prepares for elections in 2019. These factors all impact interest rates, inflation and our ability to raise and afford capital.
Read more about our operating environment as context to this material matter on page 46.
As we aspire to be the leading fashion lifestyle retailer in Africa whilst growing our international footprint, our ability to offer, predict and deliver according to the latest trends is essential for value creation. Our fashion-forward brands are premised on our market-leading in-house capabilities in clothing and store design. Our ability to generate profits furthermore relies on being able to quickly interpret fashion trends – supported by a quick response capability in our supply chain. This is increasingly enabled by localisation, further supported by our local supply chain division TFG Design which includes our Prestige clothing factories in Maitland and Caledon.
Read more about quick response, localisation and our supply chain in the online Sustainability overview report.
* S – M (short to medium term) and M – L (medium to long term).

TFG INTEGRATED ANNUAL REPORT 2017 www.tfglimited.co.za50
INVESTMENT CASE
ABOUTTHIS REPORT
OUR PROFILE
OUR OPERATINGENVIRONMENT
OUR STRATEGY AND PERFORMANCE
OUR MATERIAL MATTERS CONTINUED
STRATEGIC CONTINUED
TREND
TERM* M – L
TREND
TERM* S – M
GROWTH ACROSS OUR VARIOUS MARKETS AND CHANNELS
TALENT MANAGEMENT: ATTRACTING, RETAINING AND DEVELOPING KEY TALENT
Growing our international footprint and delivering an integrated, secure omnichannel customer experience across our various brands are all strategic objectives for TFG. Changing retail trends demand that we are flexible in the ways in which we engage with our customers, and that we are able to meet their expectation of positive experience and value. Group turnover increased by 11,6% since 2016, which is an indication of healthy growth.
Read more about growth and performance in the Chief Executive Officer’s report on page 54.
We realise that our ability to create value depends on our people. The Group has to retain and develop its core and critical skills pool, but also has to attract the best talent in the industry. The South African-specific imperative is to ensure that we attract and retain employment equity candidates through the TFG culture and employee benefit offering.
The highly competitive retail market requires a strong focus on talent management, which includes talent acquisition by way of proactively identifying future incumbents for leadership positions in the pipeline, and talent development programmes developing our future leaders.
Read more about talent management in Our people on page 38 and in the leadership section in the Strategy performance review on page 68.

51
PERFORMANCEREVIEW
OUR GOVERNANCEPROFILE
SUMMARY CONSOLIDATED FINANCIAL STATEMENTS APPENDICES NOTICE OF ANNUAL
GENERAL MEETING ADMINISTRATION
REGULATORY
TREND
TERM* M – L
COMPLEXITY OF THE REGULATORY ENVIRONMENT
The regulatory environments we operate in is becoming increasingly complex and costly, which heightens the compliance and risk profiles for the Group. We have to understand, interpret and apply differing regulatory requirements in multiple jurisdictions.
We recognise that non-compliance can lead to fines, business interruption, financial loss and reputational damage.
Read more about legal compliance in the Corporate governance report on page 92.
* S – M (short to medium term) and M – L (medium to long term).

INVESTMENT CASE
ABOUTTHIS REPORT
OUR PROFILE
OUR OPERATINGENVIRONMENT
OUR STRATEGY AND PERFORMANCE
TFG INTEGRATED ANNUAL REPORT 2017 www.tfglimited.co.za52
Chief Executive Officer’s report 54
Chief Financial Officer’s report 58
Strategy performance review 64

PERFORMANCEREVIEW
OUR GOVERNANCEPROFILE
SUMMARY CONSOLIDATED FINANCIAL STATEMENTS APPENDICES NOTICE OF ANNUAL
GENERAL MEETING ADMINISTRATION
53
PERFORMANCEREVIEW
OUR GOVERNANCEPROFILE
SUMMARY CONSOLIDATED FINANCIAL STATEMENTS APPENDICES NOTICE OF ANNUAL
GENERAL MEETING ADMINISTRATION
OUR STRATEGY AND PERFORMANCE

TFG INTEGRATED ANNUAL REPORT 2017 www.tfglimited.co.za54
INVESTMENT CASE
ABOUTTHIS REPORT
OUR PROFILE
OUR OPERATINGENVIRONMENT
OUR STRATEGY AND PERFORMANCE
Against a backdrop of challenging trading circumstances and political and economic uncertainty across all the territories we trade in, the Group produced a satisfactory result for the year. Our strategic objectives, encompassing the diversification of our Group, have clearly supported this year’s result on the back of several years of good turnover and earnings growth.
The key features of our performance during the year are as follows:
• Group turnover up 11,6% to R23,5 billion (TFG Africa: +8,0%)
• Headline earnings excluding acquisition costs up 6,8% • Headline earnings per share excluding acquisition costs
up 4,1% to 1 099,2 cents• Final dividend of 400,0 cents per share, total dividend
of 720,0 cents per share – an increase of 4,2%• Total cash component of turnover at 60,7%
(TFG Africa: 51,1%)• Strong cash turnover growth of 18,5%
(TFG Africa: 14,1%)
Credit turnover, impacted by the reduction in new account openings as a result of the Affordability Regulations, grew by only 2,3% during the year.
Further information on our financial performance is provided in our Chief Financial Officer’s report on page 58.
VALUE ADDED DURING THE YEARIn line with our growth in earnings per share, we have declared a total dividend for the year of 720,0 cents per share – an increase of 4,2%. Our interim dividend was 320,0 cents per share and our final dividend was 400,0 cents per share. Our dividend yield at year end, based on the year-end share price, was 4,7%.
At the year end, our share price was trading at R154,49, reflecting a historic price earnings ratio of 13,94.
STRATEGIC DEVELOPMENTS DURING THE YEARThe key developments during the year with regard to our strategic pillars were the following:
Customer• The Group adopted the “Voice of Customer” process
to obtain feedback from customers to enhance the customer experience and to monitor progress.
• The TFG Retail Academy, which focuses on customer service training, has been launched.
• The continued roll-out of e-commerce provide our customers with further brand offerings.
Leadership• A number of executives attended international
development programmes and/or local business schools with international footprints as part of our ongoing leadership talent development.
• As part of our positioning for future growth, a new Group Director Human Resources was appointed during the year.
• We continued our investment in employee training with 126 806 training interventions during the year at a total cost of R138,2 million.
• The Group’s performance-based culture was further enhanced with all performance objectives now linked to the Group’s business strategy.
Profit• A new manufacturing facility was opened in Caledon,
featuring green technology and the latest technology in sewing machines and cutting equipment.– This will further enhance our quick response
capabilities and will lead to the creation of additional employment opportunities for the local community.
CHIEF EXECUTIVE OFFICER’S REPORT

55
PERFORMANCEREVIEW
OUR GOVERNANCEPROFILE
SUMMARY CONSOLIDATED FINANCIAL STATEMENTS APPENDICES NOTICE OF ANNUAL
GENERAL MEETING ADMINISTRATION
• Enhanced focus on cost-efficiencies, capital optimisation and working capital management has ultimately resulted in increased free cash flow during the year.
Growth• The Group opened 331 outlets during the year
(206 in Africa and 125 internationally) while 128 outlets were closed.
• Net trading space in TFG Africa increased by 4,4% during the year.
• A further three brands launched their e-commerce offering during the year, bringing the total number of TFG brands selling online to 10.
• In pursuit of longer-term growth, the Group expanded its international brands through:– the acquisition of Damsel in a Dress; – the acquisition of 14 G-Star Raw outlets in
Australia post year end; and– entering into an agreement to acquire 100% of
the Retail Apparel Group (RAG), an Australian menswear speciality retailer, post year end.
All of the above developments have continued to strengthen and benefit the Group through the diversification of:
• cash and credit turnover – cash sales now account for 60,7% of the Group’s turnover;
• the geographic representation of the Group – at year end the Group had 3 328 outlets in 34 countries;
• sales channels – online product offering in addition to traditional store and concession product offering; and
• its portfolio of brands across sectors.
RAG ACQUISITIONPost year end, the Group entered into an agreement to acquire the entire issued share capital of RAG, which is a leading speciality menswear apparel retailer in Australia. They have a portfolio of five brands, trading out of 400 outlets.
The strategic rationale for the acquisition was as follows:
• The alignment of RAG’s product and value positioning with TFG’s current multi-brand offering.
• RAG’s differentiated low risk product strategy aligns well to TFG Africa’s significant menswear business.
• RAG’s established store and online channels provide a strong platform for the expansion of TFG’s brands into Australasia.
• Enhanced geographic diversification for TFG provides earnings and currency hedge while entrenching its position in Australia.
This acquisition adheres to our previously reported strict criteria:
• A proven, profitable track record• A strong management team, committed to staying
on to continue to grow the business• Good future growth prospects• A strong position in a niche product/market category
We expect the transaction to be concluded during the second quarter of our 2018 financial year, with the remaining conditions precedent being:
• Approval from the Australian Foreign Investment Review Board
• Certain of RAG’s lessors providing consent to the change in ownership
DOUG MURRAY
OUR STRATEGIC OBJECTIVES, ENCOMPASSING
THE DIVERSIFICATION OF OUR GROUP, HAVE
CLEARLY SUPPORTED THIS YEAR’S RESULT ON
THE BACK OF SEVERAL YEARS OF GOOD
TURNOVER AND EARNINGS GROWTH.

TFG INTEGRATED ANNUAL REPORT 2017 www.tfglimited.co.za56
INVESTMENT CASE
ABOUTTHIS REPORT
OUR PROFILE
OUR OPERATINGENVIRONMENT
OUR STRATEGY AND PERFORMANCE
CHIEF EXECUTIVE OFFICER’S REPORT CONTINUED
PERFORMANCE – TFG AFRICAClothing within TFG Africa had a strong performance in a tough market with growth of 8,6% and same store growth of 3,0%.
Jewellery continues to be a difficult retail area but still had positive turnover growth of 1,4% (same store turnover growth: -0,8%).
Cellphones had strong turnover growth of 15,3% based on a market-relevant product range. Same store turnover grew by 11,4%.
Homeware and furniture as well as cosmetics continued to be impacted by significant discounting within the market. Homeware and furniture turnover grew by 5,9%, with same store turnover growth of -3,2%. Cosmetics turnover grew by 2,3% with a flat same store turnover growth.
PERFORMANCE – TFG INTERNATIONALPerformance within TFG International was ahead of expectation and peer group performance for the year with good progress made on the strategic targets set for both Phase Eight and Whistles.
With the inclusion of Whistles’ turnover from April 2016, turnover grew to £251,8 million from £173,7 million at March 2016, an increase of 45,0%. Their operational EBITDA was £30,0 million (March 2016: £26,0 million), an increase of 15,1%.
Both Phase Eight and Whistles will continue to focus on their current successful strategic objectives in the next financial year, with Whistles continuing the implementation of its clearly defined turnaround strategy.
RISK OVERVIEWThe Group continues to enhance its risk methodologies and related processes and aims to embed similar processes across TFG Africa and TFG International. The significant risks identified in the 2017 report are similar to those identified in previous years. The instability and uncertainty of the global economy is still a key area of concern TFG strives to mitigate through diversification and conservative management processes. The increased number of jurisdictions in which the Group operates, along with changing legislation, creates an increasing complex regulatory landscape that we navigate with the assistance of relevant legal expertise and our in-house Compliance and Legal teams.
A key risk for any retailer is managing the risk of fashion and their ability to ensure that their merchandise remains appealing to their target audience. We manage this risk on
an ongoing basis through our buying processes and in addition, believe our business model of in-house design and production, as well as our focus on quick response and replenishment, are key differentiators in this regard.
The South African operations are still hampered by increased levels of crime and started a project of enhancing and strengthening our security and investigation capabilities in the last year. Since our customers are also hampered by rising costs and an unstable economy, we strive to improve our customer service, merchandise availability and range, and accessibility to our products through various channels.
Our risk processes are continuous and risks and opportunities are identified and measured through the year across all business units.
Further information on our risks, risk methodologies and related processes can be found in our Risk Committee report on page 116.
SUSTAINABILITYWe continued to position our sustainability strategy in the shared value space, with a strong focus on local supply chain development. This enables us to focus on the creation of shared value – in both financial and social terms – within our core supply chain operations. Four enablers support our local supply chain focus, namely employee empowerment, resource efficiency, socio-economic development and governance, ethics and accountability.
The links between our business strategy and sustainability strategy are highlighted on page 65 of this report. Further information on our sustainability initiatives, progress and approach can be found in our Sustainability overview report, which is available on our website.
PEOPLE Our performance this year would not have been possible without our more than 23 400 employees. Their talent and commitment to our Group remain key strengths and key differentiators.
To this end, we continued to invest in the development of our employees and spent the equivalent of 3,8% of our total payroll cost on training this year.
Employment equity and transformation remain key focus areas for TFG Africa with 93,2% of our South African employees, as at March 2017, being from designated groups.
AFRICA
INTERNATIONAL

PERFORMANCEREVIEW
OUR GOVERNANCEPROFILE
SUMMARY CONSOLIDATED FINANCIAL STATEMENTS APPENDICES NOTICE OF ANNUAL
GENERAL MEETING ADMINISTRATION
57
PROSPECTSPolitical and economic uncertainty continues to cloud the outlook for both our domestic and the global economy.
As previously mentioned, the Affordability Regulations have had, and will continue to have, a negative impact on the Group’s credit turnover. TFG considers itself a responsible and professional granter of credit. It is concerning that creditworthy customers are impacted by the Affordability Regulations to such an extent that they can no longer access credit responsibly. The Group, together with two other major listed retailers, has initiated legal action against the National Credit Regulator (NCR) and Department of Trade and Industry (dti) in connection with the Affordability Regulations. With the negative impact of the credit regulations now in our base, we anticipate stronger credit turnover growth off this lower base, which should not be allowed to mask the underlying impact these regulations have on the long-term credit prospects of our Group and the retail industry.
Despite the economic outlook, we believe that our continued commitment to our strategic objectives around Customer, Leadership, Profit and Growth will support our future success. In line with our strategy for long-term growth, we anticipate opening in excess of 150 new outlets in TFG Africa in the year ahead, which will increase trading space by approximately 5%. In addition,
we are planning to open in excess of 110 TFG International outlets. Our investment in the UK and Australian markets strengthens our diversified portfolio of brands and provides a solid platform for further growth opportunities in these markets.
APPRECIATIONI would like to thank our Chairman, Michael Lewis, for his invaluable input and contribution during the past year.
I would also like to thank my colleagues on the Supervisory Board for their guidance and direction, and my colleagues on the Operating Board for their input and support during the year.
To our employees, thank you for your contribution to our Group this year. Without you, our performance and success would not have been possible.
Lastly, to our customers, shareholders and stakeholders, thank you for your support of our Group this year. I trust your loyalty will continue to be rewarded.
Doug MurrayChief Executive Officer
29 June 2017

TFG INTEGRATED ANNUAL REPORT 2017 www.tfglimited.co.za58
INVESTMENT CASE
ABOUTTHIS REPORT
OUR PROFILE
OUR OPERATINGENVIRONMENT
OUR STRATEGY AND PERFORMANCE
The 2017 financial year has seen the further, profitable expansion of the Group as we continue to grow and reinvest in our business. In order to put our performance for the year in context, the following needs to be taken into account:
• Phase Eight is fully comparable for this financial year, with 12 months’ trading included in both the 2017 and 2016 financial year. Phase Eight was acquired in January 2015.
• Trading related to Whistles, which was acquired by the Group at the end of March 2016, is included for the full 12 months of the 2017 financial year. No trading was included for them in the prior financial year; however, their at-acquisition statement of financial position was consolidated as at 31 March 2016.
• On 3 February 2017, the Group acquired 100% of the inventory and the brand of Damsel in a Dress. They will be managed within TFG International and two months’ trading have been included in these results.
• During the year, Foschini cosmetics, Markham and Fabiani launched their online selling platforms.
• Interest rate changes: There were no changes to interest rates in South Africa during the current financial year. However, in the prior year, there were four interest rate increases, totalling 125 bps. On 4 August 2016, the interest rate in the United Kingdom reduced to 0,25% from 0,5%.
OUR PERFORMANCE DURING THE YEAR
2017 2016 % CHANGE
Revenue (Rm) 26 413,6 23 746,4 11,2Retail turnover (Rm) 23 548,7 21 107,5 11,6Gross margin (%) 49,7 49,7Total trading expenses (Rm) 10 757,2 9 537,2 12,8Operating margin (%) 16,2 17,0Headline earnings – total (Rm) 2 332,8 2 119,3 10,1Headline earnings – excluding acquisition costs (Rm) 2 332,8 2 185,2 6,8HEPS – excluding acquisition costs (cents) 1 099,2 1 055,8 4,1Total distribution per share (cents) 720,0 691,0 4,2
The Group produced a satisfactory performance for the year in a challenging trading environment. This was aided by the significant efforts put into the three main financial priorities for the Group during the year:
• Cost control• Capital optimisation• Working capital management
CHIEF FINANCIAL OFFICER’S REPORT

59
PERFORMANCEREVIEW
OUR GOVERNANCEPROFILE
SUMMARY CONSOLIDATED FINANCIAL STATEMENTS APPENDICES NOTICE OF ANNUAL
GENERAL MEETING ADMINISTRATION
Through the focus on and commitment to cost control, we have achieved growth of 5,6% in our branch-level comparable expenses in TFG Africa. We are pleased with this growth, which is below South African inflation, and will continue our commitment in this area.
The focus placed on our statement of financial position had encouraging results. Both our recourse (TFG Africa) and Group debt to equity ratios reduced to 53,6% and 65,3% respectively compared to last year (March 2016: 55,6% and 73,5%) and our free cash flow increased by just over 100%.
Despite the challenging conditions in the South African and UK economies, we have achieved pleasing growth of 10,1% in our total headline earnings. Headline earnings excluding the acquisition costs incurred in the prior year
(related to the Whistles acquisition) grew by 6,8%. The resulting growth in headline earnings per share was 4,1% to 1 099,2 cents per share, up from 1 055,8 cents per share last year.
We have continued to reward our shareholders in line with our earnings growth and have accordingly increased our total dividend for the year to 720,0 cents per share, a 4,2% increase. The final dividend was 400,0 cents per share, up from 385,0 cents per share declared at March 2016.
Looking at our performance over the last few years, our diversification strategies have allowed us to continue to deliver strong performance despite difficult trading conditions:
0
5 000
10 000
15 000
20 000
25 000
2017201620152014201320122011201020092008
Turnover (Rm)
HEPS excluding acquisition costs (cents)
Annual distribution (cents)
0
200
400
600
800
1 000
1 200
Rm Cents
288,0
7 668,7
288,0
8 089,6
488,8
288,0
8 605,2
440,7
350,0
9 936,5
537,3
536,0
14 159,0
818,7
588,0
16 085,9
897,9
691,0
1 055,8
720,0
23 548,7
1 099,2
21 107,5
455,0
11 630,5
653,9
506,0
12 896,4
780,6
458,2
HEPS^
9,6%*ANNUAL
DISTRIBUTION
10,3%*TURNOVER
12,5%*
* Numbers relate to a 10-year compound annual growth rate.^ Headline earnings per share excluding acquisition costs.
ANTHONY THUNSTRÖM
LOOKING AT OUR PERFORMANCE OVER THE
LAST FEW YEARS, OUR DIVERSIFICATION
STRATEGIES HAVE ALLOWED US TO CONTINUE
TO DELIVER STRONG PERFORMANCE DESPITE
DIFFICULT TRADING CONDITIONS.

TFG INTEGRATED ANNUAL REPORT 2017 www.tfglimited.co.za60
CHIEF FINANCIAL OFFICER’S REPORT CONTINUED
EXCHANGE RATE MANAGEMENTThe year under review was the first year we had comparative numbers for TFG International in our base. Consequently, the impact of foreign exchange volatility is more significant than in prior years. Our Group turnover growth of 11,6% would have been 14,3% in constant currency. Our headline earnings per share growth (excluding acquisition costs) of 4,1% would have been 5,7% in constant currency.
Fluctuating exchange rates also have an impact on various other areas of our business, including the purchase of merchandise. To mitigate the impact of exchange rate valuation on our business, we regularly review our strategy of purchasing forward cover to ensure that it remains relevant and that we are protected, as far as possible, for committed and future orders.
OVERVIEW OF KEY FINANCIAL STATEMENT ITEMSIncome statementRevenueRetail turnover for the Group grew by 11,6% to R23 548,7 billion. Turnover growth in TFG Africa was 8,0% with 2,8% same store turnover growth, while turnover growth in TFG International was 45,0% in GBP (ZAR growth: 28,7%).
Cash turnover grew strongly at 18,5%, now representing 60,7% of total turnover. Credit turnover growth at 2,3% was negatively impacted by the reduction in new accounts as a result of the Affordability Regulations in South Africa.
Interest income from our debtors’ book in TFG Africa increased by 12,8%. This is mainly due to the compound effect of the four interest rate increases in the prior financial year (totalling 125 basis points) as well as growth of 2,9% in our gross debtors’ book.
Other revenue from customer value-added products (TFG Africa) increased by 2,0% to R1 128,0 billion. Due to the impact of the Affordability Regulations on our new account base, we had limited growth in our publication and insurance income of 0,4% and -3,0% respectively. Further information on planned initiatives to stabilise the performance of these respective portfolios is provided in the Performance review: Customer value-added products on page 82. A significant improvement in supplier service delivery, coupled with the bundling of new products, ensured growth of 15,1% in mobile One2One airtime income.
Gross marginThe Group’s gross margin remained consistent at 49,7% (March 2016: 49,7%) with the gross margin for TFG Africa at 46,4% (March 2016: 46,9%). Gross margins across all merchandise categories remained broadly consistent except for clothing. The clothing margin was down mainly due to the expected impact of the relaunch of The FIX from Fashion Express. The margin mix in the Group was impacted by the strongly improved cellular sales (+15,3%), which trades at a lower margin than our other merchandise categories.
Trading expenses
TFG GROUP
MARCH 2017
Rm
TFG AFRICA MARCH
2017 Rm
TFG GROUP
MARCH 2016
Rm
TFG AFRICA MARCH
2016Rm
% CHANGE TFG
GROUP
% CHANGE TFG
AFRICA
Depreciation and amortisation (540,3) (437,6) (464,7) (347,1) 16,3 26,1Employee costs (3 669,8) (2 837,9) (3 210,8) (2 595,5) 14,3 9,3Occupancy costs (2 431,8) (2 019,0) (2 043,2) (1 758,7) 19,0 14,8Other net operating costs (3 219,2) (2 072,7) (2 870,8) (2 012,0) 12,1 3,0Trading expenses before net bad debt (9 861,1) (7 367,2) (8 589,5) (6 713,3) 14,8 9,7Net bad debt (896,1) (896,1) (947,7) (947,7) (5,4) (5,4)Total trading expenses (10 757,2) (8 263,3) (9 537,2) (7 661,0) 12,8 7,9
INVESTMENT CASE
ABOUTTHIS REPORT
OUR PROFILE
OUR OPERATINGENVIRONMENT
OUR STRATEGY AND PERFORMANCE

61
Due to the inclusion of Whistles, the Group numbers in the table on the previous page and the numbers for TFG International are distorted. My commentary will therefore focus on TFG Africa’s expense growth.
As mentioned above, significant efforts were put into cost control by the Group during the year. This included initiatives such as the centralisation of our procurement function, which led to greater discipline in contracts going out to tender on a regular basis and better alignment of input cost increases to our budgetary processes. This, and other initiatives, resulted in growth of only 3% in other net operating costs (March 2016: +13,7%). Our cost-saving initiatives and discipline will continue as we continue to expand our business.
Depreciation and amortisation increased by 26,1%. This growth is due to the change made in the prior financial year relating to the useful lives of certain asset categories within property, plant and equipment. Excluding this change, the growth in depreciation would have been 9,7%.
Employee costs grew by 9,3% to R2 837,9 million. Our annual salary and promotional increases were approximately 7,5%, with the balance made up of new outlets.
Occupancy costs increased by 14,8% during the year. Our normal lease escalations average approximately 7%, with the remainder made up of new outlets and somestrategic new openings in higher than average rental space. We have also increased our Midrand DC and Maitland factory space during the year, which resulted in increased rental expense for these buildings.
Net bad debt decreased by 5,4% as a result of improved collection results and strong growth in recoveries. As a consequence of the modest growth of the debtors’ book and the lower credit turnover growth, net bad debt as a percentage of the debtors’ book was 11,3%, down from 12,3% at March 2016.
Finance costsFinance costs for the Group grew by 19,3% with a growth of 28,6% in TFG Africa. This is in line with management’s expectation. The growth in TFG Africa’s finance costs is a result of the compound impact of the four interest rate increases during the 2016 financial year, an increased level of term funding and higher interest rate spreads, caused by the economic and political uncertainty experienced in South Africa.
The interest rate in the United Kingdom decreased from 0,5% to 0,25% during the year.
Statement of financial positionProperty, plant and equipmentAs part of our capital optimisation efforts referred to earlier in my report, there was an increased focus on capital expenditure during the year. While property, plant and equipment increased to R2 469,0 at year end, there was a decrease in capital expenditure during the year to R883,5 million, down from R901,0 million in the prior year. The majority of this spend (c60%) relates to the expansion of our Group, while the remaining c40% relates to the maintenance of existing assets.
Included in the above capital expenditure is an amount of R53 million that was incurred during the expansion of our clothing factory in Caledon. This state-of-the-art facility that officially opened post year end on 31 May 2017 is now equipped with the latest sewing machine technology globally available and will enable the Group to increase its quick response capabilities. Further information on our Caledon factory is provided in our Strategy performance review on page 72.
InventoryOur focus on working capital management during the year resulted in our stock levels being well controlled with growth of 7,7% in inventory at March 2017 (March 2016: +34,1%). This growth number was slightly higher than projected due to the soft January and February trading months not only for TFG but across the South African industry. Growth was also impacted by the shift in Easter weekend and the March school holiday. However, we are pleased with the positive results yielded by the increased focus placed on inventory and supply chain during the year, which has also led to our product inflation being only 7,2% for the year, well below the current industry average.
Trade receivablesGrowth in our TFG Africa net debtors’ book slowed to 4,6% (March 2016: +8,0%) for the year due to lower new account growth as well as an improved payment behaviour. The number of active accounts was severely impacted by the Affordability Regulations and the challenging economic environment, resulting in a decrease of 5,4%. Our book continues to be conservatively provisioned at 11,8%, down from 13,2% at March 2016.
Further information on our trade receivables is provided in the Performance review: Credit on page 80.
PERFORMANCEREVIEW
OUR GOVERNANCEPROFILE
SUMMARY CONSOLIDATED FINANCIAL STATEMENTS APPENDICES NOTICE OF ANNUAL
GENERAL MEETING ADMINISTRATION

TFG INTEGRATED ANNUAL REPORT 2017 www.tfglimited.co.za62
INVESTMENT CASE
ABOUTTHIS REPORT
OUR PROFILE
OUR OPERATINGENVIRONMENT
OUR STRATEGY AND PERFORMANCE
Interest-bearing debt
TFG GROUPMARCH
2017Rm
TFG GROUPMARCH
2016Rm
Interest-bearing debt 7 749,2 8 165,7Less: cash (878,5) (888,8)Net borrowings TFG Group 6 870,7 7 276,9Less: TFG International net borrowings (non-recourse) (1 237,7) (1 770,1)TFG Africa borrowings 5 633,0 5 506,8TFG Africa (recourse debt) gearing 53,6% 55,6%TFG Group gearing 65,3% 73,5%
Our interest-bearing debt at year end decreased by R416,5 million to R7,7 billion. TFG International reduced its net borrowings in both GBP and ZAR due to positive cash flows as well as the reduced exchange rate used for the conversion of its statement of financial position as at March (16,84 March 2017 vs 21,15 March 2016).
At year end, our Group gearing was 65,3%, down from 73,5% at March 2016. Our recourse gearing was 53,6%, down from 55,6% at the previous year end.
EquityDuring the year, as part of our strategic pillar Profit, return on capital employment (ROCE) was introduced to optimise profitability and capital management. This will be a medium to long-term project of the Group; however, several milestones have already been accomplished in the first year:
• Accurate determination of current ROCE metrics for each trading division within the Group• Launch of an extensive ROCE training programme to educate appropriate levels of management throughout the
Group on how their actions and behaviour impact divisional and Group ROCE metrics• Monthly reporting and monitoring of ROCE performance• Use of ROCE as a key decision support tool for internal capital projects and in respect of potential acquisitions
As a result of our ROCE focus, we closed 128 outlets that were identified as being marginal in respect of our profitability and ROCE – 37 of which were converted to other brands within the Group. Our normal outlet closures range between 20 – 30 outlets per year.
Cash flow statement
TFG GROUPMARCH
2017Rm
TFG GROUPMARCH
2016Rm
Operating profit before acquisition costs and finance costs (EBIT) 3 811,2 3 596,1Add back: depreciation and amortisation 540,3 464,7EBITDA 4 351,5 4 060,8Less: taxation* (1 012,7) (1 006,3)Operating profit before depreciation and amortisation after taxation 3 338,8 3 054,5Less: capex (883,5) (901,0)Less: working capital movement (1 156,5) (1 509,4)Free cash flow 1 298,8 644,1
* Effective tax rate used.
CHIEF FINANCIAL OFFICER’S REPORT CONTINUED

63
PERFORMANCEREVIEW
OUR GOVERNANCEPROFILE
SUMMARY CONSOLIDATED FINANCIAL STATEMENTS APPENDICES NOTICE OF ANNUAL
GENERAL MEETING ADMINISTRATION
With our increased focus on cost control, working capital management and capital optimisation this year, increased focus was also placed on our free cash flow. Through the resultant increase in operating profit, reduced capital expenditure and reduced working capital outflow, the Group has doubled its free cash flow during the year from R644,1 million at March 2016 to R1 298,8 billion at March 2017.
AcquisitionsOn 3 February 2017, the Group acquired 100% of the inventory and the brand of Damsel in a Dress Limited for £2 million. Damsel in a Dress will be managed within TFG International and will trade as a sub-brand of Phase Eight.
With effect from 3 April 2017, the Group acquired 14 G-Star Raw franchise stores in Australia for AUD13,9 million.
Post year end, the Group announced that it has entered into an agreement to acquire 100% of the share capital of the Retail Apparel Group (Pty) Ltd (RAG), a leading
speciality menswear apparel retailer in Australia. The purchase is capped at the lower of seven times RAG’s audited normalised EBITDA, for the year ending June 2017, and AUD302,5 million, which will then be adjusted for normalised working capital and net debt at acquisition.
TFG will use a combination of its own funds and a short-term bridge facility to pay the purchase price due in terms of this acquisition. It is the Group’s intention to refinance this bridge facility with longer-term funding at an appropriate time as well as to retain the flexibility to potentially issue new ordinary shares to refinance all or part of the bridge facility, whether by way of a vendor consideration placing or otherwise.
The expected purchase price for the acquisition of RAG has been hedged.
Anthony ThunströmChief Financial Officer
29 June 2017

TFG INTEGRATED ANNUAL REPORT 2017 www.tfglimited.co.za64
INVESTMENT CASE
ABOUTTHIS REPORT
OUR PROFILE
OUR OPERATINGENVIRONMENT
OUR STRATEGY AND PERFORMANCE
STRATEGY PERFORMANCE REVIEWOur strategy is informed by our vision, mission and values, as defined in the Investment case and Our corporate profile on the inside front cover and page 14. We remain committed to our strategic pillars of Customer, Leadership, Profit and Growth, which have remained unchanged since our 2015 financial year. Each pillar has specific strategic objectives and, following the formal annual strategy review by our Operating Board and subsequent review and ratification by our Supervisory Board, the strategic objectives were adjusted as indicated below from those reported in our 2016 integrated report.
The above changes were made to ensure that the strategic objectives are more focused in order to align with our changing operating context:
• Advanced technology now provides the ability to have better insight into our customer to understand them and their needs and desires (“enhance customer insights”).
• As we grow, we need to optimise our resources and be more cost-effective (“ROCE”).
The Operating and Supervisory Boards monitor the Group’s performance on these strategic objectives on an ongoing basis. To assist in the measurement of performance against strategy, all strategic objectives underpinning the strategic pillars are driven by members of our Operating Board.
STR
ATE
GIC
P
ILLA
R
CUSTOMER LEADERSHIP PROFIT GROWTH
STR
ATE
GIC
OB
JEC
TIV
E –
20
16
We will deliver superior customer experiences
across our retail brands
We will offer our customers a range of compelling rewards
Alternative credit products will be
investigated that will appeal to our changing
customer base
We are committed to embedding a
performance-based culture that will ensure
that we attract and retain the best talent in the industry
Our brands will optimise their supply chain
capability, including their suppliers, buying processes and quick
response
We will optimise the flow of goods from source to customer to enhance the
customer experience
We will be the leading lifestyle retailer in Africa
whilst growing our international footprint
We will deliver an integrated, secure
omnichannel customer experience across our
various brands
STR
ATE
GIC
OB
JEC
TIV
E –
20
17
We will deliver superior customer experiences across
our retail brands
We will enhance customer insights
through the intelligent use of data
We are committed to embedding a
performance-based culture that will ensure that we attract, retain
and develop the best talent in the industry
Our brands will optimise their supply chain
capability, including their suppliers, buying processes and quick
response
We will optimise the flow of goods from source to customer to enhance the
customer experience
We will enhance return on capital employed (ROCE) by optimising
profitability and capital management
We will be the leading lifestyle retailer in Africa
whilst growing our international footprint
We will deliver an integrated, secure
omnichannel customer experience across our
various brands
OLDER GIRLS ABBOTT KINNEY S3
KIDS SMALL FRAME 413 x 298mm.indd 2 08/06/2016 12:03

65
PERFORMANCEREVIEW
OUR GOVERNANCEPROFILE
SUMMARY CONSOLIDATED FINANCIAL STATEMENTS APPENDICES NOTICE OF ANNUAL
GENERAL MEETING ADMINISTRATION
TARGET SETTINGThe medium-term targets set for each strategic objective are determined through our annual five-year Vision planning process. During this planning process, we prepare a view of our expected earnings for the next five financial years based on current market conditions, planned initiatives and expansion plans, which are driven by our strategy. The financial targets following in this strategy performance review are based on our latest Vision plan (Vision 2022).
HOW OUR SUSTAINABILITY STRATEGY SUPPORTS OUR BUSINESS STRATEGY
CUSTOMER
OLDER GIRLS ABBOTT KINNEY S3
KIDS SMALL FRAME 413 x 298mm.indd 2 08/06/2016 12:03
LEADERSHIPGROWTH
PROFIT
FOR THE PROFIT PILLAR
• We will develop and support local supplier, manufacturing and design capabilities to enhance quality, flexibility and speed of delivery
• We will reduce waste and resource use by applying lean principles at TFG Manufacturing, mentoring local suppliers and changing behaviour at head office and distribution centres
FOR THE LEADERSHIP PILLAR
• Our training programmes will develop employee potential, delivering a capable and competent pipeline of talent
• By empowering women and black South Africans, we will enhance diversity, support transformation efforts and reduce the risk of gaps in our strategy
FOR THE CUSTOMER PILLAR
• We will build trust with our customers and other stakeholders by delivering measurable progress on social and environmental challenges
• We will promote transparency and accountability, encouraging ethical practices across our value chain
FOR THE GROWTH PILLAR
• We will support local communities to ensure our business has a greater chance of success in the long term
• We will respond to societal challenges that impact our operating environment by innovating to create shared value
THE FOUR STRATEGIC PILLARS, SET OUT IN THE TABLE ON THE PREVIOUS PAGE, ARE
ACTIVELY SUPPORTED BY OUR SUSTAINABILITY STRATEGY. THE IMPERATIVES TO DRIVE
SUSTAINABLE VALUE CREATION FOR EACH PILLAR ARE SET OUT
IN THIS INFOGRAPHIC.

TFG INTEGRATED ANNUAL REPORT 2017 www.tfglimited.co.za66
INVESTMENT CASE
ABOUTTHIS REPORT
OUR PROFILE
OUR OPERATINGENVIRONMENT
OUR STRATEGY AND PERFORMANCE
STRATEGY PERFORMANCE REVIEW CONTINUED
CUSTOMER
01Factors impacting our Customer experiences and relationships during the year
• Customer experience has been established as a divisional strategic objective to be tracked in all retail trading and service divisions.
• The new emphasis on customer experience was embraced through renaming operational leadership titles to Head of Customer Experience and Operations.
• The Group adopted the “Voice of Customer” (VoC) process to obtain feedback from customers to enhance the customer experience and to monitor progress.
• The TFG Retail Academy, which focuses on customer service training, has been launched (for more detail on the Academy and number of trainees, refer to Our people on page 38).
We will offer customers a range of compelling rewards as part of an integrated, secure omnichannel customer experience across our retail brands.
STRATEGIC OBJECTIVES • We will deliver superior
customer experiences across our retail brands
• We will enhance customer insights through the intelligent use of data
BUSINESS IMPERATIVES• Ensure a more equitable
split between cash vs credit turnover contribution within TFG Africa
• Grow the basket size in excess of local inflation
• Improve the take-up of Rewards & More offers
CUSTOMERMEDIUM-TERM
TARGETMARCH
2017MARCH
2016%
CHANGE
Number of Rewards & More customers (million)
– Cash 10,2 7,6 5,4 40,7
– Credit 3,5 2,7 2,9 (6,9)
Rewards voucher take-up (%) 9,6 9,3 9,6
STRATEGIC INTENT AND POSITIONING STATEMENT

67
PERFORMANCEREVIEW
OUR GOVERNANCEPROFILE
SUMMARY CONSOLIDATED FINANCIAL STATEMENTS APPENDICES NOTICE OF ANNUAL
GENERAL MEETING ADMINISTRATION
• The turnaround time for new account processing improved following the roll-out of our digital application solution across all retail trading divisions. Customers can now, for example, submit their proof of income documents, required by South African law in the credit application process, via digital channels to simplify the process.
• The Affordability Regulations continue to impact growth of new accounts, particularly for self-employed individuals.
• Our investment in workforce management across our customer contact centres enables us to maintain high customer service levels.
• Enhancing our Rewards & More programme through the adjustment of rewards offers to address each brand’s specific needs, has been challenging. We have, however, embarked on a three-year project to further enhance this programme.
• Continued focus on and investment in our Group Analytics team provide input into customer profiling to optimise store stock allocations and size and range purchase strategies, thereby enhancing the customer’s experience by ensuring the availability of their desired product and size (read more in the Performance review: Credit on page 80).
02Risks and opportunities
• Customer feedback and the use of group analytics provide customer insights that enable the retail trading divisions to continually improve their merchandise strategies and rewards offerings.
• Consumers remain under pressure due to local and global economic challenges, which impact their purchasing power and ability to settle or open accounts. We are expanding our footprint to reach more potential customers and continue refining our credit score models to assist customers in retaining their buying power.
• Revised credit legislation results in more onerous requirements for customers, impacting our existing and potential customer base. We have structures in place to assist customers and to ensure compliance through scorecards and verification initiatives.
• Customer experience skills development through the TFG Retail Academy will ensure that employees are competent to implement our strategic objectives.
• Through our Growth strategic pillar, we continue optimising our supply chain management process as this is critical to provide our customers with their desired merchandise at the right price and time.
03Future focus areas
• Continued enhancement of our customer experiences and relationships through service and offering improvements based on feedback from the VoC process
• Equal focus on the acquisition, conversion, growth and retention of our customers through targeted customer experience initiatives
• Training and upskilling interventions for all our customer-facing employees through the TFG Retail Academy
• Rolling out Rewards & More enhancements that will further improve personalisation and the digital experience, optimise processes, enhance in-store visibility, upgrade our reporting capability and drive increased cross-shopping opportunities (cross-shopping is defined as the average number of brands that a customer shops into over a 12-month period)

TFG INTEGRATED ANNUAL REPORT 2017 www.tfglimited.co.za68
INVESTMENT CASE
ABOUTTHIS REPORT
OUR PROFILE
OUR OPERATINGENVIRONMENT
OUR STRATEGY AND PERFORMANCE
STRATEGY PERFORMANCE REVIEW CONTINUED
LEADERSHIP
LEADERSHIP
MEDIUM-TERM
TARGETMARCH
2017MARCH
2016 %
CHANGE
Number of training interventions during the year
130 000 – 150 000 126 806 116 043 9,3
Staff turnover – total (%) 30,0 37,8 37,1 1,9Staff turnover – permanent TFG Africa head office employees (%) 10,0 – 15,0 8,6 9,0 (4,4)Employment equity (% representation of previously disadvantaged groups among permanent employees) – South Africa only > 90,0 93,2 92,3 1,0
01Factors impacting our Leadership capability during the year
• Our leaders are required to understand and implement lean thinking and efficiency mindsets by encouraging smarter working through efficient structures and by tracking people’s productivity measures.
• The evolving complexity of the Group requires leaders to lead increasingly bigger teams, and to lead across functional and geographic boundaries.
• Our new businesses and international acquisitions continue to place additional demands on leadership teams to ensure that all opportunities are properly researched, all risks are assessed and all acquisitions are well integrated.
We are committed to embedding a performance-based culture that will ensure that we attract, retain and develop the best talent in the industry.
STRATEGIC OBJECTIVES • We are committed to
embedding a performance-based culture that will ensure that we attract, retain and develop the best talent in the industry through:
– the identification and development of critical and key skills required for the future of our Group
– further development and enhancement of the “pay for performance” link
STRATEGIC INTENT AND POSITIONING STATEMENT

69
PERFORMANCEREVIEW
OUR GOVERNANCEPROFILE
SUMMARY CONSOLIDATED FINANCIAL STATEMENTS APPENDICES NOTICE OF ANNUAL
GENERAL MEETING ADMINISTRATION
• A number of executives attended international development programmes and/or local business schools with international footprints as part of our ongoing leadership talent development.
• As part of our positioning for future growth, a new Group Director Human Resources was appointed during the year (refer to the Operating Board section of this report on page 90 for further information). Two new external, seasoned brand heads were also appointed.
02Risks and opportunities
• The theme OPPORTUNITY was identified as our unique TFG Employee Value Proposition (EVP) (refer to Our people on page 38) and relates to the opportunities created for employees across the Group, allowing them to
grow and succeed in any of our 22 retail brands or in our service divisions in an environment of support, collaboration and respect. Our unique Group structure and international footprint facilitate career options and enable succession planning, which therefore mitigate recruitment and retention risk.
• As retail careers continue to be less highly sought after by graduates, our ability to attract, retain and develop key talent is a risk. We promote retail careers in the Group through brand profiling and our new talent search strategy, which targets both customer-facing and head office employees.
• New labour laws in the African and international markets in which we operate continue to put pressure on employee costs.
• We value diversity and develop talent in a proactive way, which includes a continued focus on promoting attendance of our retail academies.
03Future focus areas
• Our leadership capacity to ensure that any new acquisition is well integrated
• Continued development of our customer-facing employees through the TFG Retail Academy and our merchants through the TFG Merchant Academy
• Continued leadership capacity building
• Continued focus on transformation and diversity
• Implementing “Voice of Employee” (refer to Our people on page 38)
BUSINESS IMPERATIVES• Develop and grow diverse talent to ensure the
continuous supply of a capable, competent workforce
• Retain key talent through appropriate recognition and reward
• Prioritise the development of customer-facing employees through enhanced training programmes and performance-based incentives
• Focus on the reduction in “time to hire” and better training of customer-facing employees
• Focus on ongoing talent development across the business
• Continued focus on embedding a performance culture to ensure that individual performance criteria are measured and applied as moderator in the Group annual bonus scheme incentive

TFG INTEGRATED ANNUAL REPORT 2017 www.tfglimited.co.za70
INVESTMENT CASE
ABOUTTHIS REPORT
OUR PROFILE
OUR OPERATINGENVIRONMENT
OUR STRATEGY AND PERFORMANCE
STRATEGY PERFORMANCE REVIEW CONTINUED
PROFIT
PROFITMEDIUM-TERM
TARGETMARCH
2017MARCH
2016%
CHANGE
Number of quick response units (million) 4,0 – 5,0 2,4 1,9 26,3
Gross margin (%) 50 – 51 49,7 49,7
Operating margin (%) 17 – 19 16,2 17,0
01Factors impacting Profit during the year
• Our quick response initiative aims to continuously reduce the lead time from selection of the in-season and/or replenishment style by the TFG retail trading divisions, to the delivery of the unit to the TFG distribution centre. The success of the initiative thus far is driving expanded implementation across the Group, but has been challenged by a lack of access to local fabrics and finishing processes. We are further limited by the lack of scale and depth of the local supply base.
• A new manufacturing facility was opened in Caledon, featuring green technology and leading-edge global technology in sewing machines and cutting equipment.
Our brands will optimise their supply chain capability, including their suppliers, buying process and quick response, to enhance the customer experience.
STRATEGIC OBJECTIVES • Our brands will optimise their
supply chain capability, including their suppliers, buying process and quick response
• We will optimise the flow of goods from source to customer to enhance the customer experience
• We will enhance ROCE by optimising profitability and capital management
BUSINESS IMPERATIVES• Improve trading densities
• Manage gross margins
• Enhance quick response capability through supply chain innovations
• Ensure ongoing focus on cost control
• Improve focus on working capital management and capital allocation
STRATEGIC INTENT AND POSITIONING STATEMENT

71
PERFORMANCEREVIEW
OUR GOVERNANCEPROFILE
SUMMARY CONSOLIDATED FINANCIAL STATEMENTS APPENDICES NOTICE OF ANNUAL
GENERAL MEETING ADMINISTRATION
• The demand for local production from our Prestige factory and the opening of the Caledon facility created 150 new jobs for the Group. More than two-thirds of these new positions have been filled from rural Caledon in the Western Cape – an area of high unemployment.
• The textile cluster was approved by the South African Department of Trade and Industry (dti) and Industrial Development Corporation (IDC) and is expected to further enhance our fabric conversion capabilities.
• ROCE was added as a new key performance indicator to optimise profitability and capital management.
• The introduction of ROCE targets and ROCE levers as measurements, with monthly reporting to the Operating Board, is driving the optimisation of margins and capital allocation.
02Risks and opportunities• Enhanced lead times through the quick response
initiative ensure that we are able to mitigate fashion risk. This supports our customer experience imperative, which requires that we provide our customers with their desired merchandise at the right price and time.
• Our new manufacturing facility will lead to gains in efficiency and increase our quick response capacity, thereby supporting localisation, reducing our reliance on key suppliers and mitigating exchange rate risks.
• Stock turn initiatives and the proactive management of seasonal clearance are key competencies in improving ROCE and mitigating profit risk in a slowing economy. It further supports our aim to optimise the flow of goods from source to customer to enhance the customer experience.
03Future focus areas
• Enhanced gross margins through sourcing initiatives, supplier relationships and optimisation of markdown
• Increased focus on clearances and the prevention of stock ageing
• TFG Design, TFG Manufacturing and TFG Merchandise Procurement initiatives to continue
• Continued focus on expense optimisation and the elimination of waste
• Improved focus on working capital management and the enhancement of the current capital allocation model
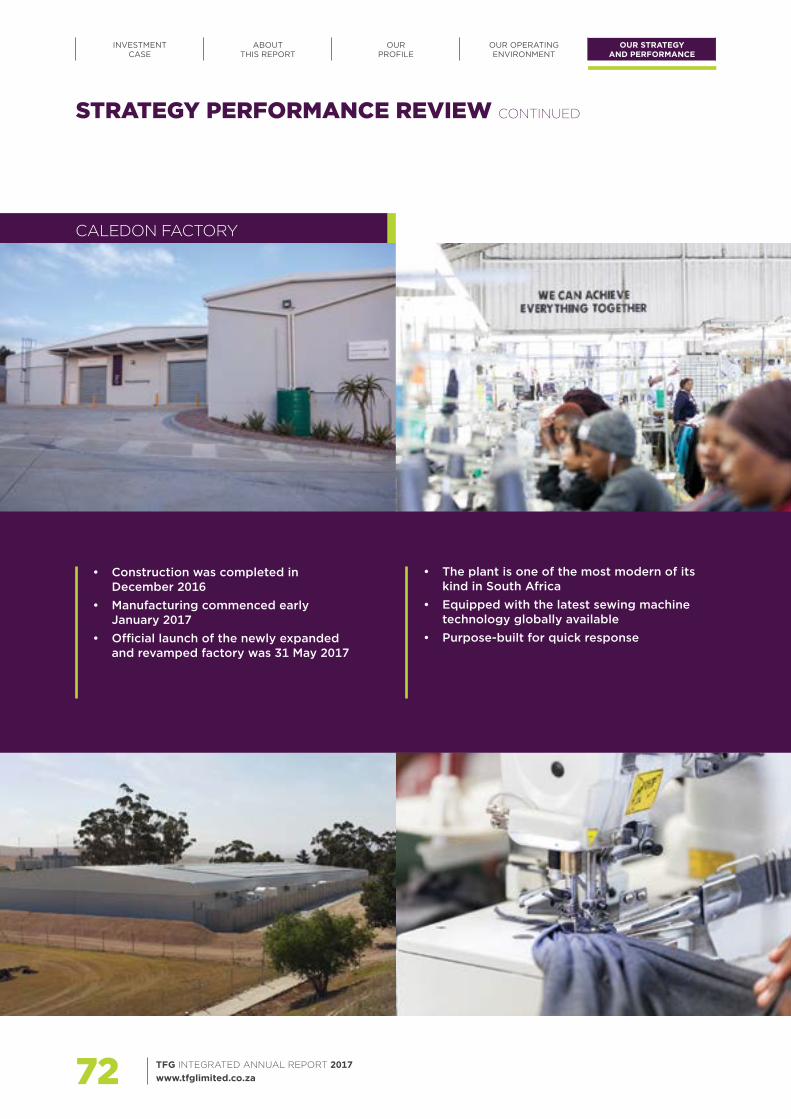
TFG INTEGRATED ANNUAL REPORT 2017 www.tfglimited.co.za72
INVESTMENT CASE
ABOUTTHIS REPORT
OUR PROFILE
OUR OPERATINGENVIRONMENT
OUR STRATEGY AND PERFORMANCE
STRATEGY PERFORMANCE REVIEW CONTINUED
CALEDON FACTORY
• Construction was completed in December 2016
• Manufacturing commenced early January 2017
• Official launch of the newly expanded and revamped factory was 31 May 2017
• The plant is one of the most modern of its kind in South Africa
• Equipped with the latest sewing machine technology globally available
• Purpose-built for quick response

73
PERFORMANCEREVIEW
OUR GOVERNANCEPROFILE
SUMMARY CONSOLIDATED FINANCIAL STATEMENTS APPENDICES NOTICE OF ANNUAL
GENERAL MEETING ADMINISTRATION
• Solar panels supply one-third of the plant’s energy requirements
• All machinery are both energy and air-efficient
• The above, together with rain water harvesting, reduced Prestige’s energy requirement and carbon footprint
• A training school was established that ensured almost all of its current 314 employees, all previously unemployed women, acquired a national qualification in apparel manufacturing from the Department of Higher Education and Training
• The expanded factory will increase employment to 500 employees and annual output to 2,5 million units over the next three years

TFG INTEGRATED ANNUAL REPORT 2017 www.tfglimited.co.za74
INVESTMENT CASE
ABOUTTHIS REPORT
OUR PROFILE
OUR OPERATINGENVIRONMENT
OUR STRATEGY AND PERFORMANCE
STRATEGY PERFORMANCE REVIEW CONTINUED
GROWTH
01Factors impacting Growth during the year
• Amid the uncertainty of the Brexit impact on the UK and EU markets where we currently trade, TFG London successfully acquired the Damsel in a Dress brand in February 2017.
• TFG Africa (excluding South Africa) grew to 183 outlets across seven countries with 13 brands.
• The Group opened its first store (Sterns) in Kenya, Nairobi on 1 September 2016.
• Three brands, namely Markham, Fabiani and Foschini cosmetics, were added to our TFG eMall.
• Alternative delivery solutions were launched in South Africa for TFG eMall sales, allowing our customers to receive their products where they want it and when they want it.
STRATEGIC OBJECTIVES • We will be the leading fashion
lifestyle retailer in Africa whilst growing our international footprint
• We will deliver an integrated, secure omnichannel customer experience across our various brands
BUSINESS IMPERATIVES• Diversify our product offering
across a broad range of merchandise categories
• Diversify our product appeal to a broader range of customers
• Grow through further innovation in publishing and insurance products
• Grow through space expansion
• Grow through the introduction of new retail brands
• Grow through further acquisitions
STRATEGIC INTENT AND POSITIONING STATEMENT
We will be the leading fashion lifestyle retailer in Africa whilst growing our international footprint.
GROWTHMEDIUM-TERM
TARGETMARCH
2017MARCH
2016%
CHANGE
Retail turnover (Rbn) 42,0 23,5 21,1 11,6
E-commerce turnover (Rbn) 2,0 1,3 0,7 85,7
Cash sales contribution (%) 65,0 60,7 57,2
Number of outlets 4 725 3 328 3 125 6,5
Space growth – TFG Africa (%) 5 4,4 6,6
OLDER GIRLS ABBOTT KINNEY S3
KIDS SMALL FRAME 413 x 298mm.indd 2 08/06/2016 12:03

75
PERFORMANCEREVIEW
OUR GOVERNANCEPROFILE
SUMMARY CONSOLIDATED FINANCIAL STATEMENTS APPENDICES NOTICE OF ANNUAL
GENERAL MEETING ADMINISTRATION
02Risks and opportunities
• Global and local economic instability impacts growth potential and leads to exchange rate fluctuation, higher cost of capital and product inflation. This is mitigated through an increasingly diversified business model.
• Growth potential is muted by regulations such as the National Living Wage and the introduction of the Apprenticeship Levy and Revised Business Rates in the United Kingdom and well as changes in local ownership regulations in certain African countries.
• The risk that acquisitions may not realise expected benefits is managed through the strict application of the Group’s acquisition criteria, through professional due diligence and the development of leadership competencies aimed at managing complexity and geographic range.
03Future focus areas
• Creating growth momentum through the international roll-out of Phase Eight, concession store roll-out for Whistles and Damsel in a Dress and e-commerce options across all UK brands
• Continue driving strategic cost savings identified for Whistles and the implementation of its clearly defined turnaround strategy
• Further roll-out of our brands in the TFG eMall
• Continued focus on enhancing our customers’ experience in our TFG eMall, ensuring that it is as convenient and easy as possible, while providing the luxury of choice
• Integration of the Retail Apparel Group (RAG)

TFG INTEGRATED ANNUAL REPORT 2017 www.tfglimited.co.za76
INVESTMENT CASE
ABOUTTHIS REPORT
OUR PROFILE
OUR OPERATINGENVIRONMENT
OUR STRATEGY AND PERFORMANCE
PERFORMANCE REVIEW:
Retail operations 78
Credit 80
Customer value-added products 82

77
PERFORMANCEREVIEW
OUR GOVERNANCEPROFILE
SUMMARY CONSOLIDATED FINANCIAL STATEMENTS APPENDICES NOTICE OF ANNUAL
GENERAL MEETING ADMINISTRATION
PERFORMANCE REVIEW

PERFORMANCE REVIEW RETAIL OPERATIONS
INVESTMENT CASE
ABOUTTHIS REPORT
OUR PROFILE
OUR OPERATINGENVIRONMENT
OUR STRATEGY AND PERFORMANCE
Retail highlights
Performance overview
Our footprint continues to expand with RAG in Australia being the latest addition to the brand portfolio post year end. Whereas the traditional TFG business was primarily based in South Africa with a growing African footprint, the geographic reach of the business now extends to many territories outside of the African continent (in developed and emerging market economies).
Between TFG Africa and TFG International, we now have 3 328 outlets in 34 countries with an increasing number of brands selling online.
The turnover contribution from TFG International (including online and outlets) increased to 19,7% as Whistles made its first full-year contribution (acquired in March 2016).
We achieved overall retail turnover growth of 11,6% (14,3% in constant currency) in a year characterised by uncertain economic and political conditions in most of our trading markets. A strength of the Group is the diversification across different merchandise categories, resulting in no major dependency on any particular category.
The merchandise category contributions to turnover remained broadly in line with 2016. Cellphones (8,2% vs 7,9%); clothing and footwear from the Sport division (20,4% vs 18,8%) and clothing and footwear from TFG International (19,7% vs 17,1%) had the most notable movements in contribution.
Clothing delivered a strong overall performance with growth of 13,3%. This merchandise category remains dominated by the TFG Africa contribution (73%) where consumer spending remained under pressure and was impacted by difficult credit conditions as a result of the Affordability Regulations.
Jewellery continued to be a difficult retail area but showed positive turnover growth of 1,4%.
Cellphones showed strong growth of 15,3% due to a market-relevant product range. As indicated above, the category’s overall contribution also increased, which negatively impacted the gross margin in TFG Africa as a result of the change in product mix.
Turnover growth of 5,9% in homeware and furniture was limited by discounting in the market, with cosmetics under similar pressure with growth of 2,3%.
Cash represented 60,7% of total turnover compared to 57,2% in 2016. Credit turnover growth of only 2,3% (2016: 5,9%) was achieved due to the impact of the Affordability Regulations on our ability to open new accounts. TFG Africa’s cash turnover growth was particularly strong in the first half of the financial year, with the second half affected by a slowdown after the festive season combined with the shift in Easter weekend and the March school holiday.
TFG INTEGRATED ANNUAL REPORT 2017 www.tfglimited.co.za78
CLOTHING TURNOVER GROWTH
13,3%
JEWELLERY TURNOVER
GROWTH
1,4%
CELLPHONES TURNOVER
GROWTH
15,3%
HOMEWARE AND FURNITURE
TURNOVER GROWTH
5,9%
COSMETICS TURNOVER
GROWTH
2,3%
Turnover by merchandise category performance

PERFORMANCEREVIEW
OUR GOVERNANCEPROFILE
SUMMARY CONSOLIDATED FINANCIAL STATEMENTS APPENDICES NOTICE OF ANNUAL
GENERAL MEETING ADMINISTRATION
Group turnover by merchandise category2017
Rm2016
Rm%
GROWTH
% SAMESTORE
TURNOVERGROWTH
(TFG AFRICA)
Clothing 17 578,7 15 517,8 13,3 3,0Jewellery 1 490,5 1 470,5 1,4 (0,8)Cellphones 1 927,7 1 672,2 15,3 11,4Homeware and furniture 1 434,0 1 354,0 5,9 (3,2)Cosmetics 1 117,8 1 093,0 2,3 –
Total 23 548,7 21 107,5 11,6 2,8
01The Damsel in a Dress, G-Star Australia and RAG acquisitions will drive the geographic diversification of future turnover contribution. RAG has established stores and online channels, providing a strong platform for the expansion of TFG’s brands into Australasia. This will provide further earnings and currency hedge while expanding our position in this market.
02With the negative impact of the credit regulations in our base, we anticipate stronger credit turnover growth in the next year off a low base while still retaining momentum in cash turnover growth.
03We will continue our focus on supply chain initiatives, including supplier relationships and the optimisation of markdown, to enhance our gross margin across all merchandise categories.
04Our current year efforts in respect of working capital management and capital allocation will continue in order to further optimise working capital levels throughout the business and to ensure disciplined capital allocation in relation to outlets and projects.
Future focus
7979

TFG INTEGRATED ANNUAL REPORT 2017 www.tfglimited.co.za80
Credit highlights
Performance overview
Credit performance
PERFORMANCE REVIEW CREDIT
INTEREST INCOME
R1 703,8m(2016: R1 510,7m)
12,8% CHANGE
NET BAD DEBT
R896,1m(2016: R947,7m)
(5,4%) CHANGE
CREDIT COST
R235,8m(2016: R242,9m)
(2,9%) CHANGE
PROFIT BEFORE TAX
R571,9m(2016: R320,1m)
78,7% CHANGE
INVESTMENT CASE
ABOUTTHIS REPORT
OUR PROFILE
OUR OPERATINGENVIRONMENT
OUR STRATEGY AND PERFORMANCE
During the year under review, the South African economy and credit environment were characterised by significant challenges. The changes to credit legislation implemented during the previous year continued to impact the Group in the year under review with the implementation of the Affordability Regulations leading to a significant reduction in new credit origination. In spite of a flat interest rate environment, lower levels of investment and employment opportunities coupled with stubborn inflationary growth have continued to exert pressure on credit consumers.
The economies in other African countries where credit is offered have reflected differing levels of growth and opportunity. In spite of generally strong growth and the level of credit granted not being impacted by economic
or political challenges in the relevant geographies, we still see a cautious approach to expansion in Africa and the continued adoption of conservative lending policies in this regard.
In spite of a challenging macroeconomic arena, and the market constraints generated through regulations, our credit business has continued to perform with resilience premised on appropriate, prudent and deliberate credit strategies, leading to sustained improvements in the quality of our portfolio. The construct of our debtors’ book experienced significant improvement, reflecting our improved collections performance over the past few years. A focus on operational excellence and efficiency, has delivered sustainably lower expense levels.
The growth in interest income of 12,8% (2016: 12,9%) is based on a net book growth of 4,6% and the compound effect of interest rate increases in the prior financial year. The repo rate increased by 125 bps over the course of the prior financial year, increasing the average nominal rate in South Africa to 25,2% (2016: 23,3%). The interest yield on the portfolio increased to 21,7% (2016: 20,4%).
Net bad debt has contracted by 5,4% (2016: -7,4%), which is an impressive result. This is primarily due to a slower growth of gross write-offs, and sustained improvements in yields from post-write-off recoveries. Improvements in the effectiveness of collections as well as recoveries continue to be driven through data-enabled strategies. The effect of these strategies on the quality of our debtors’ book has become evident over the past year and is reflected in the improved overall quality of the portfolio. Write-off, provisioning and re-age/restructure policies remain consistent with prior years.
Credit costs decreased by 2,9% (2016: 10,2% increase). This improvement has been achieved following increased efficiency enabled through our continued efforts in
running an optimised workforce that is more flexible and appropriate for our business needs. There has been an unrelenting focus on operational excellence and, in particular, continued customer-facing process improvements. We have invested in the implementation of advanced, state-of-the-art decision-informing software to enable optimal risk assessment and credit allocation at the point of account origination. We believe this offers us a distinct competitive advantage at the point of customer interface.
Fraud incidences related to account origination as well as the level of disputed transactions remain below targeted levels and continue to reflect improvement on prior years.
We have continued to focus on and invest in the evolution of our Group Analytics team to employ data analytics and insights to improve and enhance commercial decision-making across the TFG Group. Our group analytics capability is maturing and is providing input into customer profiling from an engagement perspective, which optimises store stock allocations and size and range purchase strategies.
AFRICA

Future focus
PERFORMANCEREVIEW
OUR GOVERNANCEPROFILE
SUMMARY CONSOLIDATED FINANCIAL STATEMENTS APPENDICES NOTICE OF ANNUAL
GENERAL MEETING ADMINISTRATION
New regulations prescribing the affordability assessment that has to be undertaken when a consumer applies for credit continue to have an impact on the business and put pressure on new account opening volumes. Consumers who are informally employed and who could not provide acceptable proof of income (as per the regulations) were, as a consequence, denied credit. Account closures
and write-offs still exceed the rate at which new accounts are opened, resulting in a reduction in overall account volumes.
As a result, the overall active account base contracted by 5,4% (2016: -4,4%).
Key credit statistics 2017 2016 /
Number of active accounts (’000) 2 422,8 2 560,7Credit sales as a percentage of total retail sales (TFG Africa) (%) 48,9 51,7Net debtors’ book (Rm) 7 000,7 6 695,0Overdue value as a percentage of debtors’ book (%) 13,9 14,0Net bad debt write-off as a percentage of credit transactions (%) 8,2 8,0Net bad debt write-off as a percentage of debtors’ book (%) 13,9 13,4Net bad debt as a percentage of debtors’ book (%) 11,3 12,3Doubtful debts provision as a percentage of debtors’ book (%) 11,8 13,2Provision value (Rm) 936,2 1 015,0Percentage able to purchase (%) 81,8 81,0
01We will increase our focus on customer experience and service and, in particular, the ease and convenience of account origination and activation in support of the Customer strategic pillar. Aligned with this will be an accelerated deployment of our digital application channel. This channel enables customers to apply for an account online and has an emphasis on fulfilment and sustained engagement to reduce account closures.
02Given our ability to sustain the improvement in our collection and recoveries results, the quality of our existing debtors’ book and improvements in our ability to use data and analytics when opening new accounts, we will look to test alternative account acquisition strategies, including the more extensive use of third-party origination channels. This will enable us to grow our credit sales in a responsible and sustainable manner.
03We have engaged with the regulator concerning future potential regulatory changes relating to debt forgiveness. TFG remains committed to assisting customers in the interests of sustainable relationships where a mutually beneficial opportunity exists. The regulator has initiated proposals for an increase in their executive administrative powers.
04Accelerating our investment in group analytics is critical to assist the Credit division and to provide direct input into optimising strategies for the retail trading divisions. This investment will provide returns through stock allocation optimisation and a more informed view of customer preferences. This will inform an increased understanding of customer behaviour over an extended period.
05Significant resources are being invested to understand the impact of and to prepare us for the implementation of IFRS 9. IFRS 9 is the new standard in respect of impairment of financial assets that replaces IAS 39 and is required to be implemented for all financial years starting on or after 1 January 2018. The principal difference between the standards is that IFRS 9 will be based on an “expected loss” principle while IAS 39 was premised on an “incurred loss” principle where provisions are raised in respect of all trade receivables even before there is any objective evidence of impairment and where there are restrictions on the recognition of revenue in respect of impaired assets. The adoption of IFRS 9 is broadly expected to impact negatively on impairment provisions and revenue.
81

TFG INTEGRATED ANNUAL REPORT 2017 www.tfglimited.co.za82
PERFORMANCE REVIEW CUSTOMER VALUE-ADDED PRODUCTS
INVESTMENT CASE
ABOUTTHIS REPORT
OUR PROFILE
OUR OPERATINGENVIRONMENT
OUR STRATEGY AND PERFORMANCE
Customer value-added products highlights
Performance overview
Customer value-added product performance
PUBLISHING NET INCOME
R180,6m(2016: R182,1m)
(0,8%) CHANGE
INSURANCE NET INCOME
R196,0m(2016: R198,1m)
(1,1%) CHANGE
ONE2ONE (O2O) NET INCOME
R67,4m(2016: R57,4m)
17,4% CHANGE
TOTAL NET INCOME
R444,0m(2016: R437,6m)
1,5% CHANGE
NUMBER OF NEW PRODUCT/SERVICE
LAUNCHES
4(2016: 3)
TFG remains the biggest publisher of monthly magazines in South Africa. The publishing portfolio increased to 15 titles with an average of approximately 1,5 million subscriptions billed monthly. The portfolio is segmented into lifestyle offerings covering the interests of men, women, children, the youth and family. Our publishing categories include cooking, motor, sports, fitness, technology, décor, fashion and travel.
The insurance portfolio, which offers long-term and short-term insurance products mainly to account holders, repositioned and enhanced existing products to
meet changing consumer needs. An enhanced TFG retrenchment plan and a fraud alert offering were launched, increasing the portfolio to 15 insurance products.
The One2One (O2O) portfolio, which provides airtime and data contracts to existing account holders via the telemarketing channel, achieved positive growth amid fierce competition.
Publishing portfolioThe past year proved challenging, characterised by difficult macroeconomic conditions coupled with the impact of the new Affordability Regulations. This continued to limit growth in new accounts, with an adverse effect on the size of the account base available as a market for value-added products. Currently, most of the customer value-added products are offered to credit account holders.
The consumption of media across a variety of digital platforms remains a challenge for the publishing industry as advertisers shift their allocation of advertising spend to keep up with consumer media consumption trends. Consumers are also becoming more selective in their spending.
Our efforts to launch new products and activate new sales channels assisted in stabilising the performance of the portfolio. Net income achieved for the year was R180,6 million, down slightly from last year.
The FitLife magazine, which was launched in the second half of the year, exceeded expectations with a subscription base of approximately 21 500. An agreement was reached with Caxton magazines whereby the publishing portfolio onsells Bona magazine. The TFG subscription base for this magazine is now approximately 16 500. Motor magazine subscriptions continue to grow strongly with the latest count being approximately 42 000.
Balanced Life, Sports Club, Soccer Club, MyKitchen, Kids SuperClub, ClubX and Tech magazines remain category leaders in Audit Bureau of Circulations’ (ABC) figures.
Production and distribution costs continued to be adversely impacted by volatile exchange rates. The third quarter of the year saw the introduction of a 360 strategy whereby print is supported by a strong digital and social media presence. The strategy is starting to deliver early positive results, particularly through the generation of significant advertising revenue.
AFRICA

83
PERFORMANCEREVIEW
OUR GOVERNANCEPROFILE
SUMMARY CONSOLIDATED FINANCIAL STATEMENTS APPENDICES NOTICE OF ANNUAL
GENERAL MEETING ADMINISTRATION
Future focus
Late in 2016, the portfolio concluded agreements on the distribution of some of its magazine titles via external retailers. The benefits of this strategy will only be evident in the new financial year.
Insurance portfolioAs was the case with the publishing portfolio, challenging macroeconomic conditions, coupled with the negative impact on the volume of new accounts due to the Affordability Regulations, added significant pressure on performance. Net income for the year at R196,0 million was down 1,1% from the previous year.
The insurance portfolio experienced good growth in policy billings following the opening of a new outsourced sales channel. Where appropriate, existing products were repositioned from a value proposition point of view to better meet market demand.
O2O portfolioThe portfolio saw growth of 17,4% in net income, largely due to changes in the business model and the introduction of a more relevant value proposition in the form of bundled products. We successfully launched a bundled product offering that includes airtime, cellphone and insurance options.
New sales strategies in the telemarketing centre contributed to growth in an industry that continues to face significant competition with the major networks competing on price and putting pressure on margins.
01The publishing portfolio is evolving from a traditional print publishing model to a more comprehensive media model. Signs of additional revenue growth followed the launch of the 360 strategy. The new value proposition will be augmented with the portfolio’s digital initiatives, which support TFG’s e-commerce strategy.
02Following the successful launches of Bona (Caxton magazines) and SARugby (Highbury Media) magazines, we will consider similar strategic partnerships with third parties in the next year.
03The insurance portfolio continues to operate in an industry where the regulatory environment changes and evolves, with a myriad of new requirements to be implemented in the next two years. We will remain vigilant with regard to compliance and will be on the lookout for opportunities arising from any market disruption.
04The launch of insurance products into the cash market is planned for 2017 following a delay in a new system implementation. The portfolio will be launching new products while extending current products to include family and spousal benefits. We are also considering third-party strategic partnerships, particularly where the third party is able to contribute unique product, service or supply chain competencies to the value proposition.
05For the O2O portfolio, the challenge remains ensuring a differentiated value proposition in an uncertain economic climate.
06The O2O portfolio will focus on leveraging the TFG stores environment, including hi stores as sales channels. We are also researching the possibility of launching additional value-added services.
83

TFG INTEGRATED ANNUAL REPORT 2017 www.tfglimited.co.za84
INVESTMENT CASE
ABOUTTHIS REPORT
OUR PROFILE
OUR OPERATINGENVIRONMENT
OUR STRATEGY AND PERFORMANCE
Supervisory Board of Directors 86
Operating Board of Directors 90
Corporate governance report 92
Audit Committee report 103
Social and Ethics Committee report 109
Nomination Committee report 115
Risk Committee report 116
Remuneration Committee report 119

85
PERFORMANCEREVIEW
OUR GOVERNANCEPROFILE
SUMMARY CONSOLIDATED FINANCIAL STATEMENTS APPENDICES NOTICE OF ANNUAL
GENERAL MEETING ADMINISTRATION
OUR GOVERNANCE
PROFILE

TFG INTEGRATED ANNUAL REPORT 2017 www.tfglimited.co.za86
INVESTMENT CASE
ABOUTTHIS REPORT
OUR PROFILE
OUR OPERATINGENVIRONMENT
OUR STRATEGY AND PERFORMANCE
M LEWIS (58)Chairman BA (Econ) (Hons)Appointed: 1989Member of: Nomination and Remuneration CommitteesChairman of: Nomination CommitteeMeetings attended by invitation: Risk and Audit Committees
Michael has more than 35 years’ experience in the investment management and retail industries. He is the Chairman of Oceana Investment Corporation Limited (UK) and a partner of Oceana Investment Partners LLP (UK). He is also the Chairman of Strandbags Holdings Proprietary Limited (Australia), a director of Histogenics Inc. (USA) and United Trust Bank Limited (UK). Michael served on the supervisory board of Axel Springer AG (Germany) and on the board of Cheyne Capital Management LLP (UK). He previously worked at funds managers Ivory & Sime and Lombard Odier.
A D MURRAY (60)BA, CAAppointed: 2007Member of: Risk and Social and Ethics CommitteesMeetings attended by invitation: Audit, Remuneration and Nomination CommitteesJoined the Group: 1985
Doug, our CEO, joined the Group in 1985, was appointed to the Operating Board in 1997 and was appointed as an executive director of The Foschini Group Limited in 2007. Doug’s extensive retail experience includes holding the positions of Managing Director: Pages (subsequently rebranded Exact) and Managing Director: American Swiss Jewellers. He was Retail Director of the Group for 10 years prior to his appointment as CEO in January 2008.
A E THUNSTRÖM (46)BCom (Hons Acc), CA(SA)Appointed: 2015Member of: Risk CommitteeMeetings attended by invitation: Audit and Social and Ethics CommitteesJoined the Group: 2015
Anthony, our CFO, joined the Group and was appointed to the Operating Board in 2015. Prior to this, he had 21 years’ professional services experience with KPMG where he held various regional and pan-African leadership positions, including Chief Operating Officer of KPMG Africa and board member of KPMG South Africa.
SUPERVISORYBOARD OF DIRECTORS
EXECUTIVE DIRECTORS
INDEPENDENT NON-EXECUTIVE DIRECTORS

87
S E ABRAHAMS (78)FCA, CA(SA)Appointed: 1998Member of: Audit and Nomination CommitteesChairman of: Audit CommitteeOpen invitation: Risk CommitteeAlso a director of a South African company: Investec Bank Limited
Sam is a very experienced director. He was formerly an international partner and South African managing partner of Arthur Andersen. Sam is currently the Chairman of Investec Securities (Pty) Ltd and Chairman of The Victor Daitz Foundation, one of the largest charitable foundations in South Africa.
G H DAVIN (61)BCom, BAcc, CA(SA), MBAAppointed: 2015
Graham is a chartered accountant and a career banker with extensive international financial and broad business experience. Graham was a director of Investec for 16 years and of Bank Insinger de Beaufort N.V., a Dutch private bank. He was responsible for the listing of Investec on the JSE and of Insinger on the Luxembourg Stock Exchange. In 2003, Graham led the management buyout of United Trust Bank, a fast-growing UK specialist bank of which he is CEO.
PROF F ABRAHAMS (54)BEcon (Hons), MCom, DComAppointed: 2003Member of: Audit, Remuneration and Social and Ethics CommitteesChairperson of: Social and Ethics CommitteeAlso a director of South African listed companies: Clicks Group Limited, Iliad Africa Limited and Lewis Group Limited
Fatima has extensive experience in industrial psychology and is known for her academic work. She was also a non-executive director of Transnet, B2B Africa (Pty) Ltd and Chairperson of Victoria & Alfred Waterfront Holdings. She has served on the audit and risk, as well as the transformation and remuneration committees of many of the companies she was involved in, and built up sound business experience over the years.
PERFORMANCEREVIEW
OUR GOVERNANCEPROFILE
SUMMARY CONSOLIDATED FINANCIAL STATEMENTS APPENDICES NOTICE OF ANNUAL
GENERAL MEETING ADMINISTRATION
INDEPENDENT NON-EXECUTIVE DIRECTORS
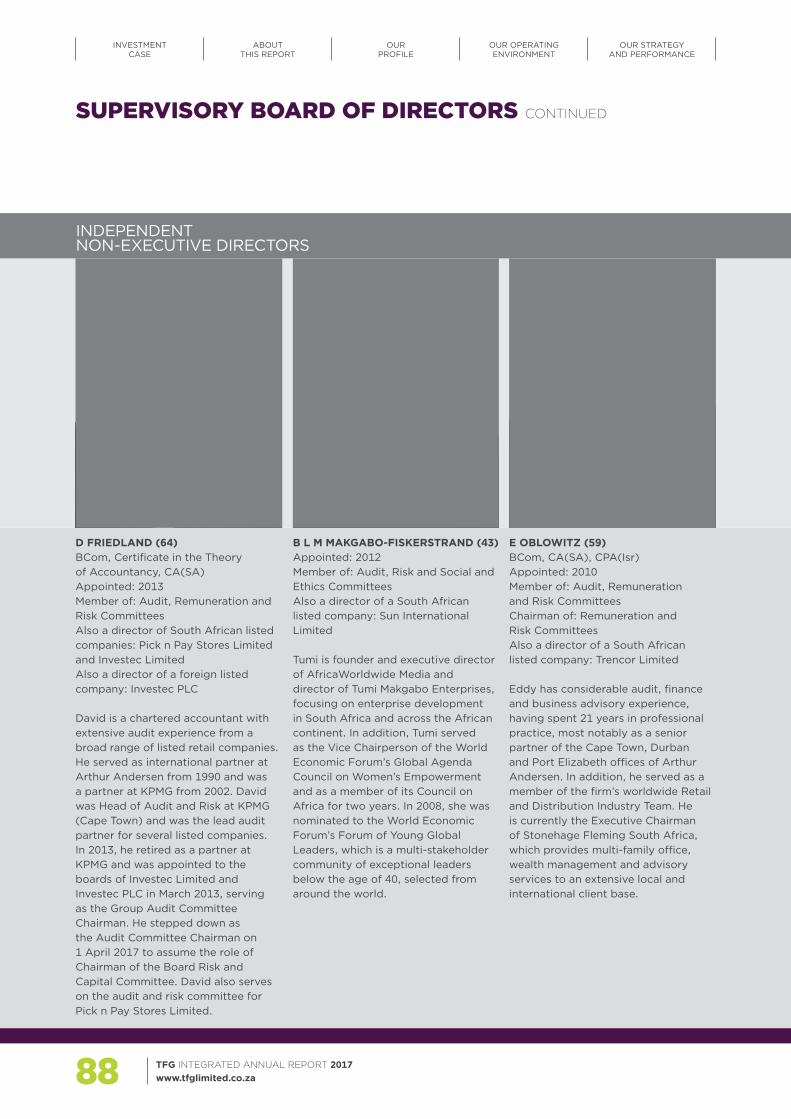
TFG INTEGRATED ANNUAL REPORT 2017 www.tfglimited.co.za88
D FRIEDLAND (64)BCom, Certificate in the Theory of Accountancy, CA(SA)Appointed: 2013Member of: Audit, Remuneration and Risk CommitteesAlso a director of South African listed companies: Pick n Pay Stores Limited and Investec LimitedAlso a director of a foreign listed company: Investec PLC
David is a chartered accountant with extensive audit experience from a broad range of listed retail companies. He served as international partner at Arthur Andersen from 1990 and was a partner at KPMG from 2002. David was Head of Audit and Risk at KPMG (Cape Town) and was the lead audit partner for several listed companies. In 2013, he retired as a partner at KPMG and was appointed to the boards of Investec Limited and Investec PLC in March 2013, serving as the Group Audit Committee Chairman. He stepped down as the Audit Committee Chairman on 1 April 2017 to assume the role of Chairman of the Board Risk and Capital Committee. David also serves on the audit and risk committee for Pick n Pay Stores Limited.
INVESTMENT CASE
ABOUTTHIS REPORT
OUR PROFILE
OUR OPERATINGENVIRONMENT
OUR STRATEGY AND PERFORMANCE
SUPERVISORY BOARD OF DIRECTORS CONTINUED
E OBLOWITZ (59)BCom, CA(SA), CPA(Isr)Appointed: 2010Member of: Audit, Remuneration and Risk CommitteesChairman of: Remuneration and Risk CommitteesAlso a director of a South African listed company: Trencor Limited
Eddy has considerable audit, finance and business advisory experience, having spent 21 years in professional practice, most notably as a senior partner of the Cape Town, Durban and Port Elizabeth offices of Arthur Andersen. In addition, he served as a member of the firm’s worldwide Retail and Distribution Industry Team. He is currently the Executive Chairman of Stonehage Fleming South Africa, which provides multi-family office, wealth management and advisory services to an extensive local and international client base.
B L M MAKGABO-FISKERSTRAND (43)Appointed: 2012Member of: Audit, Risk and Social and Ethics CommitteesAlso a director of a South African listed company: Sun International Limited
Tumi is founder and executive director of AfricaWorldwide Media and director of Tumi Makgabo Enterprises, focusing on enterprise development in South Africa and across the African continent. In addition, Tumi served as the Vice Chairperson of the World Economic Forum’s Global Agenda Council on Women’s Empowerment and as a member of its Council on Africa for two years. In 2008, she was nominated to the World Economic Forum’s Forum of Young Global Leaders, which is a multi-stakeholder community of exceptional leaders below the age of 40, selected from around the world.
INDEPENDENTNON-EXECUTIVE DIRECTORS

89
N V SIMAMANE (58)BSc (Biochem) (Hons)Appointed: 2009Member of: Audit, Risk and Social and Ethics CommitteesAlso a director of South African listed companies: Cashbuild Limited, Oceana Group, Hollard Insurance, Hollard Life Insurance and SA Post Office
Nomahlubi has extensive business, marketing and communications experience, having previously held the positions of Marketing Manager at Unilever, Marketing Director of British American Tobacco and Managing Director of BLGK Bates Advertising Agency. She is currently the CEO of Zanusi Brand Solutions, a branding consultancy she founded in 2001. She has worked in the United States and Kenya and has been recognised as a seasoned business woman, having won two Business Women of the Year Awards in 2009. She was also named the 2013 Enterprising Woman in Fort Lauderdale, Florida, USA.
R STEIN (68)BCom, CA(SA)Appointed: 2015Member of: Risk and Nomination CommitteesMeetings attended by invitation: Audit Committee
Ronnie was previously our CFO. He retired from this position at the end of June 2015 after serving 19 years with our Group. Prior to joining our Group, he was an accountant and auditor in public practice. He was a partner at Kessel Feinstein for 15 years. Following his retirement, Ronnie remains on the Supervisory Board in a non-executive capacity.
COMMITTEES
PERFORMANCEREVIEW
OUR GOVERNANCEPROFILE
SUMMARY CONSOLIDATED FINANCIAL STATEMENTS APPENDICES NOTICE OF ANNUAL
GENERAL MEETING ADMINISTRATION
NON-EXECUTIVE DIRECTOR
AUDIT COMMITTEES E Abrahams (Chairman)F AbrahamsD FriedlandB L M Makgabo-FiskerstrandE OblowitzN V SimamaneM Lewis (by invitation)A D Murray (by invitation)R Stein (by invitation)A E Thunström (by invitation)
REMUNERATION COMMITTEEE Oblowitz (Chairman)F AbrahamsD FriedlandM LewisA D Murray (by invitation)
RISK COMMITTEEE Oblowitz (Chairman)D Friedland B L M Makgabo-FiskerstrandA D Murray N V SimamaneR SteinA E ThunströmS E Abrahams (by invitation)M Lewis (by invitation)
NOMINATION COMMITTEEM Lewis (Chairman)S E AbrahamsR SteinA D Murray (by invitation)
SOCIAL AND ETHICS COMMITTEEF Abrahams (Chairperson)B L M Makgabo-FiskerstrandA D MurrayN V SimamaneA E Thunström (by invitation)
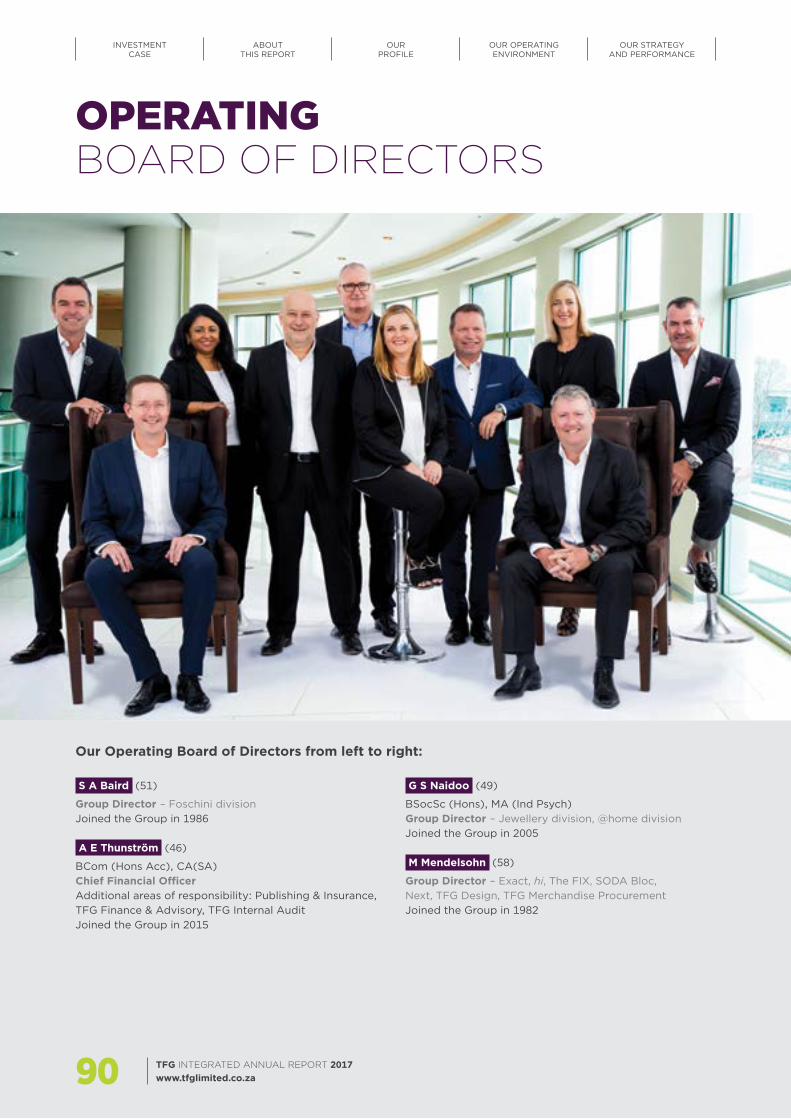
OPERATINGBOARD OF DIRECTORS
INVESTMENT CASE
ABOUTTHIS REPORT
OUR PROFILE
OUR OPERATINGENVIRONMENT
OUR STRATEGY AND PERFORMANCE
S A Baird (51)
Group Director – Foschini divisionJoined the Group in 1986
A E Thunström (46)
BCom (Hons Acc), CA(SA)Chief Financial OfficerAdditional areas of responsibility: Publishing & Insurance, TFG Finance & Advisory, TFG Internal AuditJoined the Group in 2015
G S Naidoo (49)
BSocSc (Hons), MA (Ind Psych)Group Director – Jewellery division, @home divisionJoined the Group in 2005
M Mendelsohn (58)
Group Director – Exact, hi, The FIX, SODA Bloc, Next, TFG Design, TFG Merchandise ProcurementJoined the Group in 1982
TFG INTEGRATED ANNUAL REPORT 2017 www.tfglimited.co.za90
Our Operating Board of Directors from left to right:

D B Gedye (58)
Group Director – Sport division, TFG Property, TFG Store Development, TFG Marketing & E-commerceJoined the Group in 1979
S E Morley (47)
BSocScGroup Director – TFG Human ResourcesJoined the Group in 2002
B J Curry (55)
Chief Information Officer – TFG Infotec, TFG Logistics, TFG ServicesJoined the Group in 1988
J Fisher (44)
BSc (Hons) Mathematics and Computing ScienceGroup Director – Financial ServicesJoined the Group in 2013
A D Murray (60)
BA, CAChief Executive OfficerJoined the Group in 1985
M Maritz (49)
Group Director – Markham divisionJoined the Group in 2001
RESPONSIBILITY
The Operating Board is responsible for the Group’s strategy formulation and the day-to-day management of all aspects of the operations of the retail trading and service divisions.
In addition, they are responsible for deliberating and making decisions or recommendations on all matters affecting TFG’s strategy and operations, including risk management and the succession of executive and senior management. This includes all operational matters such as:
• merchandise sourcing, buying, planning, warehousing and distribution • store location, leasing, operations, design and architecture • human resource recruitment, training, development and remuneration • information systems acquisition, development and maintenance • credit management and customer relationship marketing and systems • financial management and administration • strategic plan formulation, development, execution and refinement • development, review and achievement of budgets in relation to sales, operating expenses
and capital expenditure • identification, assessment, mitigation and risk management • development and refinement of business philosophy and the value system • development, monitoring and audit of internal controls • development, review and implementation of the employment equity plan • development and monitoring of operational policies and procedures • development, implementation and monitoring of transformation strategy • approval of transactions regarding investment, disinvestment, refinancing and restructuring
in accordance with parameters set by the Supervisory Board • adoption and implementation of corporate governance practices and meeting standards set out
in King III
During the year, Senta Morley was appointed to the Operating Board as Group Director for TFG Human Resources. Senta has been with the TFG Group for 20 years of which the last five years has been as Head of Human Resources. She has taken over the Human Resource portfolio of the Operating Board from Shani Naidoo.
91
PERFORMANCEREVIEW
OUR GOVERNANCEPROFILE
SUMMARY CONSOLIDATED FINANCIAL STATEMENTS APPENDICES NOTICE OF ANNUAL
GENERAL MEETING ADMINISTRATION

TFG INTEGRATED ANNUAL REPORT 2017 www.tfglimited.co.za92
TFG remains committed to the highest standards of corporate governance that add value to the business. Transparency and accountability remain the key principles on which all its business activities are conducted. TFG fully supports the governance principles contained in King III, King IV and the Listings Requirements of the JSE. Governance extends beyond regulatory compliance as executive and senior management aims to create and maintain a culture of good governance throughout the Group.
KING III AND KING IVTFG has successfully entrenched and continues to apply the King III principles in terms of the composition and functioning of its governance structures and the governance of its day-to-day activities. A register of all 75 King III principles is available on our website.
TFG is also in the process of assessing the principles of King IV and continually invests in the process. The required corporate governance disclosures required in terms of King IV will be included in the integrated annual report for the year ending 31 March 2018.
GOVERNANCE STRUCTURESThe non-executive Supervisory Board of TFG embraces the responsibilities imposed by King III and King IV and acknowledges that it is ultimately accountable for the strategy, direction, leadership, governance and performance of the Group. The Supervisory Board also has oversight of the development and approval of, and updates made on, TFG’s vision, mission and value statements, significant policies and goals related to economic, environmental and social impacts. The Operating Board is responsible for day-to-day management and operations.
The scope and functioning of the Supervisory Board and board committees are governed by charters. These charters are reviewed and updated regularly. They outline the relevant authority, responsibilities, powers, composition and functioning of the Supervisory Board and its committees.
The Supervisory Board is satisfied that it has fulfilled its responsibilities in accordance with its charter for the 2017 financial year.
COMPOSITIONIn accordance with King III requirements, the Supervisory Board of Directors of TFG mainly comprises non-executive directors, with the majority being independent.
The Supervisory Board is committed to having a diverse board and, as required by the Listings Requirements, has adopted a policy on the promotion of gender and race
INVESTMENT CASE
ABOUTTHIS REPORT
OUR PROFILE
OUR OPERATINGENVIRONMENT
OUR STRATEGY AND PERFORMANCE
CORPORATE GOVERNANCEREPORT
diversity at Supervisory Board level in December 2016. In terms of this policy the Supervisory Board acknowledges:
• that diversity is important in order to provide the necessary range of perspectives, experience and expertise required to achieve effective stewardship and management of the company and TFG as a whole; and
• that a truly diverse board will include and make good use of different skills, regional and industry expertise, background, race, gender and other distinctions between directors.
The graphics below provide a visual outline of our Supervisory Board’s diversity:
GENDER DIVERSITY
RACE DIVERSITY
FEMALE27%
MALE73%
BLACK27%
WHITE73%
The Nomination Committee gives due consideration to succession planning for all Supervisory Board directors and ensures that all committees are appropriately constituted and chaired. It also addresses gender and race diversity as an explicit element of its oversight work.
The current Supervisory Board structure comprises 11 directors, nine of whom are non-executive directors, of which eight are independent directors and one is not regarded as independent. The remaining two directors are executive directors, namely the Chief Executive Officer and the Chief Financial Officer, and are salaried employees of TFG.
Five committees assist the Supervisory Board in discharging its duties. These committees are the Remuneration, Risk, Audit, Social and Ethics, and Nomination Committees. An overview of the functions of these committees appears later in this report. The composition of the Supervisory Board and its committees appears on page 89.
During the year, an ad hoc Finance Committee, comprising both non-executive and executive directors and chaired by Mr G H Davin, was also tasked to assist the Supervisory Board in a number of areas, including specifically considering and investigating all potential acquisition opportunities and their funding.

REMUNERATION COMMITTEE
RISK COMMITTEE
NOMINATION COMMITTEE
AUDIT COMMITTEE
SOCIAL ANDETHICS
COMMITTEE
SUPERVISORY BOARD
93
PERFORMANCEREVIEW
OUR GOVERNANCEPROFILE
SUMMARY CONSOLIDATED FINANCIAL STATEMENTS APPENDICES NOTICE OF ANNUAL
GENERAL MEETING ADMINISTRATION

TFG INTEGRATED ANNUAL REPORT 2017 www.tfglimited.co.za94
INVESTMENT CASE
ABOUTTHIS REPORT
OUR PROFILE
OUR OPERATINGENVIRONMENT
OUR STRATEGY AND PERFORMANCE
CORPORATE GOVERNANCE REPORT CONTINUED
DIRECTORSThe non-executive directors come from diverse backgrounds in commerce and industry (detailed information on the directors and their credentials appears on pages 86 to 89). Their collective experience enables them to provide sound, independent and objective judgement in decision-making that is in the best interests of TFG. They are ultimately responsible for the performance of TFG, its long-term sustainable growth and the enhancement of shared value for all stakeholders. They review and ratify TFG’s strategy in addition to monitoring and measuring its performance and the Operating Board members against key performance indicators (refer to the Remuneration Committee report on page 119 and the leadership section in the Strategy performance review on page 68. They provide their opinion and advice regarding the Group’s financial, audit, governance, legal compliance and risk management controls. In order to ensure sustainable leadership, they review transformation and succession planning at senior levels and give input on the remuneration process.
All directors exercise unfettered discretion in the fulfilment of their duties, resulting in constructive debate at meetings that continues to yield well-considered decisions. There exists a balance of power and authority among the Supervisory Board of Directors.
Director appointment and inductionPotential new non-executive directors go through a thorough interview procedure until a suitable candidate has been chosen and appointed. The process is contained in a policy that details the appointment procedure and ensures that appointments are a matter for the Supervisory Board of Directors as a whole, assisted by the Nomination Committee. Newly appointed directors hold office only until the next annual general meeting, at which time their original appointment is confirmed and they stand for re-election at that meeting. Each year, one-third of the existing non-executive directors are subject to retirement by rotation. This is in line with King III and the memorandum of incorporation. The Nomination Committee recommends re-election by shareholders after due consideration is given to the director’s attendance at meetings and his/her performance. Non-executive directors have no fixed terms and the performance of all directors is subject to an annual peer review (read more about these evaluations on page 96).
A formal induction programme for new non-executive directors is in place with the objective of maximising their understanding of the Group and enabling them to provide input and make well-informed decisions as quickly as possible.
Changes to the Supervisory Board and committees during the 2017 financial yearThere were no changes to the Supervisory Board during the financial year. The only changes to committee composition were in respect of the Risk Committee where Ms B L M Makgabo-Fiskerstrand and Ms N V Simamane were appointed as additional members, and the Audit Committee where Prof F Abrahams was appointed as an additional member. These changes were effective from 1 October 2016.
Independence assessmentAll non-executive directors are required to complete an annual independence questionnaire to assess their independence in terms of the objective independence criteria in King III. Eight of the non-executive directors are independent according to the King III definition of independence.
Of the eight directors that satisfy the objective independence requirements, three have served a term in excess of nine years. The Supervisory Board reviewed the independence of Mr S E Abrahams, Mr M Lewis and Prof F Abrahams and, after due consideration (during the relevant meeting the aforementioned directors recused themselves), concluded that the length of their association with the Group in no way impaired their independence.
Remuneration and shareholdingThe remuneration paid to directors during the current year as well as details of direct and indirect shareholdings are disclosed in the Remuneration Committee report on page 119, which appears later in this report. Information regarding their participation in share incentive schemes (which is limited to executive directors) is also disclosed.
Dealing in sharesThe Supervisory Board complies with the Listings Requirements of the JSE in relation to restrictions on directors and employees trading with TFG shares during closed periods. Restrictions may also be placed on share dealings at other times if TFG is involved in corporate activity or sensitive negotiations.
There is a process in place in terms of the Listings Requirements of the JSE for directors to obtain prior clearance before dealing in TFG shares. All transactions are conducted at the ruling market price on the JSE.
Details of directors’ share dealings are disclosed on SENS.

95
Directors’ interests in contractsIn addition to a formal annual disclosure process, directors are required to make ongoing disclosures of any interests in contracts. During the year under review, the directors had no interest in contracts as contemplated in the Companies Act.
SUPERVISORY BOARD MEETINGSThe Supervisory Board typically meets five times per year in Cape Town and further meetings are held at short notice when necessary. Proceedings at meetings are directed by way of an agenda. The proposed agenda is circulated in advance of the meeting to allow Supervisory Board members the opportunity to request additional agenda items.
In addition, a comprehensive board pack is distributed to all members prior to meetings to ensure that they are properly informed, able to engage in meaningful discussions and effectively discharge their duties.
All directors have unrestricted access to the Company Secretary and all company records, as well as to independent professional advice at the company’s expense in appropriate circumstances.
During the current financial year, the Supervisory Board, inter alia, approved projections and results, dividends (including scrip distributions) and acquisitions, reviewed strategy at various levels, focused on current performance and considered report backs from board committees.
SUPERVISORY BOARD AND COMMITTEE ATTENDANCEThe attendance of the directors at Supervisory Board and committee meetings for the financial year was as follows:
SUPER-VISORY BOARD
REMUNE-RATION
COMMITTEERISK
COMMITTEEAUDIT
COMMITTEENOMINATION
COMMITTEE
SOCIAL AND ETHICS
COMMITTEE
NUMBER OF MEETINGS 5 4 4 3 2 2
F Abrahams 5 3^ – 1*^ – 2S E Abrahams 5 – 3#^ 3 2 –G H Davin 4^ – – – – –D Friedland 4^ 3^ 3^ 1^ – –M Lewis 5 4 4# 3# 2 –B L M Makgabo-Fiskerstrand 5 – 2* 2^ – 2A D Murray 5 4# 4 3# 2# 2E Oblowitz 5 4 4 3 – –N V Simamane 5 – 1*^ 3 – 2R Stein 5 – 4 3# 2 –A E Thunström 5 – 4 3# – 2#
* Appointed to committee 1 October 2016.# Invitee.^ Absent with apology.
PERFORMANCEREVIEW
OUR GOVERNANCEPROFILE
SUMMARY CONSOLIDATED FINANCIAL STATEMENTS APPENDICES NOTICE OF ANNUAL
GENERAL MEETING ADMINISTRATION

TFG INTEGRATED ANNUAL REPORT 2017 www.tfglimited.co.za96
INVESTMENT CASE
ABOUTTHIS REPORT
OUR PROFILE
OUR OPERATINGENVIRONMENT
OUR STRATEGY AND PERFORMANCE
CORPORATE GOVERNANCE REPORT CONTINUED
SUPERVISORY BOARD EVALUATIONSAn annual evaluation of the Supervisory Board, its members and each of the committees is undertaken by way of comprehensive questionnaires sent to all Supervisory Board members. The results are collated and passed on to the Chairman who has a one-on-one interview session with each director to discuss his/her feedback and any areas of concern. The Chairman provides feedback to the Supervisory Board on any actions arising from the evaluation process. The evaluation is comprehensive, encompassing all aspects of the Supervisory Board’s responsibilities. It covers both individual member contributions and the effectiveness of the Supervisory Board and its committees as a whole. The most recent evaluation was conducted entirely by secure electronic means and was completed towards the end of the 2016 calendar year. All action items were attended to, which included ongoing training for non-executive directors, extended time for strategic discussions at Supervisory Board meetings and the enhancement of the format and timing of the annual Supervisory Board evaluation process.
COMPANY SECRETARYOn 22 May 2016, Ms D Sheard resigned as Company Secretary and Mr D Van Rooyen assumed the position.
As the Company Secretary, Mr D van Rooyen is accountable to the Supervisory Board and all directors have access to his advice and services. He maintains an arm’s-length relationship with the Supervisory Board and is not a director of the company. The Company Secretary is independent and functionally reports to the Supervisory Board on company secretarial matters.
The Company Secretary’s duties include but are not limited to those listed in section 88 of the Companies Act.
Every year, as part of the annual Supervisory Board evaluation process, the directors assess whether the Company Secretary has fulfilled the required obligations and duties. The annual assessment questionnaire gives directors the opportunity to not only evaluate the Company Secretary but to raise any concerns they may have.
The Supervisory Board believes that the Company Secretary is suitably qualified, competent and an experienced individual who is able to provide the Supervisory Board with the requisite support for its efficient functioning and discharge of its duties as prescribed by the Companies Act, King III and the Listings Requirements.
SUPERVISORY BOARD COMMITTEESThe Supervisory Board of Directors delegated specific responsibilities to board committees, each with its own charter that defines its responsibilities. The committees aim to review their charters annually and undertake an annual performance evaluation. All committees are chaired by an independent non-executive director.
The board committees meet independently and provide feedback to the Supervisory Board through their Chairpersons. In addition, minutes of all committee meetings are included in the Supervisory Board packs and all directors are given the opportunity to raise any concerns or questions arising from these minutes.
The directors confirm that the committees functioned in accordance with their written terms of reference as contained in their charters during the financial period. An overview of each committee’s functioning and responsibilities follows.

97
AUDIT COMMITTEESCHEDULED MEETINGS RESPONSIBILITY
MEMBERSS E Abrahams (Chairman)D FriedlandB L M Makgabo-FiskerstrandE OblowitzN V SimamaneF Abrahams*
INVITEESM Lewis A D Murray R SteinA E Thunström
Three times per annum The focus areas of the committee are:• to review the effectiveness of the Group’s systems of
internal control, including internal financial control and risk management, and to ensure that effective internal control systems are maintained;
• to ensure that written representations on internal controls are submitted to the Supervisory Board annually by all heads of retail trading and service divisions (these being representations that provide assurance on the adequacy and effectiveness of the Group’s systems of internal control);
• to monitor and supervise the effective functioning and performance of the internal auditors;
• to ensure that the scope of the internal audit function has no limitations imposed by executive management and that there is no impairment on its independence;
• to evaluate the independence, effectiveness and performance of the external auditors, and to obtain assurance from the auditors that adequate accounting records are being maintained;
• to recommend the appointment of the external auditors on an annual basis;
• to ensure that the respective roles and functions of external audit and internal audit are sufficiently clarified and coordinated; and
• to review financial statements for proper and complete disclosure of timely, reliable and consistent information, and to confirm that the accounting policies used are appropriate.
* Appointed to the committee on 1 October 2016.
SOCIAL AND ETHICS COMMITTEE
SCHEDULED MEETINGS RESPONSIBILITY
MEMBERSF Abrahams (Chairperson)B L M Makgabo-FiskerstrandA D MurrayN V Simamane
INVITEESA E Thunström
Twice per annum The focus areas of the committee are:• social and economic development, including
transformation;• good corporate citizenship;• the environment, health and public safety;• labour and employment;• consumer relationships; • ethics; and• sustainable development initiatives.
PERFORMANCEREVIEW
OUR GOVERNANCEPROFILE
SUMMARY CONSOLIDATED FINANCIAL STATEMENTS APPENDICES NOTICE OF ANNUAL
GENERAL MEETING ADMINISTRATION

TFG INTEGRATED ANNUAL REPORT 2017 www.tfglimited.co.za98
INVESTMENT CASE
ABOUTTHIS REPORT
OUR PROFILE
OUR OPERATINGENVIRONMENT
OUR STRATEGY AND PERFORMANCE
CORPORATE GOVERNANCE REPORT CONTINUED
RISK COMMITTEESCHEDULED MEETINGS RESPONSIBILITY
MEMBERSE Oblowitz (Chairman)D FriedlandB L M Makgabo-Fiskerstrand*A D MurrayN V Simamane*R SteinA E Thunström
INVITEESM LewisS E Abrahams
Four times per annum The committee ensures that:• appropriate risk and control policies are in place and are
communicated throughout the Group;• the process of risk management and the system of internal
control are regularly reviewed for effectiveness;• there is an ongoing process of identifying, evaluating and
managing the significant risks faced by the Group, and that this is in place throughout the year;
• a formal risk assessment is undertaken annually;• there is an adequate and effective system of internal control
in place to manage the more significant risks faced by the Group to an acceptable level;
• there is a documented and tested process in place that will allow the Group to continue its critical business processes in the event of a disaster, inter alia, the destruction of a distribution centre, head office or computer facility that affects its activities;
• a risk register is maintained and kept up to date; and• appropriate insurance cover is placed and regularly
reviewed, and that all uninsured risks are reviewed and managed.
* Appointed to the committee on 1 October 2016.
REMUNERATION COMMITTEE
SCHEDULED MEETINGS RESPONSIBILITY
MEMBERSE Oblowitz (Chairman)F AbrahamsD FriedlandM Lewis
INVITEESA D Murray
Four times per annum The Remuneration Committee sets the Group’s remuneration strategy, policies and practices. Main focus areas include:• recommending, reviewing and approving all remuneration
for non-executive directors, executive directors and senior executives;
• ensuring a fair balance between fixed and variable remuneration within the company’s financial constraints;
• reviewing the short-term and long-term incentive to ensure it is market related and supports shareholder value creation; and
• overseeing the setting of remuneration at all levels in the Group.

99
NOMINATION COMMITTEESCHEDULED MEETINGS RESPONSIBILITY
MEMBERSM Lewis (Chairman)S E AbrahamsR Stein
INVITEESA D Murray
Twice per annum Main functions include:• reviewing the Supervisory Board structure, size
and composition;• reviewing the nature, size and composition of the
Supervisory Board committees;• succession planning;• reviewing the balance between non-executive and
executive directors;• ensuring the directors have the required blend of
experience, skills and knowledge to support the continued success of the Group; and
• ensuring the existence of a formal process of performance evaluation.
WHISTLE-BLOWINGThe Group has adopted a zero tolerance approach to fraud, corruption and other forms of crime or dishonesty. During the year, the Group has continued to invest in measures to assist in minimising the number of incidents:
• The Supervisory Board promotes a culture of openness and transparency throughout the organisation in accordance with the Group’s values of trust and mutual respect.
• The Group encourages whistle-blowing through the outsourced Deloitte tip-off anonymous line. A whistle-blowing facility has been in place since February 1998 for the reporting of suspected fraud and unethical behaviour. Reports are submitted to the Group Forensics department for investigation.
• The line is promoted among employees and suppliers.
During the year, 234 reports were received (2016: 141).
PERFORMANCEREVIEW
OUR GOVERNANCEPROFILE
SUMMARY CONSOLIDATED FINANCIAL STATEMENTS APPENDICES NOTICE OF ANNUAL
GENERAL MEETING ADMINISTRATION
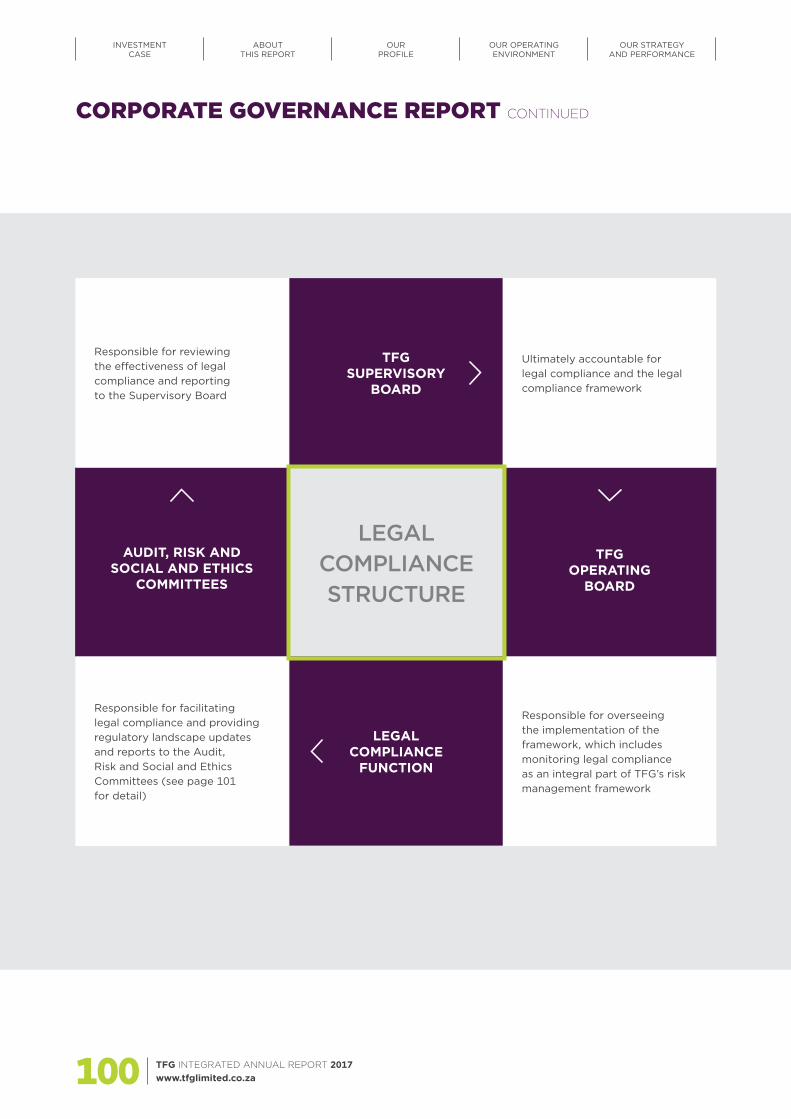
TFG INTEGRATED ANNUAL REPORT 2017 www.tfglimited.co.za100
INVESTMENT CASE
ABOUTTHIS REPORT
OUR PROFILE
OUR OPERATINGENVIRONMENT
OUR STRATEGY AND PERFORMANCE
CORPORATE GOVERNANCE REPORT CONTINUED
TFG SUPERVISORY
BOARD
TFG OPERATING
BOARD
AUDIT, RISK AND SOCIAL AND ETHICS
COMMITTEES
LEGAL COMPLIANCE
FUNCTION
Responsible for facilitating legal compliance and providing regulatory landscape updates and reports to the Audit, Risk and Social and Ethics Committees (see page 101 for detail)
Responsible for reviewing the effectiveness of legal compliance and reporting to the Supervisory Board
Responsible for overseeing the implementation of the framework, which includes monitoring legal compliance as an integral part of TFG’s risk management framework
Ultimately accountable for legal compliance and the legal compliance framework
LEGAL COMPLIANCESTRUCTURE

101
LEGAL COMPLIANCEThe diagram on the left sets out our legal compliance structure, with ultimate accountability at Supervisory Board level.
The functioning and purpose of the legal compliance function is documented in TFG’s Legal Compliance Policy, which is in accordance with chapter 6 of King III and will be revised to be in line with principle 13 in King IV.
The management of legal compliance risk refers to the current and future risk of damage or harm to TFG’s business model or objectives, reputation and financial soundness, which arises from not adhering to regulatory requirements.
The responsibilities of the legal compliance function include:
• reporting to the Audit, Risk and Social and Ethics Committees;
• assessing the legal compliance environment of a new country TFG intends to trade in;
• identifying, reviewing and advising TFG on existing, new or draft legislation, including giving recommendations on applicable rules;
• facilitating legal compliance with relevant laws and rules;
• assigning responsibility for areas of legal compliance;• facilitating legal compliance with internal policies,
rules, guidelines and procedures;• drafting legal compliance risk management plans for
key pieces of legislation;• compiling legal compliance risk registers that form
part of the wider risk management process within TFG;• monitoring legal compliance by the business and
reporting on findings to executive and senior management;
• drafting and submitting statutory legal compliance reports to regulators;
• liaising with regulators on regulatory reporting and legislative changes; and
• lobbying policymakers and lawmakers on draft, new or amendments to laws.
During the 2017 financial year, the focus of legal compliance has broadly been on:
• facilitating compliance with amendments to credit legislation;
• attending Parliament, meeting with regulators, policymakers and lawmakers (both in South Africa and elsewhere in Africa) to impact the legislative landscape;
• obtaining regulatory frameworks and rolling out increased regulatory legal compliance measures to stores in African countries and monitoring adherence thereto;
• supplementing store procedures with tools to increase both levels of compliance and access to legal compliance information;
• rolling out legal compliance culture presentations to all trading and service divisions; and
• monitoring legal compliance in call centres, stores and at head office.
The Legal Compliance team has, as part of a more entrenched combined assurance process, either monitored, or assisted and guided senior management to monitor compliance with legislative requirements. Where there are areas of non-compliance, the team meets with senior management to refine or rethink processes to ensure compliance. This includes reviewing or amending training material for employees, assisting quality assurance team members in addressing non-compliance, training employees, which includes rolling out a legal compliance culture presentation, and assisting internal audit with key checklists.
TFG has recently focused on the following new, amended or draft laws or the legislative environment in general:
• South Africa – National Credit Act’s Affordability Regulations – Proposed amendments to the National Credit Act
concerning debt relief – Numerous financial sector legislative
changes affecting TFG’s optional customer insurance products
– Proposed amendments to the Financial Intelligence Centre Act’s subordinate legislation
– Protection of Personal Information Act (partly effective)
• Africa – National Equitable Economic Empowerment Bill
(Namibia) – Consumer Credit Act (Swaziland)
PERFORMANCEREVIEW
OUR GOVERNANCEPROFILE
SUMMARY CONSOLIDATED FINANCIAL STATEMENTS APPENDICES NOTICE OF ANNUAL
GENERAL MEETING ADMINISTRATION

TFG INTEGRATED ANNUAL REPORT 2017 www.tfglimited.co.za102
• Australia – Corporations Act – Retail Leases Amendment (Review) Bill
(New South Wales) • UK-based operations
– Brexit-related matters, specifically the EU (Notification of Withdrawal) Act and the possible contents of the Great Repeal Bill
– Data Protection Act and EU General Data Protection Regulation (not effective)
– Modern Slavery Act Of these, TFG will focus on the following in the next financial year (as well as any other legislative developments that may arise and are relevant):
• Proposed amendments to the National Credit Act concerning debt relief
• Financial sector changes affecting TFG’s optional customer insurance products
• Proposed amendments to the Financial Intelligence Centre Act’s subordinate legislation
• Protection of Personal Information Act (partly effective) and its regulations that are to be drafted
• Brexit-related matters • Localisation, money laundering and consumer credit
legislation in the African countries TFG trades in
TFG’S COMMITMENTS TO RULES, CODES, STANDARDS, INITIATIVES AND FRAMEWORKS
TFG is affected by, adheres to, or uses as guidance in its operations, non-binding rules, codes, standards, initiatives and frameworks, including:
• Advertising Standards Authority of South Africa – various codes
• Information technology standards and governance frameworks
• Payment Card Industry Data Security Standard • Europay, Mastercard and Visa Standard for credit
and debit payment cards • Carbon and Water Disclosure Project • Kimberley Process• Global Reporting Initiative • Local procurement policies and initiatives in the
African countries TFG trades in
TFG has working groups and project boards in place to ensure that there are impact assessments for significant new laws and amendments. Thereafter, timelines, implementation areas and business owners to implement changes are agreed.
Based on key laws that are effective as at 31 March 2017, there were no material areas of non-compliance.
CORPORATE GOVERNANCE REPORT CONTINUED
INVESTMENT CASE
ABOUTTHIS REPORT
OUR PROFILE
OUR OPERATINGENVIRONMENT
OUR STRATEGY AND PERFORMANCE

103
AUDIT COMMITTEE REPORT
Financial results• to make submissions to the Supervisory Board on any
matter concerning the Group’s accounting policies, financial controls, records and reporting; and
• to provide, as part of the integrated annual report and annual financial statements, a report by the Audit Committee.
Duties assigned and delegated by the Supervisory BoardGeneral• to ensure that the respective roles and functions
of external audit and internal audit are sufficiently clarified and coordinated and that the combined assurance received is appropriate to address all significant risks; and
• to assist the Supervisory Board in carrying out its risk management and IT responsibilities.
External auditors• to consider and respond to any questions from the
Supervisory Board and shareholders regarding the resignation or dismissal of the external auditors, if necessary;
• to review and approve the external audit plan; and • to ensure that the scope of the external audit has no
limitations imposed by executive management and that there is no impairment on its independence.
Internal control and internal audit• to review the effectiveness of the Group’s systems of
internal control, including internal financial control and risk management, and to ensure that effective internal control systems are maintained;
• to ensure that written representations on internal controls are submitted to the Supervisory Board annually by all divisional managing directors and general managers (these being representations that provide assurance on the adequacy and effectiveness of the Group’s systems of internal control);
• to monitor and supervise the effective functioning and performance of the internal audit function;
• to review and approve the annual internal audit plan and the internal audit charter;
• to ensure that the scope of the internal audit function has no limitations imposed by executive management and that there is no impairment on its independence; and
• to review that appropriate internal controls and an internal audit plan are prepared to cover the TFG International operations.
The Audit Committee is pleased to present its report for the financial year ended 31 March 2017 to the shareholders of TFG.
This report is in compliance with the requirements of the Companies Act of South Africa, No. 71 of 2008, as amended (the Act), and the King Code of Governance for South Africa 2009 (King III).
AUDIT COMMITTEE MANDATEThe committee is governed by a formal Audit Committee charter that has recently been reviewed and incorporates all the requirements of the Act. This charter guides the committee in terms of its objectives, authority and responsibilities, both statutory and those assigned by the Supervisory Board.
The Audit Committee recognises its important role as part of the risk management and corporate governance processes and procedures of TFG.
DUTIES OF THE COMMITTEEThe duties of the Audit Committee are, inter alia:
Statutory duties as prescribed in the ActGeneral• to receive and deal appropriately with any concerns
or complaints (whether internal, external or on its own initiative) relating to the accounting practices and internal audit of TFG, the content or auditing of TFG’s financial statements, the internal financial controls of TFG or any related matter.
External auditors• to evaluate the independence, effectiveness and
performance of the external auditors;• to obtain assurance from the auditors that adequate
accounting records are being maintained and that appropriate accounting policies are in place, which have been consistently applied;
• to evaluate the appointment of the external auditors on an annual basis and to ensure that such appointment is in terms of the provisions of the Act and any other legislation;
• to approve the audit fee and fees in respect of any non-audit services; and
• to determine the nature and extent of any non-audit services the auditors may provide to the Group and to pre-approve proposed agreements for non-audit services.
PERFORMANCEREVIEW
OUR GOVERNANCEPROFILE
SUMMARY CONSOLIDATED FINANCIAL STATEMENTS APPENDICES NOTICE OF ANNUAL
GENERAL MEETING ADMINISTRATION
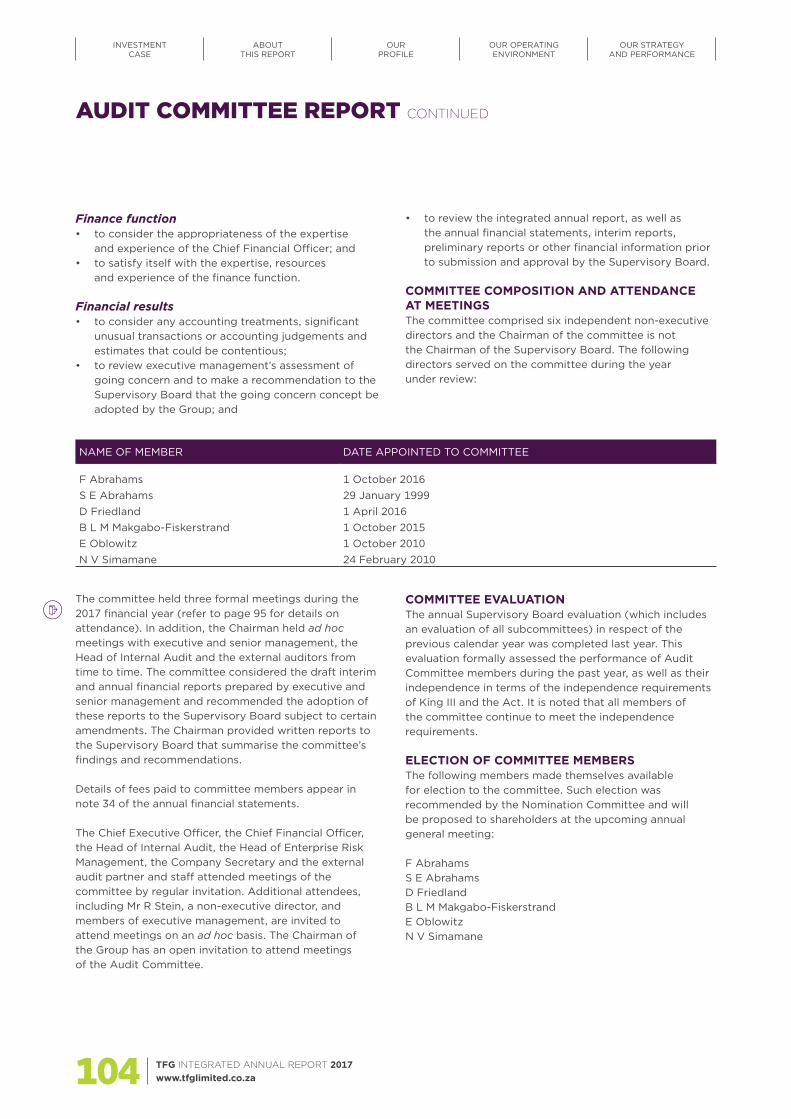
TFG INTEGRATED ANNUAL REPORT 2017 www.tfglimited.co.za104
INVESTMENT CASE
ABOUTTHIS REPORT
OUR PROFILE
OUR OPERATINGENVIRONMENT
OUR STRATEGY AND PERFORMANCE
Finance function• to consider the appropriateness of the expertise
and experience of the Chief Financial Officer; and• to satisfy itself with the expertise, resources
and experience of the finance function.
Financial results• to consider any accounting treatments, significant
unusual transactions or accounting judgements and estimates that could be contentious;
• to review executive management’s assessment of going concern and to make a recommendation to the Supervisory Board that the going concern concept be adopted by the Group; and
• to review the integrated annual report, as well as the annual financial statements, interim reports, preliminary reports or other financial information prior to submission and approval by the Supervisory Board.
COMMITTEE COMPOSITION AND ATTENDANCE AT MEETINGSThe committee comprised six independent non-executive directors and the Chairman of the committee is not the Chairman of the Supervisory Board. The following directors served on the committee during the year under review:
The committee held three formal meetings during the 2017 financial year (refer to page 95 for details on attendance). In addition, the Chairman held ad hoc meetings with executive and senior management, the Head of Internal Audit and the external auditors from time to time. The committee considered the draft interim and annual financial reports prepared by executive and senior management and recommended the adoption of these reports to the Supervisory Board subject to certain amendments. The Chairman provided written reports to the Supervisory Board that summarise the committee’s findings and recommendations.
Details of fees paid to committee members appear in note 34 of the annual financial statements.
The Chief Executive Officer, the Chief Financial Officer, the Head of Internal Audit, the Head of Enterprise Risk Management, the Company Secretary and the external audit partner and staff attended meetings of the committee by regular invitation. Additional attendees, including Mr R Stein, a non-executive director, and members of executive management, are invited to attend meetings on an ad hoc basis. The Chairman of the Group has an open invitation to attend meetings of the Audit Committee.
COMMITTEE EVALUATIONThe annual Supervisory Board evaluation (which includes an evaluation of all subcommittees) in respect of the previous calendar year was completed last year. This evaluation formally assessed the performance of Audit Committee members during the past year, as well as their independence in terms of the independence requirements of King III and the Act. It is noted that all members of the committee continue to meet the independence requirements.
ELECTION OF COMMITTEE MEMBERSThe following members made themselves available for election to the committee. Such election was recommended by the Nomination Committee and will be proposed to shareholders at the upcoming annual general meeting:
F AbrahamsS E AbrahamsD FriedlandB L M Makgabo-FiskerstrandE OblowitzN V Simamane
NAME OF MEMBER DATE APPOINTED TO COMMITTEE
F Abrahams 1 October 2016S E Abrahams 29 January 1999D Friedland 1 April 2016B L M Makgabo-Fiskerstrand 1 October 2015E Oblowitz 1 October 2010N V Simamane 24 February 2010
AUDIT COMMITTEE REPORT CONTINUED

105
• receiving and dealing appropriately with any relevant concerns or complaints;
• making submissions to the Supervisory Board on any matter concerning the company’s accounting policies, financial controls, records and reporting; and
• performing other oversight functions as determined by the Supervisory Board.
INTERNAL FINANCIAL CONTROL AND INTERNAL AUDITBased on the assessment of the system of internal financial control conducted by internal audit, as well as information and explanations given by executive and senior management and discussions held with the external auditors on the results of their audit, the committee is of the opinion that TFG’s system of internal financial control is effective and forms a basis for the preparation of reliable financial statements in respect of the year under review.
In addition, during the 2017 financial year, the committee was not made aware of any:
• material breaches of any laws or regulations; or• material breaches of internal controls or procedures.
A major development introduced during the current financial year from an internal audit perspective has been the approach to analytically examine and interrogate the store data in an attempt to highlight weaknesses. This work has involved the development of IT software to enable intelligent scrutiny of stores’ data. Although this is still work in progress, the Audit Committee, the Risk Committee and senior management believe this initiative is essential to achieve better coverage of critical issues, particularly given the sizeable growth in new stores that has occurred both in Southern Africa and via our recent international acquisitions.
JSE MONITORING REVIEWDuring the year, TFG was selected by the JSE as one of 56 listed companies subject to proactive monitoring of our financial statements. Although this was a challenging process for TFG from a cost, resource and timing perspective, we support the JSE’s intent to ensure high quality disclosure which provides meaningful information to the users of our reports. No material concerns were raised, confirming the integrity of the Group’s financial information.
RISK MANAGEMENTWhile the Supervisory Board is ultimately responsible for the maintenance of an effective risk management process, the committee, together with the Risk Committee, assists the Supervisory Board in the assessment of the adequacy of the risk management process. The Chairman of this committee has an open
COMMITTEE FUNCTIONINGThe committee typically meets three times a year, with the main focus of each respective meeting being as follows:
• Consideration of control risks and risk management (typically in March each year)
• Approval of annual results (typically in May each year)
• Approval of interim results (typically in November each year)
Independently of executive management, members of the committee meet separately with the Head of Internal Audit and the external auditors respectively. The Head of Internal Audit reports directly to the Audit Committee.
Meeting dates and topics are agreed well in advance each year. Each meeting is preceded by the distribution of an Audit Committee pack to each attendee, comprising, inter alia:
• a detailed agenda;• minutes of the previous meeting;• a report by the external auditors; and• written reports by executive and senior management
including: – compliance and legal, – IT governance, – internal audit, – loss statistics, and – fraud.
The Chairman of this committee has an open invitation to attend meetings of the Risk Committee.
SPECIFIC RESPONSIBILITIESThe committee confirms that it has carried out its functions in terms of the Audit Committee charter and section 94(7) of the Act, by:
• confirming the nomination of KPMG Inc. as the Group’s registered auditors for the year ending 31 March 2018 and being satisfied that they are independent of the company;
• approving the terms of engagement and fees to be paid to KPMG Inc.;
• ensuring that the appointment of KPMG Inc. complies with the provisions of the Act;
• determining the nature and extent of any non-audit services, which the external auditors provide to the company or a related company;
• pre-approving proposed agreements with KPMG Inc. for the provision of any non-audit services;
• preparing this report for inclusion in the annual financial statements and in the integrated annual report;
PERFORMANCEREVIEW
OUR GOVERNANCEPROFILE
SUMMARY CONSOLIDATED FINANCIAL STATEMENTS APPENDICES NOTICE OF ANNUAL
GENERAL MEETING ADMINISTRATION

TFG INTEGRATED ANNUAL REPORT 2017 www.tfglimited.co.za106
INVESTMENT CASE
ABOUTTHIS REPORT
OUR PROFILE
OUR OPERATINGENVIRONMENT
OUR STRATEGY AND PERFORMANCE
AUDIT COMMITTEE REPORT CONTINUED
invitation to Risk Committee meetings to ensure that relevant information is regularly shared. The committee fulfils an oversight role regarding financial reporting risks, internal financial controls, fraud risk as it relates to financial reporting and information technology risks as they relate to financial reporting.
As reported last year, the continued cooperation with the Risk Committee resulted in further clarification and delineation of the roles and responsibilities of both committees. The strategies adopted by each committee ensure timely review of any internal control weakness identified by any of the assurance providers. In addition, there were significant improvements in the development of Enterprise Risk Management (ERM) methodologies, which will further enhance the Group’s risk management coverage and focus.
Further details on the risk management approach and process are included in the Risk Committee report, which appears on page 116.
PHASE EIGHT AND WHISTLESVarious workshops were arranged and will continue to be convened with the object of fully integrating the Phase Eight and Whistles operations into the overall risk management framework of the Group. Internal audit drew up an audit plan to cover the major risks identified and audits were conducted to cover those risks. No major concerns surfaced from their initial audit work, although it must be appreciated that it is still work in progress to achieve full integration into the Group’s risk management framework.
The focus for the 2017 year end was directed at verifying the carrying values of stock and trade debtors. Both internal and external audit provided the Audit Committee with positive reports on these significant asset classes.
THE FINANCIAL AND BUSINESS ENVIRONMENTAs presented in the previous years’ integrated annual reports, the concerns expressed in this report that relate to the financial and business environment remain relevant and are accordingly presented in this report once again.
The South African political turmoil that triggered the uncertainty in December 2015 caused by the “ins and outs” of finance ministers, the lack of GDP growth and
hence the inability to increase job creation, the increased regulatory landscape and intermittent interest rate increases all put our credit customers under immense pressure. Regrettably, the political uncertainty that started in the previous financial year has continued. The recent major cabinet reshuffle resulted in two of the rating agencies downgrading South Africa to “junk status”, which is a tragedy in itself. Despite this, it is pleasing to report that, contrary to the unstable and unfavourable macroeconomic environment, TFG in South Africa achieved an improvement in bad debt statistics. This is as a result of a concerted effort to be vigilant to trends and not to attempt to increase customer numbers by lowering the credit granting criteria. Going forward, the Audit Committee will continue to focus on the ability of the Group to curtail bad debts. Supported by an in-depth review undertaken by the external auditors, I can confirm that, in the opinion of the Audit Committee, the provision for doubtful debts is adequate to sustain the year-end carrying value of trade receivables.
As reported last year, executive and senior management has continued with the strategy of negotiating more favourable terms for future funding requirements by having an improved balance among short-term, medium-term and longer-term facilities. Although there had always been significant funding headroom, the quality of the headroom is currently much improved.
The Group continues to place importance on IT risk management and consistently reviews the measures to curb the threat of cybercrime and IT fraud in general. The governance over the IT support system is considered to be best of breed and complies with the recommendations contained in King III.
Regrettably, the Group continues to suffer from ever-increasing financial loss arising from increased levels of crime-related incidents. Senior management continues to explore ways to reduce or curtail these operating losses. Continuous enhancements to the specialist ERM division, which has also been bolstered by the hiring of a forensics and security expert, are some of the initiatives being introduced to examine ways to make our stores, distribution centres, etc. more secure. The major contributor to increased losses being incurred has arisen from a spate of armed robberies.

107
EXTERNAL AUDITORSThe Group’s external auditors are KPMG Inc. and the designated partner is Mr P Farrand. KPMG Inc. is afforded unrestricted access to the Group’s records and management, and presents any significant issues arising from the annual audit to the committee. In addition, Mr P Farrand, where necessary, raises matters of concern directly with the Chairman of the committee.
The committee gave due consideration to the independence of the external auditors and is satisfied that KPMG Inc. is independent of the Group and executive and senior management and therefore able to express an independent opinion on the Group’s annual financial statements.
The committee nominated, for approval at the annual general meeting, KPMG Inc. as the external auditors and Mr P Farrand as designated auditor for the 2018 financial year, having satisfied itself that the audit firm and designated audit partner are accredited by the JSE. It is a JSE requirement that both the designated auditor and audit firm are accredited.
FINANCIAL STATEMENTSThe committee reviewed the financial statements of the Group and is satisfied that they comply with International Financial Reporting Standards (IFRS) and the requirements of the Act of South Africa.
In addition, the committee reviewed executive management’s assessment of going concern and recommended to the Supervisory Board that the going concern concept be adopted by TFG.
INTEGRATED ANNUAL REPORTThe committee fulfils an oversight role in respect of TFG’s integrated annual report. In this regard, the committee gave due consideration to the need for assurance on the sustainability information contained in this report and concluded that obtaining independent assurance would not be beneficial to stakeholders.
The committee considered the sustainability information as disclosed in the integrated annual report, assessed its consistency with the annual financial statements and sustainability overview, and is satisfied that the sustainability information is in no way contradictory to that disclosed in the annual financial statements.
Although this integrated annual report has been prepared in compliance with the code and principles of King III, the committee has reviewed the changes required by King IV and will incorporate these in the preparation of next year’s integrated annual report. In essence, it should be pointed out that TFG will need to make very few changes as most of the King IV principles are already in place.
The committee has also been receiving regular reports from TFG Finance and Advisory on TFG’s readiness to introduce the substantial changes in accounting that will result from the introduction of IFRS 9, 15 and 16 over the next few years. It is confidently anticipated that TFG will be ready to meet the timetables for the introduction of all these revised accounting standards.
EXPERTISE OF FINANCIAL DIRECTOR AND FINANCE FUNCTIONThe committee considers the appropriateness of the expertise and experience of the Chief Financial Officer and finance function on an annual basis.
In respect of the above requirement, the committee believes that Mr A E Thunström, the Chief Financial Officer, possesses the appropriate expertise and experience to meet his responsibilities in that position.
The committee further considers that the expertise, resources and experience of the finance function are appropriate based on the nature, complexity and size of the Group’s operations.
APPROVALThe committee recommended the approval of the annual financial statements and the integrated annual report to the Supervisory Board.
S E AbrahamsChairman: Audit Committee
29 June 2017
PERFORMANCEREVIEW
OUR GOVERNANCEPROFILE
SUMMARY CONSOLIDATED FINANCIAL STATEMENTS APPENDICES NOTICE OF ANNUAL
GENERAL MEETING ADMINISTRATION

INVESTMENT CASE
ABOUTTHIS REPORT
OUR PROFILE
OUR OPERATINGENVIRONMENT
OUR STRATEGY AND PERFORMANCE
TFG INTEGRATED ANNUAL REPORT 2017 www.tfglimited.co.za108

109
SOCIAL AND ETHICSCOMMITTEE REPORT
• the implementation of action items arising from the United Nations Global Compact Principles;
• compliance with consumer laws; and • a review of TFG’s sustainability strategy and its
implementation, including the approval of TFG’s Sustainability overview report.
At this stage, there are no specific matters the committee would like to bring to the attention of shareholders. The committee is satisfied with the efforts and activities undertaken by TFG in each of the areas falling within the committee’s mandate. However, additional details on transformation are provided as it remains a key focus area.
Details of fees paid to committee members appear in the Remuneration Committee report on page 119.
TRANSFORMATION REPORT The Supervisory Board recognises the critical role it has to play in the transformation process. The Supervisory Board’s Social and Ethics Committee, through its governance and oversight role, ensures that an appropriate transformation strategy exists that is aligned with the Broad-Based Black Economic Empowerment Act (BBBEE) and the associated codes of good practice.
At its meetings during the 2017 financial year, the committee received feedback detailing matters relevant to each of the functional areas within its transformation mandate. The committee specifically dealt with the following aspects: TFG’s BBBEE scorecard and related matters, the alignment of TFG’s transformation strategy with the BBBEE Act and each of the individual BBBEE elements as well as the various transformation surveys TFG participated in.
Transformation strategyThe role of the committee is to achieve sustainable empowerment and it has an ongoing responsibility to govern and oversee all aspects of the Group’s BBBEE strategies, namely ownership, management control, skills development, enterprise and supplier development and socio-economic development.
Each year, the transformation strategy is reviewed and clear guidelines are defined for each of the five elements of BBBEE.
AFRICA
The Social and Ethics Committee is pleased to present its report for the financial year ended 31 March 2017 to the shareholders of TFG.
COMMITTEE MANDATEThe committee is responsible for assisting the Supervisory Board with the monitoring and reporting of social, ethical, transformational and sustainability practices that are consistent with good corporate citizenship, and assisting the Group in discharging its business responsibilities in relation thereto.
The committee is governed by a formal charter, which guides the committee in terms of its objectives, authority and responsibilities. The charter incorporates the requirements of the Companies Act, specifically regulation 43(5).
The focus areas of the committee are detailed on page 97. In discharging its duties, the committee takes into consideration any relevant legislation, other legal requirements or prevailing codes of best practice.
TFG’s online Sustainability overview report deals with some of the aspects falling within the mandate of the committee, such as the environment.
COMMITTEE COMPOSITION AND ATTENDANCE AT MEETINGSThe committee comprises three independent non-executive directors and one executive director, being the CEO. In addition, the CFO and other TFG executives attend meetings of this committee by invitation.
The committee held two meetings during the 2017 financial year, attended by all members (refer to page 95). At each of these meetings, the committee received reports detailing matters relevant to each of the areas within its mandate. The committee specifically dealt with:
• local supply chain development;• employee empowerment;• transformation;• wage negotiations and labour law developments; • resource efficiency, which included environmental
metrics for waste, electricity consumption, paper use and recyclables;
• corporate social investment initiatives;• governance, ethics and accountability;
PERFORMANCEREVIEW
OUR GOVERNANCEPROFILE
SUMMARY CONSOLIDATED FINANCIAL STATEMENTS APPENDICES NOTICE OF ANNUAL
GENERAL MEETING ADMINISTRATION

TFG INTEGRATED ANNUAL REPORT 2017 www.tfglimited.co.za110
INVESTMENT CASE
ABOUTTHIS REPORT
OUR PROFILE
OUR OPERATINGENVIRONMENT
OUR STRATEGY AND PERFORMANCE
SOCIAL AND ETHICS COMMITTEE REPORT CONTINUED
Our performanceTFG was rated* a level 7 contributor by Empowerdex, an accredited economic empowerment rating agency (based on information in respect of the year ended 31 March 2017). Our performance over the past two years is recorded below.
BBBEE element MAXIMUM2017
ACHIEVED2016
ACHIEVED
Ownership 25,0 12,31 13,48Management control 19,0 6,15 6,36Skills development 20,0 13,95 14,35Enterprise and supplier development 40,0 18,55 18,65Socio-economic development 5,0 5,00 5,00Total 109,0 55,96 57,84Empowering supplier Yes YesProcurement recognition level 50,0% 50,0%Discounting principle applicable No YesRecorded procurement recognition level 50,0% 10,0%BBBEE recognition level contributor Level 7 Level 8
* TFG was rated under the amended codes of good practice for the financial years ending 2017 and 2016.
We are pleased to report that TFG was ranked second in the 2016 Business Report Top 100 Most Empowered Companies survey within the retail sector. (At the time of the above survey, TFG’s BBBEE scorecard was based on the old codes of good practice).
Equity ownershipIn terms of paragraph 3.4.5 of code 100, statement 100 of the codes of good practice, TFG appointed an external research organisation to undertake a competent person’s report to estimate the extent of black rights measurable in TFG, originating from mandated investments. A score of 12,31 points was achieved and has been included in our verification certificate.
Management controlIn respect of 2017, TFG achieved a score of 6,15 points out of a maximum of 19 points.
Supervisory Board and Operating BoardThe representivity of our Supervisory and Operating Boards remains a focus area and is being achieved through securing black non-executive directors and executives through a continued focus on diversity in the succession planning and talent management processes.
Employment equityEmployment equity continues to be a critical aspect of TFG’s transformation strategy. In line with this, the alignment of Group and divisional targets with the national
economically active population of South Africa remains a key focus. A graphical illustration representing the diversity of our Supervisory Board is presented in the Corporate governance report on page 92.
TFG’s representation of employees in designated groups to the total employee workforce continues to increase steadily year on year (from 90,36% in 2013 to 93,22% in 2017). Employment equity progress at senior and middle management levels remains a key strategic focus area, with hiring and development opportunities aligned to the selection of employees from designated groups.
The reinforcement of TFG’s new talent acquisition strategy, supported by a strong employee value proposition, has yielded success in the appointment of top equity talent at senior and middle management levels across the Group. The framework for this new operating model is underpinned by a team of specialists who use a variety of new recruitment methodologies and techniques to ensure that we attract and secure top equity talent within the passive candidate market for all levels of skills.
A number of pilot initiatives were also driven within our customer-facing environments. A new high-volume solution has been introduced to ensure we also attract and secure top equity talent for critical roles in our field and stores. This recruitment solution takes a high volume of candidates through a series of assessments via an assessment centre day.

111
Summary of demographic representation of South African employee complement*
AFRICAN COLOURED INDIAN WHITEFOREIGN
NATIONALTOTAL BLACK
2013 Actual 52,98% 32,81% 4,57% 9,21% 0,43% 90,36%2014 Actual 54,21% 32,39% 4,27% 8,87% 0,26% 90,87%2015 Actual 56,54% 31,36% 3,75% 8,03% 0,32% 91,65%2016 Actual 58,64% 30,08% 3,53% 7,45% 0,30% 92,25%2017 Actual 60,88% 28,99% 3,35% 6,55% 0,23% 93,22%
* TFG’s South African workforce profile as at 31 March 2017.
Youth unemployment continues to be a challenge in our country. A Talent Acquisition team has now been dedicated to look at a progressive and flexible approach to recruit young unemployed graduates from diverse academic backgrounds, with a strong focus on candidates from designated groups. Multiple avenues have been explored, and strategic partnerships with institutions of learning, NGOs, NPOs and government initiatives have been forged to educate, uplift and inform the youth of potential careers within the retail sector while focusing on TFG’s transformation and equity objectives. The TFG Retail Academy creates various pathways to our talent pipelines with specific focus on strong equity talent. In 2017, a substantial 93% of the 31 trainees appointed
were from designated groups, while more than half of these appointments were African Black candidates. Progress in this regard continues to be exceptional – we have seen a 16% increase from last year where 80% of trainee appointments were from designated groups.
To support this, talent attraction strategies have been targeted to equity talent, with a particular focus on African Black candidates in the market. Selection methods have also been reviewed and improved to position TFG as an employer of choice.
Trainee programme demographics as at 31 March 2017
RACE GENDER
AFRICAN COLOURED INDIANFOREIGN
NATIONAL WHITETOTAL BLACK FEMALE MALE
2013 17,24% 37,93% 10,34% 6,90% 27,59% 65,51% 68,97% 31,03%2014 15,62% 43,75% 3,13% 3,13% 34,37% 62,50% 71,87% 28,13%2015 20,69% 27,59% 10,34% 0,00% 41,38% 58,62% 68,97% 31,03%2016 37,50% 37,50% 5,00% 0,00% 20,00% 80,00% 70,00% 30,00%2017 41,85% 44,19% 6,98% 0,00% 6,98% 93,03% 70,00% 30,00%
Executive development and retention initiatives, including the allocation of shares, have been part of the drive to recognise and retain key individuals in professional middle management. It remains a strategic area of our talent management strategy.
In terms of disabilities, TFG is committed to promote a disabled-friendly environment to actively encourage equality and inclusion of all employees. We continue to seek opportunities for disabled employees, secured through various initiatives such as learnerships.
PERFORMANCEREVIEW
OUR GOVERNANCEPROFILE
SUMMARY CONSOLIDATED FINANCIAL STATEMENTS APPENDICES NOTICE OF ANNUAL
GENERAL MEETING ADMINISTRATION

TFG INTEGRATED ANNUAL REPORT 2017 www.tfglimited.co.za112
INVESTMENT CASE
ABOUTTHIS REPORT
OUR PROFILE
OUR OPERATINGENVIRONMENT
OUR STRATEGY AND PERFORMANCE
SOCIAL AND ETHICS COMMITTEE REPORT CONTINUED
Summary of our South African employee complement as at 31 March 2017
Occupational level
MALE FEMALEFOREIGN
NATIONALGRAND TOTALA C I W A C I W MALE FEMALE
Permanent 3 681 1 422 165 356 7 970 4 155 480 919 27 17 19 1921. Top management 7 1 1 1 102. Senior management 3 11 13 88 5 20 4 87 1 2323. Professional middle
management 63 137 34 155 65 206 58 339 13 5 1 0754. Skilled junior
management 524 340 46 67 1 455 1 411 148 355 7 6 4 3595. Semi-skilled 2 989 862 72 39 6 389 2 397 268 136 5 5 13 1626. Unskilled 102 72 56 121 1 1 1 354Temporary 136 32 7 3 142 71 5 5 0 2 403Grand total 3 817 1 454 172 359 8 112 4 226 485 924 27 19 19 595
* The information provided in this table relates to TFG’s South African workforce only.
The bar graph below illustrates the workplace profile in terms of racial representation for the period from 2013 to 2017.
0
10
20
30
40
50
60
70
80
90
100
Total BlackWhiteForeign NationalIndianColouredAfrican
52,9
8%
54,2
1%
56,5
4%
58,6
4%
60,8
8%
32,8
1%
32,3
9%
31,3
6%
30,0
8%
28,9
9%
3,35
%
0,23
%
6,55
%
93,2
2%
4,57
%
4,27
%
3,75
%
3,53
%
9,21
%
8,87
%
8,03
%
7,45
%
0,43
%
0,26
%
0,32
%
0,30
%
90,3
6%
90,8
7%
91,6
5%
92,2
5%
2017 Actual
2016 Actual
2015 Actual
2014 Actual
2013 Actual

113
Skills development TFG continues to support the government’s strategy of job creation and skills development by investing in key skills needed to sustain and grow the retail sector and its own workforce. The Group’s talent development strategy was reimplemented during the past financial year. The focus has been on driving development for our customer-facing employees via the TFG Retail Academy. Two learning pathways were launched in the first year, namely the store manager pathway and the area manager pathway. Our learning pathways consist of programmes that are grouped into three categories: Learn, Grow and Achieve.
Our SETA initiatives are also incorporated into our Academy, giving our customer-facing employees the opportunity to develop their retail and leadership skills.
The programmes address training needs such as onboarding new store and area managers, supporting store managers on how to best optimise the performance of their stores, and enhancing coaching skills and general leadership via programmes such as the Retail Management Development programme. To date, we have retained approximately 88% of our participants in the TFG Retail Academy. We envisage more work to be done in developing our merchants so that they are able to optimise our supply chain across the Group.
The number of training interventions attended by all South African employees has increased by 8,5%.
2017 2016 2015 2014 2013
Total number of training interventions attended by all employees 125 741 115 907 117 737 117 341 126 021Total number of training interventions attended by black employees
121 293(96% of total)
107 707(93% of total)
107 619(91% of total)
106 907(91% of total)
114 886(91% of total)
Total number of training interventions attended by black female employees
84 040(67% of total)
83 045(72% of total)
88 303(75% of total)
84 847(72% of total)
79 814(63% of total)
Overall cost of training R135 622 900 R124 047 452 R120 569 000 R117 553 778 R110 899 791
Enterprise and supplier developmentPreferential procurementIn respect of 2017, TFG achieved a score of 10,44 points out of a maximum of 25. While there continues to be a strong focus on the composition of our supply base as well as the requirement of our suppliers to provide valid BBBEE certificates/affidavits, this BBBEE element is challenging. Some of the new suppliers’ BBBEE certificates we are receiving, reflect lower BBBEE procurement recognition levels that will start to negatively impact on our preferential procurement score now and in the future.
Enterprise developmentIn respect of 2017, TFG achieved a score of 2,59 points out of a maximum of 5 points.
Enterprise development (ED) is supported by a number of initiatives:
• TFG has committed to support the South African Football Association (SAFA) Development Trust, to establish a Safe-Hub in Alexandria, Johannesburg, and to contribute to its operational expenses over the next four years.
This investment commenced in 2015 with the building of the facility in Alexandria, which was officially opened in December 2016. We will continue to fund this facility and build relationships with the SAFA Development Trust and LFAs (Local Football Associations) within the greater Gauteng area to develop football talent at grass-roots level.
• During the year under review, we also partnered with The Clothing Bank. The Clothing Bank was founded in 2010 and provides unemployed mothers with business skills to empower them to become self-employed business owners. TFG supports The Clothing Bank by contributing merchandise returns to them.
• In addition, we continued to engage with a number of service providers with regard to other opportunities where we can assist in the development of ED beneficiaries/entrepreneurs.
PERFORMANCEREVIEW
OUR GOVERNANCEPROFILE
SUMMARY CONSOLIDATED FINANCIAL STATEMENTS APPENDICES NOTICE OF ANNUAL
GENERAL MEETING ADMINISTRATION

TFG INTEGRATED ANNUAL REPORT 2017 www.tfglimited.co.za114
INVESTMENT CASE
ABOUTTHIS REPORT
OUR PROFILE
OUR OPERATINGENVIRONMENT
OUR STRATEGY AND PERFORMANCE
SOCIAL AND ETHICS COMMITTEE REPORT CONTINUED
Supplier developmentIn respect of 2017, TFG achieved a score of 5,52 points out of a maximum of 10 points.
The development of our local supply base is supported by a number of supply chain enhancement initiatives, which are in place through TFG Manufacturing and our CMTs.
Supplier development initiatives, such as preferential payment terms, loans, the transfer of skills and raw material procurement, continued with New Coe Knits, a knitwear supplier, and Joe’s Scatter Cushions, a supplier of household textiles.
Socio-economic developmentIn respect of 2017, we achieved a score of 5 points out of a maximum of 5 points.
TFG’s main focus is to create opportunities for employment by leading sustainable developments. We aim to “Educate to Empower (E2E)” across all educational levels – from early childhood development to post-school education. This strategy allows us to make meaningful contributions and to significantly impact our communities.
YOUNGER BOYS COSMO S49
KIDS SMALL FRAME 413 x 298mm.indd 49 08/06/2016 12:10
YOUNGER GIRLS GREENWICH VILLAGE S41
KIDS SMALL FRAME 413 x 298mm.indd 41 08/06/2016 12:09
A shared value mindset has become increasingly important within our business and therefore we have strategically partnered with a number of organisations to successfully implement our strategy.
Socio-economic development (SED) has also provided many TFG employees the opportunity to transfer their business skills to ensure that all SED flagship projects are optimally run. Therefore, our investment is more than just monetary as our employees form part of our doing good journey.
Further information on our projects can be found in the TFG Sustainability overview report.
F AbrahamsChairperson: Social and Ethics Committee
29 June 2017

115
NOMINATIONCOMMITTEE REPORT
The committee held two meetings during the 2017 financial year, attended by all members (refer to page 95). The key issues that were considered by the committee during the current year included the following:
• Review and amend all the Supervisory Board subcommittees’ composition to ensure appropriate mix of skills
• Review and make recommendations to the Supervisory Board in respect of the policy relating to the promotion of gender and race diversity at Supervisory Board level
• Review and make recommendations to the Supervisory Board in respect of the composition of and terms of reference for the Finance Committee, an ad hoc committee of the Supervisory Board
• Oversee the Supervisory Board evaluation process • CEO and general succession
M Lewis Chairman: Nomination Committee
29 June 2017
The Nomination Committee is pleased to provide a report of their activities for the 2017 financial year.
NOMINATION COMMITTEE MANDATEThe committee is governed by a charter that sets out its mandate and key responsibilities, and reports are provided to the Supervisory Board on a quarterly basis. The committee fulfilled its responsibilities in accordance with its charter during the 2017 financial year.
DUTIES OF THE COMMITTEEThe key responsibilities of the committee are detailed on page 99 of this report.
COMMITTEE COMPOSITION AND ATTENDANCE AT MEETINGSAt the year end, the committee comprised two independent non-executive directors and one non-executive director. In addition, the CEO attends meetings of this committee by invitation.
YOUNGER GIRLS WOODS GROVE S32
KIDS SMALL FRAME 413 x 298mm.indd 34 08/06/2016 12:08
NEWBORN - GIRLS ALPINE S70
PERFORMANCEREVIEW
OUR GOVERNANCEPROFILE
SUMMARY CONSOLIDATED FINANCIAL STATEMENTS APPENDICES NOTICE OF ANNUAL
GENERAL MEETING ADMINISTRATION

INVESTMENT CASE
ABOUTTHIS REPORT
OUR PROFILE
OUR OPERATINGENVIRONMENT
OUR STRATEGY AND PERFORMANCE
RISK COMMITTEEREPORT The Risk Committee is pleased to present its report for the financial year ended 31 March 2017 to the shareholders of TFG.
The Foschini Group Enterprise Risk Management (ERM) framework provides a structured, dynamic and consistent approach to risk management. It is an integrated approach and recognises that effective risk management is critical to the achievement of strategic objectives and the long-term sustainable growth of the business. The process is continuous and risks are updated throughout the year. The framework is in line with relevant standards, including ISO 31000, the COSO framework and the King Code of Governance for South Africa 2009 (King III).
OUR APPROACHOverall, the Supervisory Board is accountable to ensure that risks are effectively managed, and it has delegated the oversight of risk management to the Risk and Audit Committees in terms of two separate mandates. The Risk Committee reviews significant risks and their related mitigations and reports back to the Supervisory Board at each meeting. The Audit Committee focuses on the financial risks and reviews the effectiveness of the risk process. Each business area is responsible for identifying, assessing and managing the risks in their respective area.
Annual risk workshops are held across the Group and identified risks are documented in a risk register and assessed on the basis of likelihood of occurrence and potential impact on the Group (risk exposure). Mitigations are identified against each risk and the remaining residual risk assessed based on defined criteria. The risks with the highest exposure attribution are presented to the Operating Board to be reviewed and challenged ahead of being submitted to the Risk Committee and ultimately the Supervisory Board for review and approval. This process is facilitated by the Group Enterprise Risk function.
Quarterly updates on identified risks, related mitigations and emerging risks are provided to the executive Risk Committee for consideration. Significant matters and any revisions to risks are reported to the Risk Committee. The Group continuously seeks to improve and enhance the risk management process, while maintaining a practical and business-minded approach at the same time. The Supervisory Board’s approach to risk appetite is conservative without inhibiting or unduly restricting the Group from utilising opportunities.
The Supervisory Board confirms that the Group’s risk management, mitigation and monitoring processes have been effective in limiting the potential impact of risks on the business during the year under review.
RISK IDENTIFICATION
MO
NIT
ORIN
G AND REVIEW
INH
ER
EN
T RISK
ASSESSM
ENTRESIDUA
L R
ISK
ASS
ESS
ME
NT
RISK MITIGATION
15
24
3
ENTERPRISE RISK MANAGEMENT
PROCESS
1
Risks highlighted through workshops, assurance reviews, executive and senior management, third parties and other resources are documented in a centrally managed risk register.
2
Risks are assessed in terms of likelihood of occurrence and potential impact on the Group.
3
Mitigating actions are agreed and responsibilities assigned.
4
The effectiveness of the mitigating actions is evaluated and the residual risk determined.
5
Risks are reviewed by the Risk Committee, discussing emerging risks and changes in the risk assessment.
116 TFG INTEGRATED ANNUAL REPORT 2017 www.tfglimited.co.za

117
INFORMATION TECHNOLOGY GOVERNANCEAn IT steering committee has been established, which includes representatives from the various trading and services divisions. The committee meets quarterly and reviews the emerging IT-related risks, disaster recovery plans and any significant IT initiatives. The Risk Committee receives feedback on matters discussed and monitors IT initiatives to ensure these do not pose a risk to the continuity of the Group’s operations.
LEGISLATIVE COMPLIANCEAt each Risk Committee meeting, an update on legal compliance is presented. This update includes a legislative radar or forecast of significant legislative developments in all of the countries in which the Group has a footprint. Key areas of non-compliance, if any, are also brought to the attention of this committee. During the financial year, no fines and/or other forms of sanction were issued
against the Group and no directors or senior management members were accused of or held liable for non-compliance with any laws, regulations or codes of conduct.
Further information on legislative compliance is provided in the Corporate governance report on page 92.
KEY RISKS AND SIGNIFICANT UNCERTAINTIESThe landscape, five continents and 34 countries, in which the Group operates is impacted by the expansion into new territories. Global and local events have led to instabilities in the economy, influencing available capital and our consumer. Our consumer has less disposable income and this increases the risk to turnover and debtor delinquencies. The Group continues to monitor the progress of Brexit and to consider the implications it may have for our UK businesses.
RISK DESCRIPTION MITIGATING ACTIVITIES
Regulatory risksThe South African regulatory environment continues to increase with complexity. This complexity becomes heightened as the Group expands internationally, and as it is faced with understanding and applying differing regulatory requirements in multiple jurisdictions.
• The Group Legal and Compliance department monitors significant risks and provides the business with updates and training as and when required.
• Regular reports are provided to senior management and the Audit and Risk Committees respectively, addressing significant aspects across all jurisdictions in which the Group has a footprint.
The introduction of revised credit legislation continues to pose challenges in terms of compliance and our customer base.
• The Group strategy and related initiatives are in place to grow TFG’s account base and the average spend per account.
• Regular compliance monitoring.
Operational risksContinued high levels of crime (i.e. burglaries and armed robberies but excluding credit fraud) reduces operating margin.
• The Group subscribes to a culture of zero tolerance and has embarked on the roll-out of a revised enhanced security strategy.
• A Forensic department has been established to coordinate investigations, engage with anti-crime forums, other retailers, mobile providers, industry bodies and the South African Police Service.
A fire, flood or other natural disaster affects the warehouses or head office campus.
• Business continuity plans have been developed across the Group. These plans are reviewed annually and are tested on a regular basis.
Failure of IT infrastructure. • Disaster recovery plans are in place across the Group.The weakening economy and/or a financial and/or catastrophic disaster leads to the collapse of key suppliers.
• The Group’s supply chain strategy includes sourcing alternate suppliers and maintaining relationships with relevant government, industry and trade union organisations.
• This includes building sustainable relationships with local suppliers and the continuous performance measurement and grading of suppliers.
• Recommended improvements are discussed and the progress of implementation is regularly assessed.
PERFORMANCEREVIEW
OUR GOVERNANCEPROFILE
SUMMARY CONSOLIDATED FINANCIAL STATEMENTS APPENDICES NOTICE OF ANNUAL
GENERAL MEETING ADMINISTRATION

TFG INTEGRATED ANNUAL REPORT 2017 www.tfglimited.co.za118
RISK COMMITTEE REPORT CONTINUED
INVESTMENT CASE
ABOUTTHIS REPORT
OUR PROFILE
OUR OPERATINGENVIRONMENT
OUR STRATEGY AND PERFORMANCE
RISK DESCRIPTION MITIGATING ACTIVITIES
Economic risksInstability in the economy both locally and globally influences available capital and our consumer.
• The funding strategy is presented to and reviewed by the Supervisory Board annually.
• Treasury meetings are held monthly to review funding requirements and options.
• The Group has an increasingly diversified business model.The impact of global financial instability and the effect of fluctuating exchange rates on purchasing power and the ability to remain price competitive.
• The strategy for purchasing forward cover is reviewed regularly to ensure that it remains relevant and provides the best possible protection against currency fluctuations for committed and future orders.
A stagnant economic climate negatively affects TFG’s customers’ purchasing power and influences their ability to settle accounts.
• The Group continually strives to increase accessibility to a broad spectrum of the market by growing its footprint in varied locations.
• The Group continues to refine credit score models for collections and follow-ups to assist customers in maintaining an open-to-buy position.
• Credit applications are reviewed for fraud indicators and assessed against NCA-compliant internal scorecards, credit bureau scores and verification of employment where necessary. Collection strategies are regularly reviewed with the assistance of internal behavioural and credit bureau scorecards.
The Group’s risks continue to evolve as new risks emerge and appropriate mitigating activities are introduced to reduce the overall residual risk. The following risk has subsequently been removed from this year’s risk register:
• Power outages: During the last two reporting periods, limited power outages have been experienced.
E Oblowitz Chairman: Risk Committee
29 June 2017

119
REMUNERATIONCOMMITTEE REPORT
SECTION A: REPORT FROM THE CHAIRMAN OF THE REMUNERATION COMMITTEE I am pleased to present the Remuneration Committee report for the 2017 financial year on behalf of the Remuneration Committee (Remco). This report summarises the philosophy and principles of and approaches to remuneration at TFG as it applies to executive directors, non-executive directors and other employees. It details the policy and principles set by the Remco for each of the primary components of the remuneration policy. The structure and content of the Remuneration Committee report also take into account best practice requirements of corporate governance as set out in the King Code of Governance for South Africa 2009 and are aligned with the Johannesburg Stock Exchange (JSE) Listings Requirements.
TFG complies with the requirement of “equal pay for work of equal value” in line with the Employment Equity Act, No. 55 of 1998, as amended (the EEA) by recognising and addressing pay inequities between gender and race groups within the Group with specific focus on customer-facing employees.
Remuneration arising from short-term incentives (STI) and long-term incentives (LTI) is linked to the Group’s financial performance.
For the year ended 31 March 2017, the Group did not achieve the required STI target but did achieve the three-year LTI target.
For the three years ended 31 March 2017, the Group achieved the long-term incentive target (LTI) headline earnings per share (HEPS) growth of CPI plus 2%, which resulted in full vesting of the forfeitable performance shares (FSP) and share appreciation rights (SARs). Further details on STI payouts and LTI vesting outcomes are disclosed in section C.
For the year ended 31 March 2017, the Group did not achieve the short-term incentive target (STI) earnings before interest and tax (EBIT). Although EBIT was not at target at Group level, a number of retail brands attained or exceeded their specific targets. Bonuses were paid to eligible employees of these specific retail brands for achieving their STI targets as per the rules of the STI scheme. This arrangement is key to ensuring TFG’s variable pay model remains fit for purpose and competitive in the market.
At Group level, after taking into consideration that actual EBIT was only marginally below threshold target, and that the CEO and CFO made significant strategic contributions to the Group’s international expansion plans, the Remco exercised its discretion and declared a discretionary bonus pool that was lower than the threshold bonus pool.
Executive performance for purposes of STI payments is reviewed by the Remco and measured against predetermined performance measures that are set in advance on an annual basis.
In section C, the remuneration and shareholdings of the directors and prescribed officers of TFG Limited are disclosed, as are the fees paid to non-executive directors. The remuneration packages for directors and senior executives are determined after due consideration of their specific performance, experience and responsibilities. This determination also includes engaging external remuneration consultants as well as performing extensive independent benchmarking exercises of similar roles in companies directly comparable to TFG’s size, industry, complexity and risk profile. During the year, PricewaterhouseCoopers (PwC) gave advice on the latest remuneration trends, specifically on executive and non-executive remuneration, as well as guidance on the application of King IV principles.
The Remuneration Committee report comprises three sections:
Section A Report from the Chairman of the Remuneration Committee, summarising key remuneration considerations and decisions as well as highlighting internal and external factors influencing remuneration during the year under review.
Section B The remuneration philosophy, policy and framework.
Section C The application of the remuneration policy during the year under review.
PERFORMANCEREVIEW
OUR GOVERNANCEPROFILE
SUMMARY CONSOLIDATED FINANCIAL STATEMENTS APPENDICES NOTICE OF ANNUAL
GENERAL MEETING ADMINISTRATION

TFG INTEGRATED ANNUAL REPORT 2017 www.tfglimited.co.za120
INVESTMENT CASE
ABOUTTHIS REPORT
OUR PROFILE
OUR OPERATINGENVIRONMENT
OUR STRATEGY AND PERFORMANCE
REMUNERATION COMMITTEE REPORT CONTINUED
Key decisions and remuneration policy changes approved by the RemcoThe Remco has reviewed and addressed a number of policy aspects for organisation-wide employees. These include:
• Successfully concluded a two-year wage agreement with SACCAWU for all unionised employees, effective 1 September 2016
• Dedicated focus on and review of customer-facing employees’ remuneration components, specifically base pay alignment with the market
• Introduction of three separate employee categories, namely executive employees, middle management and the bargaining unit for annual increase reviews for further alignment with the market
• Further enhanced the “pay for performance” culture in the Group by linking all performance objectives to the Group’s business strategy and by adjusting the bonus payment modifiers and increasing the potential payout gap between acceptable and exceptional performance classifications
• Reviewed and increased the STI on-target multiples for Peromnes Grading System Grades 6 and 7 employees (middle management employees) to ensure competitiveness and alignment with the market, effective 1 April 2017
• Three-year (FY 2017 to FY 2020) return on capital employed (ROCE) targets were proposed by executive management and approved by the Remco during the first half of the year. However, in the latter half of the year, it became apparent that a significant international acquisition such as the recently announced post-year-end acquisition of the Retail
Apparel Group (RAG) of Australia would have a material impact on the determination and setting of long-term ROCE targets. Taking into account that TFG is introducing ROCE as a LTI performance secondary metric for the first time and taking note of the complexity of the various considerations impacting the measurement of ROCE in a large multi-national retailer such as TFG, executive management requested that the original basis of setting ROCE targets be revised. The Remco approved this proposal and requested executive management to present revised ROCE targets for the FY 2016 and FY 2017 share awards during the first half of FY 2018. These targets will be predicated on the fundamental objective of attaining long-term incremental improvement in ROCE and will be reported in the Remuneration Committee report for FY 2018.
Shareholder advisory services and investor engagementWe actively engage with investors on at least an annual basis and this process forms an integral part of reviewing our remuneration policy. We took note of the engagement feedback received from shareholder advisors and our investors that arose from the shareholder approval of the Remuneration Committee report for the 2016 financial year at last year’s annual general meeting (AGM).
The key engagement points raised by shareholder advisors and our investors, and our response to each, are set out in the table alongside.

121
SHAREHOLDER ADVISOR/ INVESTOR COMMENT RESPONSE FROM TFG REMCO/ACTIONS TAKEN
Good level of disclosure in the report. We will continue to enhance and improve the report to ensure international best practices while taking into account specific disclosure items as required by King IV and the JSE Listings Requirements.
Disclosure of ROCE targets as a secondary measure with a 20% weighting, but no actual targets were provided.
As reported above, ROCE targets will be set on the fundamental objective of attaining long-term incremental improvement in ROCE and will be reported in the Remuneration Committee report for FY 2018.
Adequate disclosure of STI and LTI metrics in report. However, TFG omitted to disclose sustainability measures for STI and LTI. Performance targets must include sustainability targets (non-financial).
While we currently do not have non-financial targets linked to LTI, we do incorporate non-financial targets into STI targets through measurement of individual KPIs. The CEO and CFO’s individual performance measures are aligned with TFG’s strategic pillars as detailed on page 64 of the integrated annual report.
Once-off special share award to CEO. The once-off special share award in June 2016 was in accordance with a specific agreement with the CEO to extend his tenure beyond his normal retirement date to ensure a number of critical strategic initiatives/objectives are achieved and to ensure a smooth transition to his successor. The actual performance of the CEO in relation to these objectives will be monitored annually by the Nomination Committee. The special shares will only vest if all of the objectives set have been achieved. This once-off special share award and its rationale was explained in detail in last year’s (FY 2016) Remuneration Committee report.
FSP – performance target of HEPS growth of CPI plus 2% is not stretched enough.
Currently, South African retail is trading in a challenging environment and we believe HEPS growth of CPI plus 2% over a three-year period will provide a robust stretch in this challenging phase of the South African retail cycle.
PERFORMANCEREVIEW
OUR GOVERNANCEPROFILE
SUMMARY CONSOLIDATED FINANCIAL STATEMENTS APPENDICES NOTICE OF ANNUAL
GENERAL MEETING ADMINISTRATION

TFG INTEGRATED ANNUAL REPORT 2017 www.tfglimited.co.za122
REMUNERATION COMMITTEE REPORT CONTINUED
INVESTMENT CASE
ABOUTTHIS REPORT
OUR PROFILE
OUR OPERATINGENVIRONMENT
OUR STRATEGY AND PERFORMANCE
Forward-looking approach One of the Operating Board’s strategic objectives, which ensures organisation-wide fair and equitable remuneration, is to increase the focus on total reward for customer-facing employees. TFG’s commitment is to offer market-related pay and create opportunities that allow employees to grow and succeed in an environment of support, collaboration and respect.
ROCE, introduced as a secondary measure of LTI in the 2017 financial year, has become a key operational and financial focus within the Group. ROCE targets will be predicated on the fundamental objective of attaining long-term incremental improvement in ROCE. For reasons stated earlier in this report, ROCE targets will be reported in the Remuneration Committee report for FY 2018.
We will continue to conduct annual reviews and benchmarking exercises, in particular regarding LTI and STI performance targets, to ensure we remain competitive to the market and align with best practice.
The King IV implementation date is for financial years starting on or after 1 April 2017. Despite only being obliged to implement King IV guidelines for the 2018 financial year, TFG considered King IV guidelines where appropriate for the various sections of the 2017 financial year Remuneration Committee report. However, TFG is committed to fully adopt and comply with the King IV guidelines in the 2018 financial year and will continue to take into account best practice requirements of good corporate governance. Such compliance will further be aided by the King IV practice notes (still due for release).
Shareholder advisory services and investor engagement form an integral part of the Remco’s ongoing review of remuneration policy, and TFG will continue to actively engage with investors on an annual basis. The Remco maintains a proactive approach to consider all emerging and relevant remuneration trends to ensure that remuneration is used as a business tool to create sustainable value within the economic, social and environmental context in which the Group operates.
Annual general meeting (AGM)For the 2016 financial year, TFG received a 53% non-binding advisory vote in favour of the remuneration policy. We consider the outcome as disappointing, especially after our deliberate and in-depth engagement with the investor community. We have taken cognisance of all the feedback received from shareholders and we have once again engaged with the investor community, explained our remuneration policy and highlighted our forward-looking approach towards remuneration. In the light of our progressive approach, we look forward to your positive vote in favour of our 2017 financial year remuneration policy. E OblowitzChairman: Remuneration Committee
29 June 2017

SECTION B: REMUNERATION POLICYPrinciplesTFG’s remuneration policy, as determined by the TFG Remco, aims to attract, engage and retain the best talent that is essential for the implementation of its business strategy and the achievement of its performance objectives while it operates within the Group’s approved risk and governance frameworks. The remuneration policy is an enabler for creating sustainable and long-term positive returns for shareholders. The policy seeks to achieve the following principal objectives:
• External equity – ensuring employees are rewarded in line with the practice in national and retail markets, taking all relevant and appropriate factors into account
• Internal equity – ensuring employees are remunerated correctly in relation to each other, in recognition of their individual contributions and accountabilities
• Performance alignment – ensuring employees are aware of the requirements of strong short-term and long-term performance as well as its rewards
• Appropriate remuneration mix – establishing a balance between base pay, STI and LTI
Remuneration must be balanced with attractive benefits, an enjoyable, ethical and values-based working environment and the opportunity for employees to develop and grow in a respectful, collaborative,competitive, career-oriented environment.
The Remco is also committed to fair and responsible remuneration across all levels of employees within the Group, including its international divisions, that supports the implementation of our four strategic pillars:
TFG IS COMMITTED TO FAIR AND RESPONSIBLE REMUNERATION THAT SUPPORTS THE IMPLEMENTATION OF OUR FOUR STRATEGIC PILLARS
SHORT-TERM INCENTIVES (STI)
LONG-TERM INCENTIVES (LTI)
STRATEGIC PILLARS
INDIVIDUAL METRICS (EXAMPLES)
BUSINESS AREA METRICS
GROUP METRICS
SHAREHOLDER METRICS
Cash customer base
OPERATING PROFIT
GROUP EBIT
Net promoter score
Quick response
ROCE
Employee engagement
African expansion
Basket size
Voice of customer
HEPS
ROCE
The following selected measures are addressed to ensure fair and responsible remuneration is applied across all levels of employees:
• Annual exercise to identify and address unexplained income differentials as part of the Employment Equity Report (EEA4) submission to the Department of Labour
• Annual monitoring of TFG’s internal Gini coefficient (i.e. the ratio of income dispersion between the different levels) to ensure it is within reasonable benchmarks nationally and within the South African retail industry
123
PERFORMANCEREVIEW
OUR GOVERNANCEPROFILE
SUMMARY CONSOLIDATED FINANCIAL STATEMENTS APPENDICES NOTICE OF ANNUAL
GENERAL MEETING ADMINISTRATION
GROWTH
PROFIT
CUSTOMER
LEADERSHIP
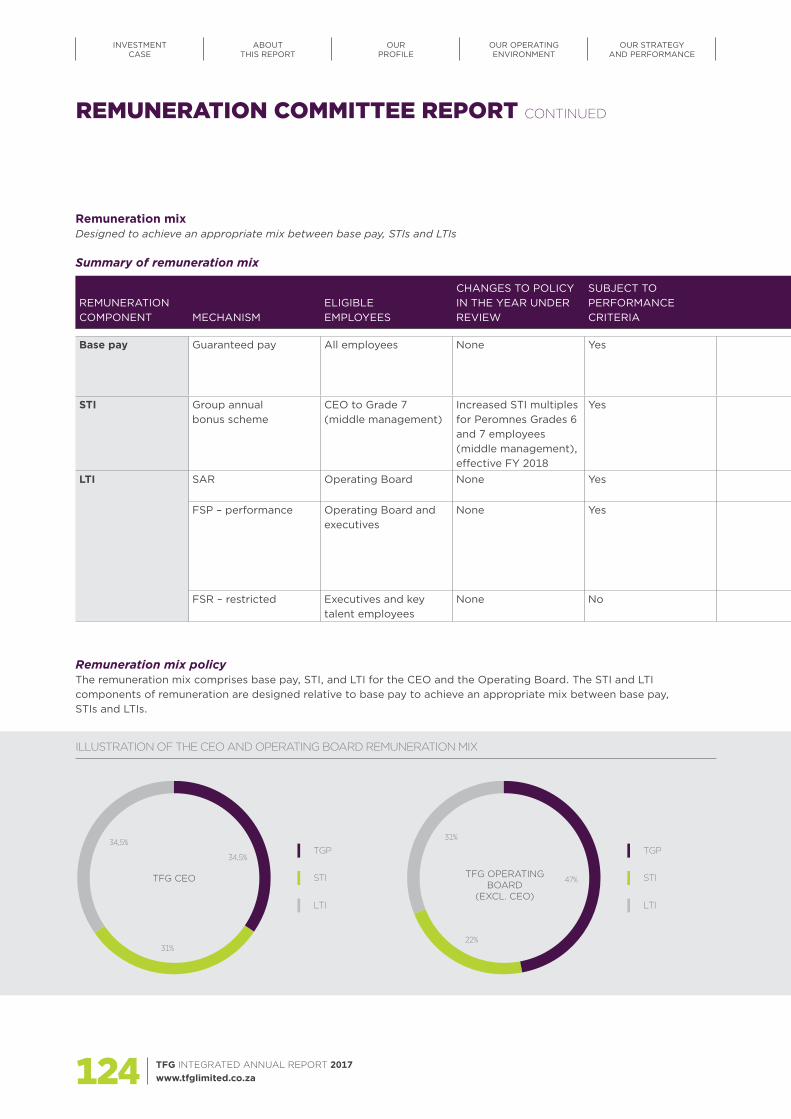
TFG INTEGRATED ANNUAL REPORT 2017 www.tfglimited.co.za124
INVESTMENT CASE
ABOUTTHIS REPORT
OUR PROFILE
OUR OPERATINGENVIRONMENT
OUR STRATEGY AND PERFORMANCE
REMUNERATION COMMITTEE REPORT CONTINUED
Remuneration mixDesigned to achieve an appropriate mix between base pay, STIs and LTIs
Summary of remuneration mix
REMUNERATION COMPONENT MECHANISM
ELIGIBLE EMPLOYEES
CHANGES TO POLICY IN THE YEAR UNDER REVIEW
SUBJECT TO PERFORMANCECRITERIA
APPLICABLE PERFORMANCE CRITERIA
PERFORMANCE CONDITION
MINIMUM PERFORMANCE PERIOD
STRATEGIC PURPOSE OF COMPONENT
Base pay Guaranteed pay All employees None Yes Performance review Annual increase approved by the Remco
n/a Attracts and retains employees with dual focus on external market equity and internal equity
STI Group annual bonus scheme
CEO to Grade 7 (middle management)
Increased STI multiplesfor Peromnes Grades 6 and 7 employees (middle management), effective FY 2018
Yes EBIT individual performance and divisional profit growth
Set by the Remco each year
One year Rewards employees for achieving or exceeding targeted short-term performance levels
LTI SAR Operating Board None Yes HEPS growth (excluding acquisition costs)
CPI Three years from date of grant
Aligns executive and key management’s interests with long-term shareholders’ interests
FSP – performance Operating Board and executives
None Yes HEPS growth (excluding acquisition costs) – ROCE
• CPI plus 2% • As explained in section A,
June 2016 share award and June 2017 share award – ROCE target now to be set during FY 2018
Three years from date of grant
FSR – restricted Executives and key talent employees
None No n/a n/a Three years from date of grant
Remuneration mix policy The remuneration mix comprises base pay, STI, and LTI for the CEO and the Operating Board. The STI and LTI components of remuneration are designed relative to base pay to achieve an appropriate mix between base pay, STIs and LTIs.
TGP
LTI
STI
TFG CEO – FINANCIAL YEAR REMUNERATION MIX
31%
34,5%
34,5%
TFG Operating Board
22%
31%
47%
TGP
LTI
STI
ILLUSTRATION OF THE CEO AND OPERATING BOARD REMUNERATION MIX
TFG CEO TFG OPERATING BOARD
(EXCL. CEO)

125
Remuneration mixDesigned to achieve an appropriate mix between base pay, STIs and LTIs
Summary of remuneration mix
REMUNERATION COMPONENT MECHANISM
ELIGIBLE EMPLOYEES
CHANGES TO POLICY IN THE YEAR UNDER REVIEW
SUBJECT TO PERFORMANCECRITERIA
APPLICABLE PERFORMANCE CRITERIA
PERFORMANCE CONDITION
MINIMUM PERFORMANCE PERIOD
STRATEGIC PURPOSE OF COMPONENT
Base pay Guaranteed pay All employees None Yes Performance review Annual increase approved by the Remco
n/a Attracts and retains employees with dual focus on external market equity and internal equity
STI Group annual bonus scheme
CEO to Grade 7 (middle management)
Increased STI multiplesfor Peromnes Grades 6 and 7 employees (middle management), effective FY 2018
Yes EBIT individual performance and divisional profit growth
Set by the Remco each year
One year Rewards employees for achieving or exceeding targeted short-term performance levels
LTI SAR Operating Board None Yes HEPS growth (excluding acquisition costs)
CPI Three years from date of grant
Aligns executive and key management’s interests with long-term shareholders’ interests
FSP – performance Operating Board and executives
None Yes HEPS growth (excluding acquisition costs) – ROCE
• CPI plus 2% • As explained in section A,
June 2016 share award and June 2017 share award – ROCE target now to be set during FY 2018
Three years from date of grant
FSR – restricted Executives and key talent employees
None No n/a n/a Three years from date of grant
The remuneration mix varies by organisational level, with incentive pay (short and long term) forming a more significant portion of remuneration at higher organisational levels.
The targeted remuneration mix at varying levels of organisational performance is approved by the Remco. The infographics alongside depict the mix of remuneration components for the CEO and Operating Board, taking into account:
• current annualised base pay levels;• the STI payment, which is at performance tier
On Target levels; and• the annual LTI allocations, which are shown at
expected value, for benchmarking purposes, on the date of award. The expected value of the LTI annual allocations is determined by using industry standard option pricing formulae and probability factors, together with established performance conditions.
Base payAttracts and retains key talent with focus on external market equity, internal equity as well as equal pay for work of equal value
Base pay consists of the following, and applies to all permanent employees:
• A pensionable salary• Travel and housing allowance (depending on
organisational level)• Employer contributions to:
– TFG Retirement Fund– Provident fund (dependent on organisational level)– Group life and disability benefits– TFG Medical Aid Scheme (where applicable)
• Base pay is reviewed annually with reference to the market, and is targeted around the median of comparable market survey statistics.
PERFORMANCEREVIEW
OUR GOVERNANCEPROFILE
SUMMARY CONSOLIDATED FINANCIAL STATEMENTS APPENDICES NOTICE OF ANNUAL
GENERAL MEETING ADMINISTRATION
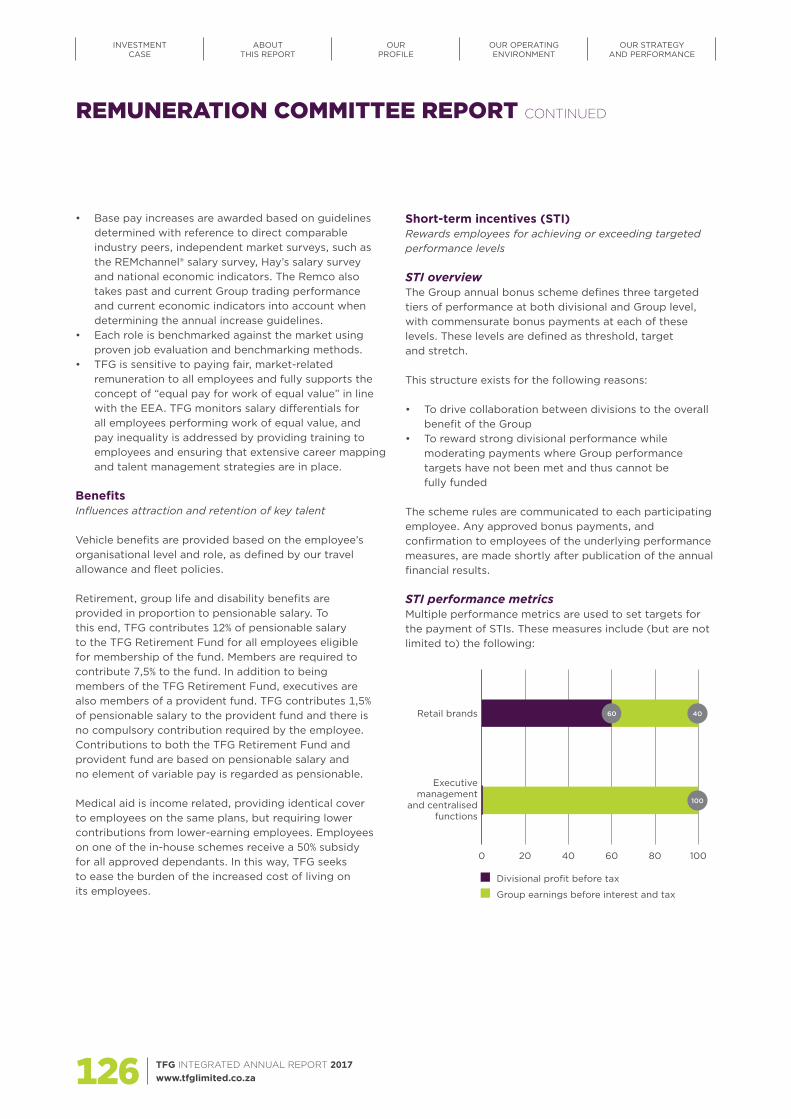
TFG INTEGRATED ANNUAL REPORT 2017 www.tfglimited.co.za126
INVESTMENT CASE
ABOUTTHIS REPORT
OUR PROFILE
OUR OPERATINGENVIRONMENT
OUR STRATEGY AND PERFORMANCE
REMUNERATION COMMITTEE REPORT CONTINUED
• Base pay increases are awarded based on guidelines determined with reference to direct comparable industry peers, independent market surveys, such as the REMchannel® salary survey, Hay’s salary survey and national economic indicators. The Remco also takes past and current Group trading performance and current economic indicators into account when determining the annual increase guidelines.
• Each role is benchmarked against the market using proven job evaluation and benchmarking methods.
• TFG is sensitive to paying fair, market-related remuneration to all employees and fully supports the concept of “equal pay for work of equal value” in line with the EEA. TFG monitors salary differentials for all employees performing work of equal value, and pay inequality is addressed by providing training to employees and ensuring that extensive career mapping and talent management strategies are in place.
BenefitsInfluences attraction and retention of key talent
Vehicle benefits are provided based on the employee’s organisational level and role, as defined by our travel allowance and fleet policies.
Retirement, group life and disability benefits are provided in proportion to pensionable salary. To this end, TFG contributes 12% of pensionable salary to the TFG Retirement Fund for all employees eligible for membership of the fund. Members are required to contribute 7,5% to the fund. In addition to being members of the TFG Retirement Fund, executives are also members of a provident fund. TFG contributes 1,5% of pensionable salary to the provident fund and there is no compulsory contribution required by the employee. Contributions to both the TFG Retirement Fund and provident fund are based on pensionable salary and no element of variable pay is regarded as pensionable.
Medical aid is income related, providing identical cover to employees on the same plans, but requiring lower contributions from lower-earning employees. Employees on one of the in-house schemes receive a 50% subsidy for all approved dependants. In this way, TFG seeks to ease the burden of the increased cost of living on its employees.
Short-term incentives (STI)Rewards employees for achieving or exceeding targeted performance levels
STI overviewThe Group annual bonus scheme defines three targeted tiers of performance at both divisional and Group level, with commensurate bonus payments at each of these levels. These levels are defined as threshold, target and stretch.
This structure exists for the following reasons:
• To drive collaboration between divisions to the overall benefit of the Group
• To reward strong divisional performance while moderating payments where Group performance targets have not been met and thus cannot be fully funded
The scheme rules are communicated to each participating employee. Any approved bonus payments, and confirmation to employees of the underlying performance measures, are made shortly after publication of the annual financial results.
STI performance metricsMultiple performance metrics are used to set targets for the payment of STIs. These measures include (but are not limited to) the following:
0 20 40 60 80 100
Executivemanagement
and centralisedfunctions
Retail brands
Group earnings before interest and tax
Divisional profit before tax
60 40
100

127
The bonus pool for executive management and centralised functions is weighted 100% to EBIT, while the bonus pool for retail brands is weighted 60% to divisional profit before tax and 40% to EBIT.
After calculating the bonus pool using the primary measure, a secondary measure of individual performance is applied to an individual’s base bonus. The purpose of having individual performance as a secondary measure is to support a “pay for performance” culture. This secondary measure is determined by using the employee’s performance rating. The range is on a five-point scale between “1” = 0% (very poor performance) to “5” = 150% (exceptional performance) with 100% bonus paid at a “3” rating. In line with good practice, these ratings are calibrated to ensure the Group achieves a reasonable distribution curve within the total bonus pool.
During the year under review, the Remco approved changes to the payment modifiers linked to the individual performance ratings to determine final bonus payments. Previously, the range was “1” = 0% to “5” = 120%. The purpose of the changes is to further embed the “pay for performance” culture within the Group. Performance measures for all Operating Board members(including the CEO) as well as all heads of retail brands and heads of functions are aligned with the TFG strategic pillars as detailed on page 64 of the integrated annual report. CEO objectives are set and assessed by the Chairman of the Supervisory Board. CFO and Operating Board members’ objectives are set and assessed by the CEO. The CEO and Operating Board’s performances are reviewed by the Remco as part of the STI bonus payment approval process.
STI target settingThe Remco approves Group bonus targets by using annual profit forecasts as a benchmark (primary measure).
As a major retailer and in accordance with attaining effective operational monitoring, TFG’s profits and other key retail metrics are internally reported in detail on a weekly and monthly basis. This real-time reporting of profit (the cornerstone of the EBIT measure) and review by executive management supports the robust STI design principles and underpinning performance metrics of divisional profit before tax and EBIT.
STI payment multiplesSTI benchmarks are reviewed regularly to ensure that bonus payment levels at each organisational level and performance tier are appropriate and form a fitting part of the overall pay mix. Any changes to the payment multiples or structure require prior approval from the Remco.
Bonus multiples, before the influence of any individual factors are taken into account, are calculated as a factor of:
• each individual’s annual base pay; and• each organisational level.
For ease of comparison and reporting, bonus multiples are shown as a percentage of annual base pay in this report.
The Remco reviews and assesses the achievement of approved Group and divisional targets and then recommends the appropriate bonus payments to the Supervisory Board.
The Remco has an overriding discretion to recommend any adjustments to bonus targets and payments to the Supervisory Board as a result of changed business conditions, including where a payment is inappropriate given the Group’s financial and/or other justifiable circumstances.
STI tiers of performance and related bonus multipleThe following rationale is applied at each tier of performance when determining and approving targets:
Threshold• Performance marginally below On Target that is
nevertheless satisfactory and substantially aligned with forecasted trading performance.
• Performance at this level, or anywhere between Threshold and On Target, warrants and justifies up to a maximum of 50% of the On Target bonus value.
• Payment of a bonus for performance below threshold will only be made at the discretion of the Remco. In the event that a discretionary payment is made for performance below threshold, this payment will be less than a payment for achieving threshold.
On Target• Strong performance that is above forecasted trading
performance.
Stretch• A superior level of performance that is sufficient to
warrant and justify the maximum potential bonus payment (double the On Target value).
• Performance above stretch target does not result in an additional bonus payment. The payment cap by design is achieved once stretch targets are achieved.
PERFORMANCEREVIEW
OUR GOVERNANCEPROFILE
SUMMARY CONSOLIDATED FINANCIAL STATEMENTS APPENDICES NOTICE OF ANNUAL
GENERAL MEETING ADMINISTRATION

TFG INTEGRATED ANNUAL REPORT 2017 www.tfglimited.co.za128
INVESTMENT CASE
ABOUTTHIS REPORT
OUR PROFILE
OUR OPERATINGENVIRONMENT
OUR STRATEGY AND PERFORMANCE
REMUNERATION COMMITTEE REPORT CONTINUED
The Remco guidelines dictate that the performance range between Threshold and On Target is substantially smaller than the range between On Target and Stretch to prevent payment for underperformance.
Payment between Threshold and On Target is paid on an all-or-nothing basis to limit bonus payments at
performance below strong levels, and to create a significant incentive to achieve On Target performance levels.
Performance between On Target and Stretch is rewarded proportionately, and payments are capped at the Stretch level.
CEO and Operating Board bonus payments for financial year 2017
DIVISIONAL PROFIT/EBIT PERFORMANCE LEVEL SLIDING SCALE
% ANNUAL BASE PAY ASSUMING INDIVIDUAL PERFORMANCE
MODIFIER OF 3 (MET ALL EXPECTATIONS)
% ANNUAL BASE PAY ASSUMING MAXIMUM INDIVIDUAL
PERFORMANCE MODIFIER OF 5 (EXCEEDED ALL
EXPECTATIONS)
CEO
OPERATING BOARD
(AVERAGE) CEO
OPERATING BOARD
(AVERAGE)
Stretch Sliding scale between Target and Stretch
180% 96% 270%* 143%*On Target 90% 48% 135% 72%Threshold No sliding scale between
Threshold and Target45% 24% 68% 36%
Under Threshold No payment unless bonus payments are approved at the discretion of the Remco
0% 0% 0% 0%
* 270% and 143% = the maximum resultant bonus payment expressed as a percentage of annual base pay for the CEO and average Operating Board respectively.
Long-term incentives (LTI) – Share appreciation rights and forfeitable sharesAligns executive and key management’s interests with those of shareholders
Share appreciation rights (SARs)(Foschini 2007 Share Incentive Scheme)
Participants are entitled to receive resultant shares equal in value to the growth in the share price on a defined number of rights between the date of grant and the date of conversion to resultant shares.
All shares issued under this scheme are subject to Group performance criteria, which are tested against inflation-linked Group HEPS targets over a period of three years with no retesting. The minimum period between grant and conversion is three years, and all rights expire after six years.
Forfeitable shares(Foschini 2010 Share Incentive Scheme)
Two instruments form part of this scheme, namely performance shares and restricted shares.
Performance shares (forfeitable shares)Performance shares issued under this scheme are subject to Group performance criteria, which are tested against inflation-linked HEPS targets and ROCE targets (applicable only to Operating Board) over a period of three years with no retesting.
The weighting between HEPS:ROCE as performance measures is 80%:20% respectively with linear vesting for both measures.

129
Share awards prior to June 2016100% vesting will take place after three years if a performance criterion of HEPS growth of CPI plus 2% is met. Linear vesting will take place if HEPS growth is between CPI and CPI plus 2%, with no vesting taking place if HEPS growth is less than CPI.
Share awards after June 2016100% vesting will take place after three years if performance criteria of HEPS growth of CPI plus 2% and the upper ROCE target are met. On a weighted basis, linear vesting will take place if HEPS growth attained is between CPI and CPI plus 2%, and if ROCE is attained between the lower limit and the upper limit of the target range. No vesting of the HEPS-weighted shares takes place if HEPS growth is at or below CPI. No vesting of the ROCE-weighted shares takes place if ROCE is at or below the ROCE lower limit. For reasons explained in section A of this report, ROCE targets for the June 2016 share award and the June 2017 share award will be set during FY 2018.
Restricted shares (forfeitable shares)Restricted shares are issued with the specific objective of improving the retention of key senior talent, while still utilising an instrument that aligns the interests of participants with those of shareholders. Restricted shares vest after three years, and are subject to continued employment.
LTI allocation policyAllocations are made using predefined multiples for each share incentive type based on:
• organisational level;• annual base pay; and• targeted pay mixes, given that market guidelines
are appropriate for each organisational level.
Allocations are made annually and on a consistent basis to establish the awards as an accumulating asset in the hands of eligible employees, with the objective of incentivising them to create growth and retain such employees in service for at least three years. With annual allocations, each allocation has a three-year vesting period, resulting in each new LTI allocation providing a further three-year incentive/retention period. Ad hoc, once-off allocations are exceptional and will normally represent upfront approved remuneration usually when a senior employee is first employed. Any such exceptional awards to executive directors are disclosed to shareholders.
The allocation levels per role for LTIs (as a percentage of annual base pay) are outlined below:
EXPECTED VALUE OF ANNUAL SHARE ALLOCATION LEVEL AS A % OF ANNUAL BASE PAY
CEO100%
OperatingBoard
60% – 75%
Balance ofparticipants15% – 55%
0 10 20 30 40 50 60 70 80 90 100
PERFORMANCEREVIEW
OUR GOVERNANCEPROFILE
SUMMARY CONSOLIDATED FINANCIAL STATEMENTS APPENDICES NOTICE OF ANNUAL
GENERAL MEETING ADMINISTRATION

TFG INTEGRATED ANNUAL REPORT 2017 www.tfglimited.co.za130
INVESTMENT CASE
ABOUTTHIS REPORT
OUR PROFILE
OUR OPERATINGENVIRONMENT
OUR STRATEGY AND PERFORMANCE
Benchmarks for the expected value of share awards are reviewed on an annual basis. No changes are made without approval by the Remco, and in turn by the Supervisory Board.
100% of LTI allocations made to the CEO, Operating Board and senior executive management are subject to Group performance criteria. LTI shares vest based on the performance criteria applicable to the relevant LTI scheme.
New allocations are not adjusted to compensate for any existing allocations that may be financially underwater.
As part of TFG’s retention strategy of other key senior employees, annual allocations are a defined mix of both performance and restricted shares. However, restricted shares are not allocated where there is another retention mechanism in place, namely a restraint of trade and a minimum service agreement.
Newly appointed executives and managers may have their allocations initially increased to ensure that an appropriate holding commensurate with their role is reached over time to create parity in the incentivising of long-term performance across similar categories of employees.
All allocations are approved by the Remco. The Remco confirms that the principles and scheme rules have been fairly applied in determining each individual’s allocation, and also ensures that the overall share capital dilution and costs are within the defined guidelines.
Dilution limitsDespite the dilution limits detailed as part of each share scheme’s rules, the Remco guidelines do not permit the total number of shares issued, allocated across all schemes, to exceed the following limits:
• 1% individual limit • 5% company limit
LTI shares are settled through on-market purchases and are therefore not resulting in a dilution to shareholders. The usage of the dilution limit in the 2017 financial year is set out in section C of the report.
Performance conditions (current and forward looking) For reasons explained in section A of this report, ROCE targets for share awards made in FY 2016 and FY 2017 will be set during FY 2018. These targets are designed to achieve long incremental improvement in ROCE and have been introduced to drive pragmatic and commercially minded capital management within the Group.
Performance criteria and weightings are reviewed on an annual basis and are subject to change as approved by the Remco.
Eligibility, allocation frequency and performance conditions for vesting (weighting and vesting levels) for LTIs are detailed alongside:
REMUNERATION COMMITTEE REPORT CONTINUED

131
PARTICIPANTSALLOCATIONFREQUENCY
PERFORMANCE TARGETMEASUREMENT PERIOD
VESTING SUMMARYHEPS ROCE
Share appreciation rights
CEO and Operating Board
One allocation per annum
HEPS growth of at least CPI, compounded annually over the measurement period
Weighting 100%
Three years
Expiry period six years from date of grant
100% vest if performance target is met and participant is employed by TFG
All lapse if performance target is not met
Performance shares (forfeitable shares)
CEO, Operating Board and executives (Paterson scale E1 and above)
One allocation per annum
HEPS growth of CPI plus 2%, compounded annually over the measurement period
Weighting 80% (OperatingBoard)
Target reviewed and set annually by the Remco
Weighting100% (belowOperatingBoard)
ROCE to be set during FY 2018 andreported in the Remuneration Committee report for FY 2018
Weighting 20%
(ROCE only applicable to Operating Board)
Targetreviewed andset annuallyby the Remco
Three years
Expiry period three years from date of grant
100% vest if performance targets are met and participant is employed by TFG
Linear vesting takes place between HEPS growth of CPI and CPI plus 2% and ROCE of between lower and upper target levels
On a weighted basis, 100% of the shares that do not meet minimum HEPS criteria will lapse and 100% of the shares that do not meet minimum ROCE criteria will lapse
Restricted shares (forfeitable shares)
Senior management above the entry level of middle management (i.e. Paterson scale D3) (excluding CEO, Operating Board and any employee with a restraint of trade and minimum service agreement)
One allocation per annum
No performance target – retention only
Three years 100% vest once measurement period has expired and participant is employed by TFG
PERFORMANCEREVIEW
OUR GOVERNANCEPROFILE
SUMMARY CONSOLIDATED FINANCIAL STATEMENTS APPENDICES NOTICE OF ANNUAL
GENERAL MEETING ADMINISTRATION

TFG INTEGRATED ANNUAL REPORT 2017 www.tfglimited.co.za132
INVESTMENT CASE
ABOUTTHIS REPORT
OUR PROFILE
OUR OPERATINGENVIRONMENT
OUR STRATEGY AND PERFORMANCE
REMUNERATION COMMITTEE REPORT CONTINUED
Vesting on terminationIn line with the scheme rules, the Remco must consider and resolve whether, based on the circumstances, a portion of the unvested LTI may vest as a result of early termination. In the case of normal retirement, death, ill health or retrenchment, all shares vest. In the case of early retirement, the Remco applies defined decision-making guidelines when determining if a portion of the shares will vest.
All shares and rights are forfeited upon an employee’s resignation or dismissal in terms of the scheme rules.
Retention strategySpecific programmes are in place to ensure that business continuity and the delivery of strategy are supported through risk management of the loss of key employees
Restraints and minimum service agreementsIt is TFG’s practice to have restraint of trade and minimum service agreements in place for the CEO and Operating Board members. These agreements are in place for the duration of employment and contain notice periods of between six and twelve months. In the event of summary dismissal on grounds of misconduct (for example dishonest or fraudulent conduct), notice periods do not apply.
Ex gratia or other lump sum payments on severance or retirement Apart from the CEO’s transitional agreement as disclosed in the 2016 Remuneration Committee report, there are no other agreements currently in place that provide for ex gratia or other lump sum payments to executives on severance or retirement. Executives who depart after having performed poorly are not awarded “golden handshakes”. There are no ex gratia payments made in the event of a merger or takeover.
Non-executive directorsNon-executive directors are appointed for a term of three years. The Nomination Committee recommends candidates for election to the Supervisory Board. A candidate’s eligibility for re-election is dependent on an annual performance evaluation.
In addition to a base fee, all non-executive directors are paid a committee fee based on the number of committees on which they serve, and are reimbursed by TFG for all travel expenses incurred during the course and scope of their duties.
Non-executive directors do not receive any payments linked to organisational performance, nor are they entitled to take part in any LTI/share schemes. None of the non-executive directors have service contracts with the Group.

133
SECTION C: IMPLEMENTATION OF REMUNERATION POLICY FOR THE 2017 FINANCIAL YEARThe section of the Remuneration Committee report that follows provides further details regarding the application of the remuneration policy in relation to organisation-wide employees.
Key items by pay component during the year under review
Base pay The guideline given by the Remco for increases to all employees (other than unionised employees subject to negotiation with the union) in April 2016 was set at 6,5% or a minimum Rand amount of R400. The minimum increase resulted in an effective increase of more than 10% for lower-paid employees.
Car allowances for eligible employees were adjusted by 6,5% in April 2016.
CEO base payAs disclosed in the 2016 integrated annual report, future increases to the annual base pay of the CEO will be linked to inflationary market guideline increases. Therefore, the Remco approved an increase of 6% on base pay for the 2018 financial year.
STI The Remco set the EBIT target for 2017.LTI All shares allocated to the CEO, Operating Board and senior executive management this year were
performance-based shares contingent on the achievement of company performance criteria. Outstanding share instruments awarded to employees and executives at 31 March 2017 are as follows:
Share appreciation rights 1 568 600Forfeitable shares 2 870 000Total 4 438 600
The above total is 2% of total issued shares. This is lower than the total limit of 5% set by the Remco and approved by shareholders.
STI outcomesDuring the year under review, actual TFG EBIT was measured against the target set by the Remco. Group EBIT was marginally below threshold for the 2017 financial year. As disclosed earlier in the report, because EBIT was only marginally below threshold target and in recognition of the strategic contribution made by Messrs Murray and Thunström to the Group’s international expansion plans, the Remco exercised its discretion by approving bonus payments for Group performance.
The following graphic indicates actual performance versus target, and the resultant bonuses paid to Messrs Murray and Thunström.
STI OUTCOME THRESHOLD TARGET STRETCH
2017 earnings before interest and tax performance tiers set
% annualised base pay per performance tierA D MurrayA E Thunström
45%27,5%
90%55%
180%110%
2017 earnings before interest and tax actual
Bonus pool as % annualised base pay*A D MurrayA E Thunström
36%22%
* Actual bonus paid (after applying individual performance modifier) as a percentage of annualised base pay: – A D Murray 45% – A E Thunström 27,5%
PERFORMANCEREVIEW
OUR GOVERNANCEPROFILE
SUMMARY CONSOLIDATED FINANCIAL STATEMENTS APPENDICES NOTICE OF ANNUAL
GENERAL MEETING ADMINISTRATION

TFG INTEGRATED ANNUAL REPORT 2017 www.tfglimited.co.za134
INVESTMENT CASE
ABOUTTHIS REPORT
OUR PROFILE
OUR OPERATINGENVIRONMENT
OUR STRATEGY AND PERFORMANCE
REMUNERATION COMMITTEE REPORT CONTINUED
LTI scheme outcomesThe expected value of share allocations to the CEO and Operating Board members for the 2017 financial year is detailed below. The share scheme awards are shown at their expected value on the date of awards to ensure meaningful comparisons for benchmarking. Internally, the share scheme awards are communicated to participants at their face value. The expected value of the award is expressed as a percentage of their annual base pay (guaranteed pay).
EXPECTED VALUE OF ANNUAL SHARE ALLOCATION LEVEL AS A % OF ANNUAL BASE PAY
CEO100%
OperatingBoard
60% – 75%
Balance ofparticipants15% – 55%
0 10 20 30 40 50 60 70 80 90 100
LTI performance outcomesThe 2014 FSP share award performance target was measured over the three-year performance period. The actual three-year cumulative HEPS growth of 34,3% exceeded the target cumulative HEPS growth of 24,0% and consequently 100% of share awards vested.
The 2014 SAR share award performance target was measured over the three-year performance period. The actual three-year cumulative HEPS growth of 34,3% exceeded the target cumulative HEPS growth of 17,2% and consequently 100% of SARs are available for conversion.
Current allocation vs policy limitsIn terms of the policy set by the Remco, it is evident that share awards held by scheme participants are within the defined limits both at an individual and overall level. The CEO is the highest individual holder of share awards, and is thus compared against the individual limit.
% ISSUED SHARES
0,00%
0,20%
0,40%
0,60%
0,80%
1,00%
Individual limit
Most held by one individual
0,34%
1,00%
0,00%
2,00%
4,00%
6,00%
8,00%
Company limit
Held by all scheme participants
Held by Operating Board
0,83%
2,02%
5,00%

135
Executive directors’ remunerationFor the year under review, the Supervisory Board has determined that the prescribed officers are the CEO and CFO. Messrs Murray and Thunström serve as executive directors on the Supervisory Board, and they exercise general executive control and management of the business.
2017
EXECUTIVE DIRECTORS
REMUNE-RATION
R’000
PENSION FUNDR’000
TRAVELALLOW-
ANCER’000
OTHER BENEFITS**
R’000
GUARANTEED PAY
R’000
PER-FORMANCE
BONUS# R’000
TOTALGUARAN-
TEED PAY PLUS
PER-FORMANCE
BONUS#
R’000
IFRS SHARE ALLO-
CATION FAIR VALUE
R’000
A D Murray 8 362,9 1 129,0 455,9 52,7 10 000,5 4 500,0 14 500,5 13 734,2A E Thunström 3 368,4 454,7 349,5 57,9 4 230,5 1 163,8 5 394,3 2 586,0Total 11 731,3 1 583,7 805,4 110,6 14 231,0 5 663,8 19 894,8 16 320,2
# Performance bonus included in 2017 remuneration to be paid in 2018 but accrued in 2017. ** Other benefits include housing allowance and medical aid subsidy.
2016
EXECUTIVE DIRECTORS
REMUNE-RATION
R’000
PENSION FUNDR’000
TRAVEL ALLOW-
ANCER’000
OTHER BENEFITS
R’000
GUARANTEED PAY
R’000
PER-FORMANCE
BONUS R’000
TOTALGUARAN-
TEED PAY PLUS
PER-FORMANCE
BONUSR’000
IFRS SHARE ALLO-
CATION FAIR VALUE
R’000
A D Murray 6 431,9 868,3 428,0 52,8 7 781,0 6 959,7 14 740,7 6 088,6A E Thunström 2 194,3 296,2 246,1 41,8 2 778,4 2 308,4 5 086,8 829,8R Stein 856,3 115,6 82,0 12,5 1 066,4 – 1 066,4 –P S Meiring 776,8 104,9 82,0 12,5 976,2 – 976,2 –Total 10 259,3 1 385,0 838,1 119,6 12 602,0 9 268,1 21 870,1 6 918,4
Directors’ interestsAs at 31 March 2017, directors had the following interests in the company’s issued shares:
M LEWIS’000
E OBLOWITZ’000
D FRIEDLAND’000
N V SIMAMANE’000
R STEIN’000
TOTAL NON-EXECUTIVE
’000A D MURRAY
’000A E THUNSTRÖM
’000
TOTAL EXECUTIVE
’000
TOTAL SHARES
’000
Direct beneficial 2,2 1,6 501,5 505,3 1 207,1 1 207,1 1 712,4Indirect beneficial 29,4 31,7 61,1 722,5 722,5 783,6Indirect non-beneficial 8 251,7 8 251,7 8 251,7Total 8 251,7 2,2 29,4 1,6 533,2 8 818,1 1 929,6 1 929,6 10 747,7
PERFORMANCEREVIEW
OUR GOVERNANCEPROFILE
SUMMARY CONSOLIDATED FINANCIAL STATEMENTS APPENDICES NOTICE OF ANNUAL
GENERAL MEETING ADMINISTRATION

TFG INTEGRATED ANNUAL REPORT 2017 www.tfglimited.co.za136
INVESTMENT CASE
ABOUTTHIS REPORT
OUR PROFILE
OUR OPERATINGENVIRONMENT
OUR STRATEGY AND PERFORMANCE
REMUNERATION COMMITTEE REPORT CONTINUED
As at March 2017, directors had accepted the following share appreciation rights and forfeitable shares:
FINANCIAL YEAR OF
AWARD
FINANCIAL YEAR OF EARLIEST DELIVERY
FINANCIAL YEAR OF
LATEST DELIVERY
STRIKE PRICE PER
INSTRU-MENT
NUMBER OF INSTRU-
MENTS AWARDED
’000
NUMBER EXERCISED
IN YEAR
CLOSING NUMBER OF
UNVESTED AND/OR
UNEXERCISED INSTRUMENTS
A D MurraySARs 2012 2016 2018 R86,32 85,2 85,2 –
2013 2016 2019 R136,22 62,8 62,82014 2017 2020 R96,86 133,4 133,42015 2018 2021 R111,10 89,4 89,42016 2019 2022 R148,15 76,4 76,42017 2020 2023 R142,72 119,0 119,0
FSPs 2014 2017 – 21,7 21,7 –2015 2018 – 38,3 38,32016 2019 – 32,8 32,82017 2020 – 54,9 54,92017 2020 – 142,9 142,9
A E ThunströmSARs 2016 2019 2022 R148,15 31,2 31,2
2017 2020 2023 R142,72 37,8 37,8FSPs 2015 2019 – 11,8 11,8
2016 2019 – 13,4 13,42017 2020 – 17,4 17,4
Changes to directors’ interests after year end1. On 2 June 2017, the executive directors accepted the following share appreciation rights (SARs).
SARS ACCEPTED
’000*
PRICE PER SAR
R
A D Murray 132,8 138,30A E Thunström 47,0 138,30
* Subject to performance criteria.
2. On 2 June 2017, the executive directors accepted the following ordinary shares in terms of the Group’s 2010 Share Incentive Scheme for nil consideration. The shares vest on the third anniversary of the grant date provided the recipient remains in the Group’s employ and the requisite performance conditions are satisfied.
SHARES ACCEPTED
’000*
ESTIMATEDVALUE
Rm#
A D Murray 61,3 8,6A E Thunström 21,7 3,0
* Subject to performance criteria.# Estimated value based on closing share price of R139,53 on 2 June 2017.
3. On 2 June 2017, the executive director sold ordinary shares previously granted on 10 June 2014 with performance-based restrictions in terms of the Group’s 2010 Share Incentive Scheme:
SHARES SOLD
VALUE Rm#
A D Murray 17,2 2,4
# Estimated value based on closing share price of R139,53 on 2 June 2017.

137
Non-executive directorsFees are based on an assessment of the responsibility placed on non-executive directors arising from increased requirements for regulatory oversight and TFG’s international expansion. A benchmarking exercise was conducted during the year under review using market data benchmarks. The proposed base fee increase from October 2017 is proposed at R295 000 per annum (6,1% increase) and market-related increases in committee fees.
The following table sets out the proposed fees (VAT exclusive) for approval at the AGM in September 2017 for the period 1 October 2017 to September 2018:
ROLECURRENT
APPROVED FEESPROPOSED
FEES%
INCREASE
Chairman (all inclusive) R900 000 R954 000 6,0%Director (South African) R278 000 R295 000 6,1%Director (foreign) R540 000 R572 500 6,0%Audit Committee Chairperson R240 000 R254 500 6,0%Risk Committee Chairperson R160 000 R170 000 6,3%Remuneration Committee Chairperson R120 000 R127 500 6,3%Social and Ethics Committee Chairperson R110 000 R117 000 6,4%Member/Invitee of Audit Committee R120 000 R127 500 6,3%Member/Invitee of Risk Committee R80 000 R85 000 6,3%Member of Remuneration Committee R75 000 R79 500 6,0%Member of Social and Ethics Committee R60 000 R64 000 6,7%Member of Nomination Committee R40 000 R42 500 6,3%Member of ad hoc Finance Committee* R42 500
* An ad hoc Finance Committee has been mandated to specifically consider and investigate all potential acquisition opportunities on behalf of TFG and is remunerated as such.
The fees (VAT exclusive) for the 2017 financial year and 2018 financial year (based on current committee membership) are presented below:
NON-EXECUTIVE DIRECTORS NOTE
FEES PAID IN RESPECT
OF 2017 R’000
BASE FEES PROPOSED
R’000
COMMITTEE FEES
PROPOSED R’000
TOTAL FEES PROPOSED IN
RESPECT OF 2018#
R’000
M Lewis R875 000 R927 000 – R927 000F Abrahams 1 R492 000 R286 500 R314 500 R601 000S E Abrahams 3 R560 000 R286 500 R392 250 R678 750D Friedland R502 500 R286 500 R283 500 R570 000B L M Makgabo-Fiskerstrand 2 R456 000 R286 500 R268 250 R554 750E Oblowitz R597 500 R286 500 R433 750 R720 250N V Simamane 2 R456 000 R286 500 R268 250 R554 750R Stein 3 R470 000 R286 500 R247 500 R534 000G H Davin R520 000 R556 250 – R556 250Total R4 929 000 R3 488 750 R2 208 000 R5 696 750
# Proposed total fee increases for non-executive directors (after taking into account committee structures, new appointments and market adjustments) will increase by 15,6%.
Notes:1. F Abrahams appointed as a member of the Audit Committee on 1 October 2016.2. B L M Makgabo-Fiskerstrand and N V Simamane appointed as members of the Risk Committee on 1 October 2016.3. R Stein and S E Abrahams have open invitations to attend meetings of the Audit and Risk Committees respectively
and are remunerated accordingly.
PERFORMANCEREVIEW
OUR GOVERNANCEPROFILE
SUMMARY CONSOLIDATED FINANCIAL STATEMENTS APPENDICES NOTICE OF ANNUAL
GENERAL MEETING ADMINISTRATION

TFG INTEGRATED ANNUAL REPORT 2017 www.tfglimited.co.za138
INVESTMENT CASE
ABOUTTHIS REPORT
OUR PROFILE
OUR OPERATINGENVIRONMENT
OUR STRATEGY AND PERFORMANCE
Summary consolidated statement of financial position 140
Summary consolidated income statement 141
Summary consolidated statement of comprehensive income 142
Summary consolidated statement of changes in equity 143
Summary consolidated cash flow statement 145
Summary consolidated segmental analysis 146
Selected explanatory notes to the summary consolidated financial statements 147

139
PERFORMANCEREVIEW
OUR GOVERNANCEPROFILE
SUMMARY CONSOLIDATED FINANCIAL STATEMENTS APPENDICES NOTICE OF ANNUAL
GENERAL MEETING ADMINISTRATION
SUMMARY CONSOLIDATED
FINANCIALSTATEMENTS

TFG INTEGRATED ANNUAL REPORT 2017 www.tfglimited.co.za140
INVESTMENT CASE
ABOUTTHIS REPORT
OUR PROFILE
OUR OPERATINGENVIRONMENT
OUR STRATEGY AND PERFORMANCE
SUMMARY CONSOLIDATED STATEMENT OF FINANCIAL POSITIONAT 31 MARCHThe Foschini Group Limited and its subsidiaries
2017Rm
2016Rm
ASSETSNon-current assetsProperty, plant and equipment 2 469,0 2 335,7Goodwill and intangible assets 4 675,9 5 577,8Participation in export partnerships – 8,2Deferred taxation asset 483,6 527,2
7 628,5 8 448,9
Current assetsInventory (note 4) 5 511,2 5 116,1Trade receivables – retail 7 000,7 6 695,0Other receivables and prepayments 771,0 592,9Concession receivables 246,1 347,2Participation in export partnerships – 6,2Cash 878,5 888,8
14 407,5 13 646,2Total assets 22 036,0 22 095,1
EQUITY AND LIABILITIESEquity attributable to equity holders of The Foschini Group Limited 10 515,3 9 896,7Non-controlling interest 4,2 4,0Total equity 10 519,5 9 900,7
LIABILITIESNon-current liabilitiesInterest-bearing debt 4 442,2 5 026,3Put option liability 74,7 48,1Cash-settled share incentive scheme 6,8 8,5Operating lease liability 255,7 238,2Deferred taxation liability 337,9 435,4Post-retirement defined benefit plan 233,1 217,3
5 350,4 5 973,8
Current liabilitiesInterest-bearing debt 3 307,0 3 139,4Trade and other payables 2 751,3 3 046,7Operating lease liability 15,2 10,8Taxation payable 92,6 23,7
6 166,1 6 220,6Total liabilities 11 516,5 12 194,4Total equity and liabilities 22 036,0 22 095,1

141
PERFORMANCEREVIEW
OUR GOVERNANCEPROFILE
SUMMARY CONSOLIDATED FINANCIAL STATEMENTS APPENDICES NOTICE OF ANNUAL
GENERAL MEETING ADMINISTRATION
SUMMARY CONSOLIDATED INCOME STATEMENTFOR THE YEARS ENDED 31 MARCH
The Foschini Group Limited and its subsidiaries
2017Rm
2016Rm
%CHANGE
Revenue (note 5) 26 413,6 23 746,4Retail turnover 23 548,7 21 107,5 11,6Cost of turnover (11 845,2) (10 613,1)Gross profit 11 703,5 10 494,4Interest income (note 6) 1 736,9 1 533,0Other income (note 7) 1 128,0 1 105,9Trading expenses (note 8) (10 757,2) (9 537,2)Operating profit before acquisition costs and finance costs 3 811,2 3 596,1 6,0Acquisition costs – (65,9)Finance costs (607,4) (509,0)Profit before tax 3 203,8 3 021,2Income tax expense (851,3) (863,9)Profit for the year 2 352,5 2 157,3 9,0
Attributable to:Equity holders of The Foschini Group Limited 2 351,4 2 155,6Non-controlling interest 1,1 1,7Profit for the year 2 352,5 2 157,3
Earnings per ordinary share (cents)TotalBasic 1 108,0 1 041,5 6,4Diluted (basic) 1 098,6 1 031,9 6,5
Total (excluding acquisition costs) earnings per ordinary share – refer to note 10
Weighted average ordinary shares in issue (millions) 212,2 207,0

TFG INTEGRATED ANNUAL REPORT 2017 www.tfglimited.co.za142
INVESTMENT CASE
ABOUTTHIS REPORT
OUR PROFILE
OUR OPERATINGENVIRONMENT
OUR STRATEGY AND PERFORMANCE
SUMMARY CONSOLIDATED STATEMENT OF COMPREHENSIVE INCOMEFOR THE YEARS ENDED 31 MARCHThe Foschini Group Limited and its subsidiaries
2017Rm
2016Rm
Profit for the year 2 352,5 2 157,3Other comprehensive income:Items that will never be reclassified to profit or lossActuarial losses on post-retirement defined benefit plan – (11,8)Deferred tax on items that will never be reclassified to profit or loss – 3,3Items that are or may be reclassified to profit or lossMovement in effective portion of changes in fair value of cash flow hedges 24,2 (70,3)Foreign currency translation reserve movements (793,1) 464,0Deferred tax on items that are or may be reclassified to profit or loss (6,8) 19,7Other comprehensive income for the year, net of tax (775,7) 404,9Total comprehensive income for the year 1 576,8 2 562,2
Attributable to:Equity holders of The Foschini Group Limited 1 575,7 2 560,5Non-controlling interest 1,1 1,7Total comprehensive income for the year 1 576,8 2 562,2
SUPPLEMENTARY INFORMATION2017 2016
Net ordinary shares in issue (millions) 214,0 209,3Weighted average ordinary shares in issue (millions) 212,2 207,0Tangible net asset value per ordinary share (cents) 2 728,7 2 063,5

143
PERFORMANCEREVIEW
OUR GOVERNANCEPROFILE
SUMMARY CONSOLIDATED FINANCIAL STATEMENTS APPENDICES NOTICE OF ANNUAL
GENERAL MEETING ADMINISTRATION
SUMMARY CONSOLIDATED STATEMENT OF CHANGES IN EQUITYFOR THE YEARS ENDED 31 MARCHThe Foschini Group Limited and its subsidiaries
EQUITYHOLDERS OF
THE FOSCHINIGROUP LIMITED
Rm
NON-CONTROLLING
INTERESTRm
TOTAL EQUITY
Rm
Equity at 31 March 2015 8 130,9 2,7 8 133,6Total comprehensive income for the year 2 560,5 1,7 2 562,2Profit for the year 2 155,6 1,7 2 157,3Other comprehensive income
Actuarial losses on post-retirement defined benefit plan (11,8) – (11,8)Movement in effective portion of changes in fair value of cash flow hedges (70,3) – (70,3)Foreign currency translation reserve movements 464,0 – 464,0Deferred tax on movement in other comprehensive income 23,0 – 23,0
Contributions by and distributions to ownersShare-based payments reserve movements 114,7 – 114,7Dividends paid (1 327,2) (0,4) (1 327,6)Scrip distribution: share capital issued and share premium raised 579,8 – 579,8Proceeds from sale of shares in terms of share incentive schemes 18,1 – 18,1Shares purchased in terms of share incentive schemes (193,6) – (193,6)Increase in the fair value of the put option liability (27,2) – (27,2)Current tax on shares purchased 13,6 – 13,6Deferred tax on shares purchased 27,1 – 27,1Equity at 31 March 2016 9 896,7 4,0 9 900,7

TFG INTEGRATED ANNUAL REPORT 2017 www.tfglimited.co.za144
INVESTMENT CASE
ABOUTTHIS REPORT
OUR PROFILE
OUR OPERATINGENVIRONMENT
OUR STRATEGY AND PERFORMANCE
The Foschini Group Limited and its subsidiaries
SUMMARY CONSOLIDATED STATEMENT OF CHANGES IN EQUITY CONTINUED
FOR THE YEARS ENDED 31 MARCH
EQUITYHOLDERS OF
THE FOSCHINIGROUP LIMITED
Rm
NON-CONTROLLING
INTERESTRm
TOTAL EQUITY
Rm
Equity at 31 March 2016 9 896,7 4,0 9 900,7Total comprehensive income for the year 1 575,7 1,1 1 576,8Profit for the year 2 351,4 1,1 2 352,5Other comprehensive income
Movement in effective portion of changes in fair value of cash flow hedges 24,2 – 24,2Foreign currency translation reserve movements (793,1) – (793,1)Deferred tax on movement in other comprehensive income (6,8) – (6,8)
Contributions by and distributions to ownersShare-based payments reserve movements 131,4 – 131,4Dividends paid (1 508,1) (0,9) (1 509,0)Scrip distribution: share capital issued and share premium raised 542,9 – 542,9Proceeds from sale of shares in terms of share incentive schemes 151,3 – 151,3Shares purchased in terms of share incentive schemes (234,8) – (234,8)Increase in the fair value of the put option liability (39,8) – (39,8)Equity at 31 March 2017 10 515,3 4,2 10 519,5
2017 2016
Distribution per ordinary share (cents)Interim 320,0 306,0Final 400,0 385,0Total 720,0 691,0

145
PERFORMANCEREVIEW
OUR GOVERNANCEPROFILE
SUMMARY CONSOLIDATED FINANCIAL STATEMENTS APPENDICES NOTICE OF ANNUAL
GENERAL MEETING ADMINISTRATION
The Foschini Group Limited and its subsidiaries
SUMMARY CONSOLIDATED CASH FLOW STATEMENTFOR THE YEARS ENDED 31 MARCH
2017Rm
2016Rm
Cash flows from operating activitiesOperating profit before working capital changes (note 9) 4 488,6 4 127,2Increase in working capital (1 156,5) (1 509,4)Cash generated from operations 3 332,1 2 617,8Interest income 33,1 22,3Finance costs (607,4) (509,0)Taxation paid (777,5) (921,8)Dividends paid (966,1) (747,8)Net cash inflows from operating activities 1 014,2 461,5
Cash flows from investing activitiesPurchase of property, plant and equipment and intangible assets (883,5) (901,0)Acquisition of assets through business combinations (note 11) (33,8) (152,4)Proceeds from sale of property, plant and equipment 32,0 14,6Repayment of participation in export partnerships 14,4 7,2Proceeds from disposal of investment – 1,1Net cash outflows from investing activities (870,9) (1 030,5)
Cash flows from financing activitiesShares purchased in terms of share incentive schemes (234,8) (193,6)Proceeds from sale of shares in terms of share incentive schemes 151,3 18,1Increase in interest-bearing debt 36,8 760,6Net cash (outflows) inflows from financing activities (46,7) 585,1
Net increase in cash during the year 96,6 16,1Cash at the beginning of the year 888,8 800,4Effect of exchange rate fluctuations on cash held (106,9) 72,3Cash at the end of the year 878,5 888,8
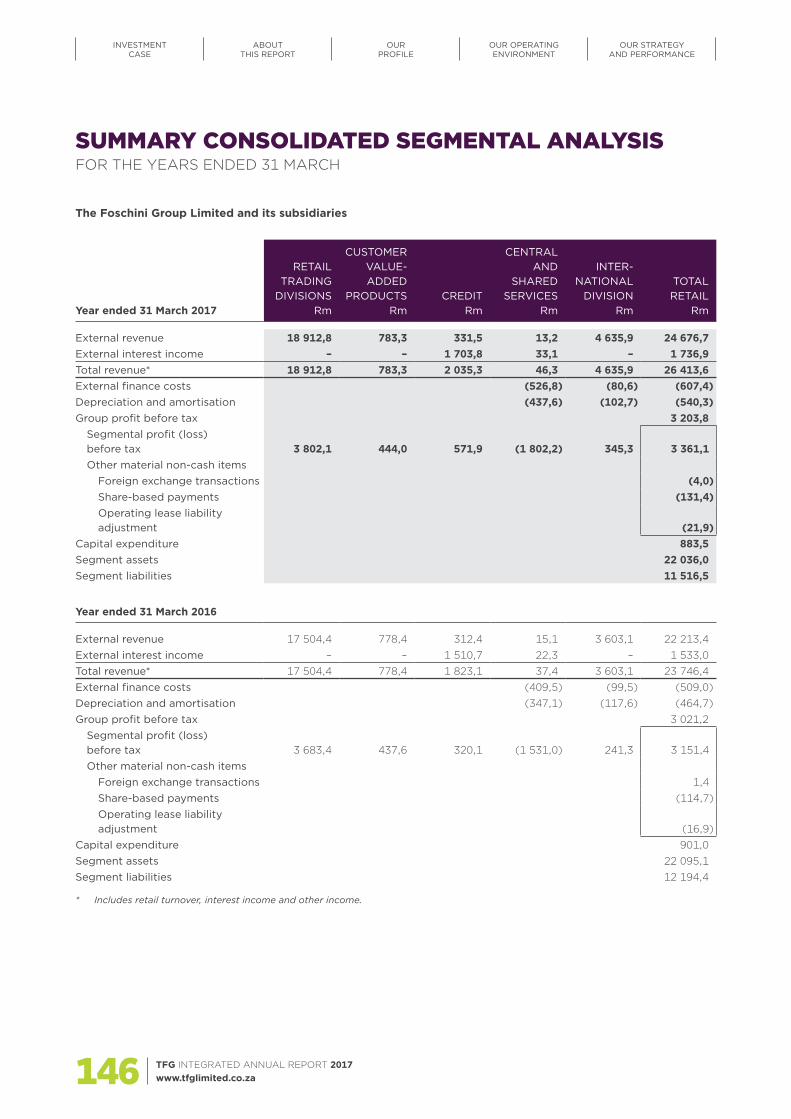
TFG INTEGRATED ANNUAL REPORT 2017 www.tfglimited.co.za146
INVESTMENT CASE
ABOUTTHIS REPORT
OUR PROFILE
OUR OPERATINGENVIRONMENT
OUR STRATEGY AND PERFORMANCE
The Foschini Group Limited and its subsidiaries
SUMMARY CONSOLIDATED SEGMENTAL ANALYSISFOR THE YEARS ENDED 31 MARCH
Year ended 31 March 2017
RETAILTRADING
DIVISIONSRm
CUSTOMERVALUE-ADDED
PRODUCTSRm
CREDITRm
CENTRALAND
SHAREDSERVICES
Rm
INTER-NATIONAL
DIVISIONRm
TOTALRETAIL
Rm
External revenue 18 912,8 783,3 331,5 13,2 4 635,9 24 676,7External interest income – – 1 703,8 33,1 – 1 736,9Total revenue* 18 912,8 783,3 2 035,3 46,3 4 635,9 26 413,6External finance costs (526,8) (80,6) (607,4)Depreciation and amortisation (437,6) (102,7) (540,3)Group profit before tax 3 203,8
Segmental profit (loss) before tax 3 802,1 444,0 571,9 (1 802,2) 345,3 3 361,1 Other material non-cash items
Foreign exchange transactions (4,0)Share-based payments (131,4)Operating lease liability adjustment (21,9)
Capital expenditure 883,5Segment assets 22 036,0Segment liabilities 11 516,5
Year ended 31 March 2016
External revenue 17 504,4 778,4 312,4 15,1 3 603,1 22 213,4External interest income – – 1 510,7 22,3 – 1 533,0Total revenue* 17 504,4 778,4 1 823,1 37,4 3 603,1 23 746,4External finance costs (409,5) (99,5) (509,0)Depreciation and amortisation (347,1) (117,6) (464,7)Group profit before tax 3 021,2
Segmental profit (loss) before tax 3 683,4 437,6 320,1 (1 531,0) 241,3 3 151,4Other material non-cash items
Foreign exchange transactions 1,4Share-based payments (114,7)Operating lease liability adjustment (16,9)
Capital expenditure 901,0Segment assets 22 095,1Segment liabilities 12 194,4
* Includes retail turnover, interest income and other income.

147
PERFORMANCEREVIEW
OUR GOVERNANCEPROFILE
SUMMARY CONSOLIDATED FINANCIAL STATEMENTS APPENDICES NOTICE OF ANNUAL
GENERAL MEETING ADMINISTRATION
The Foschini Group Limited and its subsidiaries
SELECTED EXPLANATORY NOTES TO THE SUMMARY CONSOLIDATED FINANCIAL STATEMENTSFOR THE YEARS ENDED 31 MARCH
REPORT OF THE INDEPENDENT AUDITORSThe summary consolidated financial statements for the year ended 31 March 2017 have been audited by KPMG Inc., who expressed an unmodified opinion thereon. The auditors also expressed an unmodified opinion on the annual consolidated financial statements from which these summary consolidated financial statements were derived. A copy of the auditors’ report on the annal consolidated financial statements and the summary consolidated financial statements are available for inspection at the company’s registered office.
1. Basis of preparation The summary consolidated financial statements for the year ended 31 March 2017 are prepared in accordance with
the framework concepts and the measurement and recognition requirements of International Financial Reporting Standards (IFRS) and to also, as a minimum, contain the information required by IAS 34 Interim Financial Reporting and in accordance with the requirements of the Companies Act of South Africa as applicable to summary financial statements. The accounting policies applied in the preparation of the consolidated financial statements, from which the summary consolidated financial statements were derived, are in terms of International Financial Reporting Standards and are consistent with the accounting policies applied in the preparation of the previous consolidated annual financial statements.
2. During the year, the Group adopted the following revised accounting standards:
• Annual Improvements to IFRSs 2012–2014 Cycle – various standards• Disclosure Initiative (Amendments to IAS 1)
The adoption of these standards had no material impact on these results.
3. These financial statements incorporate the financial statements of the company, all its subsidiaries and all entities over which it has operational and financial control.
2017Rm
2016Rm
4. InventoryInventory at year end 5 511,2 5 116,1Inventory write-downs included above 233,0 174,9
5. RevenueRetail turnover 23 548,7 21 107,5Interest income (note 6) 1 736,9 1 533,0Other income (note 7) 1 128,0 1 105,9
26 413,6 23 746,4
6. Interest incomeTrade receivables – retail 1 703,8 1 510,7Sundry 33,1 22,3
1 736,9 1 533,0

TFG INTEGRATED ANNUAL REPORT 2017 www.tfglimited.co.za148
INVESTMENT CASE
ABOUTTHIS REPORT
OUR PROFILE
OUR OPERATINGENVIRONMENT
OUR STRATEGY AND PERFORMANCE
The Foschini Group Limited and its subsidiaries
SELECTED EXPLANATORY NOTES TO THE SUMMARY CONSOLIDATED FINANCIAL STATEMENTS CONTINUED
FOR THE YEARS ENDED 31 MARCH
2017Rm
2016Rm
7. Other incomePublishing income 400,8 399,4Collection cost recovery 331,5 312,4Insurance income 289,0 297,8Mobile One2One airtime income 93,5 81,2Sundry income 13,2 15,1
1 128,0 1 105,9
8. Trading expensesDepreciation and amortisation (540,3) (464,7)Employee costs (3 669,8) (3 210,8)Occupancy costs (2 431,8) (2 043,2)Net bad debt (896,1) (947,7)Other operating costs (3 219,2) (2 870,8)
(10 757,2) (9 537,2)
9. Operating profit before working capital changesProfit before tax 3 203,8 3 021,2Finance costs 607,4 509,0Operating profit before finance costs 3 811,2 3 530,2Interest income – sundry (33,1) (22,3)Non-cash items 710,5 619,3
Depreciation and amortisation 540,3 464,7Operating lease liability adjustment 21,9 16,9Share-based payments 131,4 114,7Post-retirement defined benefit medical aid movement 15,8 12,9Foreign currency translation reserve movements 4,0 1,4Cash-settled share incentive scheme – 7,7Profit on disposal of investment – (1,1)Loss on disposal of property, plant and equipment 12,2 7,1Profit on disposal of property, plant and equipment (15,1) (5,0)
4 488,6 4 127,2
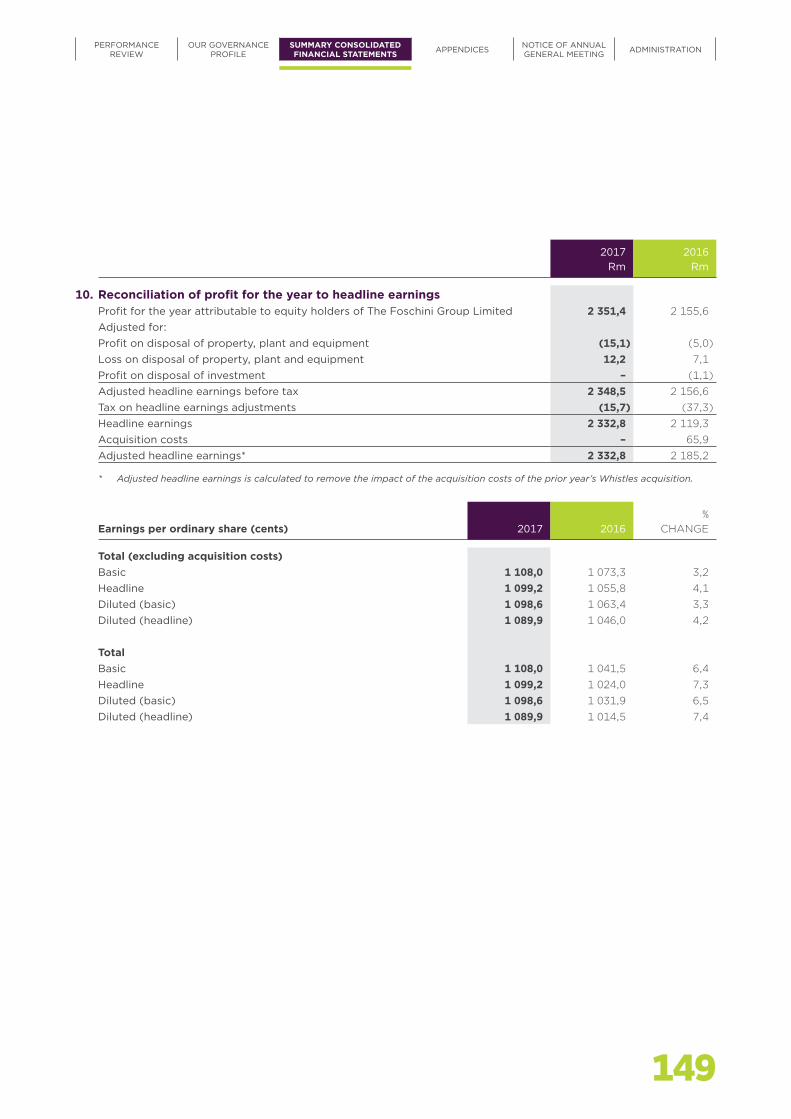
149
PERFORMANCEREVIEW
OUR GOVERNANCEPROFILE
SUMMARY CONSOLIDATED FINANCIAL STATEMENTS APPENDICES NOTICE OF ANNUAL
GENERAL MEETING ADMINISTRATION
2017Rm
2016Rm
10. Reconciliation of profit for the year to headline earningsProfit for the year attributable to equity holders of The Foschini Group Limited 2 351,4 2 155,6Adjusted for:Profit on disposal of property, plant and equipment (15,1) (5,0)Loss on disposal of property, plant and equipment 12,2 7,1Profit on disposal of investment – (1,1)Adjusted headline earnings before tax 2 348,5 2 156,6Tax on headline earnings adjustments (15,7) (37,3)Headline earnings 2 332,8 2 119,3Acquisition costs – 65,9Adjusted headline earnings* 2 332,8 2 185,2
* Adjusted headline earnings is calculated to remove the impact of the acquisition costs of the prior year’s Whistles acquisition.
Earnings per ordinary share (cents) 2017 2016%
CHANGE
Total (excluding acquisition costs)Basic 1 108,0 1 073,3 3,2Headline 1 099,2 1 055,8 4,1Diluted (basic) 1 098,6 1 063,4 3,3Diluted (headline) 1 089,9 1 046,0 4,2
TotalBasic 1 108,0 1 041,5 6,4Headline 1 099,2 1 024,0 7,3Diluted (basic) 1 098,6 1 031,9 6,5Diluted (headline) 1 089,9 1 014,5 7,4

TFG INTEGRATED ANNUAL REPORT 2017 www.tfglimited.co.za150
INVESTMENT CASE
ABOUTTHIS REPORT
OUR PROFILE
OUR OPERATINGENVIRONMENT
OUR STRATEGY AND PERFORMANCE
The Foschini Group Limited and its subsidiaries
SELECTED EXPLANATORY NOTES TO THE SUMMARY CONSOLIDATED FINANCIAL STATEMENTS CONTINUED
FOR THE YEARS ENDED 31 MARCH
11. Acquisition during the yearDamsel in a DressOn 3 February 2017, the Group acquired 100% of the inventory and the brand of Damsel in a Dress Limited, which trades as Damsel in a Dress. Consideration of £2 million was paid to acquire the rights to the brand and inventory of Damsel in a Dress Limited. The brand will be managed within the International division.
12. Related partiesThe Group entered into related party transactions in the ordinary course of business, the substance of which are similar to those disclosed in the Group’s annual financial statements for the year ended 31 March 2016.
13. Fair valueThe carrying value less impairment provision of trade receivables and payables are assumed to approximate their fair values due to their short-term nature. The Group only has level 2 financial instruments. There are no level 1 or level 3 financial instruments within the Group and there were no transfers between levels during the year.
14. Subsequent eventsWith effect from 3 April 2017, the Group acquired 14 G-Star Raw franchise stores in Australia for AUD13,9 million.
The Group is acquiring 100% of the share capital of the Retail Apparel Group Pty Ltd (RAG). RAG is a leading speciality menswear retailer in the Australian market. The purchase is capped at the lower of 7 times RAG’s audited normalised EBITDA, for the year ending June 2017, and AUD302,5 million which will then be adjusted for normalised working capital and net debt at acquisition. The expected purchase price has been hedged.
No further significant events took place between the year ended 31 March 2017 and date of issue of this report.
15. Changes in directorsThere were no changes in directors during the current year.

PERFORMANCEREVIEW
OUR GOVERNANCEPROFILE
SUMMARY CONSOLIDATED FINANCIAL STATEMENTS APPENDICES NOTICE OF ANNUAL
GENERAL MEETING ADMINISTRATION
151

TFG INTEGRATED ANNUAL REPORT 2017 www.tfglimited.co.za152
INVESTMENT CASE
ABOUTTHIS REPORT
OUR PROFILE
OUR OPERATINGENVIRONMENT
OUR STRATEGY AND PERFORMANCE
Appendix 1: Definitions 154
Appendix 2:10-year statistics 156
Appendix 3:Consolidated performance table 160
Appendix 4:Subsidiary companies 162
Appendix 5:Shareholdings of The Foschini Group Limited 163
Appendix 6: Exchange rate and share performance information 165
Appendix 7:BBBEE compliance report 166

153
APPENDICES
PERFORMANCEREVIEW
OUR GOVERNANCEPROFILE
SUMMARY CONSOLIDATED FINANCIAL STATEMENTS APPENDICES NOTICE OF ANNUAL
GENERAL MEETING ADMINISTRATION

TFG INTEGRATED ANNUAL REPORT 2017 www.tfglimited.co.za154
INVESTMENT CASE
ABOUTTHIS REPORT
OUR PROFILE
OUR OPERATINGENVIRONMENT
OUR STRATEGY AND PERFORMANCE
Concession arrangement In addition to their own stand-alone stores, TFG International has concession arrangements with key department store partners from whom they occupy an agreed floor space area (referred to as “mat”) dedicated to their product
COSO Committee of Sponsoring OrganisationsCurrent ratio Current assets divided by current liabilitiesDebt to equity ratio Net borrowings expressed as a percentage of total equityDividend cover Basic earnings per share divided by dividend declaredDoubtful debt provision as a % of debtors’ book
Provision for doubtful debts expressed as a percentage of gross receivables
EBITDA Earnings before finance costs, tax, depreciation and amortisationEBITDA finance charge cover EBITDA divided by finance costsFinance charge cover Operating profit before finance charges divided by finance costsFree cash flow Earnings before interest and tax plus depreciation and amortisation
net of changes in net working capital and capital expenditureGross square metre The total leased store area including stock roomsHeadline earnings Net income attributable to ordinary shareholders adjusted for the effect,
after tax, of exceptional itemsHeadline earnings – adjusted Headline earnings adjusted for the impact of acquisition costs incurredHeadline earnings per ordinary share Headline earnings divided by the weighted average number of shares
in issue for the yearLSM Refers to the SAARF Universal Living Standards Measure, which is a
unique means of segmenting the South African market by dividing the population into 10 LSM groups, 1 (lowest) to 10 (highest) – refer to the table on the next page
Market capitalisation The market price per share at year end multiplied by the number of ordinary shares in issue at year end
Net bad debt as a % of debtors’ book VAT-exclusive bad debts, net of recoveries and including provision movement as percentage of gross receivables
Net bad debt write-off VAT-inclusive bad debts, net of recoveries and excluding movement in provision
Net bad debt write-off as a % of credit transactions
Net bad debt write-off expressed as a percentage of credit transactions
Net bad debt write-off as a % of debtors’ book
Net bad debt write-off expressed as a percentage of gross receivables
Net borrowings Interest-bearing debt and non-controlling interest loans reduced by preference share investment (where relevant) and cash
Non-recourse debt Debt where lenders cannot seek compensation from TFG parent companies, their sponsors or guarantors, and is typically debt raised by our international companies
Omnichannel Describes multi-channel retailing (e-commerce, online sales, mobile app sales)
Operating margin Operating profit before finance charges expressed as a percentage of retail turnover
Operating profit Profit earned from normal business operationsOverdue values as a % to debtors’ book Overdue portion of debtors at statement month end as a percentage
of gross receivablesOutlets TFG International trades through a combination of stand-alone stores
and concession arrangements resulting in their presence being referred to as outlets rather than the traditional stores
APPENDIX 1:DEFINITIONS

155
Recourse debt Amounts owed by TFG companies in Africa (excluding our international subsidiaries) where the lenders have the ability to claim for damages from the borrower’s parent, sponsor or guarantor
Recourse debt to equity ratio Recourse debt reduced by preference share investment (where relevant) and cash, expressed as a percentage of total equity
Return on capital employed (ROCE) Earnings before interest and tax (EBIT)/average capital employedSame store Stores that traded out of the same trading area for the full current
and previous financial yearsTangible net asset value per ordinary share Total net asset value, after non-controlling interest, excluding goodwill
and intangible assets, divided by the net number of ordinary shares in issue at year end
Trading expenses Costs incurred in the normal course of business, including among others, depreciation, amortisation, employee costs, occupancy costs, net bad debt and other operating costs
SOUTH AFRICAN ADULT (15+): POPULATION SPLIT BY LSM: AVERAGE MONTHLY HOUSEHOLD INCOME
Source: AMPS Individual Databases (2014B, 2015B)*
Notes:
All adults aged 15+
Average income is calculated using the midpoint of the income bands provided by AMPS. Maximum category in 2014B and 2015B is R60 000+, and the value R60 000 was used in this instance.
LSM refers to SAARF Universal Living Standards Measure
All Rand values are nominal (inflation is not taken into account)
LSMPopulation
2015B
% Population
2010
% Population
2011
% Population
2012
% Population
2013
% Population
2014
% Population
2015B
Average monthly
household income 2015B
Average monthly
household income 2014B
LSM 1 423 803 2,4 1,9 1,6 1,4 1,6 1,1 R2 225 R2 168LSM 2 1 033 699 5,7 5,1 4,1 3,6 3,3 2,7 R3 353 R2 886LSM 3 2 196 284 7,0 6,1 6,2 5,7 5,2 5,7 R3 358 R3 307LSM 4 4 908 513 14,0 12,2 13,0 11,6 12,3 12,8 R4 157 R4 068LSM 5 6 408 562 16,6 17,4 17,1 16,4 15,9 16,8 R5 636 R5 016LSM 6 8 707 403 20,3 22,4 22,6 23,7 23,6 22,8 R7 869 R7 387LSM 7 5 193 862 10,6 11,4 11,4 12,3 13,0 13,6 R13 285 R12 923LSM 8 3 300 143 8,3 8,4 8,6 8,8 8,8 8,6 R19 397 R17 224LSM 9 3 705 911 8,9 8,9 9,4 10,0 10,0 9,7 R26 337 R24 292LSM 10 2 380 729 6,2 6,2 6,0 6,5 6,3 6,2 R38 970 R36 838Total 38 258 909 100,0 100,0 100,0 100,0 100,0 100,0 R12 459 R11 276
* This survey was the last survey published by AMPS. Currently, a replacement survey is being investigated by SAARF.
PERFORMANCEREVIEW
OUR GOVERNANCEPROFILE
SUMMARY CONSOLIDATED FINANCIAL STATEMENTS APPENDICES NOTICE OF ANNUAL
GENERAL MEETING ADMINISTRATION

TFG INTEGRATED ANNUAL REPORT 2017 www.tfglimited.co.za156
INVESTMENT CASE
ABOUTTHIS REPORT
OUR PROFILE
OUR OPERATINGENVIRONMENT
OUR STRATEGY AND PERFORMANCE
Years ended 2017 2016 2015 2014 2013 2012 2011 2010 2009 2008
Profitability
Retail turnover (Rm) 23 548,7 21 107,5 16 085,9 14 159,0 12 896,4 11 630,5 9 936,5 8 605,2 8 089,6 7 668,7
Operating profit before finance charges – continuing operations (Rm)* 3 811,2 3 596,1 2 807,1 2 536,9 2 407,3 2 232,6 1 845,1 1 559,3 1 686,4 1 521,5
Profit before tax – continuing operations (Rm) 3 203,8 3 021,2 2 286,6 2 375,1 2 298,9 2 156,4 1 775,5 1 485,2 1 573,2 1 515,8
Profit attributable to equity holders of The Foschini Group Limited (Rm) 2 351,4 2 155,6 1 858,0 1 859,6 1 792,0 1 582,1 1 301,8 1 085,6 1 145,8 1 128,4
Adjusted headline earnings (Rm)** 2 332,8 2 185,2 1 881,9 1 872,3 1 796,6 1 584,2 1 305,6 1 085,6 1 145,8 1 128,4
Statement of financial position
Non-current assets (Rm) 7 628,5 8 448,9 6 925,3 2 120,5 1 883,1 1 623,8 1 353,1 1 380,5 1 363,3 1 284,4
Current assets (Rm) 14 407,5 13 646,2 11 608,1 9 351,2 8 425,9 7 281,2 6 156,0 4 949,9 4 608,7 3 982,1
Assets of disposal group (Rm) – – – 5 631,5 4 985,4 3 912,9 3 164,3 2 883,7 2 679,7 1 897,7Total assets (Rm) 22 036,0 22 095,1 18 533,4 17 103,2 15 294,4 12 817,9 10 673,4 9 214,1 8 651,7 7 164,2
Total shareholders’ interest (Rm) 10 515,3 9 896,7 8 130,9 7 228,6 7 043,8 6 293,1 5 462,9 5 058,3 4 496,3 3 845,2
Non-controlling interest (Rm) 4,2 4,0 2,7 861,3 705,5 571,1 485,6 427,0 359,2 290,9
Non-current liabilities (Rm) 5 350,4 5 973,8 4 491,4 2 016,0 1 392,4 1 048,4 1 251,7 1 226,4 1 301,6 1 036,7
Current liabilities (Rm) 6 166,1 6 220,6 5 908,4 3 296,1 2 750,3 2 284,8 1 417,3 764,3 769,4 712,1
Liabilities of disposal group (Rm) – – – 3 701,2 3 402,4 2 620,5 2 055,9 1 738,1 1 725,2 1 279,3Total equity and liabilities (Rm) 22 036,0 22 095,1 18 533,4 17 103,2 15 294,4 12 817,9 10 673,4 9 214,1 8 651,7 7 164,2
Cash flow statement
Cash flows from operating activities – continuing operations (Rm) 1 014,2 461,5 (61,7) 128,2 485,2 (77,9) 190,8 352,0 640,3 (47,8)
Cash flows from investing activities – continuing operations (Rm) (870,9) (1 030,5) (1 779,6) (537,5) (557,0) (377,2) (353,9) (264,0) (517,1) (15,6)
Cash flows from financing activities – continuing operations (Rm) (46,7) 585,1 2 328,5 339,5 121,4 666,9 179,4 (131,1) (17,2) 20,3
Net increase (decrease) in cash (Rm) 96,6 16,1 487,2 (69,8) 49,6 211,8 16,3 (43,1) 106,0 (43,1)
Cash at the beginning of the year (Rm) 888,8 800,4 301,3 593,4 504,7# 338,5 284,0 296,2 169,5 202,3##
Cash at the end of the year – discontinued operations (Rm) – – – (222,4) 39,0 160,5 38,2 30,9 20,7 10,3
Effect of exchange rate fluctuations on cash held (Rm) (106,9) 72,3 11,9 0,1 0,1 0,1 – – – –Cash at the end of the year – continuing operations (Rm) 878,5 888,8 800,4 301,3 593,4 710,9 338,5 284,0 296,2 169,5
NotesWhen an accounting policy changed, comparative figures were restated in accordance with the new policy.
2013 and prior years were restated where appropriate to reflect the RCS Group as a discontinued operation.
* Operating profit before finance charges excludes the impact of the acquisition costs relating to the Whistles (2016) and Phase Eight (2015) acquisitions.
** Adjusted headline earnings is calculated to remove the impact of the acquisition costs relating to the Whistles (2016) and Phase Eight (2015) acquisitions.
# Restated as insurance cells are no longer consolidated and their cash flow is now included in working capital as part of the insurance receivables.
## In 2008, cash balances were restated to include an amount previously set off against interest-bearing debt.
APPENDIX 2:10-YEAR STATISTICS

157
Years ended 2017 2016 2015 2014 2013 2012 2011 2010 2009 2008
Profitability
Retail turnover (Rm) 23 548,7 21 107,5 16 085,9 14 159,0 12 896,4 11 630,5 9 936,5 8 605,2 8 089,6 7 668,7
Operating profit before finance charges – continuing operations (Rm)* 3 811,2 3 596,1 2 807,1 2 536,9 2 407,3 2 232,6 1 845,1 1 559,3 1 686,4 1 521,5
Profit before tax – continuing operations (Rm) 3 203,8 3 021,2 2 286,6 2 375,1 2 298,9 2 156,4 1 775,5 1 485,2 1 573,2 1 515,8
Profit attributable to equity holders of The Foschini Group Limited (Rm) 2 351,4 2 155,6 1 858,0 1 859,6 1 792,0 1 582,1 1 301,8 1 085,6 1 145,8 1 128,4
Adjusted headline earnings (Rm)** 2 332,8 2 185,2 1 881,9 1 872,3 1 796,6 1 584,2 1 305,6 1 085,6 1 145,8 1 128,4
Statement of financial position
Non-current assets (Rm) 7 628,5 8 448,9 6 925,3 2 120,5 1 883,1 1 623,8 1 353,1 1 380,5 1 363,3 1 284,4
Current assets (Rm) 14 407,5 13 646,2 11 608,1 9 351,2 8 425,9 7 281,2 6 156,0 4 949,9 4 608,7 3 982,1
Assets of disposal group (Rm) – – – 5 631,5 4 985,4 3 912,9 3 164,3 2 883,7 2 679,7 1 897,7Total assets (Rm) 22 036,0 22 095,1 18 533,4 17 103,2 15 294,4 12 817,9 10 673,4 9 214,1 8 651,7 7 164,2
Total shareholders’ interest (Rm) 10 515,3 9 896,7 8 130,9 7 228,6 7 043,8 6 293,1 5 462,9 5 058,3 4 496,3 3 845,2
Non-controlling interest (Rm) 4,2 4,0 2,7 861,3 705,5 571,1 485,6 427,0 359,2 290,9
Non-current liabilities (Rm) 5 350,4 5 973,8 4 491,4 2 016,0 1 392,4 1 048,4 1 251,7 1 226,4 1 301,6 1 036,7
Current liabilities (Rm) 6 166,1 6 220,6 5 908,4 3 296,1 2 750,3 2 284,8 1 417,3 764,3 769,4 712,1
Liabilities of disposal group (Rm) – – – 3 701,2 3 402,4 2 620,5 2 055,9 1 738,1 1 725,2 1 279,3Total equity and liabilities (Rm) 22 036,0 22 095,1 18 533,4 17 103,2 15 294,4 12 817,9 10 673,4 9 214,1 8 651,7 7 164,2
Cash flow statement
Cash flows from operating activities – continuing operations (Rm) 1 014,2 461,5 (61,7) 128,2 485,2 (77,9) 190,8 352,0 640,3 (47,8)
Cash flows from investing activities – continuing operations (Rm) (870,9) (1 030,5) (1 779,6) (537,5) (557,0) (377,2) (353,9) (264,0) (517,1) (15,6)
Cash flows from financing activities – continuing operations (Rm) (46,7) 585,1 2 328,5 339,5 121,4 666,9 179,4 (131,1) (17,2) 20,3
Net increase (decrease) in cash (Rm) 96,6 16,1 487,2 (69,8) 49,6 211,8 16,3 (43,1) 106,0 (43,1)
Cash at the beginning of the year (Rm) 888,8 800,4 301,3 593,4 504,7# 338,5 284,0 296,2 169,5 202,3##
Cash at the end of the year – discontinued operations (Rm) – – – (222,4) 39,0 160,5 38,2 30,9 20,7 10,3
Effect of exchange rate fluctuations on cash held (Rm) (106,9) 72,3 11,9 0,1 0,1 0,1 – – – –Cash at the end of the year – continuing operations (Rm) 878,5 888,8 800,4 301,3 593,4 710,9 338,5 284,0 296,2 169,5
NotesWhen an accounting policy changed, comparative figures were restated in accordance with the new policy.
2013 and prior years were restated where appropriate to reflect the RCS Group as a discontinued operation.
* Operating profit before finance charges excludes the impact of the acquisition costs relating to the Whistles (2016) and Phase Eight (2015) acquisitions.
** Adjusted headline earnings is calculated to remove the impact of the acquisition costs relating to the Whistles (2016) and Phase Eight (2015) acquisitions.
# Restated as insurance cells are no longer consolidated and their cash flow is now included in working capital as part of the insurance receivables.
## In 2008, cash balances were restated to include an amount previously set off against interest-bearing debt.
PERFORMANCEREVIEW
OUR GOVERNANCEPROFILE
SUMMARY CONSOLIDATED FINANCIAL STATEMENTS APPENDICES NOTICE OF ANNUAL
GENERAL MEETING ADMINISTRATION

TFG INTEGRATED ANNUAL REPORT 2017 www.tfglimited.co.za158
INVESTMENT CASE
ABOUTTHIS REPORT
OUR PROFILE
OUR OPERATINGENVIRONMENT
OUR STRATEGY AND PERFORMANCE
Years ended 2017 2016 2015 2014 2013 2012 2011 2010 2009 2008
Performance measures/ratios
Turnover growth (%) 11,6 31,2 13,6 9,8 10,9 17,0 15,5 6,4 5,5 6,1
Same store turnover growth (TFG Africa) (%) 2,8 5,7 5,5 4,2 5,8 10,6 10,8 – – 2,2
Operating margin – continuing operations (%) 16,2 17,0 17,5 17,9 18,7 19,2 18,6 18,1 20,8 19,8
Debt to equity ratio – continuing operations (%) 65,3 73,5 76,8 36,8 22,3 20,7 20,1 14,4 20,1 26,5
Total liabilities to shareholders’ interest (times) 1,1 1,2 1,3 1,2 1,1 0,9 0,9 0,7 0,8 0,8
Total liabilities to shareholders’ interest – continuing operations (times) 1,1 1,2 1,3 0,7 0,6 0,5 0,5 0,5 0,6 0,5
Net retail borrowings (Rm) 6 870,7 7 276,9 6 242,2 2 659,1 1 567,4 726,1 237,6 (169,4) 18,7 253,7
Current ratio – continuing operations (times) 2,3 2,2 2,0 2,8 3,1 3,2 4,3 6,5 5,9 5,5
Headline earnings per ordinary share (HEPS) – continuing operations** (cents) 1 099,2 1 055,8 897,9 818,7 780,6 653,9 537,3 440,7 488,8 458,2
Change in HEPS from continuing operations (%) 4,1 17,6 9,7 4,9 19,4 21,7 21,9 (9,8) 6,7 4,6
Distribution declared per ordinary share (DPS) (cents) 720,0 691,0 588,0 536,0 506,0 455,0 350,0 288,0 288,0 288,0
Tangible net asset value per ordinary share (cents) 2 728,7 2 063,5 1 701,0 3 396,3 3 205,0 2 918,9 2 598,3 2 316,7 2 075,3 1 809,5
Market capitalisation (Rm) 33 912,9 30 459,2 38 101,2 23 787,8 25 774,6 29 744,8 20 480,8 16 113,4 10 567,5 9 261,6
Statistics
Number of ordinary shares in issue (millions) 219,5 215,4 211,0 222,0 228,5 240,5 240,5 240,5 240,5 240,5
Number of ordinary shares on which headline earnings per share is calculated (millions) 212,2 207,0 204,3 206,0 209,3 205,2 206,5 208,2 204,8 206,3
Net number of ordinary shares on which net asset value per share is calculated (millions) 214,0 209,3 205,4 204,3 210,1 206,4 205,3 209,0 207,3 204,6
Closing share price (cents) 15 449 14 144 18 057 10 715 11 280 12 368 8 465 6 700 4 394 3 851
Number of outlets 3 328 3 125 2 724 2 111 1 979 1 857 1 727 1 627 1 539 1 393
Floor area (gross square metre) (TFG Africa) 767 347 735 367 690 190 646 665 609 411 579 365 537 951 505 676 467 420 410 378
NotesWhen an accounting policy changed, comparative figures were restated in accordance with the new policy.
2013 and prior years were restated where appropriate to reflect the RCS Group as a discontinued operation.
** Adjusted headline earnings is calculated to remove the impact of the acquisition costs relating to the Whistles (2016) and Phase Eight (2015) acquisitions.
APPENDIX 2:10-YEAR STATISTICS CONTINUED

159
Years ended 2017 2016 2015 2014 2013 2012 2011 2010 2009 2008
Performance measures/ratios
Turnover growth (%) 11,6 31,2 13,6 9,8 10,9 17,0 15,5 6,4 5,5 6,1
Same store turnover growth (TFG Africa) (%) 2,8 5,7 5,5 4,2 5,8 10,6 10,8 – – 2,2
Operating margin – continuing operations (%) 16,2 17,0 17,5 17,9 18,7 19,2 18,6 18,1 20,8 19,8
Debt to equity ratio – continuing operations (%) 65,3 73,5 76,8 36,8 22,3 20,7 20,1 14,4 20,1 26,5
Total liabilities to shareholders’ interest (times) 1,1 1,2 1,3 1,2 1,1 0,9 0,9 0,7 0,8 0,8
Total liabilities to shareholders’ interest – continuing operations (times) 1,1 1,2 1,3 0,7 0,6 0,5 0,5 0,5 0,6 0,5
Net retail borrowings (Rm) 6 870,7 7 276,9 6 242,2 2 659,1 1 567,4 726,1 237,6 (169,4) 18,7 253,7
Current ratio – continuing operations (times) 2,3 2,2 2,0 2,8 3,1 3,2 4,3 6,5 5,9 5,5
Headline earnings per ordinary share (HEPS) – continuing operations** (cents) 1 099,2 1 055,8 897,9 818,7 780,6 653,9 537,3 440,7 488,8 458,2
Change in HEPS from continuing operations (%) 4,1 17,6 9,7 4,9 19,4 21,7 21,9 (9,8) 6,7 4,6
Distribution declared per ordinary share (DPS) (cents) 720,0 691,0 588,0 536,0 506,0 455,0 350,0 288,0 288,0 288,0
Tangible net asset value per ordinary share (cents) 2 728,7 2 063,5 1 701,0 3 396,3 3 205,0 2 918,9 2 598,3 2 316,7 2 075,3 1 809,5
Market capitalisation (Rm) 33 912,9 30 459,2 38 101,2 23 787,8 25 774,6 29 744,8 20 480,8 16 113,4 10 567,5 9 261,6
Statistics
Number of ordinary shares in issue (millions) 219,5 215,4 211,0 222,0 228,5 240,5 240,5 240,5 240,5 240,5
Number of ordinary shares on which headline earnings per share is calculated (millions) 212,2 207,0 204,3 206,0 209,3 205,2 206,5 208,2 204,8 206,3
Net number of ordinary shares on which net asset value per share is calculated (millions) 214,0 209,3 205,4 204,3 210,1 206,4 205,3 209,0 207,3 204,6
Closing share price (cents) 15 449 14 144 18 057 10 715 11 280 12 368 8 465 6 700 4 394 3 851
Number of outlets 3 328 3 125 2 724 2 111 1 979 1 857 1 727 1 627 1 539 1 393
Floor area (gross square metre) (TFG Africa) 767 347 735 367 690 190 646 665 609 411 579 365 537 951 505 676 467 420 410 378
NotesWhen an accounting policy changed, comparative figures were restated in accordance with the new policy.
2013 and prior years were restated where appropriate to reflect the RCS Group as a discontinued operation.
** Adjusted headline earnings is calculated to remove the impact of the acquisition costs relating to the Whistles (2016) and Phase Eight (2015) acquisitions.
PERFORMANCEREVIEW
OUR GOVERNANCEPROFILE
SUMMARY CONSOLIDATED FINANCIAL STATEMENTS APPENDICES NOTICE OF ANNUAL
GENERAL MEETING ADMINISTRATION

TFG INTEGRATED ANNUAL REPORT 2017 www.tfglimited.co.za160
INVESTMENT CASE
ABOUTTHIS REPORT
OUR PROFILE
OUR OPERATINGENVIRONMENT
OUR STRATEGY AND PERFORMANCE
Performance indicator % CHANGE 2017 2016
Economic and related core baseline indicatorsRetail turnover (Rm) 11,6 23 548,7 21 107,5Operating profit before finance costs and acquisition costs (Rm) 6,0 3 811,2 3 596,1EBITDA (Rm)* 7,2 4 351,5 4 060,8Adjusted headline earnings (Rm) 6,8 2 332,8 2 185,2Earnings per ordinary share excluding acquisition costs (cents) 3,2 1 108,0 1 073,3Headline earnings per ordinary share excluding acquisition costs (cents) 4,1 1 099,2 1 055,8Distribution declared per ordinary share (cents) 4,2 720,0 691,0Value added (Rm) 9,2 8 059,7 7 377,6Total number of outlets 6,5 3 328 3 125Total number of distribution centres^ – 8 8Number of environmental, health and safety and/or governance legal incidents – zero zero
Employee indicatorsTotal number of employeesPermanent full-time employees (0,4) 14 987 15 053Permanent part-time employees 4,1 2 297 2 207Flexitime employees 2,4 4 834 4 721Contract employees 72,4 1 288 747Casual employees (57,9) 64 152Employee turnover (excluding contractors) (%) 1,9 37,8 37,1Employment equity (% representation of previously disadvantaged groups among permanent employees) – South Africa onlyTop management (9,9) 10,0 11,1Senior management 6,6 24,1 22,6Specialists and middle management 5,2 52,4 49,8Skilled technical and junior management 4,5 90,0 86,1Semi-skilled and unskilled employees 0,4 98,6 98,2Investment in employee training and developmentTotal expenditure (Rm) 10,6 138,2 124,9% of payroll (2,6) 3,8 3,9Total number of employees trained# 9,3 126 806 116 043Work-related fatalities – zero zeroNumber of classified injuriesNumber of days lost 18,1 1 671 1 415Number of incidents 134,8 1 263 538Number of incidents where days off three or less 173,8 1 024 374Number of work days lost due to industrial action – zero zero
Corporate social investment – TFG AfricaCSI total spend (Rm) 21,4 8,5 7,0Merchandise donations for the benefit of the Feel Good Project (Rm) (8,0) 25,2 27,4
* Excludes acquisition costs.^ South Africa only.# Refers to attendees and not individual employees.
APPENDIX 3:CONSOLIDATED PERFORMANCE TABLE

161
Performance indicator % CHANGE 2017 2016
Environmental matters – TFG AfricaPurchased electricity usage (kilowatt-hours) (stores, distribution centres and offices) (millions) 5,1 164,1 156,1
Carbon footprint (tonnes CO2e) – TFG AfricaTotal emissions 9,5 226 921 207 301Scope 1 (1,5) 3 519 3 574Scope 2 3,4 157 120 152 020Scope 3 30,0 64 442 49 585Non-Kyoto (13,3) 1 840 2 122Intensity: emissions per m2 (including stores) (3,8) 0,25 0,26Water consumption (kilolitres) (head offices and distribution centres) 17,6 69 301 58 924
PERFORMANCEREVIEW
OUR GOVERNANCEPROFILE
SUMMARY CONSOLIDATED FINANCIAL STATEMENTS APPENDICES NOTICE OF ANNUAL
GENERAL MEETING ADMINISTRATION

TFG INTEGRATED ANNUAL REPORT 2017 www.tfglimited.co.za162
INVESTMENT CASE
ABOUTTHIS REPORT
OUR PROFILE
OUR OPERATINGENVIRONMENT
OUR STRATEGY AND PERFORMANCE
Name of subsidiaryCOUNTRY OF
REGISTRATION
ISSUED SHARE CAPITAL
R
Trading subsidiaries*Dress Holdco A Limited United Kingdom 31 894 676TFG Retailers Proprietary Limited Australia 142 076 514Fashion Retailers Proprietary Limited Namibia 250 006Fashion Retailers (Zambia) Limited Zambia 2 669 415Foschini Finance Proprietary Limited South Africa 6Foschini (Lesotho) Proprietary Limited Lesotho 1 000Foschini Retail Group Proprietary Limited South Africa 2Foschini Stores Proprietary Limited South Africa 1Foschini (Swaziland) Proprietary Limited Swaziland 50 002Pienaar Sithole and Associates Proprietary Limited South Africa 100Prestige Clothing Proprietary Limited South Africa 10TFG Apparel Supply Company Proprietary Limited South Africa 1The Foschini Group Ghana Limited Ghana 10 746 800The Foschini Group Kenya Limited Kenya 2 153 863What U Want To Wear Proprietary Limited South Africa 66 200
* These companies are direct subsidiaries of The Foschini Group Limited.
APPENDIX 4:SUBSIDIARY COMPANIESAS AT 31 MARCH

163
APPENDIX 5: SHAREHOLDINGS OF THE FOSCHINI GROUP LIMITED
PERFORMANCEREVIEW
OUR GOVERNANCEPROFILE
SUMMARY CONSOLIDATED FINANCIAL STATEMENTS APPENDICES NOTICE OF ANNUAL
GENERAL MEETING ADMINISTRATION
ANALYSIS OF SHAREHOLDINGSCompiled by JP Morgan Cazenove utilising the company’s transfer secretaries’ records as at 31 March 2017.
Spread analysisNUMBER OF
HOLDERS% OF TOTAL
SHAREHOLDERSNUMBER OF
SHARES HELD% OF SHARES
IN ISSUE
1 – 1 000 shares 5 196 65,5 1 621 824 0,71 001 – 10 000 shares 1 809 22,8 5 433 924 2,510 001 – 100 000 shares 692 8,7 22 866 891 10,4100 001 – 1 000 000 shares 197 2,5 61 389 097 28,01 000 001 shares and over 41 0,5 128 203 698 58,4 7 935 100,0 219 515 434 100,0
DISTRIBUTION OF SHAREHOLDINGS
CategoryNUMBER OF
SHARES HELD% OF SHARES
IN ISSUE
Unit trusts/mutual funds 74 520 590 34,0Pension funds 67 702 036 30,9Other managed funds 22 013 467 10,0Sovereign wealth 16 742 729 7,6Private investor 10 195 394 4,6Insurance companies 7 666 625 3,5Exchange-traded fund 5 738 029 2,6Employees 4 419 095 2,0Custodians 3 708 670 1,7Trading position 2 502 814 1,1Hedge fund 1 308 555 0,6Corporate holding 1 100 699 0,5Other 1 896 731 0,9 219 515 434 100,0

TFG INTEGRATED ANNUAL REPORT 2017 www.tfglimited.co.za164
INVESTMENT CASE
ABOUTTHIS REPORT
OUR PROFILE
OUR OPERATINGENVIRONMENT
OUR STRATEGY AND PERFORMANCE
APPENDIX 5: SHAREHOLDINGS OF THE FOSCHINI GROUP LIMITED CONTINUED
MAJOR SHAREHOLDINGS GREATER THAN 5%Major interests, direct and indirect, as per share register and information supplied by nominee companies as at 31 March 2017.
HOLDING% OF SHARES
IN ISSUE
Government Employees Pension Fund (PIC) 33 029 313 15,0
FUND MANAGERS’ HOLDINGS GREATER THAN 5%According to disclosures made, the following fund managers administered client portfolios, which included more than 5% of the company’s issued shares.
HOLDING% OF SHARES
IN ISSUE
Government Employees Pension Fund (PIC) 26 209 912 11,9Coronation Asset Management (Pty) Ltd 14 518 041 6,6 40 727 953 18,5
SHAREHOLDING SPREAD
CategoryNUMBER OF
HOLDERS% OF TOTAL
SHAREHOLDERSNUMBER OF
SHARES HELD% OF SHARES
IN ISSUE
Public 7 608 95,9 203 248 510 92,6Directors 6 0,1 10 747 725 4,9Trust 1 – 1 568 600 0,7Subsidiary 1 – 1 080 599 0,5Employees of TFG 319 4,0 2 870 000 1,3
7 935 100,0 219 515 434 100,0

165
Exchange rate information 2017 2016
Closing USD conversion rate 13,42 14,69
Average USD conversion rate 14,04 13,85
Closing GBP conversion rate 16,84 21,15
Average GBP conversion rate 18,41 20,73
Share performance 2017 2016
Market price per share (cents)
– at year end 15 449 14 144
– highest 17 577 20 178
– lowest 12 344 10 205
– average 14 832 14 452
Number of beneficial shareholdings 7 935 7 572
Price/earnings ratio at year end (multiple) 13,94 13,58
Dividend yield (%) 4,7 4,9
Number of shares traded during the year (millions) 378,8 285,9
Volume traded/number of shares in issue (%) 172,6 132,8
Market capitalisation (Rm) 33 912,9 30 459,2
APPENDIX 6: EXCHANGE RATE AND SHARE PERFORMANCE INFORMATION
PERFORMANCEREVIEW
OUR GOVERNANCEPROFILE
SUMMARY CONSOLIDATED FINANCIAL STATEMENTS APPENDICES NOTICE OF ANNUAL
GENERAL MEETING ADMINISTRATION

TFG INTEGRATED ANNUAL REPORT 2017 www.tfglimited.co.za166
INVESTMENT CASE
ABOUTTHIS REPORT
OUR PROFILE
OUR OPERATINGENVIRONMENT
OUR STRATEGY AND PERFORMANCE
APPENDIX 7: BBBEE COMPLIANCE REPORT
COMPLIANCE REPORT TO THE COMMISSION IN THE PRESCRIBED FORM BBBEE 1(in terms of sections 13g(1) and 13g(2) of the Broad-Based Black Economic Empowerment Act)
SECTION A: DETAILS OF THE FOSCHINI GROUP LIMITED
Refer to the Administration section on the inside back cover of this report for contact and registration details.
Type of entity: Retail group listed on the Johannesburg Stock ExchangeIndustry sector: General RetailCode of good practice: GenericName of BBBEE verification agency: Empowerdex Proprietary LimitedName of technical signatory: Nazeem Allie (Empowerdex)
SECTION B: INFORMATION AS VERIFIED BY THE BBBEE VERIFICATION AGENCY AS PER THE APPLICABLE SCORECARD
BBBEE ELEMENTS TARGET SCORE
BONUSPOINTS
ACHIEVED
ACTUAL SCORE
ACHIEVEDINCLUDING
BONUSPOINTS
Ownership 25,00 – 12,31Management control 19,00 – 6,15Skills development 20,00 4,10 13,95Enterprise and supplier development 40,00 1,00 18,55Socio-economic development 5,00 – 5,00Total score 109,00 5,10 55,96Priority elements achieved Ownership – Yes
Skills development – YesPreferential procurement – YesEnterprise development – YesSupplier development – Yes – –
Empowering supplier status Yes – –Final BBBEE status level Level 7 – –
SECTION C: FINANCIAL REPORTBasic accounting details:Accounting officer’s name: KPMG Inc.Address: 8th Floor, MSC House, 1 Mediterranean Street, Cape Town, 8001Accounting policy: Financial reporting – monthly
Financial statements as published in this report have been audited by KPMG Inc. and approved by the Supervisory Board of Directors of TFG.

167
PERFORMANCEREVIEW
OUR GOVERNANCEPROFILE
SUMMARY CONSOLIDATED FINANCIAL STATEMENTS APPENDICES NOTICE OF ANNUAL
GENERAL MEETING ADMINISTRATION

TFG INTEGRATED ANNUAL REPORT 2017 www.tfglimited.co.za168
INVESTMENT CASE
ABOUTTHIS REPORT
OUR PROFILE
OUR OPERATINGENVIRONMENT
OUR STRATEGY AND PERFORMANCE
Important dates and times 170
Notice of annual general meeting 171
Application to participate electronically in the annual general meeting 181
Form of proxy 183

169
NOTICE OF ANNUAL
GENERAL MEETING
PERFORMANCEREVIEW
OUR GOVERNANCEPROFILE
SUMMARY CONSOLIDATED FINANCIAL STATEMENTS APPENDICES NOTICE OF ANNUAL
GENERAL MEETING ADMINISTRATION

TFG INTEGRATED ANNUAL REPORT 2017 www.tfglimited.co.za170
INVESTMENT CASE
ABOUTTHIS REPORT
OUR PROFILE
OUR OPERATINGENVIRONMENT
OUR STRATEGY AND PERFORMANCE
IMPORTANT DATES AND TIMES
Record date to determine which shareholders are entitled to receive the notice Friday, 7 July 2017
Post and email 2017 integrated annual report with notice of annual general meeting Friday, 14 July 2017
Last day to trade in order to be able to attend, participate and vote at the annual general meeting Tuesday, 22 August 2017
Record date in order to be able to attend, participate and vote at the annual general meeting and last date to apply for electronic participation by 12h15 Friday, 25 August 2017
Proxy forms for the annual general meeting should (but are not required to) be received by 12h15 Tuesday, 5 September 2017
Annual general meeting to be held at 12h15 Wednesday, 6 September 2017
Results of annual general meeting released on SENS Wednesday, 6 September 2017
The dates and times provided for in this document are subject to amendment. Any amendment will be published on SENS. All times are South African times.

171
THE FOSCHINI GROUP LIMITED(Incorporated in the Republic of South Africa) Registration number: 1937/009504/06Share code: TFG – TFGP(ISIN: ZAE000148466 – ZAE000148516) (“TFG” or “company”)
Notice is hereby given that the 80th annual general meeting of shareholders of TFG will be held at the company’s registered office at Stanley Lewis Centre, 340 Voortrekker Road, Parow East, Cape Town on Wednesday, 6 September 2017 at 12h15 to:
1. deal with such business as may lawfully be dealt with at the meeting; and
2. consider and, if deemed fit, pass with or without modification, the ordinary and special resolutions set out hereunder in the manner required by the Companies Act and the company’s memorandum of incorporation (MOI), which meeting is to be participated in and voted at by shareholders as at the record date of Friday, 25 August 2017.
It should be noted that TFG made provision for its shareholders or their proxies to participate electronically in the annual general meeting as detailed later in this notice.
ORDINARY RESOLUTION NUMBER 1 (PRESENTATION OF ANNUAL FINANCIAL STATEMENTS)To receive and adopt the annual financial statements of the company and the Group for the year ended31 March 2017. The consolidated audited annual financial statements of the company and its subsidiaries (as approved by the Supervisory Board), incorporating the independent auditors’ report, the directors’ report and the Audit Committee’s report for the year ended 31 March 2017 as well as the Social and Ethics Committee’s report contained in the 2017 integrated annual report, have been made available and will be presented.
ORDINARY RESOLUTION NUMBER 2 (REAPPOINTMENT OF EXTERNAL AUDITORS)That upon the recommendation of the Audit Committee, KPMG Inc. be reappointed as auditors (and Mr P Farrand as the designated partner) of the company until the following annual general meeting.
ORDINARY RESOLUTION NUMBER 3 (RE-ELECTION OF DIRECTOR)That upon the recommendation of the Nomination Committee and the Supervisory Board, shareholders re-elect Mr D Friedland who is retiring by rotation as an independent non-executive director in accordance with the provisions of the MOI; Mr D Friedland, being eligible, offers himself for re-election as an independent non-executive director.
A brief curriculum vitae is included in annexure 1.
ORDINARY RESOLUTION NUMBER 4 (RE-ELECTION OF DIRECTOR)That upon the recommendation of the Nomination Committee and the Supervisory Board, shareholders re-elect Ms N V Simamane who is retiring by rotation as an independent non-executive director in accordance with the provisions of the MOI; Ms N V Simamane, being eligible, offers herself for re-election as an independent non-executive director.
A brief curriculum vitae is included in annexure 1.
ORDINARY RESOLUTION NUMBER 5 (RE-ELECTION OF DIRECTOR)That upon the recommendation of the Nomination Committee and the Supervisory Board, shareholders re-elect Mr R Stein who is retiring by rotation as a non-executive director in accordance with the provisions of the MOI; Mr R Stein, being eligible, offers himself for re-election as a non-executive director.
A brief curriculum vitae is included in annexure 1.
NOTICE OF ANNUAL GENERAL MEETING
PERFORMANCEREVIEW
OUR GOVERNANCEPROFILE
SUMMARY CONSOLIDATED FINANCIAL STATEMENTS APPENDICES NOTICE OF ANNUAL
GENERAL MEETING ADMINISTRATION

TFG INTEGRATED ANNUAL REPORT 2017 www.tfglimited.co.za172
INVESTMENT CASE
ABOUTTHIS REPORT
OUR PROFILE
OUR OPERATINGENVIRONMENT
OUR STRATEGY AND PERFORMANCE
ORDINARY RESOLUTION NUMBER 6 (ELECTION OF AUDIT COMMITTEE MEMBER)That upon the recommendation of the Nomination Committee and the Supervisory Board, shareholders elect Mr S E Abrahams, an independent non-executive director, as a member of the Audit Committee.
A brief curriculum vitae is included in annexure 2.
ORDINARY RESOLUTION NUMBER 7 (ELECTION OF AUDIT COMMITTEE MEMBER)That upon the recommendation of the Nomination Committee and the Supervisory Board, shareholders elect Ms B L M Makgabo-Fiskerstrand, an independent non-executive director, as a member of the Audit Committee.
A brief curriculum vitae is included in annexure 2.
ORDINARY RESOLUTION NUMBER 8 (ELECTION OF AUDIT COMMITTEE MEMBER)That upon recommendation of the Nomination Committee and the Supervisory Board, shareholders elect Mr E Oblowitz, an independent non-executive director, as a member of the Audit Committee.
A brief curriculum vitae is included in annexure 2.
ORDINARY RESOLUTION NUMBER 9 (ELECTION OF AUDIT COMMITTEE MEMBER)That upon recommendation of the Nomination Committee and the Supervisory Board, shareholders elect Ms N V Simamane, an independent non-executive director, as a member of the Audit Committee.
A brief curriculum vitae is included in annexure 2.
ORDINARY RESOLUTION NUMBER 10 (ELECTION OF AUDIT COMMITTEE MEMBER)That upon recommendation of the Nomination Committee and the Supervisory Board, shareholders elect Mr D Friedland, an independent non-executive director, as a member of the Audit Committee.
A brief curriculum vitae is included in annexure 2.
ORDINARY RESOLUTION NUMBER 11 (ELECTION OF AUDIT COMMITTEE MEMBER)That upon recommendation of the Nomination Committee and the Supervisory Board, shareholders elect Prof F Abrahams, an independent non-executive director, as a member of the Audit Committee.
A brief curriculum vitae is included in annexure 2.
ORDINARY RESOLUTION NUMBER 12 (NON-BINDING ADVISORY VOTE ON REMUNERATION POLICY)That shareholders endorse, by way of a non-binding advisory vote, the company’s remuneration policy as set out in the Remuneration Committee report on pages 119 to 137.
NOTICE OF ANNUAL GENERAL MEETING CONTINUED

173
SPECIAL RESOLUTION NUMBER 1 (NON-EXECUTIVE DIRECTORS’ REMUNERATION)To approve the remuneration to be paid to non-executive directors for the year ending 1 October 2017 to 30 September 2018, details of which are as follows:
Excl. VATChairman R954 000Director (South African) R295 000Director (foreign) R572 500Audit Committee Chairperson R254 500Risk Committee Chairperson R170 000Remuneration Committee Chairperson R127 500Social and Ethics Committee Chairperson R117 000Member/Invitee of Audit Committee R127 500Member/Invitee of Risk Committee R85 000Member of Remuneration Committee R79 500Member of Social and Ethics Committee R64 000Member of Nomination Committee R42 500Member of ad hoc Finance Committee R42 500
REASON AND EFFECT OF SPECIAL RESOLUTION NUMBER 1To approve the remuneration to be paid to non-executive directors for the calendar year commencing 1 October 2017 until 30 September 2018.
SPECIAL RESOLUTION NUMBER 2 (GENERAL AUTHORITY TO ACQUIRE TFG SHARES)That the company, and/or any subsidiary of the company, is hereby authorised, by way of a general authority from time to time, to acquire ordinary shares in the share capital of the company upon such terms and conditions and in such amounts as the directors of the company may from time to time determine, but subject to the MOI of the company, the provisions of the Companies Act and the Listings Requirements as presently constituted and which may be amended from time to time, and subject to the following:
1. The repurchase of securities being effected through the order book operated by the JSE trading system and done without any prior understanding or arrangement between the company and the counterparty (reported trades are prohibited).
2. Approval by shareholders in terms of a special resolution of the company, in annual general/general meeting, which shall be valid only until the next annual general meeting or for fifteen (15) months from the date of the resolution, whichever period is shorter.
3. Repurchases may not be made at a price greater than 10% above the weighted average of the market value for the securities for the five (5) business days immediately preceding the date on which the transaction is effected.
4. At any point in time, a company may only appoint one agent to affect any repurchase(s) on the company’s behalf.5. An issuer or its subsidiary may not repurchase securities during a prohibited period as defined in paragraph 3.67
of the Listings Requirements unless they have in place a repurchase programme where the dates and quantities of securities to be traded during the relevant period are fixed (not subject to any variation) and have been submitted to the JSE in writing prior to the commencement of the prohibited period. The issuer must instruct an independent third party, which makes its investment decisions in relation to the issuer’s securities independently of, and uninfluenced by, the issuer prior to the commencement of the prohibited period to execute the repurchase programme submitted to the JSE.
6. The aggregate of acquisitions by subsidiaries of the company may not result in the subsidiaries holding more than 10% of the number of issued shares of any class of shares of the company.
7. The general repurchase by the company of its own securities may not, in the aggregate in any one financial year, exceed 10% of the company’s issued share capital of that class in any one financial year.
8. A resolution by the Supervisory Board of Directors that it has authorised the repurchase, that the company and its subsidiary(ies) have passed the solvency and liquidity test and that, since the test was performed, there have been no material changes to the financial position of the Group.
PERFORMANCEREVIEW
OUR GOVERNANCEPROFILE
SUMMARY CONSOLIDATED FINANCIAL STATEMENTS APPENDICES NOTICE OF ANNUAL
GENERAL MEETING ADMINISTRATION

TFG INTEGRATED ANNUAL REPORT 2017 www.tfglimited.co.za174
INVESTMENT CASE
ABOUTTHIS REPORT
OUR PROFILE
OUR OPERATINGENVIRONMENT
OUR STRATEGY AND PERFORMANCE
Statement by the Supervisory BoardPursuant to and in terms of the Listings Requirements, the Supervisory Board hereby states:
1. The intention of the directors of the company is to use the general authority if at some future date the cash resources of the company are in excess of its requirements. In this regard, the directors will take account of, inter alia, an appropriate capitalisation structure for the company, the long-term cash needs of the company, and will ensure that any such use is in the interests of shareholders.
2. In determining the method by which the company intends to repurchase its securities, the maximum number of securities to be repurchased and the date on which such repurchase will take place, the Supervisory Board will ensure that:
1. the company and the Group will be able to pay their debts as they become due in ordinary course of business for the next twelve (12) months;
2. the assets of the company and the Group will be in excess of the liabilities of the company and the Group for the next twelve (12) months, and for this purpose, the assets and liabilities will be recognised and measured in accordance with the accounting policies used in the latest audited consolidated annual financial statements;
3. the issued share capital and reserves of the company and the Group will be adequate for the purposes of the business of the company and the Group for the next twelve (12) months; and
4. the working capital available to the company and the Group will be sufficient for the Group’s requirements for next twelve (12) months.
The Supervisory Board will notify the shareholders of the terms of the repurchase of the company’s shares by publishing an announcement in accordance with the Listings Requirements should the company or its subsidiaries cumulatively repurchase more than 3% of the company’s issued share capital.
REASON AND EFFECT OF SPECIAL RESOLUTION NUMBER 2The reason for special resolution number 2 is to grant the company a general authority in terms of the Companies Act for the acquisition by the company or any of its subsidiaries of shares issued by the company, which authority shall be valid until earlier of the next annual general meeting of the company or the variation or revocation of such general authority by special resolution at any subsequent general meeting of the company, provided that the general authority shall not extend beyond fifteen (15) months from the date of this annual general meeting. The passing of this special resolution will have the effect of authorising the company or any of its subsidiaries to acquire shares issued by the company.
Listings Requirements disclosuresParagraph 11.26 of the Listings Requirements requires the following disclosures:
• Major shareholders (paragraph 11.26(b)(i) – refer to pages 163 and 164)• Share capital of the company (paragraph 11.26(b)(iii) – refer to note 11 of the 2017 annual financial statements)
Material changesOther than the facts and developments reported on in this document, there were no material changes in the financial or trading position of the company and its subsidiaries since the date of signature of this document.
Directors’ responsibility statementThe directors whose names are given on pages 86 to 89 collectively and individually accept full responsibility for the accuracy of the information pertaining to this special resolution and certify that, to the best of their knowledge and belief, there are no facts omitted that would make any statement false or misleading, and that all reasonable enquiries to ascertain such facts were made and that this special resolution contains all information required by law and the Listings Requirements.
NOTICE OF ANNUAL GENERAL MEETING CONTINUED

175
SPECIAL RESOLUTION NUMBER 3 (FINANCIAL ASSISTANCE)The shareholders approve that the company may provide direct or indirect financial assistance to a related or interrelated company or corporation, provided that such financial assistance may only be provided within two (2) years from the date of the adoption of this special resolution and subject further to sections 44 and 45 of the Companies Act.
REASON AND EFFECT OF SPECIAL RESOLUTION NUMBER 3Section 44 of the Companies Act applies to financial assistance provided by a company to related or interrelated companies in the event that the financial assistance is provided for the purpose of, or in connection with, the subscription of any option, or any securities issued or to be issued by the company or a related or interrelated company, or for the purchase of any securities of the company or a related or interrelated company.
Section 45 of the Companies Act applies to financial assistance provided by a company to related or interrelated companies and corporations, including, among others, its subsidiaries.
Thus both sections 44 and 45 of the Companies Act provide that the financial assistance may only be provided pursuant to a special resolution passed by shareholders within the previous two (2) years.
The passing of this special resolution will have the effect of authorising the company to provide financial assistance to related and interrelated companies and corporations.
ORDINARY RESOLUTION NUMBER 13 (GENERAL AUTHORITY OF DIRECTORS)Any director of the company is authorised to do all such things and sign all such documents as may be necessary for, or incidental to, the implementation of ordinary resolutions 1 to 12 and special resolutions 1 to 3 proposed at the company’s annual general meeting to be held on Wednesday, 6 September 2017.
To transact any other business that may be transacted at an annual general meeting.
Voting requirementsAn ordinary resolution requires the support of more than 50% of the voting rights exercised on the resolution to be adopted.
A special resolution requires the support of more than 75% of the voting rights exercised on the resolution to be adopted.
General instructionsMembers are encouraged to attend, speak and vote at the annual general meeting.
Meeting participants (including shareholders and proxies) will be required to provide proof of identity before being entitled to attend and/or participate in the meeting. Forms of identification include identity documents, driver’s licence and passports.
If you hold shares in certificated form (in other words, you have not dematerialised your TFG shares) or are registered as an own-name dematerialised shareholder, then:
• you may attend and vote at this meeting; alternatively• you may appoint a proxy to represent you at this meeting by completing the attached form of proxy and lodging it
with the transfer secretaries of TFG by 12h15 on Tuesday, 5 September 2017. Any forms of proxy not lodged by this time may be handed to the Chairperson of the annual general meeting immediately prior to its commencement. The completion of a proxy form will not preclude a shareholder from attending the annual general meeting.
PERFORMANCEREVIEW
OUR GOVERNANCEPROFILE
SUMMARY CONSOLIDATED FINANCIAL STATEMENTS APPENDICES NOTICE OF ANNUAL
GENERAL MEETING ADMINISTRATION

TFG INTEGRATED ANNUAL REPORT 2017 www.tfglimited.co.za176
INVESTMENT CASE
ABOUTTHIS REPORT
OUR PROFILE
OUR OPERATINGENVIRONMENT
OUR STRATEGY AND PERFORMANCE
Where you are entitled and wish to appoint a proxy, the proxy does not have to be a TFG shareholder and you may appoint more than one proxy to exercise voting rights attached to different securities held by you that entitled you to vote.
If you have dematerialised your shares and are not registered as an own-name dematerialised shareholder (in other words, you have specifically instructed your CSDP not to hold your shares in your own name on TFG’s uncertificated securities register) then, subject to the custody agreement between yourself and your CSDP or broker:
• if you wish to attend the meeting, you must contact your CSDP or broker and obtain the relevant letter of representation from it; or
• if you are unable to attend the meeting but wish to be represented at the meeting, you must contact your CSDP or broker and furnish it with your voting instructions in respect of the meeting. You must not complete the attached form of proxy. The instructions must be provided in accordance with the custody agreement between yourself and your CSDP or broker within the time period required by your CSDP or broker.
CSDPs, brokers or their nominees recorded in the company’s uncertificated securities register should, when authorised in terms of their mandate or instructed to do so by the owner on behalf of whom they hold dematerialised shares in the company, vote by either appointing a duly authorised representative to attend and vote at the meeting or by completing the attached form of proxy in accordance with the instructions thereon and lodging it with the transfer secretaries of the company by 12h15 on Tuesday, 5 September 2017.
Electronic participationThe company has made provision for shareholders or their proxies to participate electronically in the annual general meeting by way of telephone conference call.
Should you wish to participate in the annual general meeting by telephone conference call, you or your proxy must complete the application form attached to this document and return it to the transfer secretaries of the company by no later than 12h15 on Friday, 25 August 2017.
By order of the Supervisory Board
D van RooyenGroup Company Secretary
29 June 2017
NOTICE OF ANNUAL GENERAL MEETING CONTINUED

177
BRIEF CURRICULUM VITAE OF DIRECTORS STANDING FOR RE-ELECTIONIn terms of the MOI, each year, one-third (or a number closest to) of the non-executive directors are subject to retirement by rotation and are eligible for re-election.
The Nomination Committee has considered the confirmation, performance and attendance of the following directors retiring by rotation:
• Mr D Friedland • Ms N V Simamane• Mr R Stein
The Nomination Committee has no hesitation in recommending these directors for reappointment by the shareholders.
D FRIEDLAND (64)BCom, Certificate in the Theory of Accountancy, CA(SA)
Appointed: 2013
Member of: Remuneration, Audit and Risk Committees
Also a director of South African listed companies: Pick n Pay Stores Limited and Investec Limited
Also a director of a foreign listed company: Investec PLC
David is a chartered accountant with extensive audit experience from a broad range of listed retail companies. He served as international partner at Arthur Andersen from 1990 and as a partner at KPMG from 2002. David was Head of Audit and Risk at KPMG (Cape Town) and was the lead audit partner for several listed companies. In 2013, David retired as a partner at KPMG and was appointed to the boards of Investec Limited and Investec PLC in March 2013, serving as the Group Audit Committee Chairman. He stepped down as the Audit Committee Chairman on 1 April 2017 to assume the role of Chairman of the Board Risk and Capital Committee. David also serves on the audit and risk committee for Pick n Pay Stores Limited.
N V SIMAMANE (58)BSc (Biochem) (Hons)
Appointed: 2009
Member of: Audit, Risk and Social and Ethics Committees
Also a director of South African listed companies: Cashbuild Limited, Oceana Group, Hollard Insurance, Hollard Life Insurance and SA Post Office
Nomahlubi has extensive business, marketing and communications experience, having previously held the positions of Marketing Manager at Unilever, Marketing Director of British American Tobacco and Managing Director of BLGK Bates Advertising Agency. She is currently the CEO of Zanusi Brand Solutions, a branding consultancy she founded in 2001. She has worked in the United States and Kenya and has been recognised as a seasoned business woman, having won two Business Women of the Year Awards in 2009. She was also named the 2013 Enterprising Woman in Fort Lauderdale, Florida, USA.
R STEIN (68) BCom, CA(SA)
Appointed: 2015
Member of: Risk and Nomination Committees
Meetings attended by invitation: Audit Committee
Ronnie was previously our CFO. He retired from this position at the end of June 2015 after serving 19 years with our Group. Prior to joining our Group, he was an accountant and auditor in public practice. H was a partner at Kessel Feinstein for 15 years. Following his retirement Ronnie remains on the Supervisory Board in a non-executive capacity.
NOTICE OF ANNUAL GENERAL MEETINGANNEXURE 1
PERFORMANCEREVIEW
OUR GOVERNANCEPROFILE
SUMMARY CONSOLIDATED FINANCIAL STATEMENTS APPENDICES NOTICE OF ANNUAL
GENERAL MEETING ADMINISTRATION

TFG INTEGRATED ANNUAL REPORT 2017 www.tfglimited.co.za178
INVESTMENT CASE
ABOUTTHIS REPORT
OUR PROFILE
OUR OPERATINGENVIRONMENT
OUR STRATEGY AND PERFORMANCE
BRIEF CURRICULUM VITAE OF DIRECTORS PROPOSED FOR ELECTION TO THE AUDIT COMMITTEEIn terms of the MOI and section 94(2) of the Companies Act, the Audit Committee is required to be elected by shareholders at each annual general meeting.
In terms of King III, the Audit Committee must comprise a minimum of three independent non-executive directors and further, in terms of the regulations of the Companies Act, at least one-third of the members of the committee must have academic qualifications or experience in economics, law, corporate governance, finance, accounting, commerce, industry, public affairs or human resource management.
Having regard to the above requirements, the Nomination Committee considered the expertise, experience and independence requirements of the members offering themselves for election and recommended to the Supervisory Board that the Supervisory Board proposes the following candidates to shareholders:
• Mr S E Abrahams• Mr D Friedland• Ms B L M Makgabo-Fiskerstrand• Mr E Oblowitz• Ms N V Simamane• Prof F Abrahams
S E ABRAHAMS (78) FCA, CA(SA)
Appointed: 1998
Member of: Audit and Nomination Committees
Chairman of: Audit Committee
Open invitation: Risk Committee
Also a director of a South African company: Investec Bank Limited
Sam is a very experienced director. He was formerly an international partner and South African managing partner of Arthur Andersen. Sam is currently the Chairman of Investec Securities (Pty) Ltd and Chairman of The Victor Daitz Foundation, one of the largest charitable foundations in South Africa.
D FRIEDLAND (64)BCom, Certificate in the Theory of Accountancy, CA(SA)
Appointed: 2013
Member of: Remuneration, Audit and Risk Committees
Also a director of South African listed companies: Pick n Pay Stores Limited and Investec Limited
Also a director of a foreign listed company: Investec PLC
David is a chartered accountant with extensive audit experience from a broad range of listed retail companies. He served as international partner at Arthur Andersen from 1990 and as a partner at KPMG from 2002. David was Head of Audit and Risk at KPMG (Cape Town) and was the lead audit partner for several listed companies. In 2013, David retired as a partner at KPMG and was appointed to the boards of Investec Limited and Investec PLC in March 2013, serving as the Group Audit Committee Chairman. He stepped down as the Audit Committee Chairman on 1 April 2017 to assume the role of Chairman of the Board Risk and Capital Committee. David also serves on the audit and risk committee for Pick n Pay Stores Limited.
NOTICE OF ANNUAL GENERAL MEETINGANNEXURE 2

179
B L M MAKGABO-FISKERSTRAND (43) Appointed: 2012
Member of: Audit, Risk and Social and Ethics Committees
Also a director of a South African listed company: Sun International Limited
Tumi is founder and executive director of AfricaWorldwide Media and director of Tumi Makgabo Enterprises, focusing on enterprise development in South Africa and across the African continent. In addition, Tumi served as the Vice Chairperson of the World Economic Forum’s Global Agenda Council on Women’s Empowerment and as a member of its Council on Africa for two years. In 2008, she was nominated to the World Economic Forum’s Forum of Young Global Leaders, which is a multi-stakeholder community of exceptional leaders below the age of 40, selected from around the world.
E OBLOWITZ (59)BCom, CA(SA), CPA(Isr)
Appointed: 2010
Member of: Audit, Remuneration and Risk Committees
Chairman of: Remuneration and Risk Committees
Also a director of a South African listed company: Trencor Limited
Eddy has considerable audit, finance and business advisory experience, having spent 21 years in professional practice, most notably as a senior partner of the Cape Town, Durban and Port Elizabeth offices of Arthur Andersen. In addition, he served as a member of the firm’s worldwide Retail and Distribution Industry Team. He is currently the Executive Chairman of Stonehage Fleming South Africa, which provides multi-family office, wealth management and advisory services to an extensive local and international client base.
N V SIMAMANE (58)BSc (Biochem) (Hons)
Appointed: 2009
Member of: Audit, Risk and Social and Ethics Committees
Also a director of South African listed companies: Cashbuild Limited, Oceana Group, Hollard Insurance, Hollard Life Insurance and SA Post Office
Nomahlubi has extensive business, marketing and communications experience, having previously held the positions of Marketing Manager at Unilever, Marketing Director of British American Tobacco and Managing Director of BLGK Bates Advertising Agency. She is currently the CEO of Zanusi Brand Solutions, a branding consultancy she founded in 2001. She has worked in the United States and Kenya and has been recognised as a seasoned business woman, having won two Business Women of the Year Awards in 2009. She was also named the 2013 Enterprising Woman in Fort Lauderdale, Florida, USA.
PERFORMANCEREVIEW
OUR GOVERNANCEPROFILE
SUMMARY CONSOLIDATED FINANCIAL STATEMENTS APPENDICES NOTICE OF ANNUAL
GENERAL MEETING ADMINISTRATION
TFG INTEGRATED ANNUAL REPORT 2017 www.tfglimited.co.za180
INVESTMENT CASE
ABOUTTHIS REPORT
OUR PROFILE
OUR OPERATINGENVIRONMENT
OUR STRATEGY AND PERFORMANCE
PROF F ABRAHAMS (54)BEcon (Hons), MCom, DCom
Appointed: 2003
Member of: Audit, Remuneration and Social and Ethics Committees
Chairperson of: Social and Ethics Committee
Also a director of South African listed companies: Clicks Group Limited, Iliad Africa Limited and
Lewis Group Limited
Fatima has extensive experience in industrial psychology and is known for her academic work. She was also a non-executive director of Transnet, B2B Africa (Pty) Ltd and Chairperson of Victoria & Alfred Waterfront Holdings. She has served on the audit and risk, as well as the transformation and remuneration committees of many of the companies she was involved in, and built up sound business experience over the years.
NOTICE OF ANNUAL GENERAL MEETINGANNEXURE 2 CONTINUED

THE FOSCHINI GROUP LIMITED(Incorporated in the Republic of South Africa) Registration number: 1937/009504/06Share codes: TFG – TFGP(ISIN: ZAE000148466 – ZAE000148516)
Shareholders or their duly appointed proxy(ies) (participants) who wish to participate in the annual general meeting via electronic communication, being via teleconference, must apply to the company’s transfer secretaries using this form.
Participants are advised that they will not be able to vote during the meeting. Participants, should they wish to have their vote counted at the meeting, must act in accordance with the general instructions contained on pages 175 to 176 of this notice.
Shareholders must take note of the following:
• A limited number of telecommunication lines will be available.• Each participant will be contacted between 09h00 and 11h00 on Wednesday, 6 September 2017 via email and/or
SMS. Participants will be provided with a code and the relevant telephone number to allow them to dial in.• The cost of the shareholder’s phone call will be for his/her own expense.• The cut-off time for dialling in on the day of the meeting will be at 12h10 on Wednesday, 6 September 2017 and
no late dial-in will be possible.
To be returned to the transfer secretaries, Computershare Investor Services Proprietary Limited, Rosebank Towers, 15 Biermann Avenue, Rosebank, 2196 (PO Box 61051, Marshalltown 2107) as soon as possible and to be received by no later than 12h15 on Friday, 25 August 2017.
Full name of shareholder
ID number of shareholder
Email address
Cellphone number
Telephone number (including dialling code from South Africa)
Name of CSDP/broker (if shares are in dematerialised form)
Contact number of CSDP/broker
Contact person at CSDP/broker
Number of share certificate (if applicable)
Signature of shareholder
Date
Please take note of the terms and conditions overleaf.
APPLICATION TO PARTICIPATE ELECTRONICALLY IN THE ANNUAL GENERAL MEETING

INVESTMENT CASE
ABOUTTHIS REPORT
OUR PROFILE
OUR OPERATINGENVIRONMENT
OUR STRATEGY AND PERFORMANCE
Terms and conditions for participation in the annual general meeting via electronic communication
1. The cost of dialling in using a telecommunication line to participate in the annual general meeting is for the expense of the participant and will be billed separately by the participant’s own telephone service provider.
2. The shareholder/participant acknowledges that the telecommunication lines are provided by a third party and indemnifies TFG against any loss, damage, penalty or claim arising in any way from the use or possession of the telecommunication lines whether or not the problem is caused by any act or omission on the part of the shareholder/participant or anyone else.
3. Shareholders who wish to participate in the meeting by dialling in must note that they will not be able to vote during the meeting. Such shareholders, should they wish to have their votes counted at the meeting, must act in accordance with the general instructions contained in this notice of annual general meeting by:
(a) completing the form of proxy; or (b) contacting their CSDP/broker.
4. The application will only be successful if this application form has been completed in full and signed by the shareholder/proxy, and if the terms and conditions have been complied with.
APPLICATION TO PARTICIPATE ELECTRONICALLY IN THE ANNUAL GENERAL MEETING CONTINUED

THE FOSCHINI GROUP LIMITED(Incorporated in the Republic of South Africa) Registration number: 1937/009504/06Share codes: TFG – TFGP(ISIN: ZAE000148466 – ZAE000148516)
To be returned to the transfer secretaries, Computershare Investor Services Proprietary Limited, Rosebank Towers, 15 Biermann Avenue, Rosebank, 2196 (PO Box 61051, Marshalltown, 2107) as soon as possible and should (but is not required to) be received by no later than 12h15 on Tuesday, 5 September 2017.
FORM OF PROXY (NB FOR USE ONLY BY CERTIFICATED AND OWN-NAME DEMATERIALISED SHAREHOLDERS) ANNUAL GENERAL MEETING: WEDNESDAY, 6 SEPTEMBER 2017
I/We (full names)
of (address)
Tel (home): Cell: Email:
being a shareholder(s) of The Foschini Group Limited and entitled to votes (ONE PER SHARE HELD)
hereby appoint
or failing him/her
or failing him/her the Chairperson of the meeting as my/our proxy to act for me/us at the annual general meeting of the company to be held at 12h15 on Wednesday, 6 September 2017 at Stanley Lewis Centre, 340 Voortrekker Road, Parow East and at any adjournment thereof as follows:
INSERT X IN APPROPRIATE BLOCKFOR AGAINST ABSTAIN
Ordinary resolution no. 1 Presentation of annual financial statementsOrdinary resolution no. 2 Reappointment of external auditorsOrdinary resolution no. 3 Re-election of Mr D Friedland as a directorOrdinary resolution no. 4 Re-election of Ms N V Simamane as a directorOrdinary resolution no. 5 Re-election of Mr R Stein as a directorOrdinary resolution no. 6 Election of Mr S E Abrahams as a member of the
Audit CommitteeOrdinary resolution no. 7 Election of Ms B L M Makgabo-Fiskerstrand as a
member of the Audit CommitteeOrdinary resolution no. 8 Election of Mr E Oblowitz as a member of the
Audit CommitteeOrdinary resolution no. 9 Election of Ms N V Simamane as a member of the
Audit CommitteeOrdinary resolution no. 10 Election of Mr D Friedland as a member of the
Audit CommitteeOrdinary resolution no. 11 Election of Prof F Abrahams as a member of the
Audit CommitteeOrdinary resolution no. 12 Non-binding advisory vote on remuneration policySpecial resolution no. 1 Non-executive directors’ remunerationSpecial resolution no. 2 General authority to acquire TFG sharesSpecial resolution no. 3 Financial assistanceOrdinary resolution no. 13 General authority of directors
Signed this day of 2017
Signature
Assisted by (where applicable)
Please read the notes on the reverse side of this proxy form.
FORM OF PROXY
ADMINISTRATIONThe Foschini Group LimitedRegistration number: 1937/009504/06JSE codes: TFG – TFGPISIN: ZAE000148466 – ZAE000148516
Registered officeStanley Lewis Centre340 Voortrekker RoadParow East 7500South Africa
Head officeStanley Lewis Centre340 Voortrekker RoadParow East 7500South AfricaTelephone +27(0) 21 938 1911
Company SecretaryD van Rooyen, BAcc (Hons), CA(SA) Stanley Lewis Centre340 Voortrekker RoadParow East 7500South AfricaPO Box 6020, Parow East 7501South Africa
SponsorUBS South Africa Proprietary Limited64 Wierda Road East, Wierda ValleySandton 2196South Africa
AuditorsKPMG Inc.
AttorneysEdward Nathan Sonnenbergs Inc.
Principal bankerFirstRand Bank Limited
Transfer secretariesComputershare Investor Services Proprietary LimitedRosebank Towers15 Biermann AvenueRosebank2196South AfricaTelephone: +27(0) 11 370 5000
United States ADR DepositaryThe Bank of New York Mellon620 Avenue of the Americas New York, NY 10011
Websitewww.tfglimited.co.za
SHAREHOLDERS’ CALENDARFinancial year end 31 March 2017Integrated annual report publication date 14 July 2017Annual general meeting (80th) 6 September 2017Interim profit announcement (2018) 2 November 2017
Upcoming distribution paymentsOrdinary– final 2017 July 2017– interim 2018 January 2018
Preference– interim 2018 September 2017– final 2018 March 2018
Queries regarding this report to be addressed to:D van Rooyen (Company Secretary)Email: [email protected]
GREYMATTER & FINCH # 10878

WWW.TFGLIMITED.CO.ZA
INVESTMENT CASE
ABOUTTHIS REPORT
OUR PROFILE
OUR OPERATINGENVIRONMENT
OUR STRATEGY AND PERFORMANCE
NOTES
1. The person whose name stands first on the proxy form and who is present at the annual general meeting will be entitled to act as a proxy to the exclusion of those whose names follow thereafter. If no proxy is inserted in the spaces provided, the Chairperson shall be deemed to be appointed as the proxy.
2. Unless otherwise instructed above, a proxy is entitled to vote as he/she thinks fit.
3. A proxy appointed by a shareholder to attend, speak and vote in his/her stead need not also be a shareholder of the company.
4. In order to be effective, this proxy form and the power of attorney or other authority (if any) under which it is signed, must be RECEIVED by the transfer secretaries of the company, Computershare Investor Services Proprietary Limited, not less than twenty-four (24) hours before the time appointed for the holding of the meeting or any adjournment thereof, as the case may be, at which the proxy proposes to vote, excluding Saturdays, Sundays and South African public holidays.
5. Any alteration or correction made to this proxy form must be initialled by the signatory(ies), but may not be accepted by the Chairperson.
6. If you hold shares in certificated form (i.e. you have not dematerialised your shares) or are registered as an own-name dematerialised shareholder, you may attend and vote at this meeting; alternatively, you may appoint a proxy to represent you at the meeting by completing the attached form of proxy and lodging it with the transfer secretaries of the company to be RECEIVED at least 24 hours before the time of the meeting, excluding Saturdays, Sundays and South African public holidays.
7. If you have dematerialised your shares and are not registered as an own-name dematerialised shareholder (i.e. specifically instructed your CSDP to hold your shares in your own name) then, subject to the custody agreement between yourself and your CSDP or broker:
• if you wish to attend the meeting, you must contact your CSDP or broker and obtain the relevant letter of representation from it; or
• if you are unable to attend the meeting but wish to be represented at the meeting, you must contact your CSDP or broker and furnish it with your voting instructions in respect of the meeting. You must NOT complete the attached form of proxy. The instructions must be provided in accordance with the custody agreement between you and your CSDP or broker within the time period required by your CSDP or broker.
8. Brokers or their nominees recorded in the company’s register should, when authorised in terms of their mandate or instructed to do so by the owner on behalf of whom they hold dematerialised shares in the company, vote by either appointing a duly authorised representative to attend and vote at the meeting or by completing the attached form of proxy in accordance with the instructions thereon, which must be RECEIVED by the transfer secretaries of the company at least 24 hours before the time of the meeting, excluding Saturdays, Sundays and South African public holidays.
FORM OF PROXY CONTINUED