integrated big data analytics-enabled transformation model
TRANSCRIPT

This work is licensed under a
Creative Commons Attribution-NonCommercial-NoDerivatives 4.0 International licence
Newcastle University ePrints - eprint.ncl.ac.uk
Wang Y, Kung L, Wang YCW, Cegielski CG.
Integrated big data analytics-enabled transformation model: Application to
health care.
Information and Management 2017
DOI: http://doi.org/10.1016/j.im.2017.04.001
Copyright:
© 2017. This manuscript version is made available under the CC-BY-NC-ND 4.0 license
DOI link to article:
http://doi.org/10.1016/j.im.2017.04.001
Date deposited:
19/04/2017
Embargo release date:
13 April 2019

1
An Integrated Big Data Analytics-Enabled Transformation Model:
Application to Health Care
Yichuan Wang1*, LeeAnn Kung2, William Yu Chung Wang3, Casey G. Cegielski4
1 Newcastle University Business School, Newcastle University, United Kingdom
2 Rowan University, 201 Mullica Hill Road, Glassboro, New Jersey 08028 United States
3 Department of Management Systems, University of Waikato
4 Auburn University, 405 W Magnolia Ave, Auburn, AL 36849 United States
* Corresponding author: Yichuan Wang
Phone: +44(0)20 3752 2449
Email: [email protected]
ABSTRACT
A big data analytics enabled transformation model based on practice-based view is developed
which reveals the causal relationships among big data analytics capabilities, IT-enabled
transformation practices, benefit dimensions and business value. This model was then tested in
healthcare setting. Through analyzing big data implementation cases, we sought to understand
how big data analytics capabilities transform organizational practices, thereby generating
potential benefits. In addition to conceptually defining four big data analytics capabilities, the
model offers a strategic view of big data analytics. Three significant path-to-value chains were
identified for healthcare organizations by applying the model, which provides practical insights
for managers.
KEYWORDS: Big data analytics, IT-enabled transformation, practice-based view, health care,
content analysis

2
1. INTRODUCTION
The arrival of the “Age of Big Data” presents, to many industries and the firms that
populate them, heretofore unprecedented opportunities and novel complexities. A number of
benefits from adopting big data analytics into business practices have been recognized by
researchers and technology consultants (or vendors). Big data analytics is acknowledged to have
the potential to fill the growing need of healthcare managers to manage the surge of clinical data
that supports evidence-based medical practice (Bates et al., 2014) and improves quality and
efficiency of health care delivery (Ghosh & Scoot, 2011; Murdoch & Detsky, 2013). Proponents
of the application of big data in the United States claim that when properly applied, data
analytics in the healthcare industry helps cut costs by $300 million annually as well as improve
the management of lifestyle-induced diseases, streamline administrative complexities, and
improve interfaces between customers and providers (Manyika et al., 2011). However, in fact,
exponentially increasing volumes of data in various formats from sources challenge a healthcare
organization’s traditional data management capabilities. Much of their rich electronic healthcare
record data set is “perceived as a by-product of health care delivery, rather than a central asset
source for competitive advantages” (Murdoch & Detsky, 2013, p.1351). To fully enjoy the
benefits brought forth by big data analytics, a need exists to shift the focus from technology tools
to examine and present the managerial, economic, and strategic impacts of big data analytics and
explore the effective path of how big data analytics can be leveraged to deliver business value for
healthcare organizations (Raghupathi & Raghupathi, 2014; Wang & Hajli, 2017).
Research on big data analytics has primarily focused the role of big data analytics capability
and examined its direct effect on firm performance (e.g., Akter et al., 2016; Gupta & George,
2016; Işık, Jones, & Sidorova, 2013). However, eminent scholars criticize that IT resource and

3
capability alone may not unequivocally facilitate firm performance (Bromiley & Rau 2014;
Melville et al., 2004). In the same vein, studies of the IT productivity paradox have suggested
that IT could not directly yield significant productivity gains in healthcare settings (Jones et al.,
2012). Practice-based view (PBV) has been proposed to bridge this missing link and to help
researchers and practitioners in understanding how the critical elements of practice interact with
IT tools (Huang et al., 2014; Shollo & Galliers, 2016). In the specific context of health care,
scholars have adopted this view to provide in-depth insights to healthcare practitioners on how
IT tools can be used in improving clinical practices (Goh, Gao, & Agarwal, 2011; Jensen &
Aanestad, 2007). Thus, we argue that by adopting PBV this will build a more complete picture of
how big data analytics can be effectively leveraged to deliver business value. However, there has
to date been little attention given to improving our understanding of the impact big data analytics
on organizational activities and business processes (Shollo & Galliers, 2016). We seek to fill this
gap by developing a conceptual model of big data analytics enabled transformation based on the
PBV proposed by Bromiley & Rau (2014), and use this as a framework to examine how big data
analytics capabilities facilitate IT-enabled transformation practices and thus contribute to
business value for healthcare organizations.
Our contribution to the literature on big data analytics is twofold. First, drawing on the
PBV, we develop a big data analytics enabled transformation model (BDET) that links big data
analytics capabilities to IT-enabled transformation practices and then to benefits and business
value. As PBV offers a new perspective to complement the extant strategic views, this model
provides a deeper understanding of how healthcare practices can be facilitated through the
implementation of big data analytics. Secondly, BDET model is applied to the healthcare
context. The elements, pair-wise connections, and path-to-value chains of our BDET model are
4
extracted from the real-world cases which show easy-to-follow scenarios and provide new
insights and guidance for healthcare practitioners.
The remainder of this paper is structured as follows: the next section serves as our
theoretical background, which leads to the development of the research model; followed by our
research method, findings and discussions, contributions to research, implications for practice
and recommendations, then limitations and future research directions are discussed as our
conclusion.
2. THEORETICAL BACKGROUND AND RESEARCH MODEL
The theoretical development begins with an introduction of the Big Data Analytics-Enabled
Transformation Model that used the practice-based view to explain how big data analytics and its
generated capabilities enable organizations to develop inimitable practices, which in turn creates
their business value. We then present big data analytics architecture components from which big
data analytics capabilities are generated.
2.1 A model of big data analytics-enabled transformation
We draw on PBV as a theoretical underpinning to develop our research model. PBV
emerging from strategic management aims to explain the effects of macro-level firm behaviors
or characteristics within a practice (Bromiley & Rau, 2014). Adopting a PBV focus not only
enables researchers to study how the firm implements organizational practices through the
proposed explanatory variables, but also helps develop a deeper understanding of which
practices are needed for performance in a given context (Bromiley & Rau, 2014). The model of
big data analytics-enabled transformation model constructed for this study is presented as Fig 1.

5
Figure 1. Big Data Analytics-Enabled Transformation Model
As shown in Figure 1, the linear progress path of our research model follows a PBV
framework developed by Bromiley & Rau (2014): from the explanatory variables to practices,
then to the intermediate outcomes (“benefits” in our model), and finally the organizational
performance (“business value” in our model). Bromiley and Rau’s (2014) PBV framework
demonstrates how different performances are manifested in firms’ execution of various practices
that are facilitated by explanatory factors. In this framework, the practice, “a defined activity or a
set of activities that a variety of firms might execute” (Bromiley & Rau 2014, p. 1249), is a
central part of the PBV. Practice can be treated as the combination of the subject, the action, the
tools and the context (Russo-Spena & Mele 2012) or as a set of activities, routines and material
arrangements (Schatzki, 2005). The use of practice itself is important for both intermediate and
organization performance outcomes (Igira, 2008; Tallman & Chacar, 2011). The explanatory
variables can be viewed as antecedents or enablers of the practice. The explanatory variables are
not specified in the Bromiley and Rau’s (2014) PBV model which allows for idiosyncratic
interpretation and applications.
Explanatory
Variables
Intermediate
Outcomes
Organizational
Performance
IT-enabled
transformation Practices
Evolutionary Level Practices
Localized Exploitation
Benefit dimensions
IT infrastructure
Benefits
Internal Integration Strategic Benefits
Revolutionary Level Practices
Business Value
Operational Benefits Big Data Analytics
Capabilities Business Process Redesign Managerial Benefits
Business Network Redesign
Organizational Benefits Business Scope Redefinition
Big Data Analytics
Resources
Practice-based View

6
2.1.1 Explanatory variables: Big data analytics capabilities
Drawing on the PBV, the first step to construct the big data analytics-enabled
transformation model is to define the explanatory variable, which in this study is big data
analytics capabilities generated from big data analytics resources. Big data analytics resources –
that is, big data analytics architectural components can create big data analytics-specific
capabilities. In previous studies, Wixom et al. (2013) have identified two key big data analytics
capabilities – speed to insight and pervasive use – and their underlying dimension from big data
analytics resources for maximizing business value in the fashion retail industry. Recently, Gupta
& George (2016) emphasize that firms have to develop big data analytics-specific capabilities to
attain organizational performance. Gupta & George’s study has identified various resources such
as data, managerial and technical skills, and data-driven culture that in combination build a big
data analytics capability, and this capability create the operational and strategic business value
(e.g., reduced inventory and cost savings).
Big data analytics comprises an integrated array of aggregation techniques, analytics
techniques, and interpretation techniques that allow users to transform data into evidence-based
decisions and informed actions (Cao et al., 2015; Jagadish et al., 2014). We identified three
architectural components of big data analytics from its tools and functionalities: data
aggregation, data analysis, and data interpretation, by reviewing the relevant academic literature
(e.g., Raghupathi and Raghupathi, 2014; Ward et al., 2014) and technology tutorials (e.g., Hu et
al., 2014; Watson, 2014).
The first architectural component is data aggregation, which aims to collect heterogeneous
data from multiple sources and transforming various sources data into certain data formats that

7
can be read and analyzed (Ward et al., 2014). In this component, data will be aggregated by three
key functionalities from data aggregation tools: acquisition, transformation, and storage
(Raghupathi & Raghupathi, 2014).
The second architectural component, data analysis, aims to process all kinds of data and
perform appropriate analyses for harvesting insights (Wald et al., 2014). This is particularly
important for transforming patient data into meaningful information that supports evidence-based
decision making and meaningful use practices for healthcare organizations. In simple taxonomy
of analytics developed by Delen (2014) there are three main kinds of analytics: descriptive,
predictive, and prescriptive analytics, each distinguished by the type of data and the purpose of
the analysis.
The third architectural component is data interpretation. This component generates outputs
such as various visualization reports, real-time information monitoring, and meaningful business
insights derived from the analytics components to users in the organization. Three key
functionalities are include: 1) general clinical summaries reporting such as historical reporting,
statistical analyses, and time series comparisons, 2) data visualization, a critical big data
analytics feature is to extrapolate meaning from external data and perform visualization of the
information, and 3) real-time reporting, such as alerts and proactive notifications, real time data
navigation, and operational key performance indicators (KPIs) can be sent to interested users or
made available in the form of dashboards in real time (Wang & Byrd, 2017).
2.1.2 IT-enabled transformation practices
Next on the model, IT-enabled transformation practices serve a pivotal role in transforming
the big data analytics capabilities into the intermediate outcomes. IT-enabled transformation

8
practices are defined as the sequential changes that begin with operational improvement and
internal integration through IT functionalities and then through a set of business redesign
activities to transform IT capabilities into competitive advantage and financial performance
(Lucas et al., 2013; Venkatraman, 1994). Venkatraman’s (1994) IT-enabled transformation
model is used to classify the different level of transformational practices which include localized
exploitation, internal integration, business process redesign, business network redesign, and
business scope redefinition. Localized exploitation practice refers to “a practice to leverage IT
functionality to redesign business operations” (Venkatraman, 1994, p. 82), while internal
integration practice refers to “a practice to leverage IT capability to create a seamless
organizational process – reflecting both technical interconnectivity and organizational
interdependence” (Venkatraman, 1994, p. 82). These two formed the evolutionary transformation
level practices. Business process redesign practice are “redesigning the key processes to derive
organizational capabilities for competing in the future as opposed to simply rectifying current
weaknesses” (Venkatraman, 1994, p. 82). The business network redesign practice is defined as
“articulating the strategic logic to leverage related participants in the business network to provide
products and services in the marketplace” (Venkatraman, 1994, p. 82), while business scope
redefinition practice refers to “a practice that allows organization to redefine the corporate scope
that is enabled and facilitated by IT functionality” (Venkatraman, 1994, p. 82). These three
practices formed the revolutionary transformation level.
2.1.3 Outcomes
A multidimensional IS benefit framework developed by Shang and Seddon (2002) is
employed to conceptualize the intermediate outcomes of our model. Shang and Seddon’s

9
framework (2002) was built on a large body of previous research and presents five benefit
dimensions which include IT infrastructure benefits, operational benefits, organizational benefits,
managerial benefits, and strategic benefits and aggregates 21 sub-dimensions, as shown in Table
1. Justification of applying Shang and Seddon’s benefit dimensions as the outcome of our model
is threefold. First, Shang and Seddon’s framework helps us to classify the benefit categories,
which, in turn, enhances our understanding of business value. Second, their benefit framework has
been refined by many studies related to ERP systems and specific IS architectures (Esteves, 2009;
Gefen & Ragowsky, 2005; Mueller et al., 2010). It was designed for managers to assess the benefits
of their companies’ enterprise systems, which could be applied as a general model. Finally, Shang
and Seddon (2002) provide a clear guideline for assessing and classifying benefits from IT
architecture.
Table 1. IS benefit framework (adopted from Shang & Seddon, 2002)
Benefit dimension Description Sub-dimensions
IT infrastructure
benefits
Sharable and reusable IT
resources that provide a
foundation for present and
future business applications
Building business flexibility for
current and future changes
IT cost reduction
Increased IT infrastructure
capability
Operational
benefits
The benefits obtained from the
improvement of operational
activities
Cost reduction
Cycle time reduction
Productivity improvement
Quality improvement
Customer service improvement
Managerial
benefits
The benefits obtained from
business management
activities which involve
allocation and control of the
firms’ resources, monitoring of
operations and supporting of
business strategic decisions
Better resource management
Improved decision making and
planning
Performance improvement
Strategic benefits
The benefits obtained from
strategic activities which
involve long-range planning
regarding high-level decisions
Support for business growth
Support for business alliance
Building for business innovations
Building cost leadership

10
Generating product differentiation
Building external linkages
Organizational
benefits
The benefits arise when the use
of an enterprise system benefits
an organization in terms of
focus, cohesion, learning, and
execution of its chosen
strategies.
Changing work patterns
Facilitating organizational learning
Empowerment
Building common vision
2.2 Big data analytics-enabled transformation
A large body of research has converged on the notion that use of big data analytics is a
powerful tool to enable business transformation within organizations. A review of the existing
big data literature reveals three consistent findings about big data analytics-enabled
transformation: (a) big data analytics and its generated capabilities are fundamental in
organizational transformation and performance; (b) Big data analytics-enabled transformation
occurs when organizations improve their organizational practices enabled by big data analytics
technologies; (c) The potential benefits of big data analytics-enabled transformation should be
conceptualized by a multidimensional and comprehensive benefit framework.
First, IT resources consist of IT infrastructure, human IT resources, and IT-enabled
intangibles that the firm can use to improve business processes (Bharadwaj, 2000), whereas IT
capabilities can be triggered by the integration of IS/IT resources, which ultimately impact
competitive advantage (Wade & Hulland, 2004). IT capability literature further asserts that IT
resources determine a firm’s IT capabilities and the positive impact of IT resources on IT
capabilities has been empirically validated (Wang et al., 2012). Several big data studies argue
that a firm’s unique big data analytics capability can be constructed by the configurations of
available big data analytics technological resources (LaValle et al., 2011; Wixom et al., 2013) or
the synergetic combination of valuable, rare, imperfectly imitable and non-substitutable

11
organizational resources (Işık et al., 2013), and this capability results in superior organizational
performance (Gupta & George, 2016; Trkman et al., 2010).
Second, effective transformations within organizations can be achieved through IT-enabled
transformation practices (Huang et al., 2014; Markus, 2004). The idea of identifying practices
that are facilitated by IT has come to the fore in Venkatraman’s (1994) IT-enabled
transformation model. Venkatraman’s model is one of the first to identify a set of organizational
change practices executed through IT/IS supports. Venkatraman’s (1994) model consists of two
levels, evolutionary and revolutionary, which are formed by two (i.e., localized exploitation and
internal integration) and three (i.e., business process redesign, business network redesign, and
business scope redefinition) practices respectively. Later on, Markus (2004) proposed techno-
change management practices (e.g., changes in business process and workflow, new job designs,
new skills training, restructuring business units, changing HR policies, reallocated resources and
new incentives) to ensure adequate resources to assist in accomplishing organizational change
with IT. These studies emphasize the outcomes in successful transforming organizations are
realized through their IT-enabled transformation practices, rather than from their investment in
IT alone.
Inspired by the above studies, the idea of identifying practices that are facilitated by big data
analytics systems has come to the fore in big data research. A case study in an airline company
provided by Watson et al (2006) find that a set of practices induced by real-time data
warehousing and business intelligence, such as developing co-existence of strategic and tactical
decision support and changing downstream decision-making and business processes can
dramatically improve their profitability. Recently, Shollo & Galliers (2016) have identified that
the problem articulation and data selection practices (e.g., articulating new distinctions and

12
different perspectives) triggered by big data analytics systems enable organizations to transform
new insights into organizational knowledge that can be used in making decisions and taking
actions. In this line of thought, we believe that to transform organizations by big data analytics,
organizations must implement appropriate transformational practices in order to create superior
business value.
Third, the outcomes of IT-enabled transformation are not just a matter of increased
productivity or efficiency. They are more related with new ways of doing business and achieving
organizational level performance that may include not only tangible business value such as cost
savings, but also intangible values such as increased flexibility and quality improvement
(Melville et al. 2004). The difficulty in assessing the outcomes of IT-enabled transformation
arises from the two facts that value from implementing new IT needs a period of time to be fully
realized (Melville et al. 2004). Previous studies have provided the simple frameworks to evaluate
IT business value (Melville et al. 2004). However, big data analytics can result in various
benefits for users. For example, IT infrastructure, operational, and managerial benefits have been
reported in some of the existing business analytics studies (e.g., LaValle et al., 2011; Trkman et
al., 2010), and strategic benefits such as speed to market, improved business understanding, and
reputation have been mentioned in Wixom et al. (2013) study. Therefore, a comprehensive
framework for recognizing the potential benefits of using big data analytics should be developed.
3. RESEARCH METHOD
3.1 Research Design and Approach
The epistemological foundation of this study is grounded upon the interpretivist paradigm.
The multiple case study method is particularly applicable for interpretivist research in IS where

13
“an understanding of the context of the information system, and the process whereby the
information system influences and is influenced by the context” is preferred (Walsham, 1993, p.
4-5). Another reason for the recognition of multiple case studies as a research approach is the
nature of the research question that is being investigated. Practice based research assumes that
practices are observed, perhaps transformed and mostly studied with qualitative research
methods (Huang et al., 2014; Peppard et al., 2014). In the same vein, Kohli & Grover (2008)
suggest that a better way to increase a broader understanding of companies’ new IT investments
payoff is to learn from their success stories and observe their practices. These stories are useful
sources for the preliminary stage of a research issue (Yin, 2008) and for creating theoretical
constructs and propositions (Eisenhardt & Graebner, 2007). As this study aims at producing an
understanding of how big data analytics influences the bundling of IT-enabled transformation
practices and generates potential benefits from the enterprise perspective, it is appropriate to
choose the multiple case study approach.
Our approach is to analyze big data analytics implementation projects based on case
materials that delineate the effects big data analytics had on business value in healthcare
organizations. We specifically studied the statements used to illustrate how big data analytics
capabilities, triggered by its functionalities lead to improvements in IT-enabled transformation
practices, thereby increasing potential benefits for health care organizations. By gradually
decomposing these statements from case materials, the elements that altogether shape a cause-
and-effect structure can be explored (Mueller et al., 2010). Numerous IT business value studies
have employed analysis of case descriptions to elaborate business values from the adoption of a
specific information system (e.g., Mueller et al., 2010; Peppard et al., 2007). For example,
Mueller et al. (2010) proposed a service-oriented architecture economic potential model (SOA-

14
EPM) by identifying a set of capabilities (e.g., reusability, interoperability, and flexibility)
derived from SOA design principles from SOA implementation projects. By coding the
statements evident in the case material, we analyzed and structured these statements using our
proposed model that builds on the logic depicted in Figure 1. We treated these statements in the
text of the case materials as evidence of support for the patterns in our model. Such patterns
could be groups of elements present in a high number of word frequency, connections between a
set of these elements, or these elements as a complete path-to-value chain linking big data
analytics and business value. These patterns identified across multiple cases may help us to gain
an understanding of big data analytics’ business value in health care.
3.2 Data Collection
Several studies have relied on case materials to explore the value of emerging technologies
(e.g., Mueller et al., 2010). However, one common limitation of these studies is that the materials
chosen for creating their model are provided from IT vendors and companies and thus may be
potentially biased. Usually companies only report their "success" stories and vendors showcase
their "success" projects to promote their products. Using such cases will certainly lead to the
findings of claimed benefits. To use as little biased materials as possible, we selected cases only
from academic databases which may provide more rigorous and objective statements.
Our cases were drawn from case material of current and past big data projects from
academic databases (i.e., ABI/INFORM Complete, Google Scholar, Web of Science, and IEEE
Xplore Digital Library). The following case selection criteria were applied: (1) the case presents
a real-world implementation of big data analytics in healthcare; and (2) it clearly describes the
big data analytics techniques they introduce, how the techniques affect their clinical practices as
15
well as benefits obtaining from big data analytics. We collected 36 case descriptions and checked
against our criteria. Three case descriptions were eliminated because they were technical case
studies which only describe the novel analytics technologies being developed. The final data set
consists of 33 case descriptions covering 28 healthcare units or systems (Appendix A) that
adopted big data analytics.
Of these cases, 86% are from North America (22 cases from the United States; 2 from
Canada), and 14% are from other regions (1 case each: Australia, China, India, and Netherlands).
Forty three percent (12 cases) are “networks/Systems” which means there is a group of hospitals
or clinics or research centers for one case. Thirty two percent (9 cases) are single hospitals, 14%
(4 cases) government agencies, 7% (2 cases) insurance companies, and one healthcare IT service
company. Worthy of noting is that all the 9 hospitals are research/teaching oriented, all are top
ranked, and are considered “leaders” in their fields. This might play an important role as “early
adopters” of big data analytics in healthcare. The similarity among all 28 cases is that they all
have affluent funding and revenue.
3.3 Research Process and Data Analysis
We generally followed the three-step coding process: preparation, organizing and reporting
provided by Elo & Kyngäs’ (2008) to extract insights from the cases to build our BDET model.
3.3.1 Preparing for coding process and building an initial model
The first task in this step was to make sense of the coding process in terms of coding unit of
analysis, the level of analysis, and the purpose of evaluation (Elo & Kyngäs, 2008). After
meeting five times to discuss coding process and model elements, we selected “themes”
(informative and persuasive nature of case material) as the coding unit of analysis, which
16
primarily looking for the expressions of an idea that can be sentences, paragraphs, or a portion of
a page (Minichiello et al., 1990). The level of analysis in this study is the healthcare organization
or system that engages in big data analytics implementation. The purpose of this coding process
was to build a big data analytics enabled transformation model for healthcare industry by
identifying the critical elements driving business value from big data analytics.
After setting up the coding process, we started to define initial coding for elements in each
layer in our model. As aforementioned, the elements for big data analytics resource layer and
potential benefit layer are adopted from a set of big data analytics architectural components and
the Shang & Seddon’s (2002) IS benefit framework, respectively. Our task at this step is to
define the elements of the connecting layers, that is, big data analytics capability and IT-enabled
transformation practice. We conducted a literature review on big data analytics and healthcare
informatics and followed a concept-centric approach suggested by Webster and Watson (2002)
to develop our initial list of element coding. From this review, we fully understand the tools and
functionalities provided by big data analytics systems and the nature of big data analytics
architectural components. Following the logic of information lifecycle management (Storage
Networking Industry Association, 2009) and simple taxonomy of analytics (Delen, 2014), big
data analytics capabilities are generated from its architectural components. Delen (2014) further
argue that basic analytical capability can be driven by descriptive analytics, while predictive
capability can be triggered by predictive and prescriptive analytics. Then we performed a pretest
by coding a small portion of case materials and compare/match to the list to validate and also to
refine the coding elements (Krippendorff, 2012). After revising several times, four big data
analytics capability and six healthcare related practices for the big data capability layer and IT-
enabled transformation practice layer are determined respectively.

17
3.3.2 Coding process
We developed an explicit coding instruction that allows coders to be trained until reaching
certain reliability requirements. As suggested by Krippendorff (2012), our coding instruction
contains the definitions of the layers and elements of the BDET model (See Table 1 and
Appendix B) to ensure coders’ understanding of each element (Strauss & Corbin, 1998). We also
provided an outline, examples of the coding procedures, and a guideline for using and
administering the data sheets for all the coders (Krippendorff, 2012). Some confusions of
classification have been addressed by providing the detailed descriptions and examples. For
example, for separating the analytical and predictive capabilities, we introduced Delen’s (2014)
taxonomy of analytics to our coders and provide a list of tools and functionalities for generating
these two capabilities as well as the examples obtained from our coding pretest. For helping the
coders understand the meaningful use of EHR practice, we introduced a summary overview of
meaningful use objectives and measures provided by Blumenthal & Tavenner (2010).
To increase the quality of coding process, we recruited two senior consultants in a
multinational technology and consulting corporation headquartered in the United States as our
expert outside coder panel. Both of them have over 15 years IS-related work experience and are
currently consulting several manufacturing companies and hospitals in southeast United States in
big data analytics adoption. Using outside coders in the coding process can minimize potential
bias of subjective perspectives from the researcher and avoid “self-fulfilling prophecy” issues
(Elo & Kyngäs, 2008). Also, this expert panel can provide rich background knowledge and
industrial experience in classifying these statements into the sub-elements of big data analytics
18
capabilities with similar meaning. An Excel table with analysis unit and all the elements listed
was given to outside coders to manage the statements extracted from case materials.
One expert panel consultant initiated the selecting of statements (the analysis unit) from all
33 case descriptions that illustrate the path-to-value chain. A statement was selected if it
describes how big data analytics contributes to business value. Specifically, the statements had to
fully explain: 1) How specific big data analytics tools create big data analytics capabilities, 2)
How these big data analytics capabilities help clinical practices, and 3) How these practices can
lead to potential benefits in a specific case. This selection of statements served as the base for
further analysis. The selection is given to the other expert; both experts then followed the coding
procedure starting with open coding, then axial coding, and finally selective coding (Strauss &
Corbin, 1998) to analyze each statement independently.
In the open coding process, the coders broke down, examined, and categorized the
statements into one of the four layers in our model. The coders also used different color
highlights to distinguish each concept and attached the initial labels relating to the layers (i.e.,
big data analytics resources, big data analytics capabilities, practices, and benefits) and elements
(i.e., data aggregation, analytical capability). As the core layers and elements emerged, the
coders initiated axial coding to explore the various sub-elements and identify the connections
between them in order to develop more precise explanations of what big data analytics resources,
capabilities, practices, and benefits are, what cause them, and the benefits that arise because of
them. These sub-elements were abstracted from the statements to describe the content of the
elements (Marshall & Rossman, 1995) and move beyond description to a higher level of
abstraction (Urquhart et al., 2010). As second example shown in Appendix C, an passage
captured from Spruit et al. (2014) states that big data analytics allows Dutch long-term care

19
institution to group all medical incidents by using a SQL query and report the number and root
cause of incidents at a certain time of day. This passage was labeled as “big data analytics
capability” and “analytical capability” during the open coding, and subsequently the sub-element
“explore the causes of occurred medical events from relational databases” was created to
describe the analytical capability during the axial coding. In the final step of coding, selective
coding focused on finalizing the codes (or developing new elements in some cases) by
comparing and contrasting other similarly coded elements as well as the relationships and
patterns that emerged during axial coding. As a result of coding process, the path-to-value chains
emerged and became evident. Appendix C presents two examples of statements and the open,
axial and selective codes that were applied to them.
Agreement between two coders in expert panel established the elements, sub-elements,
connections, and path-to-value chains. When there were discrepancies, they reassessed and
discussed that particular scenario to see whether an agreement could be achieved. Since some
coding words could not be assigned to the initial elements, one new element (i.e., network
knowledge creation practice) was subsequently developed. In this coding process, these two
coders agreed on 77 % of the categorization resulted in a total of 109 path-to-value chains.
An audit process was carried out to improve the accuracy of classification (Hsieh &
Shannon, 2005; Krippendorff, 2004). In the audit process, two of the authors read the statements
provided by the expert panel and coded them through the same coding process. The results from
the author panel were compared to those from the expert panel. Assessment and discussion were
performed by all the authors. The sub-elements were revised, refined, merged to reach a more
abstract level of conceptualization. A chain was accepted and counted towards the final tally if it
was listed on both author and expert panel lists. Overall, the two coding teams agreed on 84% of

20
the classifications. Ensuring interrater reliability led to the elimination of 4 chains after much
discussion and debate (Schilling, 2006). The final data set comprises 105 path-to-value chains.
Finally, a content analytic technique, frequency analysis was used to evaluate the
importance associated with an element, connection, and chain based on the repeated appearance
of statements (Weber, 1990). We present our results of frequency analysis and discuss them in
the next section.
4. RESULTS AND DISCUSSIONS
Building on the theoretical foundations and conceptualization summarized in Figure 1, this
section presents our BDET model gained from the analysis of 33 case descriptions and 105 path-
to-value chains. In the following section, we discuss our results according to three distinct
perspectives. In Section 4.1, we break down each element presented in the BDET model by
showing the total number of occurrences (i.e., big data analytics architectural layers, big data
analytics capabilities, IT-enabled transformation practices and benefits). In Section 4.2, we discuss
the pair-wise connections between the elements in the BDET model. In Section 4.3, we discuss
the path-to-value chains connecting all the elements describing big data analytics’ business value.

21
Figure 2. The Results of the Big Data Analytics-Enabled Transformation Model
Note: (#) represents number of times this element was coded in the cases analyzed. represents the highest path-to-value chains (19); represents the second highest path-to-value chains (16) represents the third highest path-to-value chains (13)
Business value (105) Organizational
benefits (8)
Big data analytics
capabilities
Benefit
dimension Performance
Big data enabled transformation
practices
IT infrastructure
benefits (44)
Localized Exploitation
Evidence-based medicine practice (46)
Meaningful use of EHR practice (19)
Internal integration
Multidisciplinary practice (7)
Business process redesign
Clinical resource integration practice (10)
Business network redesign
Network collaboration practice (6)
Network knowledge creation practice (12)
Business scope redefinition
Personalized care practice (5)
Operational benefits (40)
Big data analytics
components
Traceability (16)
Analytical capability
(49)
Decision support capability
(26)
Predictive capability
(14)
Data aggregation
(16)
Data analysis (61)
Data Interpretation
(28)
Big data
analytics
Managerial benefits (9)
Strategic benefits (4)
Big data analytics
(105)

22
4.1 Elements
4.1.1 The elements of big data analytics architectural component
In the big data analytics architecture, we find that big data analytics capabilities are mainly
obtained from data analysis component (61 occurrences). This is followed by data interpretation
component (28) and data aggregation component (16). As we expected, the data analysis
component, acts as the center of big data analytics architecture, enables healthcare organizations
to explore new insights and optimal solutions based on complex clinical parameters. We break
down three big data analytics architectural components as shown in Table 2, which displays the
number of occurrence in the case materials for each component. Numerous cases highlight
descriptive analysis, OLAP, and data mining as useful tools in big data analytics systems for
analyzing structured data from multiple perspectives (e.g., EHRs and activity based historical data)
(e.g., Garrido et al., 2014; Kudyba & Gregorio, 2010; Spruit et al., 2014).
Furthermore, our results also show that data interpretation is one of the critical big data
analytics features, which permits clinical data to be visualized in a useful way to support physicians
and nurses’ daily operations and help healthcare managers to make faster, better decisions (Gálvez
et al., 2014; Jardine et al., 2014; Ratwani & Fong, 2015). An example is the Department of Health
Western Australia who has been collaborating with the Western Australia Drug and Alcohol Office
to map and visualize the rates of drug-related hospitalizations, mortality, ambulance callouts,
police reported drug-related offences, treatment episodes recorded by drug and alcohol services in
the Perth metropolitan area in the HealthTracks system, which assists their governments to identify
at-risk populations and areas, and evaluate the association between socioeconomic status and drug-
related health outcomes for future service needs (Jardine et al., 2014).

23
Table 2 Breaking down big data analytics resource in health care
The elements of
big data analytics
resource
Sub-elements The number of
occurrence
Data aggregation
Data warehouse (SQL database, NoSQL database,
and cloud-based database) 6
16 Hadoop distributed file system 6
Extract-transform-load (ETL) 4
Data analysis
Descriptive analysis 18
61
Online analytic processing (OLAP) 15
Data mining 13
Text mining/Natural language processing (NLP) 9
Predictive modeling 6
Data interpretation Visual dashboards/systems 18
28 Reporting systems/interfaces 10
Total 105
4.1.2 The elements of big data analytics capability
The importance of the four types of big data analytics capability are ranked (by frequency
count) from our coding (see Table 3). The most important big data analytics capability for
healthcare organizations is analytical capability (coded as part of 49 occurrences), followed by
decision support capability (26), traceability (16), and predictive capability (14). We find that the
ability to process large amounts of clinical data to understand the past and current states of specific
target variables (23) is mentioned most often in the analytical capability element. Big data analytics
differs from traditional clinical decision support systems because of its unique ability to parallel
process large data volumes and parse and visualize data in real time or near real time (Watson,
2014). One case from our collection, a private health insurer in Australia, utilizes comparative
analysis to compare current and historical cost and profit data related to healthcare insurance
services controlling for claim anomalies, which in turn enabled them in making optimal quotes
(Srinivasan & Arunasalam 2013). Our results also show that the ability to explore the causes of
occurred medical events from relational databases (14) is one of the important analytical

24
capabilities for healthcare industries. For example, Newark Beth Israel Medical Center (NBIMC)
discovered some radiology exam activities as potential causes of longer patient stay by analyzing
43,000 patient cases aggregated from various data sources (Kudyba &Gregorio, 2010). This
analytical capability enables NBIMC to improve process efficiency and control costs by
identifying the causes of delay in the exam process such as unnecessary extra diagnostic tests and
treatments that were previously difficult or impossible to discover.
Table 3. Breaking down four Big Data Analytics Capabilities in Health Care
The elements of
big data analytics
capabilities
Sub-elements The number of
occurrence
Traceability
Integrate seamlessly clinical data across multiple
regions or facilities in near real time or real time 8
16 Track medical events based on the rules that built on
hospital claims 5
Search clinical databases for all data related to patient
characteristics and conditions 3
Analytical
capability
Analyze large amounts of clinical data to understand the
past and current state for specific target variables 23
49 Explore the causes of occurred medical events from
relational databases 14
Support real-time processing of multiple clinical data
streams 12
Decision support
capability
Generate clinical summary (or performance metrics) in
real time or near real time and presented in visual
dashboards/systems
17 26
Provide system outputs for role-based decision-making 9
Predictive
capability
Examine undetected correlations, patterns, trends
between specific variables of interest across regions or
facilities
9
14 Compare of cross-referencing current and historical data
and its outcomes to predict future trends 3
Provide actionable insights or recommendations in a
format readily understood by its users 2
Total 105
Decision support capability generates clinical summary in real time or near real time and
presents it using visual dashboards/systems (17) and yields sharable information and knowledge
such as historical reports, executive summaries, drill-down queries, statistical analyses, and time

25
series comparisons to different decision makers (9). Some information are deployed in real time
(e.g., medical device dashboard metrics) while others (e.g., daily reports) are presented in summary
forms. Reports generated by big data analytics engines are distinct from transitional IT
architectures as they facilitate the assessment of past and current operational environments across
all organizational levels. Visualization reports are normally generated after near-real-time data
processing and displayed on healthcare performance dashboards which assist healthcare analysts
to recognize emerging healthcare issues such as medical errors, potential patient safety issues and
appropriate medication use.
Traceability allows healthcare organizations to track patient data from all their system’s IT
components and medical devices. Traditional methods for harnessing these data are insufficient
due to the volumes which could result in unnecessary redundancy in data transformation and
movement and a high rate of inconsistency. Our cases show that big data traceability provides
authorized users access to large national or local data pools and integrates data simultaneously
from various sources (Bates et al., 2014; Brennan et al., 2014). This not only reduces conflicts
between different healthcare sectors, but also decreases the difficulties in linking the data to
healthcare workflow for process optimization.
However, despite its importance for healthcare quality improvement, predictive capability
only manifested in 14 occurrences. Some (e.g., Srinivasan & Arunasalam, 2013) but not all cases
organizations have the ability to discover undetected correlations, patterns, trends between specific
variables of interest across regions or facilities. Numerous prior studies indicate that the
application of predictive and prescriptive analytics to health care fields is still in its earliest stages
(Amarasingham et al., 2014; Spruit et al., 2014). One of our cases demonstrated the difficulty in
developing a reliable predictive model without the ability to exploit large quantity of valuable

26
dataset (Spruit et al., 2014). Amarasingham et al. (2014) indicate that the difficulty to customize
legacy healthcare information systems for predictive models would limit the quality of predictions.
They further suggest that predictive models may not respond to changes in EHRs, therefore
requires IT personnel to manually refine the predictive rules which lowers the efficiency and
productivity of predictions.
4.1.3 The elements of IT enabled transformation practice
Our results reveal that big data analytics capabilities mainly support evidence-based
medicine (46), followed by meaningful use of EHR (19), network knowledge creation (12),
clinical resource integration (10), multidisciplinary practice (7), network collaborations (6), and
personalized care (5). We break down seven IT-enabled transformation practices that are
triggered by big data analytics, as Table 4. The majority of statements mention that healthcare
systems with the aid of big data analytics can identify practice-based clinical data (e.g., patient
demographics, medical history, and treatments) effectively from day-to-day operations and
services in clinical settings (16), and abstract insights from systematic literature and research
studies (e.g., randomized-controlled trials, clinical guidelines, quasi-experimental studies, and
external expert opinions) to build holistic view of evidence (11). These data could be the basis of
evidence-based medicine for decision makers as they are transformed into the useful evidence
through an evidence quality evaluation (10). For example, MedStar Health, a 10-hospital system
serving the mid-Atlantic region in the United States reports that using patient safety event
reporting systems (PSRS) resulted in their elimination of many medical errors and produced the
guideline for patient safety. Applying visual analytics techniques in PSRS, MedStar aggregates
patient safety events across the hospitals and the data from semi-structured interviews to improve
27
awareness of event types and shares event patterns and trends as evidence with department
leadership to address potential safety hazards (Ratwani & Fong, 2015).
Meaningful use of EHR is reported as the second highest occurrence of big data analytics
enabled transformation practice. An example, reported by Garrido et al (2014), shows that
HealthConnect – a big data analytics based EHR system developed for Kaiser Permanente –
provides automated reporting of 21 quality measures, resulting in system-wide health care
improvements for their patients. One of the reasons that made this automation possible is that
their EHR is supported by data mining techniques so data can be captured across conditions,
mapped, standardized, and validated effectively.
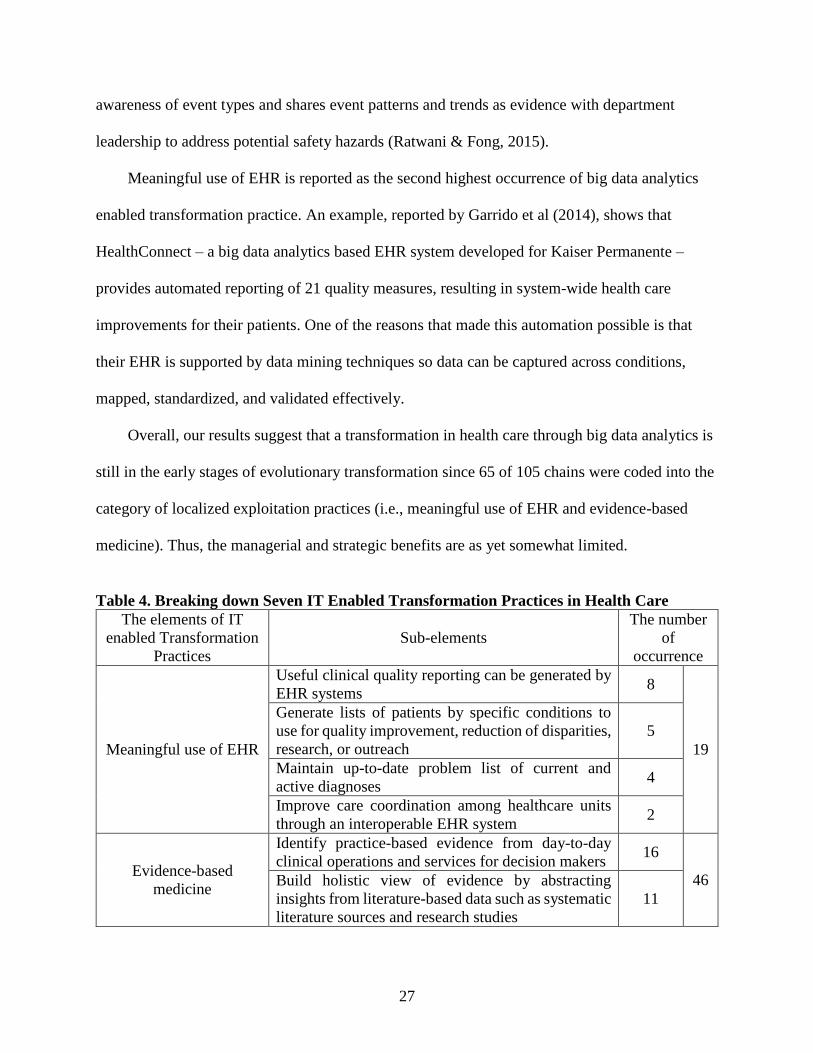
Overall, our results suggest that a transformation in health care through big data analytics is
still in the early stages of evolutionary transformation since 65 of 105 chains were coded into the
category of localized exploitation practices (i.e., meaningful use of EHR and evidence-based
medicine). Thus, the managerial and strategic benefits are as yet somewhat limited.
Table 4. Breaking down Seven IT Enabled Transformation Practices in Health Care
The elements of IT
enabled Transformation
Practices
Sub-elements
The number
of
occurrence
Meaningful use of EHR
Useful clinical quality reporting can be generated by
EHR systems 8
19
Generate lists of patients by specific conditions to
use for quality improvement, reduction of disparities,
research, or outreach
5
Maintain up-to-date problem list of current and
active diagnoses 4
Improve care coordination among healthcare units
through an interoperable EHR system 2
Evidence-based
medicine
Identify practice-based evidence from day-to-day
clinical operations and services for decision makers 16
46 Build holistic view of evidence by abstracting
insights from literature-based data such as systematic
literature sources and research studies
11

28
Overall practice-based and literature-based data are
graded to reflect the quality of the supporting
evidence
10
Explore the fact from medical events (or patient
treatments) to improve a specific outcome 6
Patient cases can exchange among providers and
patient-authorized entities 3
Multidisciplinary
Allow physicians to use quality metrics and care
dashboards that aggregate information from
multidisciplinary teams
4
7
Provide joint decisions regarding treatments to
patients from a multidisciplinary team 3
Clinical resource
integration
Allocate resources to serve each healthcare unit 8
10 Create centralized information support for clinical
operation 2
Network collaboration
Resolve conflicts on data sources between care
providers and other stakeholders 3
6 Build common understanding of healthcare service
between care providers and other stakeholders 3
Network knowledge
creation
Allow all stakeholders to share information on the
platforms 7
12 Discover new knowledge by enabling stakeholders to
collaboratively map ideas from interoperable
analytic platforms
5
Personalized care Create a personalized disease risk profile and disease
and wellness management plan for each patent 5 5
Total 105
4.1.4 The elements of benefit dimension
For the third layer of the BDET model, the benefit dimension, our results indicate that the
primary utility of IT-enabled practices for healthcare organizations is to enhance their IT
infrastructure (44), followed by operational (40), organizational (8), managerial (9), and strategic
benefits (4). Breaking down the potential benefits of big data analytics, many cases reveal that
big data analytics techniques such as data mining (Kudyba & Gregorio, 2010; Zhang, 2014a),
visual analytics (Ferranti et al., 2010; Gálvez et al., 2014; Ratwani & Fong, 2015) and predictive
analytics (Bardhan et al., 2015; Srinivasan & Arunasalam, 2013) being used to analyze patient
data can significantly improve clinical workflow (17), monitor quality, and reduce costs (11).

29
Moreover, big data analytics has the potential to reduce system redundancy (10) and to
transfer data quickly and securely at different locations (7). For example, to aggregate data from
about 50,000 patients, 6,700 appointments and medical staff s within the hospitals for building
the predictive model to tackle the problem of overbooking appointments, Mental Health Center
of Denver use a mining table with 3474 attributes to classify the characteristics of appointment
for each patient (Samorani & LaGanga, 2015). This mining table allows recording patient and
appointment information accurately and avoiding data duplication in turn to increase predictions
quality.
Table 5. Breaking down the potential benefits of big data analytics
The elements of
potential benefits Sub-elements
The number of
occurrence
IT infrastructure
benefits
Reduce healthcare system redundancy 10
44
Quickly and securely transfer data between healthcare
IT systems at different hospitals 7
Reduce maintenance costs regarding data storage 6
Avoid unnecessary IT costs 6
Better use of healthcare systems 5
Conduct basic analytic processing without changes in
code 5
Gain better IT effectiveness compared to the
traditional database environments 3
Process standardization among various healthcare IT
systems 2
Operational
benefits
Improve workflow efficiency 17
40
Monitor quality and improve costs and outcomes 11
Reduce the time for information extraction from
research studies on large databases 8
Explore new insights for improving care productivity 4
Organizational
benefits
Improve cross-functional communication and
collaboration 5
8 Solve multidisciplinary problems quickly than
traditional manual methods 2
Organizational learn from various clinical reports 1
Managerial
benefits
Gain insights quickly about changing healthcare
trends in the market 6
9 Provide members of the board and heads of
department with sound information about decision
making and planning
3

30
Strategic benefits
Building competitive advantage on cost and health
service 3
4 Provide comprehensive view of care delivery for
innovation 1
Total 105
4.2 Discussion of Pair-wise Connections
We further look at the pair-wise connections among the elements that provide us a deeper
understanding of (1) how big data analytics capabilities can be generated from big data analytics
components (see Table 6), (2) how IT enabled transformation practices can be triggered by big
data analytics capabilities (see Table 7), and (3) how big data analytics capabilities contribute to
the business value (see Table 8).
4.2.1 Linking big data analytics components with their capabilities
Table 6 provides a technological understanding of how big data analytics capabilities can
be created from different big data analytics components. Breaking down theses connections,
most obviously, the results show that data analysis component can generate analytical capability
(47), while data interpretation component can trigger decision support capability (19).
Table 6 Number of pair-wise connections linking big data analytics components with big
data analytics capabilities
Big data analytics
capabilities
Big data analytics resources
Data aggregation Data analysis Data interpretation Total
Traceability 13 3 0 16
Analytical 2 47 0 49
Decision support 1 6 19 26
Predictive 0 5 9 14
Total 16 61 28 105
4.2.2 Linking big data analytics capabilities with transformation practices
Table 7 shows that analytical capability mainly improves evidence-based medicine (27
connections), which in turn can lead to better clinical resource integration (5 connections) and

31
network knowledge creation (5 connections). The second highest count of connections is the link
between decision support capability and evidence-based medicine practice, which has 16 links.
Our analysis also indicates that increased traceability (15 links) and analytical capability (4 links)
play vital roles in improving the meaningful use of EHR practices.
Overall, of the capabilities that are less frequently linked to revolutionary transformation
level practices, 9.52% are connected to business process redesign (i.e., clinical resource
integration), 17.14% with business network redesign (i.e., network collaboration and network
knowledge creation), and 4.76% to business scope redefinition (personalized care). This result
agreed with several previous studies (e.g., Raghupathi & Raghupathi, 2014; Ward et al., 2014)
that the value of big data analytics to healthcare-related operations and services is currently
limited since the challenges for health data collection and processing have not been addressed.
More advanced applications and maturing analytical processes are needed for big data analytics
solutions in healthcare to achieve their full potential.
Table 7. Number of pair-wise connections linking big data analytics capabilities with big data
analytics enabled transformation Practice
Big data-enabled
transformation
practices
Big data capabilities
Traceability Analytical Decision support Predictive Total
Evidence-based
medicine 1 27 16 2 46
Meaningful use of
EHR 15 4 0 0 19
Multidisciplinary 0 1 6 0 7
Clinical resource
integration 0 5 0 5 10
Network collaboration 0 4 0 2 6
Network knowledge
creation 0 5 4 3 12
Personalized care 0 3 0 2 5
Total 16 49 26 14 105
4.2.3 Linking big data capabilities with potential benefits
32
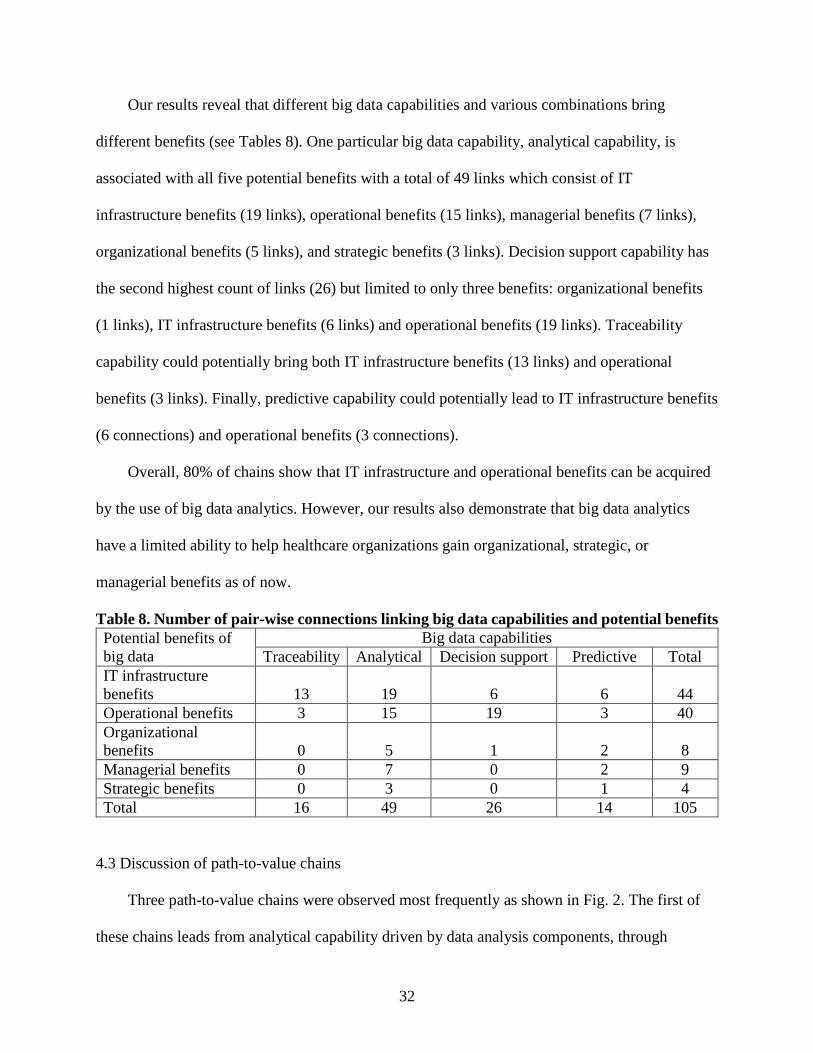
Our results reveal that different big data capabilities and various combinations bring
different benefits (see Tables 8). One particular big data capability, analytical capability, is
associated with all five potential benefits with a total of 49 links which consist of IT
infrastructure benefits (19 links), operational benefits (15 links), managerial benefits (7 links),
organizational benefits (5 links), and strategic benefits (3 links). Decision support capability has
the second highest count of links (26) but limited to only three benefits: organizational benefits
(1 links), IT infrastructure benefits (6 links) and operational benefits (19 links). Traceability
capability could potentially bring both IT infrastructure benefits (13 links) and operational
benefits (3 links). Finally, predictive capability could potentially lead to IT infrastructure benefits
(6 connections) and operational benefits (3 connections).
Overall, 80% of chains show that IT infrastructure and operational benefits can be acquired
by the use of big data analytics. However, our results also demonstrate that big data analytics
have a limited ability to help healthcare organizations gain organizational, strategic, or
managerial benefits as of now.
Table 8. Number of pair-wise connections linking big data capabilities and potential benefits
Potential benefits of
big data
Big data capabilities
Traceability Analytical Decision support Predictive Total
IT infrastructure
benefits 13 19 6 6 44
Operational benefits 3 15 19 3 40
Organizational
benefits 0 5 1 2 8
Managerial benefits 0 7 0 2 9
Strategic benefits 0 3 0 1 4
Total 16 49 26 14 105
4.3 Discussion of path-to-value chains
Three path-to-value chains were observed most frequently as shown in Fig. 2. The first of
these chains leads from analytical capability driven by data analysis components, through

33
evidence-based medicine to IT infrastructure benefits (19 occurrences). The second, which starts
with decision support capability trigged by data interpretation component and moves through
evidence-based medicine practice to operational benefits, is equally significant (16 occurrences).
The final chain, which goes from traceability enabled by data aggregation component, through
meaningful use of EHR and IT infrastructure benefits, is slightly less common (13 occurrences).
We did not present any process link from predictive capability because the frequency count is
below the cut-off point (10 occurrences) we chose.
4.3.1 The first path-to-value chain
Evidence-based medicine practices are increasingly applied as an important way to ensure
high quality care in healthcare settings (Straus et al., 2005). Big data analytics provide solutions
to fill the growing need of healthcare managers to make better use of real-time data, unify all
patients’ medical records, and capture data from medical devices, thus supporting evidence-
based medicine. It is now possible to identify new insights from massive healthcare record
databases with ease as well as from large scale medical literature databases, which helps doctors
and medical staffs make more accurate diagnoses and better treatment decisions. For example,
Optum Labs, an open collaborative research and innovation center, has emphasized that
analyzing findings from previous clinical studies could be used to translate new evidences into
routine clinical processes and thus drive successful evidence-based medicine (Wallace et al.,
2014).
In addition, analyzing a variety of patient data allows physicians to match treatments with
evidence-supported outcomes that offer more reliable care to patients (Kudyba & Gregorio,
2010; Spruit et al., 2014). A recent study by Raghupathi & Raghupathi (2014) has reported that
the Rizzoli Orthopedic Institute in Bologna, Italy, who analyzes patients’ genomic data and case

34
histories to determine hereditary diseases risks and to provide information of effective treatments
for hereditary diseases. Their analytical capability is used to develop more evidence-based
surgery protocols for patients with genetic disease, resulting in 60% reduction in imaging
requests. Likewise, by using data mining approach, Dutch long-term care institution classifies all
incidents into predefined categories and finds the causes of occurred incidents. Such analytical
capability helps Dutch long-term care institution discover the facts to improve their patient safety
(Spruit et al., 2014). We thus conclude that analytical capability can improve the efficiency of
evidence-based medicine practices, which in turn facilitates IT infrastructure benefits.
4.3.2 The second path-to-value chain
Big data analytics has the potential to promote unity in evidence-based medical practices,
particularly where decision support capability is implemented. The diverse outputs from big data
analytics systems in the healthcare context, including clinical information displayed in visual
metrics/dashboards, real-time monitoring of information (e.g., alerts and proactive notifications),
real time data navigation, and operational key performance indicators (KPIs) accelerate
healthcare organizations’ ability to make sound decisions for daily clinical operations (Simpao et
al., 2015a). These outputs as an important source of evidence are generally gathered from
multiple sources such as clinical healthcare systems, smartphones and personal medical devices
and sent on to relevant specialists in the teams or made available in the form of real time
dashboards to monitor patients’ health and prevent medical accidents. With these outputs to
support decision support capability, our case hospitals (e.g., Mental Health Center of Denver and
Kaiser Permanente Northern California) not only recognize feasible opportunities for quality
improvement (Garrido et al., 2014; Samorani & LaGanga, 2015; McLaughlin et al., 2014), but

35
also helps their analysts to recognize emerging healthcare issues such as medical errors, various
patient safety issues and appropriate medication use (Simpao et al., 2015a; Simpao et al., 2015b).
Thus, decision support capability can improve the quality of evidence-based medicine practices
and consequently lead to operational benefits.
4.3.3 The third path-to-value chain
The use of EHR has the potential to enhance healthcare service efficiency and effectiveness,
but this does not mean that simply adopting the system will produce those benefits. In the United
States, the HITECH Act, which is part of the Recovery and Reinvestment Act of 2009,
introduced a meaningful use guide for EHR, emphasizing that the main objective is to create
digital medical records, including the entry of basic data, and optimize the utilization of EHR
(Blumenthal & Tavenner 2010). To achieve meaningful use and avoid penalties, healthcare
providers must follow a set of practices with core quality measures that serve as a guideline for
effective using of EHR systems. This involves implementing two key practices: (1) facilitating
basic EHR adoption and clinical data gathering; and (2) strengthening care coordination and
exchange of patient information (Centers for Medicare & Medicaid Services, 2014).
From our results, big data analytics indeed has the potential to help healthcare organizations
achieve the meaningful use of EHR practices. We found that adopting big data analytics in a
healthcare organization makes it possible to maintain patient EHR data by tracking patients’
demographics and health status, doctor prescriptions, and medications and diagnoses
automatically (Bates et al., 2014; Halamka, 2014; Simpao et al., 2015a; Simpao et al., 2015b).
Ideally, with traceability triggered by data aggregation tools such as data warehouse and ETL
tools, healthcare organization can capture all patient data with ease from separate repositories

36
ranging from single IT components, clinical offices (e.g., physicians, pharmacies, or research
labs) to large state-level or national-level hospital networks. This permits data analysts to
aggregate every patient’s health records and transform them into meaningful information, and
then present such information to eligible healthcare providers. By increasing data quality and
coordination efficiency of EHRs, IT costs (e.g., reducing the load on working memory) and
redundancies are reduced (Simpao et al., 2015a). One of our cases, Brigham and Women’s
Hospital (BWH) is a good example of high efficacy of in-depth traceability in longitudinal
healthcare data. BWH integrates data mining algorithms with proper data rules into legacy IT
systems to automatically monitor drug safety through tracking warning signals triggered by
alarm systems. They use the traced data to implement drug-drug and drug-allergy interactions
checks for EHR reporting and thus are able to identify drug-related risks at an earlier stage
(Bates et al., 2014). Such traceability boosts EHR being used in a meaningful way, which in turn
facilitates IT infrastructure benefits.
5. THEORETICAL AND MANAGERIAL IMPLICATIONS
5.1 Theoretical implications
This study has several theoretical implications for big data analytics research. First, instead
of simply focusing on the impact of big data analytics on business value, we have developed the
big data enabled transformation model based on practice-based view to further understand how
big data analytics impacts the transformation practices in healthcare organizations. We believe
this is among the first attempts to systematically capture the causal relationships among big data
analytics capabilities, IT-enabled transformation practices, benefit dimensions and business
value. Second, our study reveals the essential elements, connections, and path-to-value chains for

37
an understanding of organization transformation through big data analytics. To the best of our
knowledge, this is a first study that took such unique approach integrating a prominent IS
theories, applying the new perspectives to a current IT innovation to show the “causal chains” of
IS business value. With this approach, we have provided empirical evidence that big data
analytics has a significant impact on improving meaningful use of EHR and evidence-based
medicine practices.
Finally, PBV promotes a research approach that “examines publicly known, imitable
activities, or practices amenable to transfer across firms." (Bromiley & Rau 2014, p.1249).
Healthcare is a fertile domain for this type of research because there are many “publicly known”
and “imitable activities.” Therefore, we chose the healthcare industry to further test and validate
the applicability of our model. As practice-based view offers a new and different perspective to
complement the extant strategic views such as resource-based theory (Bromiley & Rau 2014),
we set out to explore the potential explanations for performance variation from common
practices.
5.2 Practical implications
Our findings offer practical insights and guidance for healthcare practitioners who are
engaged in implementing big data analytics. First of all, decision support is one of the crucial big
data analytics capabilities due to its ability to create meaningful clinical reports. The key to use
reports effectively is to equip managers and employees with relevant professional competencies,
such as the skills of making an appropriate interpretation of the results and critical thinking.
According to American Management Association (2013), 64% of organizations in the United
States fail to meet all of their expected analyzing data skills needed in the workplace. In this

38
regard, incorrect interpretation of the reports generated could lead to serious errors of judgment
and questionable decisions. Thus, it is important that healthcare organizations provide analytical
training in areas such as basic statistics, data mining and business intelligence to those
employees who will play a critical support role in the new information-rich work environment.
Mentoring, cross-functional team-based training and self-study are also beneficial training
approaches to help employees develop the big data analytical skills they need.
Second, the third path-to-value chain which goes from traceability through meaningful use
of EHR to IT infrastructure benefits is slightly less common than the first two chains.
Traceability is the ability to track output data from all the system’s IT components throughout
the organization’s service units and thus could help in keeping real-time updates. To comply
with the Patient Protection and Affordable Care Act (PPACA) of 2010, healthcare organizations
need to keep detailed and updated data. Our results show that this capability is still underutilized
maybe because healthcare managers have not recognize the potential benefits or are cost
sensitive. Our result demonstrates the elements involved in this path-to-value which managers
could try to develop and to include to their repertoire.
Finally, although the frequency counts of the path-to-value chain the predictive capability
leads was below our cut-off criteria, it still provides some practical value because it can help to
generate new ideas. New idea generation is not only necessary for organizational innovation, but
also can lead to changes in business operations that will increase productivity and build
competitive advantages. This could be achieved through the use of powerful big data predictive
analytics tools. These tools can provide detailed reporting and identify market trends that allow
companies to accelerate new business ideas and generate creative thinking. For example, one of
our cases shows that predictive analytics supports Beth Israel Deaconess Medical Center’s home

39
health care by predicting patient illness, to quickly deploy nurses to where the patient suffers a
health emergency. This reduced expensive emergency department visits. It also increased
collaborating with local healthcare providers for care coordination (Halamka, 2014).
6. CONCLUSION
Notwithstanding the above-mentioned contributions and implications, our study is subject
to the limitations. One challenge in the health care industry is that their IT adoption usually lags
behind other industries. Case organizations studied in this paper are “leaders” in their own rights.
They are either top-ranked research hospitals or associated with top medical schools with
resources, or highly profitable entities. We have not found “small” healthcare organizations that
could afford big data analytics technologies to enjoy the benefits we presented by our findings.
Our study reveals the essential elements, links, and path-to-value chains for an
understanding of big data enabled transformation. One limitation of this study is the data source.
Further and better validation of the BDET model could be done through collecting and analyzing
primary data. Given the growing number of healthcare organizations adopting big data
technologies, the sample frame for collecting primary data is larger. Examining the BDET model
and our findings with quantitative analysis method could shed different lights. With quantitative
method, correlations, effect sizes and relationships are quantified. However, to carry out a
quantitative study, a valid scale for big data analytics capabilities is needed.
In addition to requiring empirical analysis of big data enabled transformation, our study also
exposes the needs for more scientific and quantitative studies, focusing on some of the big data
capability elements we identified. This especially applies to the two most frequently cited big
data analytics capabilities, analytical capability and decision support capability in our cases,

40
With a growing amount of diverse and unstructured data, there is an urgent need for advanced
analytic techniques, such as deep machine learning algorithms that instruct computers to detect
items of interest in large quantities of unstructured and binary data, and to deduce relationships
without needing specific models or programming instructions. We thus expect future scientific
studies that develop efficient unstructured data analytical algorithms and applications as primary
technological developments.
Future research may also consider using in-depth single or multiple cases studies to explain
how and why big data capabilities help improve specific IT-enabled transformation practices.
This particularly applies to the most frequent path-to-value chain, which leads from analytical
capability, through evidence-based medicine and IT infrastructure benefits to profitability. Such
case studies allow academics and practitioners to a more granular understanding of big data
management best practices in real-world.
Different industries have different needs or goals of using big data technology solutions.
We targeted healthcare for this study. Hence, the results are industry-specific. Future research
can apply the BDET model to other industries. Different big data capabilities, practices, benefits
and outcomes might surface. In light of these future opportunities, we believe the big data
research stream with a focus on strategic view has great potential to help balance the number of
studies of big data from technological and managerial-oriented perspectives.
In conclusion, not only has this study focused on identifying the big data analytics
capabilities, but also we have developed a Big Data Analytics-Enabled Transformation Model
based on Bromiley & Rau’s (2014) practice-based view. While PBV purposely define practice in
an ambiguous manner to accommodate the idiosyncratic nature of such construct, our study

41
extends PBV by considering the IT-enabled transformation practice in health care as a practice
variable and big data analytics capabilities as an explanatory variable. As a result, this study may
provide a good starting point in opening the “black box” of how big data analytics capabilities
impact transformation practices in healthcare.
Appendix A. A list of big data cases
No. Case Name Country Sources
1 Children’s Hospital of
Philadelphia United States
Gálvez et al. (2014); Simpao et
al. (2015a); Simpao et al. (2015b)
2 Brigham and Women’s hospital United States Bates et al. (2014)
3 Mental Health Center of Denver United States Samorani & LaGanga (2015)
4 North Texas Hospitals System United States Bardhan et al. (2015)
5 Beth Israel Deaconess Medical
Center United States Halamka (2014)
6 Private Health Insurer Australia Srinivasan & Arunasalam (2013);
Srinivasan 2014
7 Neonatal intensive care units in
The Hospital for Sick Children Canada Blount et al. (2010)
8 Chicago Department of Public
Health United States Choucair et al. (2015)
9 Case Western University Hospital United States Sahoo et al. (2014)
10 Centers for Medicare and
Medicaid Services (CMS) United States Brennan et al. (2014)
11 Cardinal Health United States Carte et al. (2005)
12 University of Utah Health
Sciences Center United States Kawamoto et al. (2014)
13 United Health Services Hospitals United States Agnihothri et al. (2015)
14 OCHIN Community Health
Information Network United States DeVoe et al. (2014)
15 Dutch long-term care institution Netherlands Spruit et al. (2014)
16 Guysborough Antigonish Strait
Health Authority Canada Foshay & Kuziemsky (2014)
17 UCLA Medical Center United States McLaughlin et al. (2014)
18 Department of Health Western
Australia Australia Jardine et al. (2014)
19 Optum Labs United States Wallace et al. (2014)
20 Children’s Healthcare of Atlanta United States Basole et al. (2015)
21 Duke University Health System United States Ferranti et al. (2010)
22 Newark Beth Israel Medical
Center United States Kudyba & Gregorio (2010)

42
23 Jinhua Municipal Central
Hospital China Zhang (2014a); Zhang (2014b)
24 Cardiac surgery Centre in New
Delhi India Jhajharia et al. (2015)
25 Veterans Health Administration United States Ghosh & Scott (2011); Fihn et al.
(2014)
26 Kaiser Permanente Northern
California United States
Garrido et al. (2014); Bates et al.
(2014)
27 NorthShore University Health
System United States Degaspari (2013)
28 MedStar Health United States Ratwani & Fong (2015)
Appendix B. Defining the Initial Elements of Connecting Layers
Elements Descriptions Sources
Traceability
Integrate and track the patient data from all of the IT
components throughout the various healthcare service
units
Wang et al.
(2015); Wang et
al. (2016)
Analytical
capability
Enable users to process clinical data with an immense
volume (from terabytes to exabytes), variety (from
text to graph) and velocity (from batch to streaming)
by using descriptive analytics techniques
Watson (2014);
Cao et al. (2015)
Decision support
capability
Produce outputs regarding patients, care process and
service to guide diagnostic and treatment decisions
Groves et al.
(2013)
Predictive
capability
Explore data and identify useful correlations, patterns
and trends and extrapolate them to forecast what is
likely to occur in the future
Delen (2014);
Negash (2004)
Evidence-based
medicine
Integrate individual clinical expertise with the best
available external clinical evidence from systematic
research
Straus et al. (2005)
Meaningful use
of EHR
The practices that realize the true potential of EHR to
improve the safety, quality, and efficiency of care
Blumenthal &
Tavenner (2010);
DesRoches et al.
(2013)
Multidisciplinary Practices draw from multiple specialties with
coordinated, interrelated behaviors
Oborn et al.
(2011)
Clinical resource
integration
The practices which patient care services are
coordinated across the various functions, activities,
and operating units of a system
Miller (1996)
Network
collaboration
The practices which concentrate on the collaboration
between care providers and other stakeholders in
terms of dedicated care management resources, data
reporting, and quality measurement
Claffey et al.
(2012)
Network
knowledge
creation
The practices which incorporate new explicit and
tacit knowledge generated from healthcare networks
into the clinical routines
Abidi et al.
(2005); Nicolini et
al. (2008)

43
Personalized care
The practices which seek to identify the optimal
treatment for each individual patient to stratify
patients for specific therapies and minimize adverse
effects by utilizing clinical information.
Schleidgen et al.
(2013)
Appendix C. Coding Examples
Statement A Open (underlined) and
axial (italic) Coding
Path-to-value chains
confirmed by selective coding
Children’s Hospital of Philadelphia (Case #1)
“Several steps are required to visualize big data
using visual analytics tools. First, the data are
stored in a dimensional database
model….Dimensional models create a unique fact
table that contains all potential data transactions
in addition to filters used to associate facts and
measures throughout the database. Our hospital
uses VA to monitor hand hygiene compliance,
nursing metrics, supply chain performance, and
adherence to clinical guidelines (e.g. Febrile
Infant Pathway dashboard). Many additional
examples of VA applications in health care are
available, such as for visualizing dynamic data
from multiple EHRs, tracking symptom evolution
during disease progression………... This enables
the user to explore alert from electronic health
record medication data and historic blood
transfusion data (based on patient characteristics
and procedure type)…....this tool offers benefits
compared with traditional database queries: the
user can explore big data in a self-service point-
and-click fashion as opposed to writing database
queries manually. Complex ideas can be
communicated with clarity and efficiency in
visual graphs rather than the tabular data output
from a traditional database query.” (Simpao et al.,
2015a)
Big data analytics
capabilities, Traceability
Track medical events
based on the rules that
built on hospital claims
Practices, Meaningful use
of EHR
Generate lists of patients
by specific conditions to
use for quality
improvement
Benefits, IT
infrastructure benefit
Gain better IT
effectiveness compared
to the traditional
database environments
Comparing this statement to
other similarly coded
elements (i.e., data
aggregation component,
traceability, and meaningful
use of EHR, and IT
infrastructure benefit.
Both coders from expert
panel agreed on traceability,
driven by data aggregation
can lead to improve
meaningful used of EHR
practice, thereby facilitating
IT infrastructure benefit
Recording this statement as
one of the path-to-value
chains: Data aggregation
Traceability
Meaningful use of EHR
practice IT infrastructure
benefit
Statement B Open (underlined) and
axial (italic) Coding
Path-to-value chains confirmed
by selective coding
Dutch long-term care institution (Case #15)
“The dataset contains 6126 incidents, which
includes attributes such as client, department,
date and time, type of incident, cause, location,
Comparing this statement to
other similarly coded
elements (i.e., data
aggregation component,
Big data analytics
resources, Data
aggregation
Data storage by
dimensional models
Big data analytics
resources, Data
aggregation
Collect data from
multiple sources and
integrate into a system

44
physical damage and mental damage. This
collection of data is very valuable, and could be
used for various analyses. First of all, all
incidents are selected for which a client,
department, date and time, type of incident and
location are registered, which results in a
collection of 5692 incidents. ……Fig. 1 shows
an upward trend, this does not necessarily
indicate that increasingly more incidents have
happened. We assume that a better registration of
incidents is most likely the cause of this trend.
For this analysis, all incidents were grouped per
hour using a SQL query which counts the
number of incidents between, for example, 00:00
and 00:59. Fig. 2 visualizes the number of
incidents at a certain time of day. It turns out that
most incidents occur during the day, between
08:00 and 09:00. The peaks between 08:00 and
09:00 and between 17:00 and 18:00 are most
likely caused by the transfers of the clients (e.g.
getting out of bed and going towards diner).
Also, the location of the incidents is being
registered, which could be used to detect
geographical problem areas at the care
institution. These results could trigger
management to research this fact and to increase
safety in the corridor………..For all care
institution locations it becomes clear that most
incidents take place in the living room. The other
locations where incidents commonly occur are
the bedroom, kitchen and bathroom. For these
(problem) areas the percentages are described
per location, which makes it possible to compare
the locations with each other” (Spruit et al.,
2014)
Big data analytics
capabilities, Analytical
capability
Explore the causes of
occurred medical events
from relational databases
Practices, Evidence-based
medicine
Explore the fact from
medical events to
improve a specific
outcome
Benefits, Operational
benefit
Understand on incident
locations and causes to
improve workflow
efficiency
analytical capability, and
evidence-based medicine
practice, and operational
benefit.
A discrepancy on analytical
capability occurred between
the two coders. The first
coder agreed that the analysis
provides the trends and
patterns to predict incidents
and coded it as predictive
capability in the first place.
However, the second coder
argued that the analysis only
presents the summarized
results according the current
5,692 incidents and there is
not enough information about
the predictions of future
incident trend.
After discussion and debate,
both coders agreed that ECR
software allows users to
collect data from multiple
sources that facilitate data
analysis capabilities. Such
capabilities enable managers
to make decisions based on
the evidences, thus resulting
in obtaining operational
benefits.
Recording this statement as
one of the path-to-value
chain: Data
aggregationAnalytical
capabilityEvidence-based
medicine practice
Operational benefit
References
Abidi, S. S. R., Cheah, Y. N., & Curran, J. (2005). A knowledge creation info-structure to acquire
and crystallize the tacit knowledge of health-care experts. Information Technology in
Biomedicine, IEEE Transactions on, 9(2), 193-204.
45
Agnihothri, S., Banerjee, A., & Thalacker, G. (2015). Analytics to improve service in a pre-
admission testing clinic. In System Sciences (HICSS), 48th Hawaii International Conference
on (pp. 1325-1331). IEEE.
Akter, S., Wamba, S. F., Gunasekaran, A., Dubey, R., & Childe, S. J. (2016). How to improve firm
performance using big data analytics capability and business strategy alignment?.
International Journal of Production Economics, 182, 113-131.
Amarasingham, R., Patzer, R. E., Huesch, M., Nguyen, N. Q., & Xie, B. (2014). Implementing
electronic health care predictive analytics: considerations and challenges. Health Affairs,
33(7), 1148-1154.
American Management Association (AMA). (2013). Conquering Big Data: Building Analytical
Skills in Your Organization, American Management Association Press.
Bardhan, I., Oh, J. H., Zheng, Z., & Kirksey, K. (2015). Predictive analytics for readmission of
patients with congestive heart failure. Information Systems Research, 26(1), 19-39.
Basole, R. C., Braunstein, M. L., Kumar, V., Park, H., Kahng, M., Chau, D. H. P., ... & Lesnick,
B. (2015). Understanding variations in pediatric asthma care processes in the emergency
department using visual analytics. Journal of the American Medical Informatics Association,
22(2), 318-323.
Bates, D. W., Saria, S., Ohno-Machado, L., Shah, A., & Escobar, G. (2014). Big data in health
care: using analytics to identify and manage high-risk and high-cost patients. Health Affairs,
33(7), 1123-1131.
Bharadwaj, A. S. (2000). A resource-based perspective on information technology capability and
firm performance: An empirical investigation. MIS Quarterly, 24(1), 169-196.
Blount, M., Ebling, M. R., Eklund, J. M., James, A. G., McGregor, C., Percival, N., ... & Sow, D.
(2010). Real-time analysis for intensive care: development and deployment of the artemis
analytic system. Engineering in Medicine and Biology Magazine, IEEE, 29(2), 110-118.
Blumenthal, D., and Tavenner, M. (2010). The “meaningful use” regulation for electronic health
records. New England Journal of Medicine, 363(6), 501-504.
Brennan, N., Oelschlaeger, A., Cox, C., & Tavenner, M. (2014). Leveraging the big-data
revolution: CMS is expanding capabilities to spur health system transformation. Health
Affairs, 33(7), 1195-1202.
Bromiley, P., & Rau, D. (2014). Towards a practice-based view of strategy. Strategic Management
Journal, 35, 1249-1256.
Cao, G., Duan, Y., & Li, G. (2015). Linking Business Analytics to Decision Making Effectiveness:
A Path Model Analysis. IEEE Transactions on Engineering Management, 62(3), 384 - 395
Carte, T., Schwarzkopf, A.B., Shaft, T.M., & Zund, R.W. (2005). Advanced business intelligence
at Cardinal Health. MIS Quarterly Executive, 4(4), 413-424.
Centers for Medicare & Medicaid Services. (2014), An Introduction to Stage 1 of the Medicaid
EHR Incentive Program for Eligible Professionals. Centers for Medicare and Medicaid
Services.
Choucair, B., Bhatt, J., & Mansour, R. (2015). A bright future: innovation transforming public
health in Chicago. Journal of Public Health Management and Practice, 21(1), S49-S55.
Claffey, T.F., Agostini, J.V., Collet, E.N., Reisman, L., & Krakauer, R. (2012). Payer-provider
collaboration in accountable care reduced use and improved quality in maine medicare
advantage plan. Health Affairs, 31(9), 2074-2083.

46
Degaspari, J. (2013). NorthShore University Health System. Electronic surveillance system flags
undiagnosed hypertensive patients. Healthcare Informatics: The Business Magazine for
Information and Communication Systems, 30(1), 12-14.
Delen, D. (2014). Real-World Data Mining: Applied Business Analytics and Decision Making. FT
Press.
DesRoches, C. M., Audet, A. M., Painter, M., & Donelan, K. (2013). Meeting meaningful use
criteria and managing patient populations: a national survey of practicing physicians. Annals
of Internal Medicine, 158(11), 791-799.
DeVoe, J.E., Gold, R., Cottrell, E., Bauer, V., Brickman, A., Puro, J., ... & Merrell, J. (2014). The
ADVANCE network: accelerating data value across a national community health center
network. Journal of the American Medical Informatics Association, 21(4), 591-595.
Eisenhardt, K.M., & Graebner, M.E. (2007). Theory building from cases: opportunities and
challenges. Academy of Management Journal, 50(1), 25-32.
Elo, S., & Kyngäs, H. (2008). The qualitative content analysis process. Journal of Advanced
Nursing, 62(1), 107-115.
Ferranti, J.M., Langman, M.K., Tanaka, D., McCall, J., & Ahmad, A. (2010). Bridging the gap:
leveraging business intelligence tools in support of patient safety and financial effectiveness.
Journal of the American Medical Informatics Association, 17(2), 136-143.
Fihn, S.D., Francis, J., Clancy, C., Nielson, C., Nelson, K., Rumsfeld, J., ... & Graham, G.L. (2014).
Insights from advanced analytics at the Veterans Health Administration. Health Affairs, 33(7),
1203-1211.
Foshay, N., & Kuziemsky, C. (2014). Towards an implementation framework for business
intelligence in healthcare. International Journal of Information Management, 34(1), 20-27.
Gálvez, J.A., Ahumada, L., Simpao, A.F., Lin, E.E., Bonafide, C.P., Choudhry, D., ... & Rehman,
M.A. (2014). Visual analytical tool for evaluation of 10-year perioperative transfusion
practice at a children's hospital. Journal of the American Medical Informatics Association,
21(3), 529-534.
Garrido, T., Kumar, S., Lekas, J., Lindberg, M., Kadiyala, D., Whippy, A., ... & Weissberg, J.
(2014). E-Measures: insight into the challenges and opportunities of automating publicly
reported quality measures. Journal of the American Medical Informatics Association, 21(1),
181-184.
Ghosh, B., & Scott, J.E. (2011). Antecedents and catalysts for developing a healthcare analytic
capability. Communications of the Association for Information Systems, 29(1), 395-409.
Goh, J.M., Gao, G., & Agarwal, R. (2011). Evolving work routines: adaptive routinization of
information technology in healthcare. Information Systems Research, 22(3), 565-585.
Groves, P., Kayyali, B., Knott, D., & Kuiken, S.V. (2013). The “Big Data” Revolution in
Healthcare: Accelerating Value and Innovation, McKinsey & Company.
Gupta, M., & George, J. F. (2016). Toward the development of a big data analytics capability.
Information & Management, 53(8), 1049-1064.
Halamka, J. D. (2014). Early experiences with big data at an academic medical center. Health
Affairs, 33(7), 1132-1138.
Hsieh, H.F., & Shannon, S.E. (2005). Three Approaches to Qualitative Content Analysis.
Qualitative Health Research, 15(9), 1277-1288.
Hu, H., Wen, Y., Chua, T. S., & Li, X. (2014). Toward scalable systems for big data analytics: A
technology tutorial. Access, IEEE, 2, 652-687.

47
Huang, J., Newell, S., Huang, J., & Pan, S. L. (2014). Site-shifting as the source of ambidexterity:
Empirical insights from the field of ticketing. The Journal of Strategic Information Systems,
23(1), 29-44.
Igira, F.T. (2008). The Situatedness of Work Practices and Organizational Culture: Implications
for Information Systems Innovation Uptake. Journal of Information Technology, 23(2), 79-
88.
Işık, Ö., Jones, M. C., & Sidorova, A. (2013). Business intelligence success: The roles of BI
capabilities and decision environments. Information & Management, 50(1), 13-23.
Jagadish, H. V., Gehrke, J., Labrinidis, A., Papakonstantinou, Y., Patel, J. M., Ramakrishnan, R.,
& Shahabi, C. (2014). Big data and its technical challenges. Communications of the ACM,
57(7), 86-94.
Jardine, A., Mullan, N., Gudes, O., Cosford, J., Moncrieff, S., West, G., ... & Someford, P. (2014).
Web-based geo-visualisation of spatial information to support evidence-based health policy:
A case study of the development process of 'Health Tracks'. Health Information Management
Journal, 43(2), 7-16.
Jensen, T., & Aanestad, M. (2007). Hospitality and Hostility in Hospitals: A Case Study of an EPR
Adoption among Surgeons. European Journal of Information Systems, 16(6), 672-680.
Jhajharia, S., Pal, S.K., Verma, S., & Kumar, M. (2015). Predictive analytics for better health and
disease reduction. In 1st IIMA International Conference on Advances in Healthcare
Management Services. Indian Institute of Management, Ahmedabad.
Jones, S. S., Heaton, P. S., Rudin, R. S., & Schneider, E. C. (2012). Unraveling the IT productivity
paradox—lessons for health care. New England Journal of Medicine, 366(24), 2243-2245.
Kallinikos, J., & Tempini, N. (2014). Patient data as medical facts: Social media practices as a
foundation for medical knowledge creation. Information Systems Research, 25(4), 817-833.
Kawamoto, K., Martin, C. J., Williams, K., Tu, M. C., Park, C. G., Hunter, C., ... & Morris, S. J.
(2014). Value Driven Outcomes (VDO): a pragmatic, modular, and extensible software
framework for understanding and improving health care costs and outcomes. Journal of the
American Medical Informatics Association, amiajnl-2013.
Kohli, R., & Grover, V. (2008). Business value of IT: An essay on expanding research directions
to keep up with times. Journal of the Association for Information Systems, 9(1), 23-39.
Krippendorff, K. (2004). Content Analysis: An Introduction to Its Methodology (2nd ed.), London:
Sage Publications.
Krippendorff, K. (2012). Content Analysis: An Introduction to its Methodology. Sage Press.
Kudyba, S., & Gregorio, T. (2010). Identifying factors that impact patient length of stay metrics
for healthcare providers with advanced analytics. Health Informatics Journal, 16(4), 235-245.
LaValle, S., Lesser, E., Shockley, R., Hopkins, M.S., & Kruschwitz, N. (2011). Big data, analytics
and the path from insights to value. MIT Sloan Management Review, 52(2), 21-31.
Lucas, H.C. Jr., Agarwal, R., Clemons, E.K., El Sawy, O.A., & Weber, B. (2013). Impactful
research on transformational information technology: An opportunity to inform new
audiences. MIS Quarterly, 37(2), 371-382.
Manyika, J., Chui, M., Brown, B., Bughin, J., Dobbs, R., Roxburgh, C., & Byers, A.H. (2011).
Big data: The next frontier for innovation, competition, and productivity. McKinsey &
Company.
Markus, M. (2004). Technochange management: using IT to drive organizational change, Journal
of information Technology, 19, 4-20.

48
Marshall, C., & Rossman G. B. (1995). Designing Qualitative Research. London: Sage
Publications.
McLaughlin, N., Afsar-manesh, N., Ragland, V., Buxey, F., & Martin, N. A. (2014). Tracking and
sustaining improvement initiatives: leveraging quality dashboards to lead change in a
neurosurgical department. Neurosurgery, 74(3), 235-244.
Melville, N., Kraemer, K., & Gurbaxani, V. (2004). Review: Information technology and
organizational performance: An integrative model of IT business value. MIS Quarterly, 28(2),
283-322.
Miller, R. H. (1996). Health system integration: a means to an end. Health Affairs, 15(2), 92-106.
Minichiello, V., Aroni, R., Timewell, E., & Alexander, L. (1990). In-Depth Interviewing:
Researching People. Hong Kong: Longman Cheshire.
Mueller, B., Viering, G., Legner, C., & Riempp, G. (2010). Understanding the economic potential
of service-oriented architecture. Journal of Management Information Systems, 26(4), 145-
180.
Murdoch, T.B., & Detsky, A.S. (2013). The inevitable application of big data to health care. The
Journal of American Medical Association, 309(13), 1351-1352.
Negash, S. (2004). Business Intelligence. Communications of the Association for Information
Systems, 13, 177-195.
Nicolini, D., Powell, J., Conville, P., & Martinez‐Solano, L. (2008). Managing knowledge in the
healthcare sector. A review. International Journal of Management Reviews, 10(3), 245-263.
Oborn, E., Barrett, M., & Davidson, E. (2011). Unity in diversity: Electronic patient record use in
multidisciplinary practice. Information Systems Research, 22(3), 547-564.
Peppard, J., Galliers, R.D., & Thorogood, A. (2014). Information systems strategy as practice:
Micro strategy and strategizing for IS. The Journal of Strategic Information Systems, 23(1),
1-10.
Peppard, J., Weill, P., & Daniel, E. (2007). Managing the realization of business benefits from in
investments. MIS Quarterly Executive, 6(1), 1-11.
Raghupathi, W., & Raghupathi, V. (2014). Big data analytics in healthcare: Promise and potential.
Health Information Science and Systems, 2(1), 3.
Ratwani, R.M., & Fong, A. (2015). Connecting the dots’: leveraging visual analytics to make sense
of patient safety event reports. Journal of the American Medical Informatics Association,
22(2), 312-317
Russo-Spena, T., & Mele, C. (2012). ʻFive co-s’ in innovating: A practice-based view. Journal of
Service Management, 23(4), 527-553.
Sahoo, S.S., Jayapandian, C., Garg, G., Kaffashi, F., Chung, S., Bozorgi, A., ... & Zhang, G.Q.
(2014). Heart beats in the cloud: distributed analysis of electrophysiological ‘Big Data’ using
cloud computing for epilepsy clinical research. Journal of the American Medical Informatics
Association, 21(2), 263-271.
Samorani, M., & LaGanga, L.R. (2015). Outpatient appointment scheduling given individual day-
dependent no-show predictions. European Journal of Operational Research, 240(1), 245-257.
Schatzki, T.R. (2005). Peripheral vision: The sites of organizations. Organization Studies, 26(3),
465-484.
Schilling, J. (2006). On the Pragmatics of Qualitative Assessment: Designing the Process for
Content Analysis. European Journal of Psychological Assessment, 22(1), 28-37.

49
Schleidgen, S., Klingler, C., Bertram, T., Rogowski, W. H., & Marckmann, G. (2013). What is
personalized medicine: sharpening a vague term based on a systematic literature review. BMC
Medical Ethics, 14(1), 55.
Shang, S., & Seddon, P.B. (2002). Assessing and Managing the Benefits of Enterprise Systems:
The Business Manager’s Perspective. Information Systems Journal, 12(4), 271-299.
Shollo, A., & Galliers, R.D. (2016). Towards an understanding of the role of business intelligence
systems in organisational knowing. Information Systems Journal, 26(4), 339-367.
Simpao, A.F., Ahumada, L.M., & Rehman, M.A. (2015a). Big data and visual analytics in
anaesthesia and health care. British Journal of Anaesthesia, 115(3), 350-356.
Simpao, A.F., Ahumada, L.M., Desai, B.R., Bonafide, C.P., Gálvez, J.A., Rehman, M.A., ... &
Shelov, E.D. (2015b). Optimization of drug–drug interaction alert rules in a pediatric
hospital's electronic health record system using a visual analytics dashboard. Journal of the
American Medical Informatics Association, 22, 361-369.
Spruit, M., Vroon, R., & Batenburg, R. (2014). Towards healthcare business intelligence in long-
term care: An explorative case study in the Netherlands. Computers in Human Behavior, 30,
698-707.
Srinivasan, U. (2014). Anomalies Detection in Healthcare Services. IT Professional, 6, 12-15.
Srinivasan, U., & Arunasalam, B. (2013). Leveraging big data analytics to reduce healthcare costs.
IT Professional, 15(6), 21-28.
Storage Networking Industry Association (2009). The information lifecycle management maturity
model. Storage Networking Industry Association Press.
Straus, S., Richardson, W.S., Glasziou, P. & Haynes, R.B. (2005). Evidence-based medicine: How
to practice and teach EBM (3rd ed.). Edinburgh: Churchill Livingstone.
Strauss, A., & Corbin, J. (1998). Basics of Qualitative Research: Techniques and Procedures for
Developing Grounded Theory (2nd ed.), Thousand Oaks, CA: Sage Publications.
Tallman, S., & Chacar, A.S. (2011). Knowledge accumulation and dissemination in MNEs: A
practice-based framework. Journal of Management Studies, 48(2), 278-304.
Trkman, P., McCormack, K., De Oliveira, M.P.V., & Ladeira, M.B. (2010). The impact of business
analytics on supply chain performance. Decision Support Systems, 49(3), 318-327.
Urquhart, C., Lehmann, H., & Myers, M. D. (2010). Putting the ‘theory’ back into grounded theory:
guidelines for grounded theory studies in information systems. Information Systems Journal,
20(4), 357-381.
Venkatraman, N. (1994). IT-enabled business transformation: From automation to business scope
redefinition. Sloan Management Review, 35(2), 73-87.
Wade, M., & Hulland, J. (2004). Review: The resource-based view and information systems
research: Review, extension, and suggestions for future research. MIS Quarterly, 28(1), 107-
142.
Wallace, P.J., Shah, N.D., Dennen, T., Bleicher, P.A., & Crown, W.H. (2014). Optum Labs:
building a novel node in the learning health care system. Health Affairs, 33(7), 1187-1194.
Wang, N., Liang, H., Zhong, W., Xue, Y., & Xiao, J. (2012). Resource structuring or capability
building? An empirical study of the business value of information technology. Journal of
Management Information Systems, 29(2), 325-367.
Wang, Y., & Byrd, T.A. (2017). Business analytics-enabled decision making effectiveness through
knowledge absorptive capacity in health care. Journal of Knowledge Management.
http://dx.doi.org/10.1108/JKM-08-2015-0301.

50
Wang, Y., & Hajli, N. (2017). Exploring the path to big data analytics success in healthcare.
Journal of Business Research, 70, 287-299.
Wang, Y., Kung, L., & Byrd, T. A. (2013). Leveraging event-driven it architecture capability for
competitive advantage in healthcare industry: A mediated model. In Thirty Fourth
International Conference on Information Systems, Milan, Italy.
Wang, Y., Kung, L., & Byrd, T. A. (2016). Big data analytics: Understanding its capabilities and
potential benefits for healthcare organizations. Technological Forecasting and Social Change.
http://dx.doi.org/10.1016/j.techfore.2015.12.019.
Wang, Y., Kung, L., Ting, C., & Byrd, T. A. (2015). Beyond a technical perspective: understanding
big data capabilities in health care. In System Sciences (HICSS), 2015 48th Hawaii
International Conference on (pp. 3044-3053). IEEE.
Ward, M.J., Marsolo, K.A., & Froehle, C.M. (2014). Applications of business analytics in
healthcare. Business Horizons, 57(5), 571-582.
Watson, H.J. (2014). Tutorial: Big data analytics: Concepts, technologies, and applications.
Communications of the Association for Information Systems, 34, 1247-1268.
Watson, H.J., Wixom, B.H., Hoffer, J.A., Anderson-Lehman, R., & Reynolds, A.M. (2006). Real-
time business intelligence: Best practices at Continental Airlines. Information Systems
Management, 23(1), 7-18.
Weber, R.P. (1990). Basic Content Analysis. Newburry Park, CA: Sage Publications.
Webster, J., & Watson, R. T. (2002). Analyzing the past to prepare for the future: writing a
literature review, MIS Quarterly, 26(2), xiii-xxiii.
Wixom, B. Yen, B., & Relich, M. (2013). Maximizing value from business analytics. MIS
Quarterly Executive, 12(2), 111-123.
Yin, R.K. (2008). Case Study Research: Design and Methods. Sage Publications.
Zhang, Z. (2014a). Big data and clinical research: focusing on the area of critical care medicine in
mainland China. Quantitative Imaging in Medicine and Surgery, 4(5), 426-429.
Zhang, Z. (2014b). Big data and clinical research: perspective from a clinician. Journal of Thoracic
Disease, 6(12), 1659-1664.