big data enabled analytics for actionable customer insight...
TRANSCRIPT
Analytics-CRM Community Webinar
Big Data Enabled Analytics for Actionable Customer Insight
Led by Amit Deshpande Vice President of Analytics, Epsilon
We will be starting at the top of the hour. Please stay on mute -- not hold. You will not hear anything until we start.
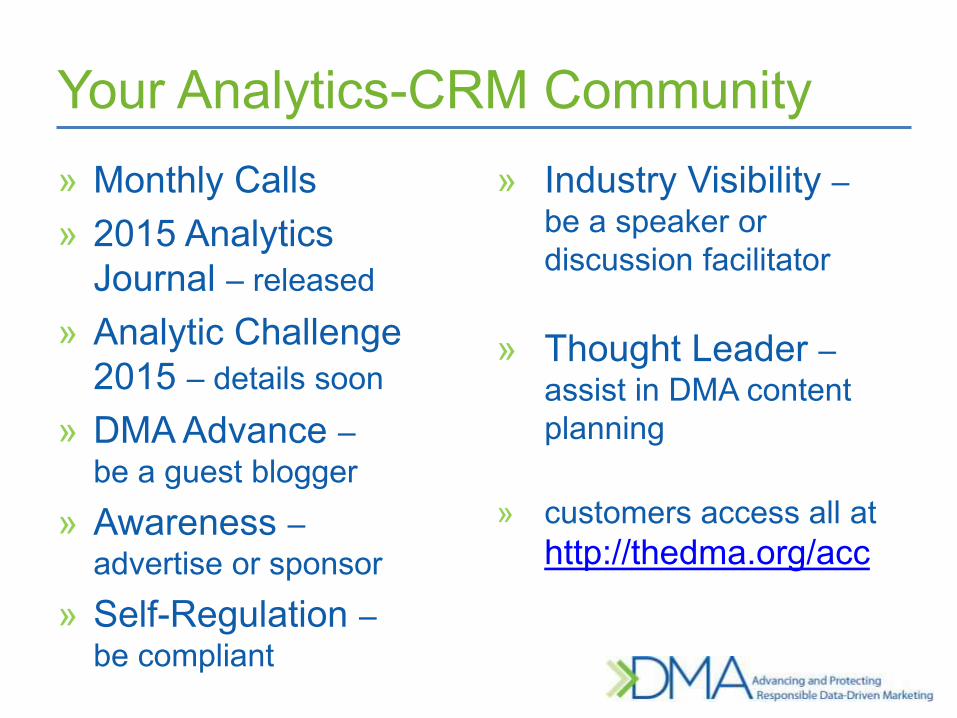
» Monthly Calls » 2015 Analytics
Journal – released
» Analytic Challenge 2015 – details soon
» DMA Advance – be a guest blogger
» Awareness – advertise or sponsor
» Self-Regulation – be compliant
Your Analytics-CRM Community » Industry Visibility –
be a speaker or discussion facilitator
» Thought Leader – assist in DMA content planning
» customers access all at http://thedma.org/acc
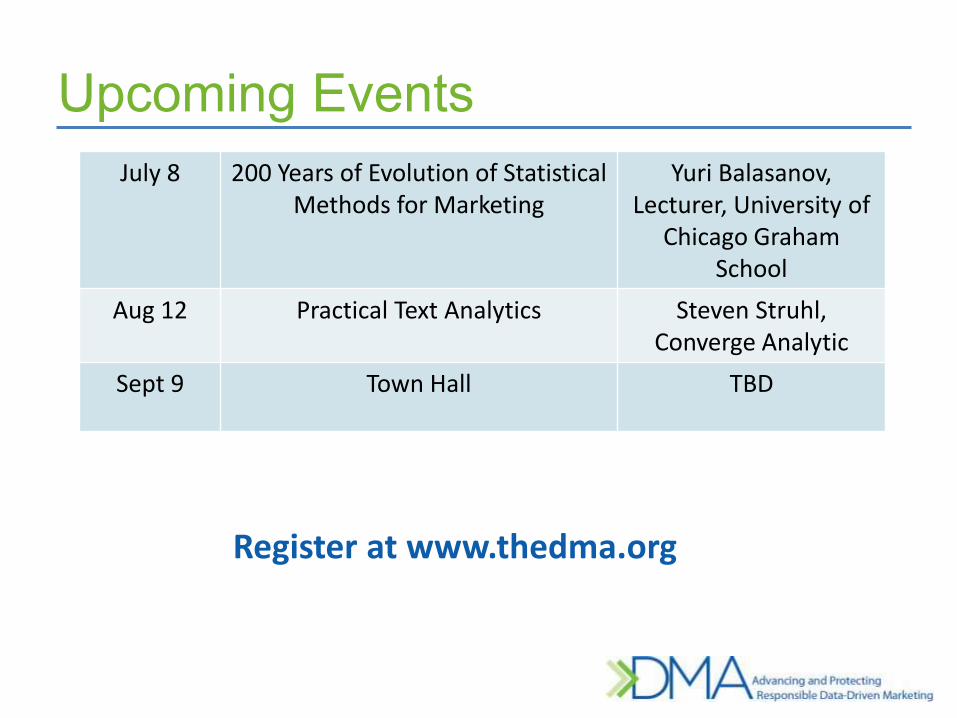
Upcoming Events
Register at www.thedma.org
July 8 200 Years of Evolution of Statistical Methods for Marketing
Yuri Balasanov, Lecturer, University of
Chicago Graham School
Aug 12 Practical Text Analytics Steven Struhl, Converge Analytic
Sept 9 Town Hall TBD
Analytics-CRM Community Webinar
Big Data Enabled Analytics for Actionable Customer Insight
Led by Amit Deshpande Vice President of Analytics, Epsilon
Please stay on mute -- not hold. Use the Question,Chat or Raise Hand feature to ask questions or share comments.

Agenda
» Big Data Era – Challenges and Opportunities
» Big Data Analytics
» Pharma Case Study
» Hospitality Case Study
» Conclusions
» Q&A
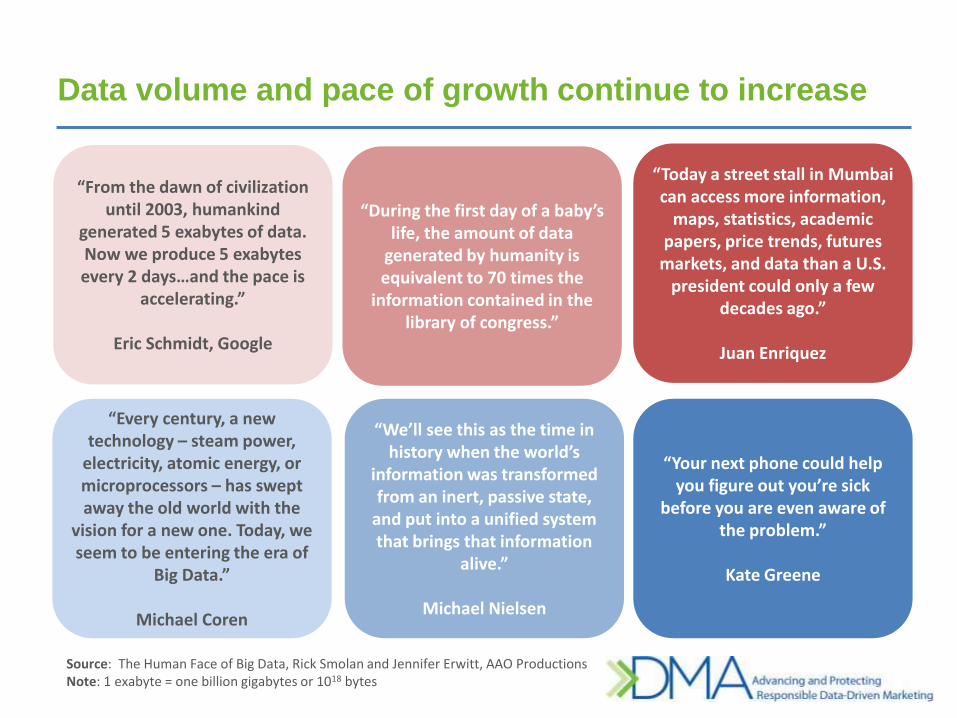
Data volume and pace of growth continue to increase
“Every century, a new technology – steam power,
electricity, atomic energy, or microprocessors – has swept away the old world with the
vision for a new one. Today, we seem to be entering the era of
Big Data.”
Michael Coren
“From the dawn of civilization until 2003, humankind
generated 5 exabytes of data. Now we produce 5 exabytes every 2 days…and the pace is
accelerating.”
Eric Schmidt, Google
“During the first day of a baby’s life, the amount of data
generated by humanity is equivalent to 70 times the
information contained in the library of congress.”
“Today a street stall in Mumbai can access more information,
maps, statistics, academic papers, price trends, futures
markets, and data than a U.S. president could only a few
decades ago.”
Juan Enriquez
“Your next phone could help you figure out you’re sick
before you are even aware of the problem.”
Kate Greene
“We’ll see this as the time in history when the world’s
information was transformed from an inert, passive state,
and put into a unified system that brings that information
alive.”
Michael Nielsen
Source: The Human Face of Big Data, Rick Smolan and Jennifer Erwitt, AAO Productions Note: 1 exabyte = one billion gigabytes or 1018 bytes
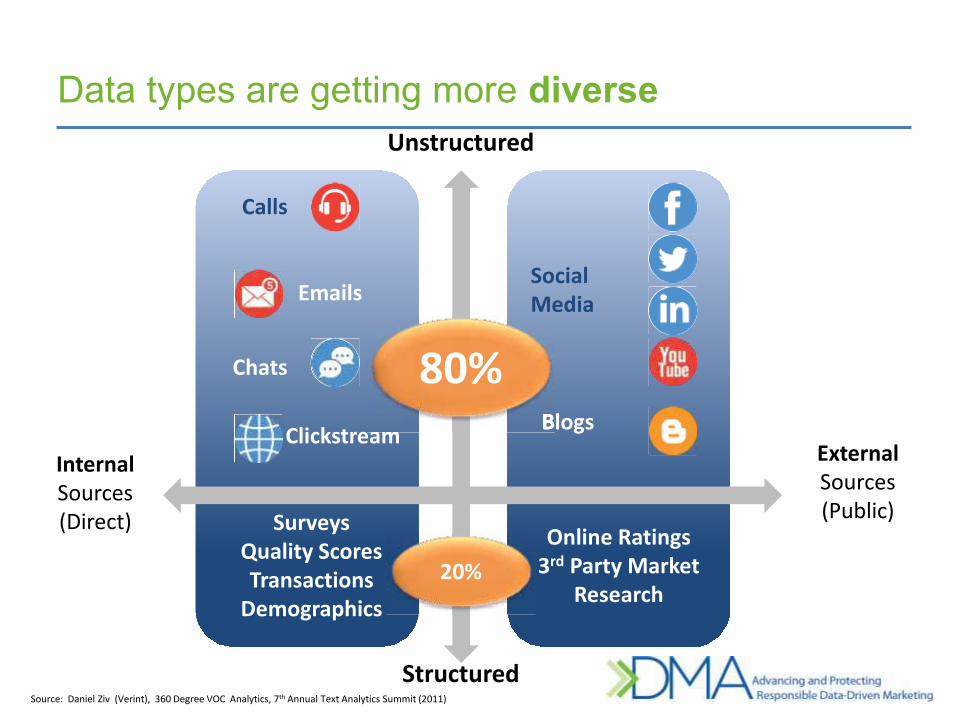
Calls
Chats
Emails Social Media
Blogs
Online Ratings 3rd Party Market
Research
Surveys Quality Scores Transactions
Demographics
Clickstream Internal Sources (Direct)
External Sources (Public)
Unstructured
Structured
BlogsClickstream
80%
20%
Source: Daniel Ziv (Verint), 360 Degree VOC Analytics, 7th Annual Text Analytics Summit (2011)
Data types are getting more diverse
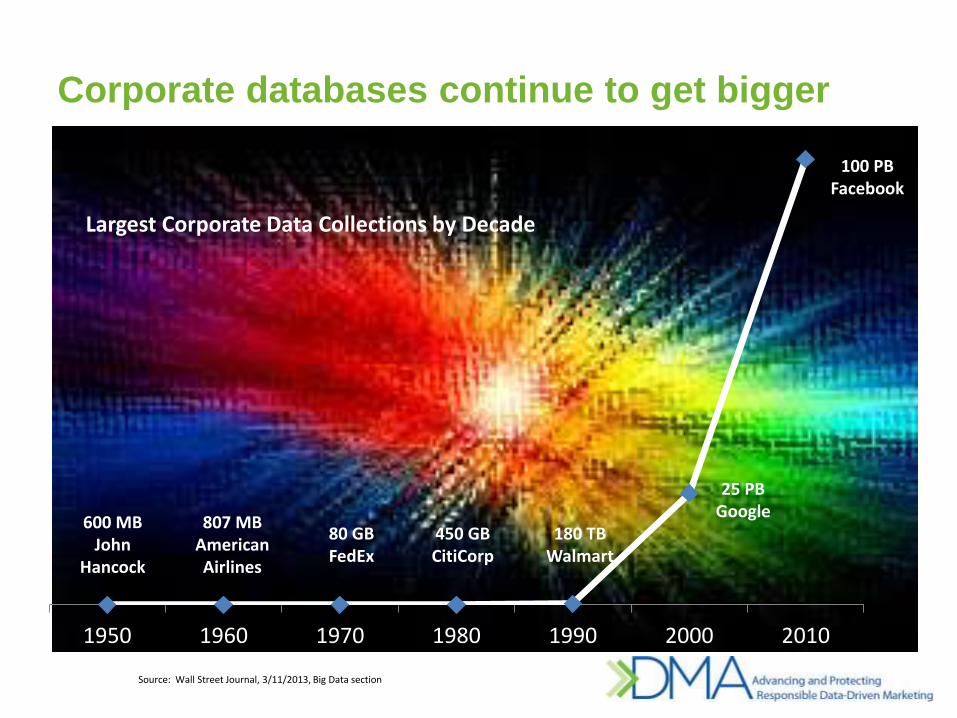
1950 1960 1970 1980 1990 2000 2010
600 MB John
Hancock
80 GB FedEx
180 TB Walmart
25 PB Google
100 PB Facebook
807 MB American Airlines
450 GB CitiCorp
Largest Corporate Data Collections by Decade
Source: Wall Street Journal, 3/11/2013, Big Data section
Corporate databases continue to get bigger

Organizations believe in potential of analytics
83% increase in spending on marketing analytics by 2018
6.4%
11.7%
2015
2018
Contribution of analytics remains low and is not improving
…but the reality is
CMOs are struggling to see the immediate value
Low (1)
High (7)
(3.2)
Low (1)
High (7)
Source: Ad Age (2014 study by McKinsey, Duke University, and the AMA) http://www.cmosurvey.org/results

Extract and process large amounts of data
Visualize information
Uncover hidden patterns and relationships
Discern meaning
BIG DATA ANALYTICS
Therefore, we need to be smarter in how we
Enable superior business outcomes

Bringing unstructured data to traditional analytic framework
Social Network Analysis (SNA) Text Mining/ Analysis
BIG DATA ANALYTICS
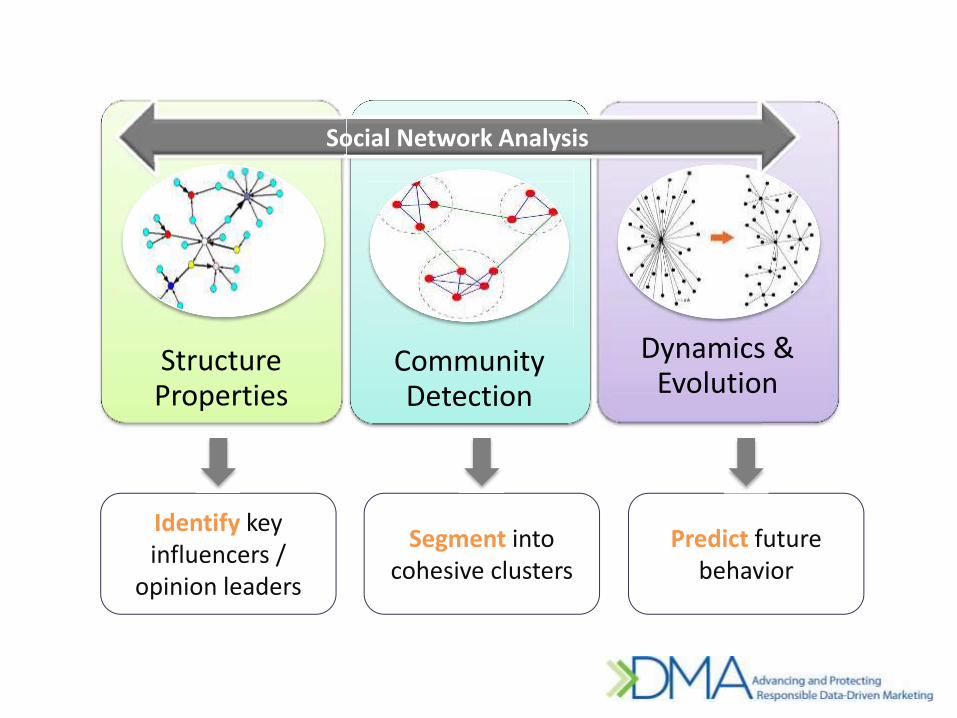
Structure Properties
Community Detection
Dynamics & Evolution
Identify key influencers /
opinion leaders
Segment into cohesive clusters
Predict future behavior
Social Network Analysis
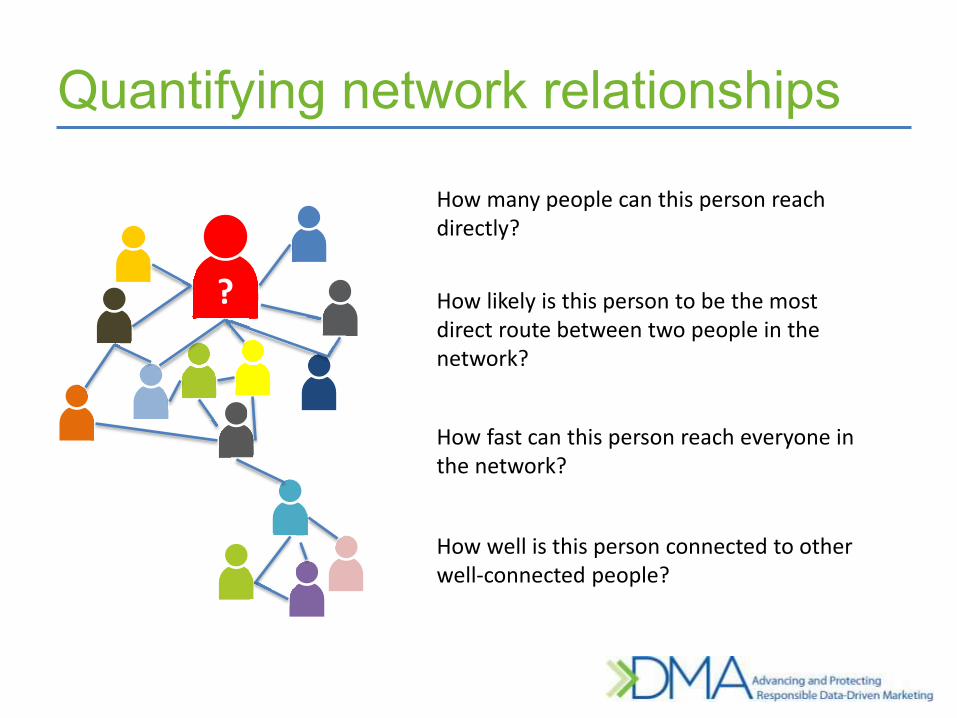
How many people can this person reach directly?
How likely is this person to be the most direct route between two people in the network?
How fast can this person reach everyone in the network?
How well is this person connected to other well-connected people?
?
Quantifying network relationships
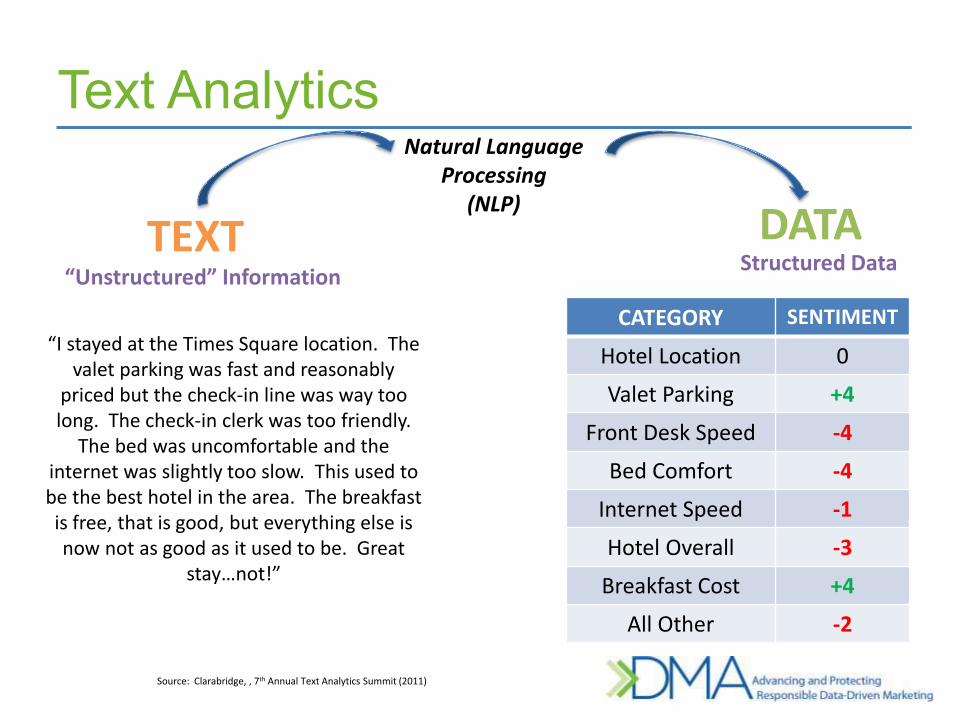
TEXT DATA
Natural Language Processing
(NLP)
“Unstructured” Information Structured Data
“I stayed at the Times Square location. The valet parking was fast and reasonably
priced but the check-in line was way too long. The check-in clerk was too friendly.
The bed was uncomfortable and the internet was slightly too slow. This used to be the best hotel in the area. The breakfast is free, that is good, but everything else is now not as good as it used to be. Great
stay…not!”
CATEGORY SENTIMENT
Hotel Location 0
Valet Parking +4
Front Desk Speed -4
Bed Comfort -4
Internet Speed -1
Hotel Overall -3
Breakfast Cost +4
All Other -2
Source: Clarabridge, , 7th Annual Text Analytics Summit (2011)
Text Analytics
PHARMA CASE STUDY
Enhancing physician targeting through physician network analysis
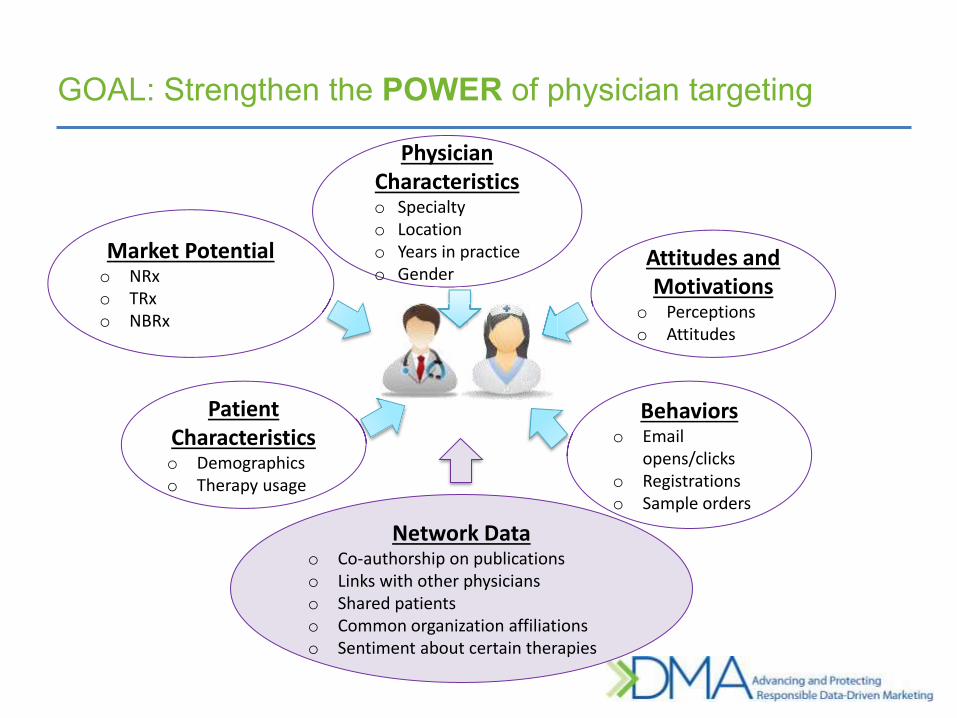
Physician Characteristics o Specialty o Location o Years in practice o Gender
Market Potential o NRx o TRx o NBRx
Attitudes and Motivations
o Perceptions o Attitudes
Behaviors o Email
opens/clicks o Registrations o Sample orders
Patient Characteristics o Demographics o Therapy usage
Network Data o Co-authorship on publications o Links with other physicians o Shared patients o Common organization affiliations o Sentiment about certain therapies
GOAL: Strengthen the POWER of physician targeting
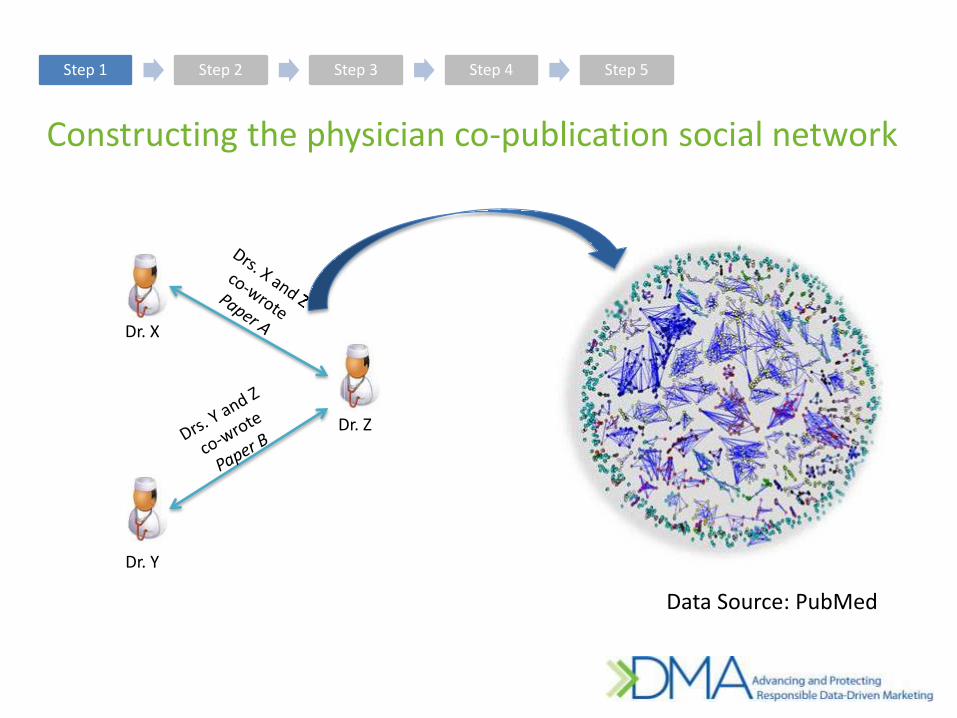
Constructing the physician co-publication social network
Step 1 Step 2 Step 3 Step 4 Step 5
Data Source: PubMed
Dr. Z
Dr. Y
Dr. X
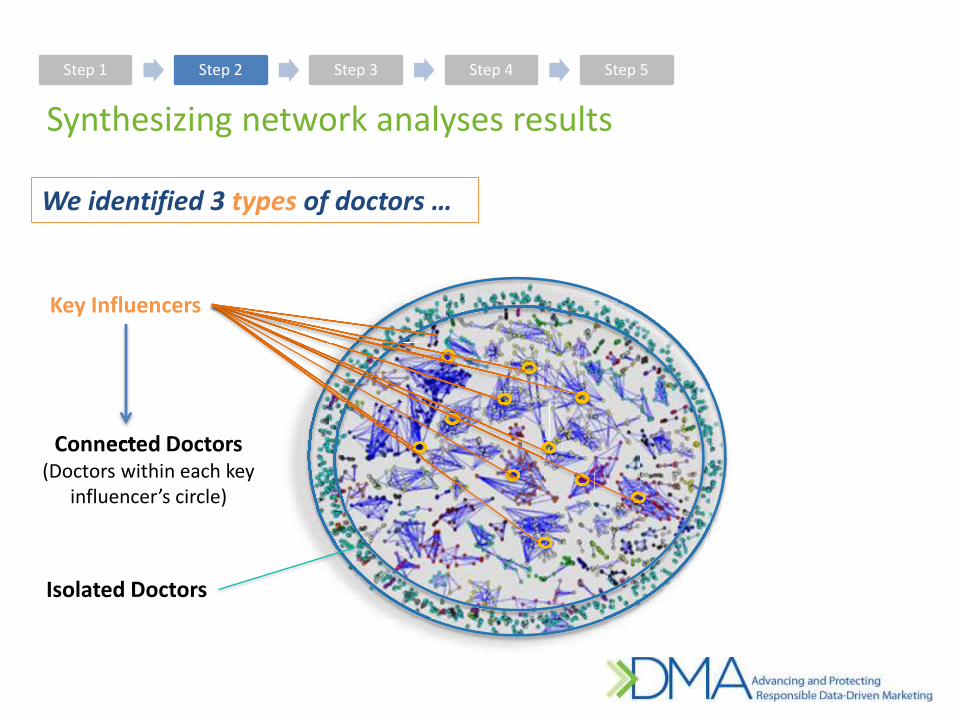
Synthesizing network analyses results Step 1 Step 2 Step 3 Step 4 Step 5
We identified 3 types of doctors …
Key Influencers
Connected Doctors (Doctors within each key
influencer’s circle)
Isolated Doctors
Connected Doctors
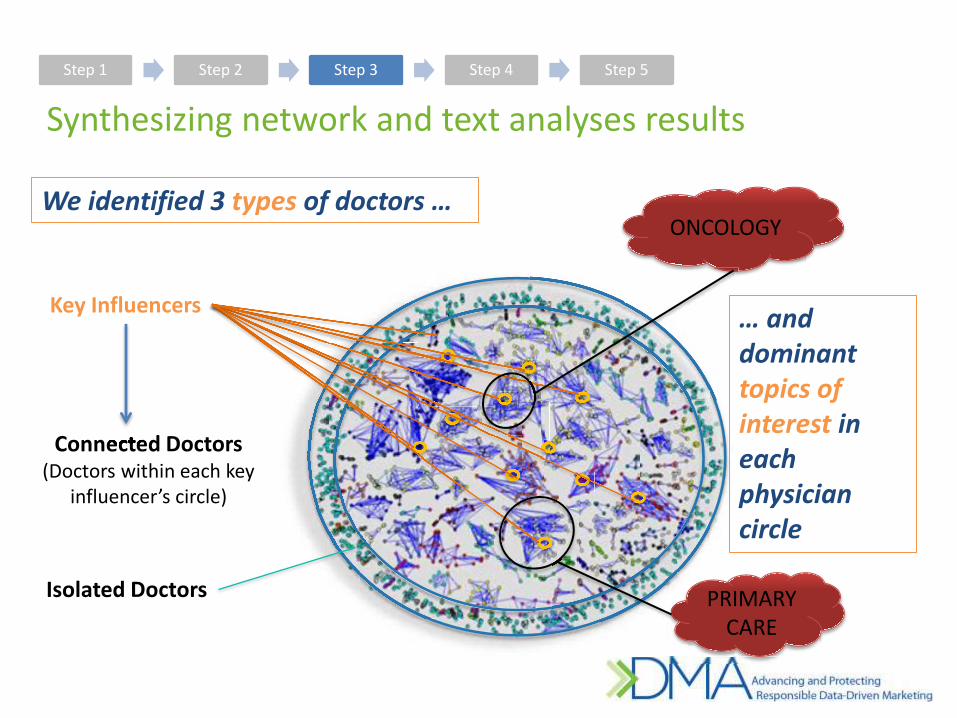
Synthesizing network and text analyses results Step 1 Step 2 Step 3 Step 4 Step 5
We identified 3 types of doctors …
Key Influencers
Connected Doctors (Doctors within each key
influencer’s circle)
Isolated Doctors
Connected Doctors
ONCOLOGY
PRIMARY CARE
… and dominant topics of interest in each physician circle
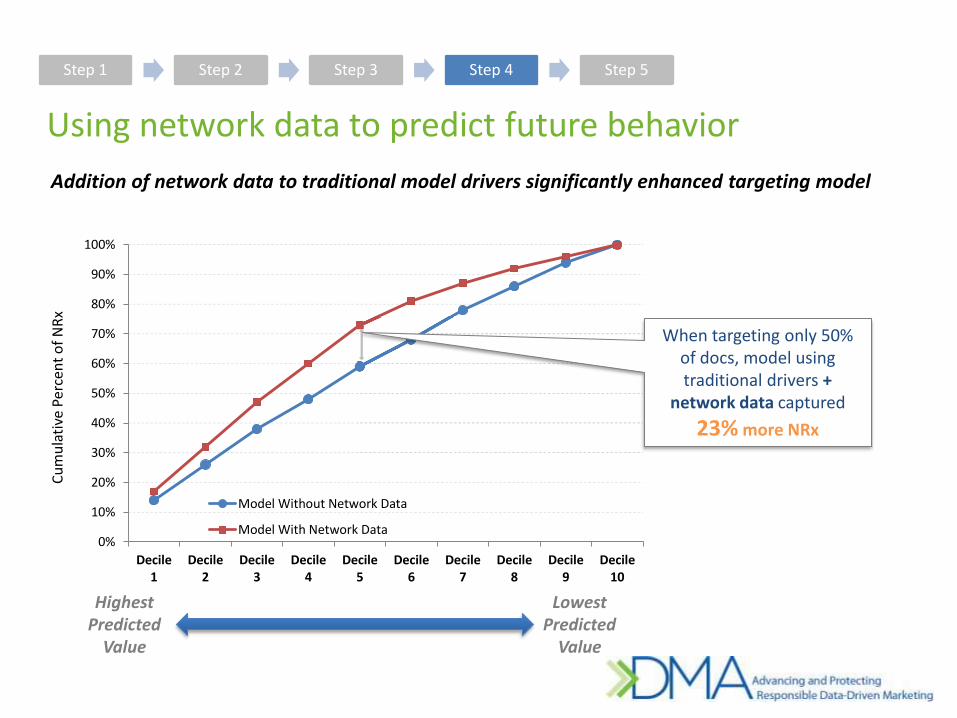
Using network data to predict future behavior
Step 1 Step 2 Step 3 Step 4 Step 5
Addition of network data to traditional model drivers significantly enhanced targeting model
0%
10%
20%
30%
40%
50%
60%
70%
80%
90%
100%
Decile1
Decile2
Decile3
Decile4
Decile5
Decile6
Decile7
Decile8
Decile9
Decile10
Cum
ulat
ive
Perc
ent o
f NRx
Model Without Network Data
Model With Network Data
Highest Predicted
Value
Lowest Predicted
Value
When targeting only 50% of docs, model using traditional drivers +
network data captured 23% more NRx
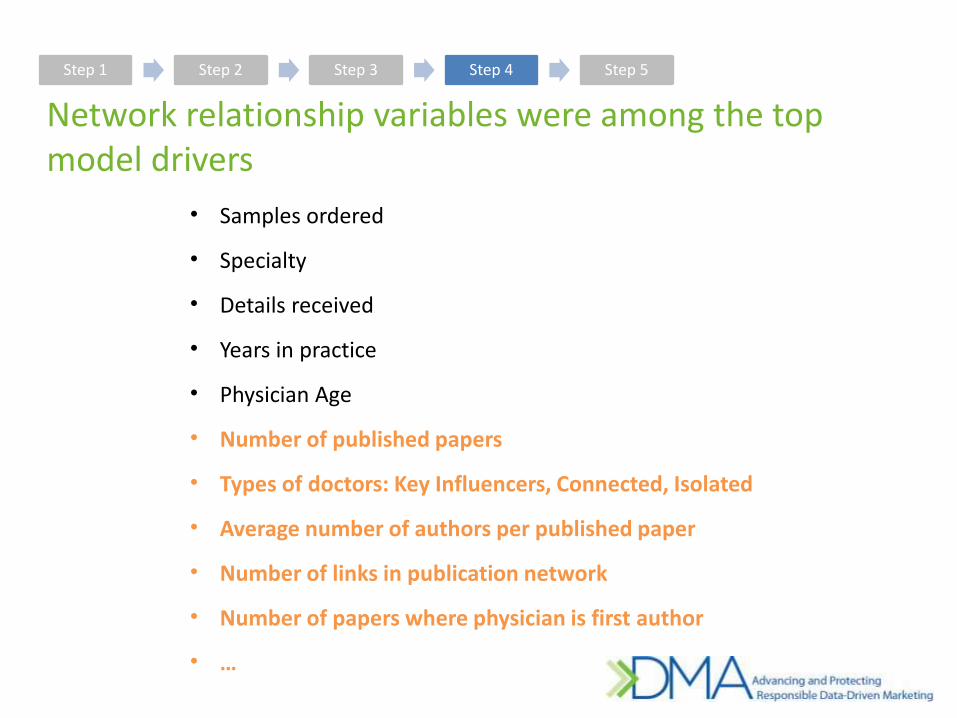
Network relationship variables were among the top model drivers
Step 1 Step 2 Step 3 Step 4 Step 5
• Samples ordered
• Specialty
• Details received
• Years in practice
• Physician Age
• Number of published papers
• Types of doctors: Key Influencers, Connected, Isolated
• Average number of authors per published paper
• Number of links in publication network
• Number of papers where physician is first author
• …
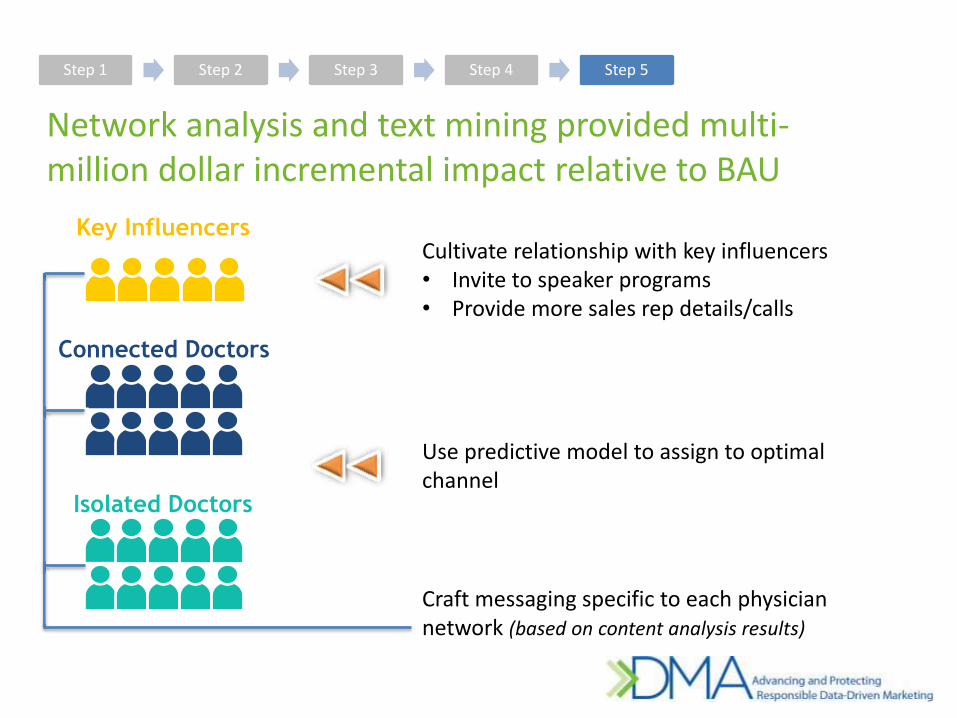
Network analysis and text mining provided multi-million dollar incremental impact relative to BAU
Step 1 Step 2 Step 3 Step 4 Step 5
Key Influencers
Connected Doctors
Isolated Doctors
Cultivate relationship with key influencers • Invite to speaker programs • Provide more sales rep details/calls
Use predictive model to assign to optimal channel
Craft messaging specific to each physician network (based on content analysis results)

HOSPITALITY CASE STUDY
Greater customer insight through social media behavior and offline data A Proof of Concept for leading hotel chain
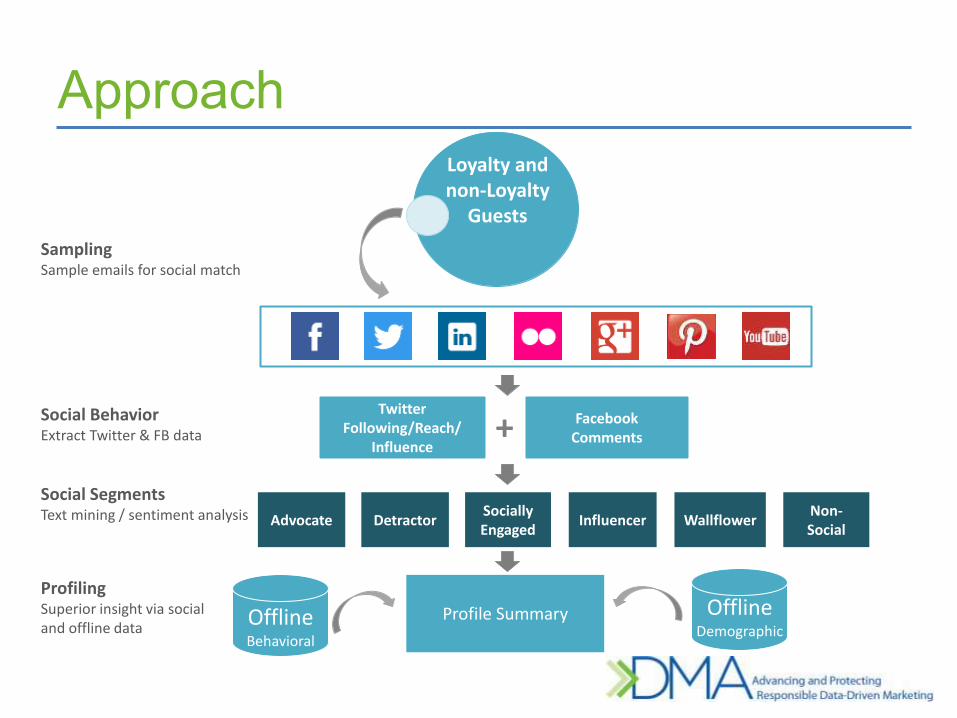
Sampling Sample emails for social match
Social Segments Text mining / sentiment analysis
Social Behavior Extract Twitter & FB data
Loyalty and non-Loyalty
Guests
Profile Summary
Offline Behavioral
Offline Demographic
Advocate Detractor Socially Engaged Influencer Wallflower Non-
Social
Twitter Following/Reach/
Influence
Facebook Comments +
Profiling Superior insight via social and offline data
Approach
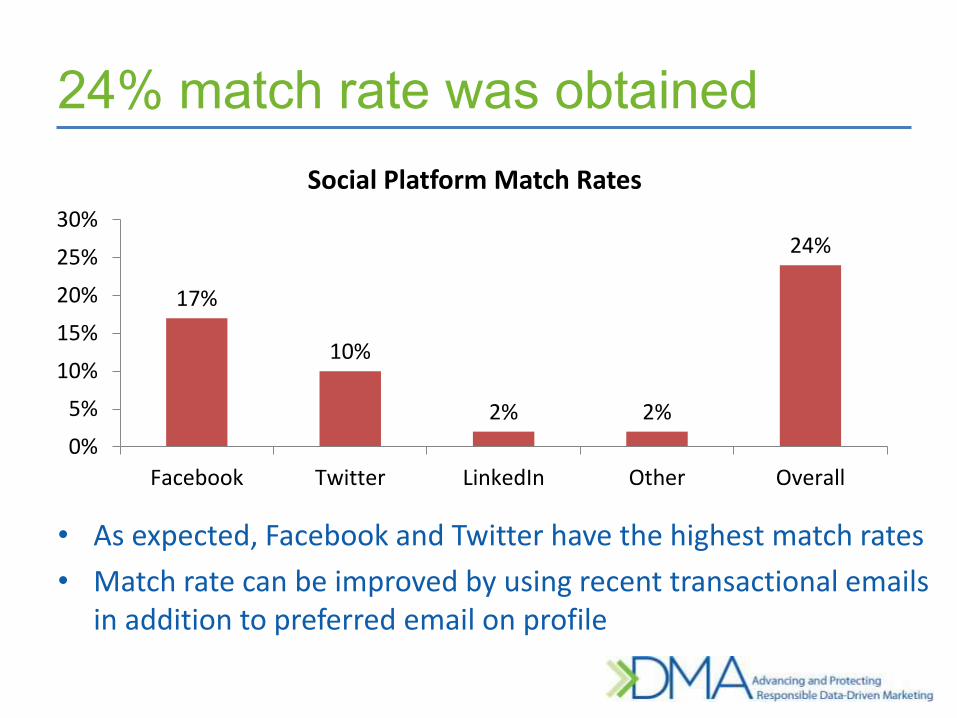
24% match rate was obtained
17%
10%
2% 2%
24%
0%5%
10%15%20%25%30%
Facebook Twitter LinkedIn Other Overall
Social Platform Match Rates
• As expected, Facebook and Twitter have the highest match rates • Match rate can be improved by using recent transactional emails
in addition to preferred email on profile
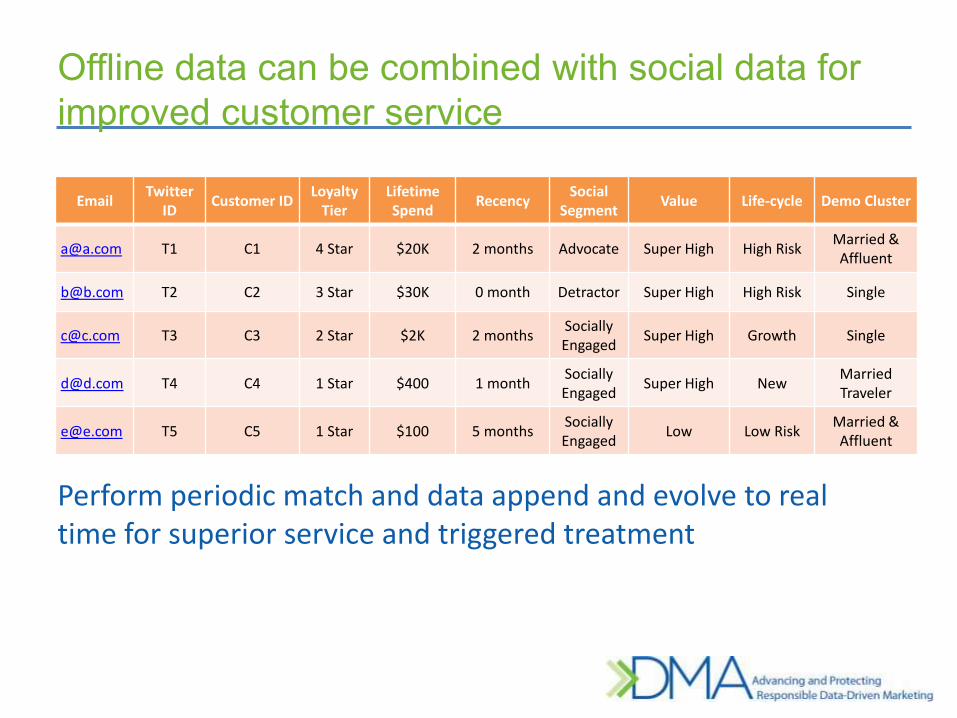
Offline data can be combined with social data for improved customer service
Perform periodic match and data append and evolve to real time for superior service and triggered treatment
Email Twitter ID Customer ID Loyalty
Tier Lifetime Spend Recency Social
Segment Value Life-cycle Demo Cluster
[email protected] T1 C1 4 Star $20K 2 months Advocate Super High High Risk Married & Affluent
[email protected] T2 C2 3 Star $30K 0 month Detractor Super High High Risk Single
[email protected] T3 C3 2 Star $2K 2 months Socially Engaged Super High Growth Single
[email protected] T4 C4 1 Star $400 1 month Socially Engaged Super High New Married
Traveler
[email protected] T5 C5 1 Star $100 5 months Socially Engaged Low Low Risk Married &
Affluent
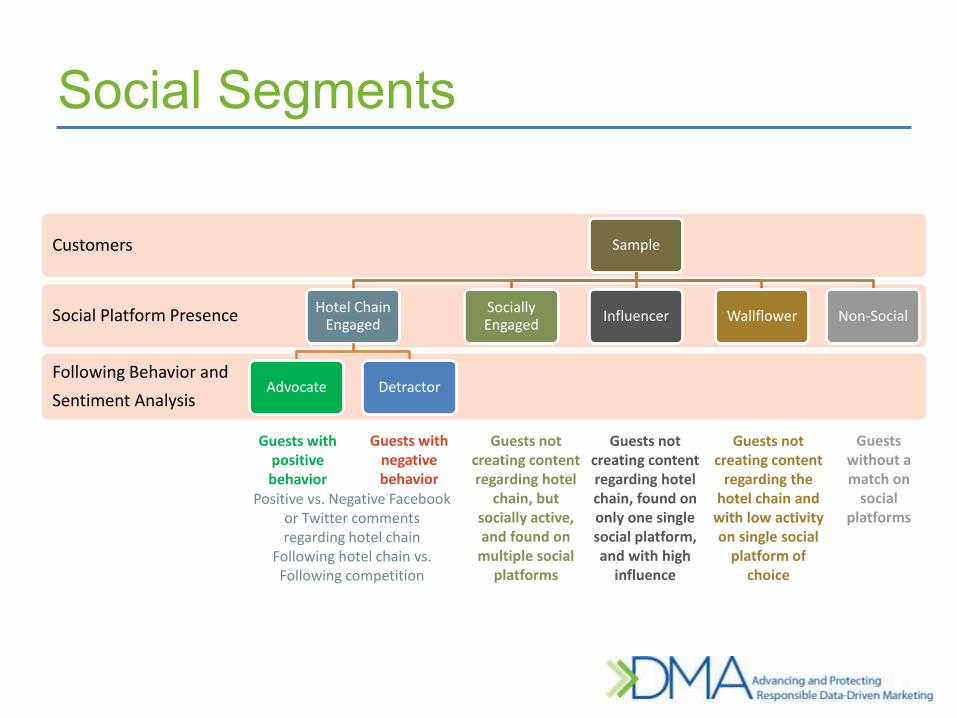
Following Behavior and Sentiment Analysis
Social Platform Presence
Customers Sample
Hotel Chain Engaged
Advocate Detractor
Socially Engaged Influencer Wallflower Non-Social
Guests with positive behavior
Guests with negative behavior
Positive vs. Negative Facebook or Twitter comments regarding hotel chain
Following hotel chain vs. Following competition
Guests not creating content regarding hotel
chain, but socially active, and found on
multiple social platforms
Guests not creating content regarding hotel chain, found on only one single social platform, and with high
influence
Guests not creating content
regarding the hotel chain and
with low activity on single social
platform of choice
Guests without a match on
social platforms
Social Segments
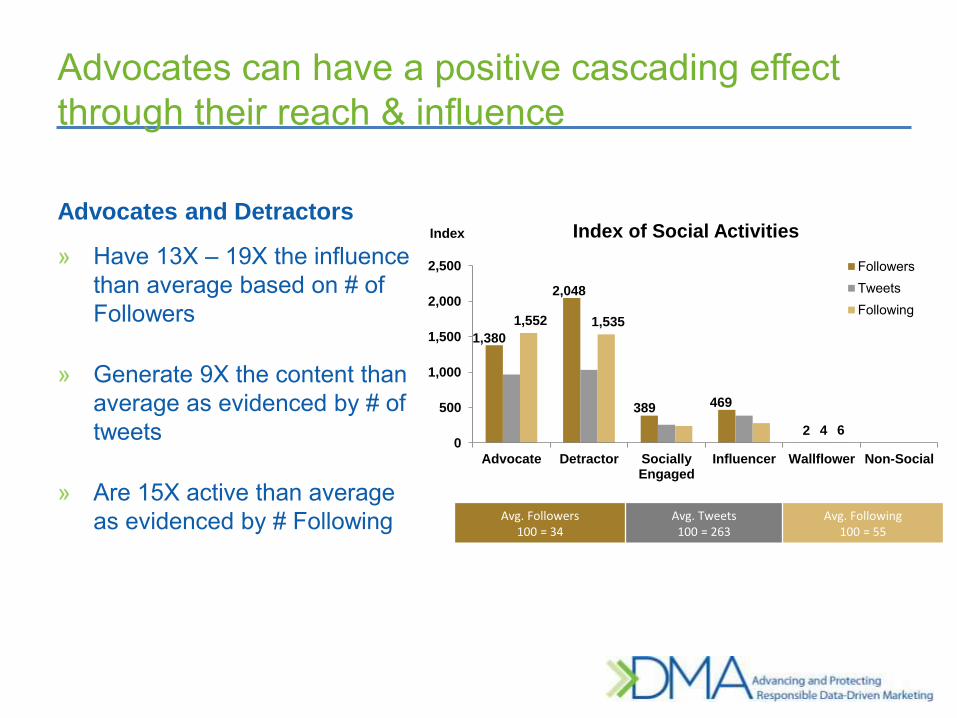
Advocates and Detractors
» Have 13X – 19X the influence than average based on # of Followers
» Generate 9X the content than average as evidenced by # of tweets
» Are 15X active than average as evidenced by # Following
Advocates can have a positive cascading effect through their reach & influence
Avg. Followers 100 = 34
Avg. Tweets 100 = 263
Avg. Following 100 = 55
1,380
2,048
389 469
2 4
1,552 1,535
6 0
500
1,000
1,500
2,000
2,500
Advocate Detractor SociallyEngaged
Influencer Wallflower Non-Social
Index Index of Social Activities
FollowersTweetsFollowing
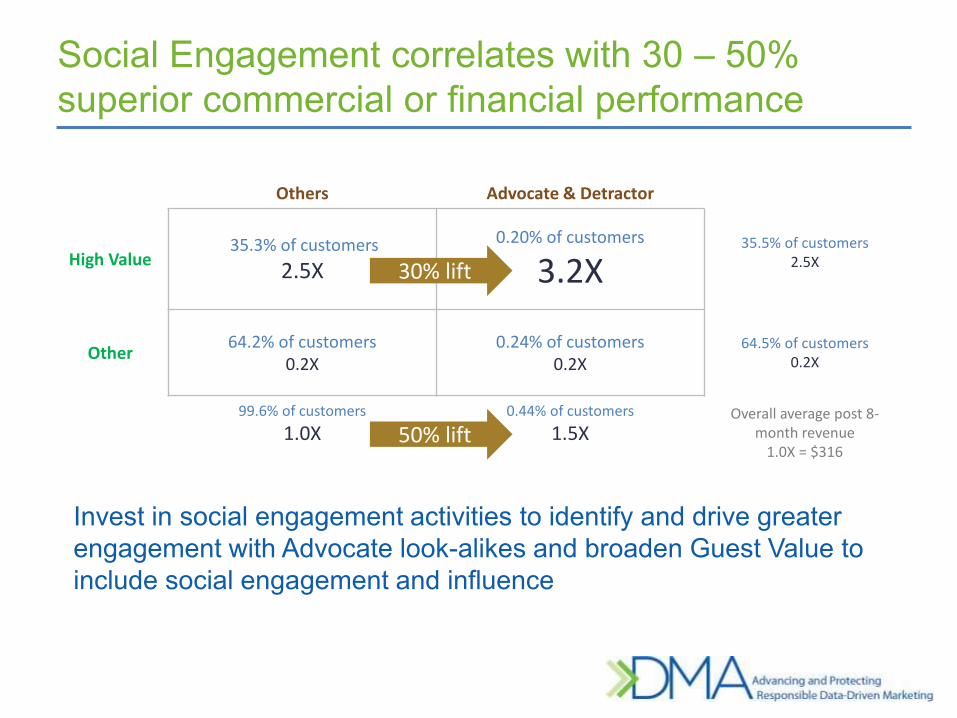
Social Engagement correlates with 30 – 50% superior commercial or financial performance
Invest in social engagement activities to identify and drive greater engagement with Advocate look-alikes and broaden Guest Value to include social engagement and influence
Others Advocate & Detractor
High Value 35.3% of customers
2.5X 0.20% of customers
3.2X
35.5% of customers 2.5X
Other 64.2% of customers 0.2X
0.24% of customers 0.2X
64.5% of customers
0.2X
99.6% of customers 1.0X
0.44% of customers 1.5X
Overall average post 8- month revenue
1.0X = $316
30% lift
50% lift

Advocates comprise of 3 demographic segments
% Married 84% 78% 31% 59% 64% % with Children 70% 63% 28% 49% 47% HH Size 3.7 3.7 1.6 2.8 2.8 % Age 45+ 64% 67% 32% 50% 62% % Male 63% 53% 39% 50% 50% % College or Higher 60% 43% 49% 52% 50%
%High Travel Occupation 38% 63% 7% 29% 31% Average Income $156,533 $103,181 $80,835 $110,808 $117,112 Average Networth $679K $448K $170K $398K $477K
Advocate
Married & Affluent
33%
Married Travelers
21%
Small HHs 46%
All Segments Hotel Chain
Advocate Segment

Advocates comprise of 4 behavioral segments
Full Service % 75% 43% 18% 66% 57% 54% Focused % 15% 56% 82% 31% 38% 43% Luxury % 10% 1% 0% 2% 5% 3%
Business % 62% 78% 69% 60% 68% 67% Leisure % 15% 11% 15% 20% 14% 13%
Advocate
Focused 27%
Economy 7%
Variety 34%
Full Svc 32%
All Segments Hotel Chain
Advocate Segment
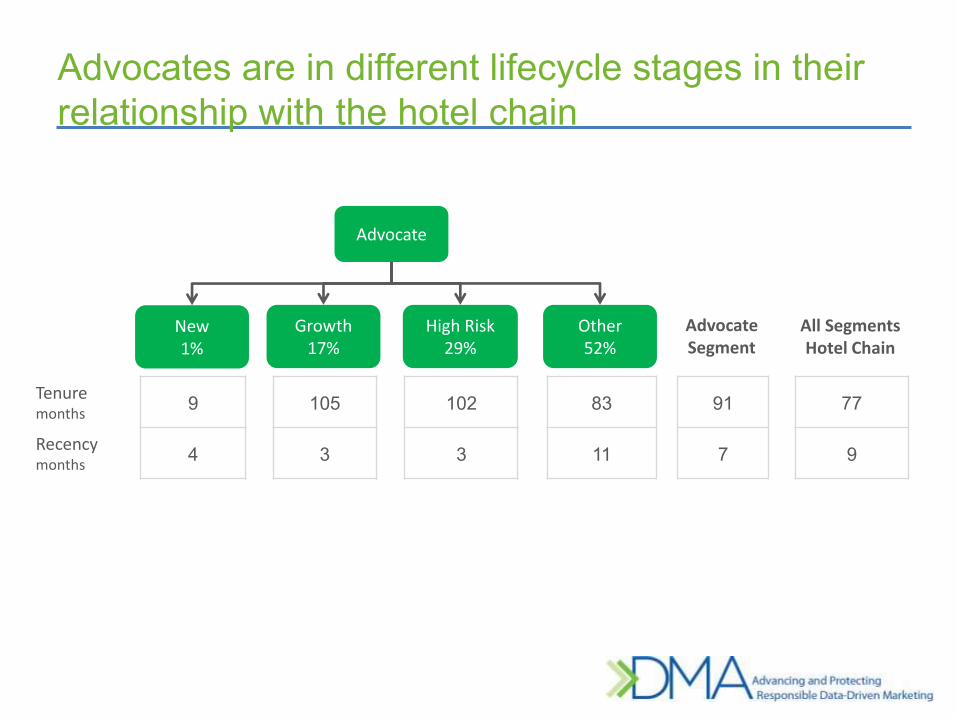
Advocates are in different lifecycle stages in their relationship with the hotel chain
Tenure months 9 105 102 83 91 77
Recency months 4 3 3 11 7 9
Advocate
Growth 17%
High Risk 29%
Other 52%
New 1%
All Segments Hotel Chain
Advocate Segment

Summary Findings Recommendations Benefits
24% match rate was obtained Improve match rate through usage of recent transactional emails
Greater insight and improved social engagement of higher tier guests
Offline data can be combined with social data for improved service
Perform periodic match and data append and evolve to real time
Superior service and greater relevance via triggered treatment
Guests that socially engage with the hotel chain are ~30 - 50% more valuable
Invest in social engagement activities and broaden Guest Value to include social engagement and influence
Greater insight and improved engagement
Deeper insight was generated by leveraging both social & offline data
Perform analysis on a monthly or quarterly basis
Longitudinal tracking, trigger identification, and informed social & CRM strategy
Social behavior data continues to be relatively sparse
Broaden scope to include all guests with email; leverage network analysis and predictive models
Greater insight and scale for superior commercial performance
1
2
3
4
5
CONCLUSIONS

Analytics to harness the potential of Big Data
» Text Mining
» Network Analysis
» Holistic Insight
• Big Data + Little Data
• Online Data + Offline Data
» Balance of hard and soft skills
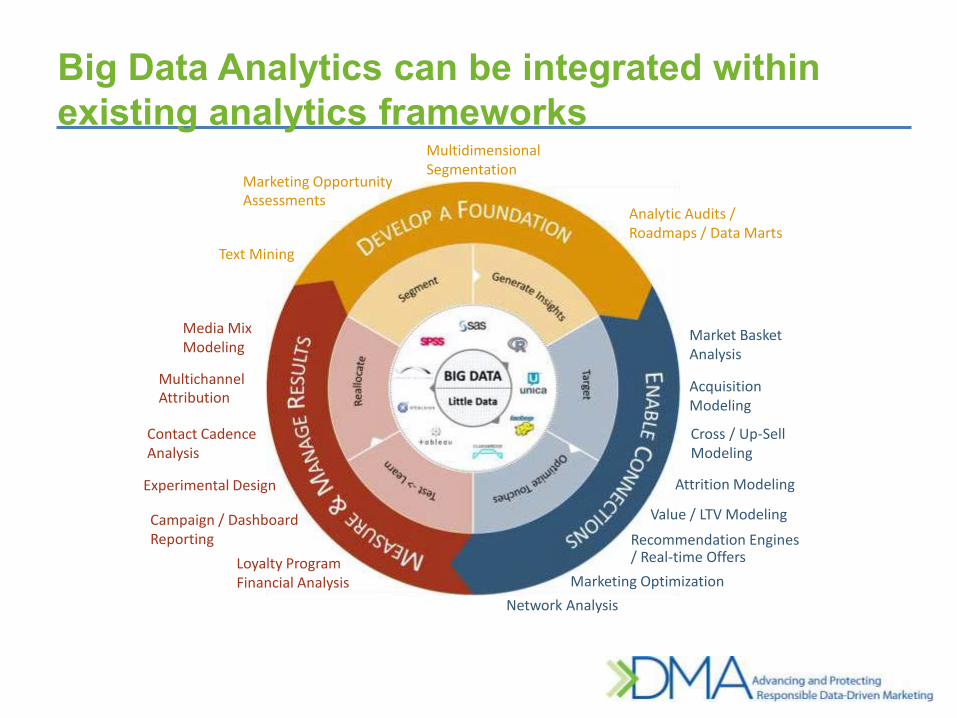
Big Data Analytics can be integrated within existing analytics frameworks
Multidimensional Segmentation
Marketing Opportunity Assessments
Text Mining
Analytic Audits / Roadmaps / Data Marts
Acquisition Modeling
Attrition Modeling
Market Basket Analysis
Cross / Up-Sell Modeling
Value / LTV Modeling Recommendation Engines / Real-time Offers
Marketing Optimization
Media Mix Modeling
Campaign / Dashboard Reporting
Experimental Design
Loyalty Program Financial Analysis
Multichannel Attribution
Contact Cadence Analysis
Network Analysis
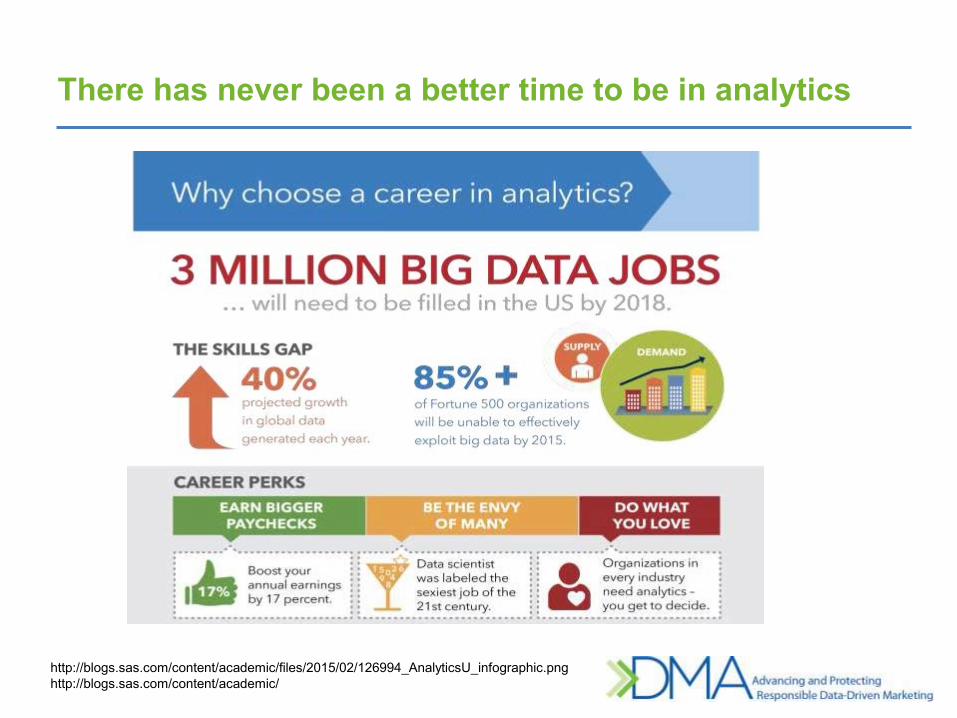
There has never been a better time to be in analytics
http://blogs.sas.com/content/academic/files/2015/02/126994_AnalyticsU_infographic.png http://blogs.sas.com/content/academic/
Your turn
Use the Chat function or Raise Hand feature to ask questions or share comments.
Continue the conversation:
» Linked In: Official DMA - the Analytics-CRM Community Group
» Twitter: @DMA_USA #dmacommunities
Analytics-CRM Community Updates 2015 Analytics Journal is now available both as a link
or printed copy! Find more resources at: www.thedma.org/acc
We welcome your ideas: Suggest topics: [email protected] Participate in the planning of projects Connect with more Communities: www.thedma.org
THANK YOU FOR ATTENDING