integrated mirna-mrna expression profiles revealing key
TRANSCRIPT

HindawiBioMed Research InternationalVolume 2021, Article ID 6673655, 11 pageshttps://doi.org/10.1155/2021/6673655
Research ArticleIntegrated miRNA-mRNA Expression Profiles Revealing KeyMolecules in Ovarian Cancer Based on Bioinformatics Analysis
Chao Li , Zhantong Hong, Miaoling Ou, Xiaodan Zhu, Linghua Zhang, and Xingkun Yang
Department of Obstetrics Laboratory, Foshan Women and Children Hospital Affiliated to Southern Medical University, Foshan,Guangdong 528000, China
Correspondence should be addressed to Chao Li; [email protected]
Received 28 December 2020; Revised 24 August 2021; Accepted 25 September 2021; Published 25 October 2021
Academic Editor: Wittaya Chaiwangyen
Copyright © 2021 Chao Li et al. This is an open access article distributed under the Creative Commons Attribution License, whichpermits unrestricted use, distribution, and reproduction in any medium, provided the original work is properly cited.
Ovarian cancer is one of the leading causes of gynecological malignancy-related deaths. The underlying molecular developmentmechanism has however not been elucidated. In this study, we used bioinformatics to reveal critical molecular and biologicalprocesses associated with ovarian cancer. The microarray datasets of miRNA and mRNA expression profiles were downloadedfrom the Gene Expression Omnibus (GEO) database. Besides, we performed target prediction of the identified differentiallyexpressed miRNAs. The overlapped differentially expressed genes (DEGs) were obtained combined with miRNA targetspredicted and the DEGs identified from the mRNA dataset. The Cytoscape software was used to design a regulatory networkof miRNA-gene. Moreover, the overlapped DEGs in the network were subjected to enrichment analysis to explore theassociated biological processes. The molecular protein-protein interaction (PPI) network was used to identify the key genesamong the DEGs of prognostic value for ovarian cancer, and the genes were evaluated via Kaplan-Meier curve analysis. A totalof 186 overlapped DEGs were identified. Through miRNA-gene network analysis, we found that miR-195-5p, miR-424-5p, andmiR-497-5p highly exhibited targeted association with overlapped DEGs. The three miRNAs are critical in the regulatorynetwork and act as tumor suppressors. The overlapped DEGs were mainly associated with protein metabolism, histogenesis,and development of the reproductive system and ocular tissues. The PPI network identified 10 vital genes that promote tumorprogression. Survival analysis found that CEP55 and CCNE1 may be associated with the prognosis of ovarian cancer. Thesefindings provide insights to understand the pathogenesis of ovarian cancer and suggest new candidate biomarkers for earlyscreening of ovarian cancer.
1. Introduction
Ovarian cancer is one of the leading causes of deaths result-ing from gynecological malignancies. The latest statisticsindicate that about 295,414 new cases of ovarian cancer werereported globally in 2018 [1]. The overall 5-year survival rateof ovarian cancer is below 45% mainly because distantmetastasis occurs earlier before diagnosis. Biomarkers suchas CA125 are currently in clinical use; however, they areunspecific, and ultrasound examinations cannot identifyearly cases [2, 3]. Therefore, there is an urgent need to reex-cavate new diagnosed biomarkers for ovarian cancer andreidentify the associated key molecules. This will be vital indevising strategies to manage ovarian cancer at preventionand control levels.
In recent years, the extensive application of expressionprofiles has accumulated enormous omics data, which isdependent on in-depth interpretation. Following relevantresearches in the past three years, a few reports on the useof expression profiles linked with bioinformatics to discoverkey genes of ovarian cancer have been published [4–7].However, most of the research groups selected similarmicroarray profiles thereby may cause lower accuracy andgave false-positive results. The miRNAs are noncodingRNAs that bound to complementary sequences in themRNA via base pairing. This promotes mRNA silencingand negatively regulates downstream gene expression [8].Many studies have found that miRNA disorders can occurin nearly all types of tumors thereby affecting target geneexpression [9, 10]. A number of studies have evaluated that

–5 0 5
LogFC
3.0
2.5
2.0
1.5
1.0
0.5
0.0
–Log
10 (a
dj.p
.val
)
Volcano
(a)
4
3
2
1
0–5 0 5
LogFC
–Log
10 (a
dj.p
.val
)
Volcano
(b)
Figure 1: Volcanic map distribution of differential expression: (a) differentially expressed miRNA map; (b) differentially expressed genemap. Horizontal axis: log2(FC); vertical axis: -log10(adj.P.Val). The FC represents the fold change in expression of tumor samplescompared to normal samples, and the adj.P.Val represents the calibrated p value. Green color indicates that differential expression isdownregulated; red color indicates that differential expression is upregulated.
Figure 2: The regulation network of miRNA-gene. The ovalsrepresent differential target genes; the triangles representdifferential miRNAs; the lines represent the existence of targetedregulatory relationships. The red color shows upregulation whilethe green color shows downregulation.
2 BioMed Research International
miRNA expression profiles in patients with ovarian cancercan be used as molecular markers of malignant tumors.Functional experiments related to ovarian cancer have con-firmed that many miRNAs have cancer-promoting or anti-tumor effects, and miRNAs can inhibit the translationprocess of target mRNAs to participate in the regulation ofmany cell processes related to ovarian cancer [11–13].
Therefore, our study adopted integrated miRNA andmRNA microarray expression profiles for joint analysis.Through bioinformatics, we constructed regulatory net-works to identify key molecules and biological processesassociated with ovarian cancer. This provides a scientificand accurate theoretical basis to elucidate the mechanismof ovarian cancer onset.
2. Materials and Methods
2.1. Data Sources. We searched for the microarray expres-sion profiles of ovarian cancer in the GEO (a public func-tional genomics database) by limiting the sample size tomore than 10 and compared tumor tissue with normal tissuefor the experiment type. GSE83693 and GSE36668 were thetwo eligible profile datasets. The former was a miRNA pro-file that included 4 normal tissues and 16 tumor tissueswhereas the latter was an mRNA profile that included 4 nor-mal tissues and 8 tumor tissues.
2.2. Data Processing
2.2.1. Differential Expression. For the mRNA dataset, theprobe ID was converted to the corresponding gene name fol-lowing its platform annotation file. The “limma” package ofR language was used to analyze the DEGs [14], where adj:p:val < 0:05 and the absolute value of log2FC > 2 weredefined as a statistically significant expression. Further, weused the R package “http://org.Hs.eg.db/” to convert thegene name to the corresponding gene ID [15] and eventually
performed the subsequent enrichment analysis. The miRNAdataset was processed using the same method and standard.
2.2.2. miRNA Target Prediction. The Funrich software 3.1.3was used to predict the downstream targets of the identifieddifferentially expressed miRNAs [16]. The predicted genelist was intersected with the DEGs identified from themRNA dataset. Thus, the overlapped DEGs were generatedfor subsequent regulatory networks, used to identify thekey genes, and for functional enrichment analysis and so on.
2.2.3. Regulatory Network. The miRNAs negatively regulatetarget genes; therefore, the combinations of matching

Table 1: Function of the top 10 key genes at the hub core of the PPI network.
No Gene Full name Gene functions
1 TTK TTK protein kinaseRelated to cell proliferation, encoding key protein for mitotic checkpoints. Abnormal mitoticspindles are produced when expression is abnormal, resulting in tumor occurring possibly.
2 CEP55centrosomal protein
55Playing roles in mitosis and cytokinesis. Related pathways include DNA damage and cytoskeleton
signaling.
3 KIT KIT proto-oncogeneEncoded protein is a type III transmembrane receptor; genetic variation is related to
gastrointestinal stromal tumors and mast cells.
4 DTLdenticleless E3
ubiquitin proteinThe homologue of E3 ubiquitin protein ligase, which maybe degrade PDCD4 and promote tumor
development. It may be a therapeutic target for ovarian epithelial cancer.
5 E2F8E2F transcription
factor 8A member of family encoding transcription factors, which regulate cell cycle-related gene
expression and is involved in the promotion of a variety of tumors
6 SOX9SRY-box transcription
factor 9Participated in identifying specific sequences. Related to bone deformity, nodular atypical
hyperplasia and other diseases.
7 ERCC6L excision repair 6 likeMembers of family encoding protein belong to DNA transport enzymes and are necessary genes
for mitotic sister chromatid isolation; involved in cell proliferation.
8 KIF18Bkinesin family member
18BA member of the kinetin family, which constitutes the main positive end of microtubule
depolymerization in mitotic cells, ensuring that the spindle is centered.
9 THY1Thy-1 cell surface
antigenEncoding cell surface glycoproteins and proteins, involving in adhesion and communication of
multiple cell types, which promotes nasopharyngeal carcinoma.
10 CCNE1 cyclin E1Encoded protein belongs to cell cycle family. Overexpression of gene is observed in many tumors,
causing chromosomal instability and may promote tumorigenesis.
Note: The annotations in this table referred to the clear conclusions in NCBI (https://www.ncbi.nlm.nih.gov/gene), and relevant scattered reports weren’tincluded in a single literature.
SOX9 KIF18B
ERCC6L
KIT
TTK
CEP55
E2F8DTL
CCNE1
THY1
Figure 3: Identifying the key DEGs. When the red color appearsdarker, a higher score is noted, indicating a highly significantbiometric significance.
3BioMed Research International
miRNA-gene were screened to construct regulatory networksand were visualized using the Cytoscape 3.7.1 software.
2.2.4. Key Genes. The string database was used to predict theinteraction network between proteins encoded by the DEGs[17]. Then, the cytohubba module in the Cytoscape softwarewas used to identify key genes [18]; here, the source dataobtained from the network file was generated via the stringdatabase. The MCC algorithm of the module was selectedto identify the top 10 key genes.
2.2.5. Functional Enrichment Analysis. The R package “clus-terProfiler” was used to perform the GO and KEGG enrich-ment annotation of the overlapped DEGs [15]. GOannotation was grouped into three subcategories: molecularfunction (MF), biological process (BP), and cellular compo-nents (CC). KEGG is a comprehensive database that inte-grates genomic, chemical knowledge, and systemfunctional information, which we used for enrichmentannotation of gene pathways. The p value cutoff = 0:05 ofthe R package’s parameter was considered statisticallysignificant.
2.2.6. Subsistence Analysis. The TCGA database aided in thediagnosis, treatment, and prevention of tumors through ashared mechanism. The cbioportal is a visual analytics plat-form developed based on the TCGA. To further evaluate thepathogenesis of key genes we obtained, the cbioportal wasadopted to identify the association of key genes with the sur-vival prognosis of ovarian cancer [19].
2.2.7. Expression Level Verification. GEPIA2 is an updatedversion of GEPIA for analyzing the RNA sequencing expres-
sion data of 9,736 tumors and 8,587 normal samples fromthe TCGA and the GTEx projects, using a standard process-ing pipeline [20]. GEPIA2 provides customizable functionssuch as tumor/normal differential expression analysis, pro-filing according to cancer types or pathological stage, similargene detection, correlation analysis, and dimensionalityreduction analysis. Through this database, we verifiedwhether the expression levels of candidate genes in our studywere consistent.
3. Results
3.1. Differential Expression. A total of 53 differentiallyexpressed miRNAs were identified using the GSE83693

Reproduction structure development
Reproductive system development
Positive regulution of protein catabolic process
Neural retina development
Retina morphogenesis in camera-type eye
Camera-type eye photoreceptor cell differentiation
DNA-binding transcription activator acitivityRNA polymerase II-specific
0.025 0.050 0.075 0.100
Generatio
Count5.07.510.0
0.01
0.02
0.03
0.04
P.adjust
EPM
P
Figure 4: Bubble chart of GO enrichment. Horizontal axis: the proportion of genes; vertical axis: enrichment items. The color of the pointcorresponds to the value of p adjust, while the size of the point corresponds to the number of DGEs under the GO entry.
4 BioMed Research International
dataset, out of which 35 were downregulated, while 18 wereupregulated. Besides, 680 differentially expressed mRNAswere identified using the GSE36668 dataset, out of which239 and 441 mRNAs were downregulated and upregulated,respectively. The differentially expressed molecules areshown in Figure 1.
3.2. Overlapped DEGs and Regulatory Networks. Accordingto the DEGs of mRNA dataset, combined with the targetgenes of differentially expressed miRNA predicted by theFunrich software, the 186 overlapped DEGs’ network fileswere obtained (attachment S1 and S2 shown). The networkfiles were imported into the Cytoscape software for visualanalysis (Figure 2). It was found that miR-195-5p, miR-424-5p, and miR-497-5p were in the hub core of networkregulation, of which number of target genes were the most.All three key miRNAs had 16 target DEGs.
3.3. Identifying the Key Genes. The results showing the iden-tified key genes in the overlapped DEGs via the string data-base and cytohubba module are shown in Table 1. All thekey genes were overexpressed differential genes, of whichexpressions were consistent with the GEPIA2 database.The top 10 key genes were screened following the latestMCC algorithm, namely, TTK, CEP55, KIT, DTL, E2F8,
SOX9, ERCC6L, KIF18B, THY1, and CCNE1. Notably,TTK, CEP55, and KIT showed the highest scores and wereat the key core of the network (Figure 3).
3.4. Functional Enrichment Annotation. The results of GOenrichment analysis using the “clusterProfiler” package areshown in Figure 4. In BP, the DEGs were significantlyenriched in developing the reproductive structure, remodel-ing of the reproductive system, positive regulation of proteincatabolism, retinal morphogenesis, and differentiation path-ways of the ocular photoreceptor cell. In MF, DEGs wereenriched in DNA-binding transcriptional activation. Ofnote, since we set the filtering parameter at(p value cutoff = 0:05), KEGG analysis did not enrich theentries with coherent biological meaning.
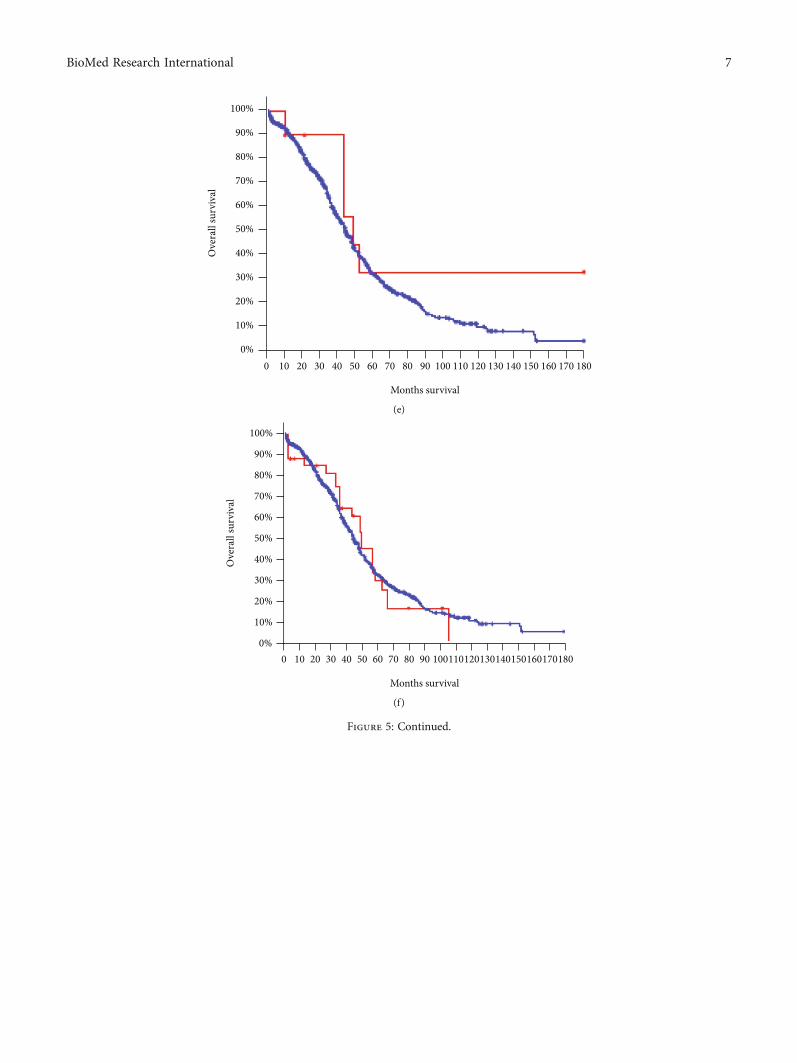
3.5. Survival Analysis. Through cbioportal analysis of howthe genes were correlated with prognosis (Figure 5), weobserved improved overall survival rate of ovarian cancerpatients with CEP55 variation, with a statistically significantdifference (p = 0:012). Moreover, patients with CCNE1 vari-ation showed poorer survival prognosis compared to non-variant tumor patients (p = 2:397e − 6). However, nosignificant differences were observed in the survival analysisof other key genes between the two tumor groups.

100%
90%
80%
70%
60%
50%
40%
30%
20%
10%
0%0 10 20 30 40 50 60 70 80 90 100 110 120 130 140 150 160 170 180
Months survival
Logrank test p-value: 0.905
Ove
rall
surv
ival
(a)
100%
90%
80%
70%
60%
50%
40%
30%
20%
10%
0%
0 10 20 30 40 50 60 70 80 90 100 110 120 130 140 150 160 170 180
Months survival
Logrank test p-value: 0.0120
Ove
rall
surv
ival
(b)
Figure 5: Continued.
5BioMed Research International

100%
90%
80%
70%
60%
50%
40%
30%
20%
10%
0%0 10 20 30 40 50 60 70 80 90 100 110 120 130 140 150 160 170 180
Months survival
Logrank test p-value: 0.011
Ove
rall
surv
ival
(c)
100%
90%
80%
70%
60%
50%
40%
30%
20%
10%
0%0 10 20 30 40 50 60 70 80 90 100 110 120 130 140 150 160 170 180
Months survival
Logrank test p-value: 0.104
Ove
rall
surv
ival
(d)
Figure 5: Continued.
6 BioMed Research International
100%
90%
80%
70%
60%
50%
40%
30%
20%
10%
0%0 10 20 30 40 50 60 70 80 90 100 110 120 130 140 150 160 170 180
Months survival
Ove
rall
surv
ival
(e)
100%
90%
80%
70%
60%
50%
40%
30%
20%
10%
0%0 10 20 30 40 50 60 70 80 90 100110120130140150160170180
Months survival
Ove
rall
surv
ival
(f)
Figure 5: Continued.
7BioMed Research International

100%
90%
80%
70%
60%
50%
40%
30%
20%
10%
0%0 10 20 30 40 50 60 70 80 90 100 110 120 130 140 150 160 170 180
Months survival
Ove
rall
surv
ival
(g)
100%
90%
80%
70%
60%
50%
40%
30%
20%
10%
0%0 10 20 30 40 50 60 70 80 90 100 110 120 130 140 150 160 170 180
Months survival
Ove
rall
surv
ival
(h)
Figure 5: Continued.
8 BioMed Research International

100%
90%
80%
70%
60%
50%
40%
30%
20%
10%
0%0 10 20 30 40 50 60 70 80 90 100 110 120 130 140 150 160 170 180
Months survival
Ove
rall
surv
ival
(i)
100%
90%
80%
70%
60%
50%
40%
30%
20%
10%
0%0 10 20 30 40 50 60 70 80 90 100 110 120 130 140 150 160 170 180
Months survival
Ove
rall
surv
ival
Overall survival kaplan-meler estimateAllowed groupUnallowed group
(j)
Figure 5: Kaplan-Meier survival curve. The red represents the ovarian cancer group with target gene mutation; blue represents the ovariancancer group without target gene mutation; p value < 0.05 is considered statistically significant.
9BioMed Research International
4. Discussion
Ovarian cancer is a common gynecological malignancy.However, the molecular mechanism by which ovarian can-cer is associated with pathogenicity has not been fully eluci-dated. Notably, BRCA is one of the currently identified genethat has a key role in ovarian cancer [21]. The BRCA muta-tion frequency of ovarian cancer ranges from 3% to 27%; thegene test provides precise guidelines for preventing, diagnos-ing, and treating ovarian cancer [22]. However, there is a
need to identify other novel molecules to jointly screen formost of the remaining cancer cases.
Current researches [10, 23, 24] indicate that besidesgenes, the dysregulated expression of noncoding RNAs suchas miRNA can widely mediate various types of malignanttumors. Therefore, to improve the prediction accuracy, ourstudy identified overlapped DEGs based on integratedmiRNA and mRNA expression profiles of ovarian cancer.We constructed the miRNA-gene regulatory network toidentify three key miRNAs (miR-195-5p, miR-424-5p, and

10 BioMed Research International
miR-497-5p) as tumor suppressors based on the principle ofcomplementary binding of miRNAs to the target mRNAs,negatively regulating genes. Moreover, the 10 key genes werepredicted and screened by visualizing the overlapped DEGsin the network using the Cytoscape software, wherebyTTK, CEP55, and KIT were at the center of the molecularnetwork. By querying the NCBI database, we found thatmajority of the 10 genes were associated with specific tumor-igenesis that mainly involves mitosis and cell proliferation(Table 1). Additionally, the survival curve analysis revealedthat CEP55 and CCNE1 should be potential prognosticgenes. The biological processes involved in overlapped DEGswere enriched through the R package. It was found that22.6% (24/106) and 10.4% (11/106) of the DEGs were signif-icantly enriched in biological processes of the reproductivesystem and DNA transcription activation function, respec-tively. These results concur with the actual functions androles of ovarian tissue thereby justifying the reliability ofour study. The abnormal expression of these differentialmiRNAs and genes was likely to mediate the occurrenceand development of ovarian cancer. Besides, for the threekey miRNAs discovered as tumor suppressors, we conductedan experimental literature search for recently publishedreports. Notably, Luo et al. [25] identified that the expressionof miR-195-5p was significantly reduced in 40 breast cancersthrough qPCR experiments. Also, he identified CCNE1 wasas the direct target of miR-195-5p in a dual-luciferasereporter assay. Elsewhere, Kong et al. [26] found that miR-195-5p played a tumor-suppressive role in endometrial can-cer through similar methodologies. Moreover, Liu et al. [27]identified that miR-424-5p directly targeted CCNE1 toinhibit epithelial ovarian cancer through in vitro experi-ments. Notably, we obtained similar findings on the miRNAexpression and target prediction. In addition, Liu et al. [28]constructed a lentiviral miR-497-5p system, and throughqRT-PCR, she verified that its overexpression enhanced cellapoptosis of ovarian cancer. Similarly, we reported that miR-497-5p as a tumor suppressor molecule.
Conclusively, this study purposed to reveal the key mol-ecules of ovarian cancer by analyzing the integrated miRNA-mRNA expression profiles. Notably, the identified key miR-NAs or genes require in-depth experimental verificationthrough in vitro studies. Nevertheless, the bioinformatics isa reliable method to predict the expression profiles by nar-rowing the scope of in vitro experiments and saving valuableresources. In the future, we believe that global researcherswill be able to instantly reveal key molecules of many com-plex and diverse tumors using the tumor big data strategywhich is dependent on computational biology.
Data Availability
All datasets generated for this study are included in thearticle.
Ethical Approval
Ethical approval is not applicable.
Disclosure
This manuscript [29] had been released as a preprint at Can-cer Biology (Chao Li et al.).
Conflicts of Interest
The authors declare no conflict of interest.
Authors’ Contributions
The research idea was derived from XK Yang, and C Lidesigned the research. ML Ou and XD Zhu participated indata collection. ZT Hong and C Li analyzed the data. Then,C Li wrote the paper and revised it. All the authors helpedwith article review, and they had read and approved the finalmanuscript.
Acknowledgments
The authors were grateful to all colleagues of FoshanWomen and Children Hospital Affiliated to Southern Med-ical University.
References
[1] F. Bray, J. Ferlay, I. Soerjomataram, R. L. Siegel, L. A. Torre,and A. Jemal, “Global cancer statistics 2018: GLOBOCAN esti-mates of incidence and mortality worldwide for 36 cancers in185 countries,” CA: a Cancer Journal for Clinicians, vol. 68,no. 6, pp. 394–424, 2018.
[2] L.-E. Zheng, J.-Y. Qu, and F. He, “The diagnosis and patholog-ical value of combined detection of HE4 and CA125 forpatients with ovarian cancer,” Open Medicine, vol. 11, no. 1,pp. 125–132, 2016.
[3] R. G. Moore, M. C. Miller, M. M. Steinhoff et al., “Serum HE4levels are less frequently elevated than CA125 in women withbenign gynecologic disorders,” American Journal of Obstetricsand Gynecology, vol. 206, no. 4, pp. 351.e1–351.e8, 2012.
[4] B.-W. Lv, J. Qian, J. Wang et al., “miR-455-5p expression inepithelial ovarian cancer and functional analysis of its targetgenes,” Journal of Practical Oncology, vol. 33, no. 2, pp. 115–121, 2019.
[5] S.-M. Guo and H.-M. Li, “Using bioinformatics to discover theHADH and SRC as potential therapeutic target genes for ovar-ian cancer,” Clinical Medicine Electronic Journal, 2017.
[6] X. Yang, S. Zhu, L. Li et al., “Identification of differentiallyexpressed genes and signaling pathways in ovarian cancer byintegrated bioinformatics analysis,” Oncotargets and Therapy,vol. Volume 11, pp. 1457–1474, 2018.
[7] H. Feng, Z.-Y. Gu, Q. Li, Q. H. Liu, X. Y. Yang, and J. J. Zhang,“Identification of significant genes with poor prognosis inovarian cancer via bioinformatical analysis,” Journal of Ovar-ian Research, vol. 12, no. 1, p. 35, 2019.
[8] M. A. Lindsay, S. Griffiths-Jones, and T. Dalmay, “Mechanismof miRNA-mediated repression of mRNA translation,” Essaysin Biochemistry, vol. 54, pp. 29–38, 2013.
[9] A. Lujambio and S. W. Lowe, “The microcosmos of cancer,”Nature, vol. 482, no. 7385, pp. 347–355, 2012.
[10] R. Rupaimoole, G. A. Calin, G. Lopez-Berestein, and A. K.Sood, “miRNA deregulation in cancer cells and the tumor

11BioMed Research International
microenvironment,” Cancer Discovery, vol. 6, no. 3, pp. 235–246, 2016.
[11] A. Yokoi, J. Matsuzaki, Y. Yamamoto et al., “Integrated extra-cellular microRNA profiling for ovarian cancer screening,”Nature Communications, vol. 9, no. 1, pp. 1–10, 2018.
[12] K. Resnick, H. Alder, J. P. Hagan, D. L. Richardson, C. M.Croce, and D. E. Cohn, “The detection of differentiallyexpressed microRNAs from the serum of ovarian cancerpatients using a novel real-time PCR platform,” GynecologicOncology, vol. 112, no. 1, pp. 55–59, 2009.
[13] J. Gao, N. Wu, X. Liu et al., “MicroRNA-142-3p inhibits cellproliferation and chemoresistance in ovarian cancer via target-ing sirtuin 1,” Experimental and Therapeutic Medicine, vol. 15,no. 6, pp. 5205–5214, 2018.
[14] G. K. Smyth, M. Ritchie, N. Thorne, and J. Wettenhall,LIMMA: Linear Models for Microarray Data. In Bioinformat-ics and Computational Biology Solutions Using R and Biocon-ductor, Statistics for Biology and Health, 2005.
[15] G. Yu, L.-G.Wang, Y. Han, and Q. Y. He, “clusterProfiler: an Rpackage for comparing biological themes among gene clus-ters,” Omics: a Journal of Integrative Biology, vol. 16, no. 5,pp. 284–287, 2012.
[16] M. Pathan, S. Keerthikumar, C. S. Ang et al., “FunRich: anopen access standalone functional enrichment and interactionnetwork analysis tool,” Proteomics, vol. 15, no. 15, pp. 2597–2601, 2015.
[17] D. Szklarczyk, J. H. Morris, H. Cook et al., “The STRING data-base in 2017: quality-controlled protein–protein associationnetworks, made broadly accessible,” Nucleic Acids Research,vol. 45, no. D1, pp. D362–D368, 2017.
[18] C.-H. Chin, S.-H. Chen, H.-H. Wu, C. W. Ho, M. T. Ko, andC. Y. Lin, “cytoHubba: identifying hub objects and sub-networks from complex interactome,” BMC Systems Biology,vol. 8, no. S4, p. S11, 2014.
[19] J. Gao, B. A. Aksoy, U. Dogrusoz et al., “Integrative analysis ofcomplex cancer genomics and clinical profiles using the cBio-Portal,” Science Signaling, vol. 6, no. 269, p. pl1, 2013.
[20] Z. Tang, B. Kang, C. Li, T. Chen, and Z. Zhang, “GEPIA2: anenhanced web server for large-scale expression profiling andinteractive analysis,” Nucleic Acids Research, vol. 47, no. W1,pp. W556–W560, 2019.
[21] R. T. Neff, L. Senter, and R. Salani, “BRCAmutation in ovariancancer: testing, implications and treatment considerations,”Therapeutic Advances in Medical Oncology, vol. 9, no. 8,pp. 519–531, 2017.
[22] K. Alsop, S. Fereday, C. Meldrum et al., “BRCAMutation fre-quency and patterns of treatment response inBRCAMuta-tion–Positive women with ovarian cancer: a report from theAustralian Ovarian Cancer Study Group,” Journal of ClinicalOncology, vol. 30, no. 21, pp. 2654–2663, 2012.
[23] K. B. Reddy, “MicroRNA (miRNA) in cancer,” Cancer CellInternational, vol. 15, no. 1, p. 38, 2015.
[24] W. Tang, S. Wan, Z. Yang, A. E. Teschendorff, and Q. Zou,“Tumor origin detection with tissue-specific miRNA andDNA methylation markers,” Bioinformatics, vol. 34, no. 3,pp. 398–406, 2018.
[25] Q. Luo, C. Wei, X. Li et al., “MicroRNA-195-5p is a potentialdiagnostic and therapeutic target for breast cancer,” OncologyReports, vol. 31, no. 3, pp. 1096–1102, 2014.
[26] F. Kong, J. Ma, H. Yang, Yang, Wang, and Ma, “Long non-coding RNA PVT1 promotes malignancy in human endome-
trial carcinoma cells through negative regulation of miR-195-5p,” Biochimica et Biophysica Acta (BBA)-Molecular CellResearch, vol. 1865, no. 10, pp. 1479–1490, 2018.
[27] J. Liu, Z. Gu, Y. Tang, J. Hao, C. Zhang, and X. Yang,“Tumour-suppressive microRNA-424-5p directly targetsCCNE1 as potential prognostic markers in epithelial ovariancancer,” Cell Cycle, vol. 17, no. 3, pp. 309–318, 2018.
[28] C. Liu, A. Bordeaux, S. Hettich, and S. Han, “MicroRNA-497-5p functions as a modulator of apoptosis by regulating metad-herin in ovarian cancer,” Cell Transplantation, vol. 29, article0963689719897061, 2020.
[29] C. Li, X. Zhu, L. Zhang, M. Ou, and Z. Hong, IntegratedmiRNA-mRNA Expression Profiles Revealing Key Moleculesin Ovarian Cancer Based on Bioinformatics Analysis, ResearchSqaure, 2020.