integrated report on ocean remote sensing for the ... 1 introduction ···1 2 status of remote...
TRANSCRIPT

NOWPAP CEARAC Northwest Pacific Action Plan Special Monitoring and Coastal Environmental Assessment Regional Activity Centre 5-5 Ushijimashin-machi, Toyama City, Toyama 930-0856, Japan Tel: +81-76-445-1571, Fax: +81-76-445-1581 Email: [email protected] Website: http://cearac.nowpap.org/
Integrated Report on Ocean Remote Sensing for the NOWPAP Region
CEARAC Report 2005

First published in 2005 by NOWPAP Special Monitoring & Coastal Environmental Assessment Regional Centre
(NOWPAP CEARAC) Established at Northwest Pacific Region Environmental Cooperation Center (NPEC)
5-5 Tower111 6th floor, Ushijimashin-machi, Toyama City, Toyama 930-0856 JAPAN TEL: +81-76-445-1571 FAX: +81+76-445-1581
Website: http://cearac.nowpap.org/ E-mail: [email protected]
Copyright © NOWPAP CEARAC 2005 ISBN 4-9902809-2-X

Preface
The Special Monitoring & Coastal Environmental Assessment Regional Activity Centre (CEARAC) is one of the four Regional Activity Centres (RACs) to coordinate activities relevant to specific components of the Northwest Action Plan (NOWPAP), which was adopted in September 1994 as a part of the Regional Seas Programme of the United Nations Environment Programme (UNEP) by People’s Republic of China, Japan, Republic of Korea, and Russian Federation.
CEARAC was founded in 1999 and is hosted by the Northwest Pacific Region Environmental
Cooperation Center (NPEC), which was established in 1998 in Toyama, Japan, under the auspices of the Ministry of the Environment. One of the main activities of CEARAC includes developments of special monitoring tools using RS (Remote Sensing) for marine and coastal environment RS under NOWPAP Working Group 4 (WG4).
As one of the main activities of WG4, the 1st WG4 Meeting (Vladivostok, Russian
Federation, 1-3 December 2003) approved that each of NOWPAP Members (China, Japan, Korea, or Russia) would make a national report on Ocean RS in its own country and CEARAC would create an integrated report based on the national reports from the members. A book of National Reports on Ocean Remote Sensing in the NOWPAP Region was published in November 2005.
The objectives of Integrate Report on Ocean Remote Sensing for the NOWPAP Region are to provide and to share information on the status of Ocean RS in the NOWPAP Region, and to address issues to be tackled through CEARAC activities. To this end, common issues of Ocean RS in the NOWPAP Region are identified. This report was prepared by CEARAC in cooperation with experts and advisors of WG4. The 3rd NOWPAP Focal Points Meeting (Toyama, Japan, 15-16 September 2005) reviewed the draft and finally approved to publish it. The CEARAC Secretariat hopes that this report shows us broader perspectives of the situation of Ocean RS in the whole NOWPAP Region.
The CEARAC Secretariat would like to thank the CEARAC Focal Points, the experts of WG4 and their colleagues for great contributions to publish this book of Integrated Report for Ocean RS in the NOWPAP Region.

NOWPAP Working Group 4 Ms. Xin JING Assistant Professor, Department of Ecological Monitoring, China National Environmental Monitoring Center, China Dr. Chenghu ZHOU Professor, Institute of Geographical Sciences and Natural Resource Research, Chinese Academy of Sciences, China Dr. Ichio ASANUMA Professor, Department of Environmental Information, Tokyo University of Information Sciences, Japan Dr. Joji ISHIZAKA Professor, Faculty of Fisheries, Nagasaki University, Japan Dr. Young-Sang SUH Director, Marine Environment Team East Sea Fisheries Research Institute of NFRDI, Korea Dr. Sang-Woo KIM Researcher, Marine Remote Sensing Laboratory, Department of Oceanography and Marine Environment, NFRDI, Korea Dr. Leonid MITNIK Head, Satellite Oceanography Department, V.I. Il'ichev Pacific Oceanological Institute, Far East Branch of the Russian Academy of Sciences, Russia Dr. Anatoly ALEXANIN Head Institute of Automation and Control Processes, Far East Branch of the Russian Academy of Sciences, Russia
Special Advisors of WG4 Dr. Hiroshi KAWAMURA Professor Ocean Environment Research Section Center for Atmospheric and Oceanic Studies Graduate School of Science Tohoku University, Japan Secretariat Special Monitoring & Coastal Environmental Assessment Regional Activity Centre (CEARAC) 5-5 Ushijima Shinmachi, Toyama 930-0856, Japan Tel: +81-76-445-1571 Fax: +81-76-445-1581

Integrated Report on Ocean Remote Sensing for the NOWPAP Region

Contents
1 Introduction·····················································································································12 Status of remote sensing utilization in marine environmental monitoring···············3
2.1 China ·························································································································32.2 Japan·························································································································42.3 Korea·························································································································42.4 Russia ·······················································································································4
3 Case examples of remote sensing applications in marine environmental monitoring·······················································································································6
3.1 China ·························································································································63.2 Japan·························································································································63.3 Korea·························································································································73.4 Russia ·······················································································································7
4 Status of research and development on remote sensing technology for marine environment monitoring ······························································································13
4.1 Sensors and Satellites·····························································································134.1.1 HY-1B (China) ··································································································134.1.2 ALOS (Japan) ··································································································134.1.3 KOMPSAT-II (Korea)························································································144.1.4 COMS (Korea) ·································································································144.1.5 Meteor-3M #2 (Russia) ····················································································15
4.2 Algorithms for geophysical parameters ···································································164.2.1 Sea surface temperature··················································································164.2.2 Chlorophyll-a concentration ·············································································174.2.3 Primary productivity··························································································184.2.4 Sea surface salinity ··························································································194.2.5 Others ··············································································································19
4.3 Validation of geophysical parameters······································································214.3.1 GLI match-up analysis ·····················································································214.3.2 Project on Ocean Productivity Profiling System···············································224.3.3 Improvement of the algorithm for chlorophyll-a concentrations in Case 2
waters···············································································································224.3.4 Validation of SST retrieval algorithms using AMSR-E, NEAR-GOOS and POI
GIS···················································································································24
5 Introduction to the latest findings ··············································································255.1 Monitoring of red tide/harmful algal blooms ····························································255.2 Monitoring of dynamic oceanic phenomena····························································265.3 Development of algorithms······················································································26
6 Strategies/Plans for remote sensing related activities ·············································286.1 China ·······················································································································286.2 Japan·······················································································································286.3 Korea·······················································································································296.4 Russia ·····················································································································30
7 Challenges and prospects···························································································317.1 Real-time performance and continuity of observations ···········································317.2 Ocean color remote sensing in coastal areas ·························································317.3 Collection of in situ data ··························································································31
7.4 Improvement of spatial and temporal coverage······················································ 317.5 Continuous development of algorithms and applications of satellite data··············· 327.6 Education and public awareness ············································································ 327.7 Combined use of satellite data and other relevant information······························· 32
8 Suggested activities for the NOWPAP Region ·························································· 338.1 Refinement of guidelines being prepared by the NPEC for local governments ······ 338.2 Enhancement of the technical training program ····················································· 338.3 Development of remote sensing information network············································· 338.4 Sustainable ocean observing system and regional cooperation····························· 348.5 Search for other possible uses of satellite remote sensing for environmental
monitoring in the NOWPAP Region ········································································ 34
9 Summary and recommendations ··············································································· 359.1 Summary················································································································· 359.2 Recommendations on activities of WG4 for next two years···································· 35
References ··························································································································· 36List of acronyms·················································································································· 39

Page 1
1 Introduction
The frequent occurrence of large-scale red tides in the coastal areas of China and Korea, apparently induced by eutrophication, is now a serious issue causing an increase in fishery damage, environmental deterioration and food poisoning from the consumption of affected fish. The establishment of an extensive and continuous monitoring system for observing the emergence of eutrophication (phytoplankton blooms) and red tides is essential to prevent such damage. In the past, observations have been made through reports from fishermen and periodical measurements of water quality by research institutes, costing much labor and expense. Phytoplankton blooms are sporadic in time and isolated in space, and are therefore hard to monitor by conventional (surface) means. The blooms can color surface waters over large areas and can therefore be imaged from space. Satellite ocean color sensors enable high frequency observations covering wide sea areas, and capture spatial and temporal changes in chlorophyll-a concentration, including from intensive phytoplankton blooms. There are currently no methods to determine from satellite data whether a bloom is ‘harmful’ in its effects on humans, fish or other organisms. The practical application of remote sensing as a monitoring tool for eutrophication and red tides is anticipated, as increasingly specific signatures for blooms are detectable by satellite optical sensors.
Much of the traffic in the Northwest Pacific Ocean, one of the most crowded sea areas in the world, is tankers and heavy oil cargo vessels. The potential risk of accidental oil spills from these vessels is very high, damaging local fisheries and tourism, and subsequently causing significant degradation to the marine environment. Also, illegal oil dumping is not a negligible issue. Remote sensing, having wider coverage than conventional methods and all-weather capability, is expected to detect widespread oil spills effectively and accurately with fewer false alarms, which is critical to minimize damage and operational expenses.
Consequently, we propose that, for the time being, eutrophication and oil spills should be the main targets of marine environmental monitoring by remote sensing, as both are common environmental issues in the NOWPAP Region and both are expected to be targets for remote sensing applications. Other targets can be included, depending on the importance of the monitoring and technical feasibility.
Remote sensing can provide data and information on chlorophyll-a concentration, suspended solids (SS), colored dissolved organic matter (CDOM), primary productivity of phytoplankton, red tides and sea surface temperature (SST) fields. It can also help to analyze the mechanisms of eutrophication and red tides for predicting blooms and providing data on the adaptation and mitigation of eutrophication. With regard to eutrophication monitoring, the target parameters for now should be (1) chlorophyll-a concentration, which is already in practical use and is a good indicator of eutrophication, and (2) primary productivity, which is estimated from the observed chlorophyll-a concentration, SST and photosynthetically available radiation (PAR). Monitoring red tides by remote sensing will be considered in the mid- and long-term, in accordance with the progress of observation technologies, because there are still many problems to be solved.
With regard to oil spill monitoring, remote sensing can provide data and information on the early detection of spills, size estimates, damage assessment, location of oceanic dynamic features (current and river outflow fronts, eddies etc.), and fields of physical oceanic and atmospheric parameters (wind, waves, SST etc.). Such monitoring can also help to identify the pollution source, including accidents and illegal discharge of wastewater from ships, predict the movement and weathering of a spill and possibly determine the nature and thickness of the oil.
The ultimate goal of our activities is to ‘establish cooperative marine environmental monitoring by remote sensing and to contribute to the conservation of the marine environment in the NOWPAP Region’. To achieve this goal, we must thoroughly consider, among other things, the identification and solution of technical issues of marine environmental monitoring by remote sensing, and the technical and financial arrangement in the NOWPAP Region. This Integrated Report aims at

Page 2
sharing a common understanding among the NOWPAP Members on these matters and informing the progress internationally.

Page 3
2 Status of remote sensing utilization in marine environmental monitoring
Remote sensing by satellite is widely applied to marine environmental monitoring, as it enables the frequent observations of global phenomena. In the NOWPAP Region, a variety of satellites and sensors are used to monitor eutrophication, red tides and oil spill incidents, and to understand oceanic phenomena and fishery grounds. For the monitoring of eutrophication and red tides, the Sea-viewing Wide Field-of-view Sensor (SeaWiFS) and Moderate Resolution Imaging Spectroradiometer (MODIS) are used, and for monitoring oil spills, the Synthetic Aperture Radar (SAR) and Advanced Synthetic Aperture Radar (ASAR) are mainly used. These sensors contribute enormously to our understanding of various dynamic oceanic phenomena, such as currents, fronts, eddies, upwellings, internal and surface ocean waves, and along with Advanced Very High Resolution Radiometers (AVHRR), the Advanced Microwave Scanning Radiometer for Earth Observing System (AMSR-E) and altimeters provide data on atmospheric phenomena, such as cyclones, fronts, convective eddies, mesoscale cells and rolls.
In recent years, the use of satellites and sensors developed and operated by the NOWPAP Members for marine environmental monitoring has been increasingly promoted. In China, observations of ocean color and SST by the Chinese Ocean Color and Temperature Scanner (COCTS), Charge-coupled Device (CCD) and Multi-channel Visible and Infrared Scan Radiometer (MVISR) are underway, as is the monitoring of coastal erosion using sensors on the China Brazil Earth Resources Satellite (CBERS), jointly developed with Brazil. In Japan, the Ocean Color and Temperature Scanner (OCTS), which started its observations 10 years after the end of the CZCS mission, and the Global Imager (GLI), which enables observations in higher resolution and multi-wave lengths, are used to study ocean color and SST. Along with data derived from SeaWiFS and MODIS, these observations greatly contribute to marine environmental monitoring. In Korea, the Ocean Color Monitor (OCM) from India, which enables observations in higher resolution, and the Ocean Scanning Multi-spectral Imager (OSMI) are utilized for ocean color monitoring. In Russia, the Real Aperture Radar (RAR) of the Okean series and the SAR of Almaz-1 have been developed and operated to monitor sea ice etc. The SAR of the European Remote Sensing Satellite (ERS) and the ASAR of Environment Satellite (ENVISAT) are also currently used for oil spill detection.
2.1 China
China has made great progress in ocean environment remote sensing in the last 3 years. The third space ship Shen Zhou-3 (SZ-3), the first ocean satellite Hai Yang-1A (HY-1A) and the fourth space ship SZ-4 were launched in March, May and December 2002, respectively. The sensors on the spacecrafts have reasonable usability and measurement accuracy. Data obtained by the Chinese SZ-3 Moderate Imaging Spectroradiometer (CMODIS), HY-1A COCTS and Coastal Zone Imaging (CZI) are being applied to ocean environment sensing work and show great potential for various applications, including coastal water quality monitoring, fishery resources protection, development and utilization, coastal engineering and oceanography.
Ocean study is a very important strategic direction for the Chinese economy. The Chinese government understands that one or even two satellites are not enough to monitor the huge ocean area surrounding China and to forecast the evolution of oceanic and atmospheric processes. The series satellite program for marine applications needs further planning and development. Three series of marine remote sensing satellites are planned: the ocean color satellite series HY-1; the dynamic satellite series HY-2; and the comprehensive satellite series HY-3 (Pan Delu, 2004).
Page 4
2.2 Japan
To contribute to the conservation of the global environment, Japan has developed and operated two earth-observing satellites, the Advanced Earth Observing Satellite (ADEOS) and ADEOS-II, under the National Space Development Agency of Japan (NASDA) (now Japan Aerospace Exploration Agency, JAXA). An Ocean Color and Temperature Scanner (OCTS) on the ADEOS satellite monitored ocean color before the OrbView-2 SeaWiFS, launched by the US in 1997, which estimated primary productivity on global and local levels (Saino, 1998; Kawamura and the OCTS-team, 1998; Shimada et al., 1998). ADEOS-II was equipped with Global Imager (GLI), a follow-on sensor based on OCTS, which enabled frequent, accurate and global observations of various geophysical parameters in the ocean (Ishizaka et al., 2004). The results were later applied to MODIS higher-level products by JAXA Earth Observation Research and application Center (EORC), targeting the sea surrounding Japan. In the Intensive Local Area Coverage (I-LAC) project initiated by NASDA in 1996, images of chlorophyll-a concentration, SST and other parameters were captured by OCTS, SeaWiFS, MODIS and then GLI, and have been distributed to the public via the Internet with the highest spatial resolution available for the oceans around Japan.
Products from MODIS and AVHRR data have been used for projects such as the Marine Environmental Watch Project, aimed to monitor the areas frequently damaged by red tides, to search for fishing areas, and to estimate primary productivity on a global level. In addition, AMSR-E brightness temperatures and its higher-level products have been used in the development of the New Generation Sea Surface Temperature (NGSST) for the open ocean.
2.3 Korea
The National Fisheries Research and Development Institute (NFRDI) has been receiving NOAA AVHRR data since 1989 for studying abnormal phenomena in the Korean waters. NFRDI also has been receiving SeaWiFS, MODIS and OCM real-time data since 1998. The Korea Ocean Research and Development Institute (KORDI) has been operating a SeaWiFS receiving station on a delay-mode basis since 1998.
The Korea Aerospace Research Institute (KARI) launched the Korean Multi-Purpose Satellite I (KOMPSAT-I) in December 1999. KOMPSAT-I is used mainly for ocean observations in the visible and near-infrared spectral band. It has two sensors: Electro Optical Camera (EOC) to get panchromatic images and OSMI to get multi-spectral images. A study on OSMI calibration/validation using SeaWiFS and in situ data was carried out from 2001 to 2004 under cooperation between Korea and the US National Aeronautics and Space Administration (NASA). Chlorophyll-a concentrations retrieved from SeaWiFS and OCM data, SST retrieved from AVHRR data, and SS retrieved from MODIS data have been actively used for monitoring projects such as the ‘Operation of an application system to produce ocean information derived from earth observation satellites’.
2.4 Russia
Okean-7 and Okean-8, equipped with a 3 cm wavelength Real Aperture Radar (RAR), were launched in 1994 and 1995, respectively, with the last RAR images taken by Okean-7 in February 2000. RAR images, with their spatial resolution of 1 3 km, have been an important source of mesoscale and sub-synoptic scale information on sea ice, near-surface winds for air-sea interactions, and ocean dynamics. Radar images have been used operationally, especially for mapping ice conditions.
The Almaz-1, equipped with a SAR operating at wavelength of 9.6 cm, was launched in 1991 and operated for 18 months. The SAR images provided significant capability for observing ocean processes and have resulted in a series of quantitative scientific findings and theoretical advances in the open ocean, coastal areas and marine operations, sea ice, marine boundary layer meteorology, and environmental monitoring, including oil spill detection (Mitnik, 2003; Wilson, 2005).

Page 5
The Federal Space Program (FSP) of Russia (2001 2005) includes remote sensing of the Earth, hydro-meteorological observations, and ecological and catastrophe monitoring. In particular, the following problems are solved using these technologies: monitoring of pollution sources in the atmosphere, water and soil; providing information to state and regional units to enable environmental control; operational monitoring of natural and technological crises; launching of Meteor-M and Electro-L and utilizing them in an international hydro-meteorological observation system; and receiving, processing and distributing remote sensing data from Russian and foreign satellites. A project forecasting a significant increase in finances of the space sector between 2006 and 2015 was recently approved by the Russian government.
In the Federal Target-Oriented Program ‘World Ocean’ (2003 2007), the main goal is to investigate dynamic phenomena and processes in the Far Eastern Seas and the Northwest Pacific Ocean on the basis of development and application of remote acoustic, optical and passive and active microwave techniques. The project will involve using remote techniques to study the structure, composition and spatial distribution of mesoscale and sub-mesoscale heterogeneities, and their temporal variability in the Far Eastern Seas, including the shelf and transition zones between the shallow waters and deep sea. Systems of operational detection and forecast of the transfer and degradation of oil pollution adapted to the Primorye and Sakhalin shelf conditions will be created.

Page 6
3 Case examples of remote sensing applications in marine environmental monitoring
Case examples of remote sensing application in marine environmental monitoring indicate not only the present levels of technologies but also issues that need to be solved before their full application can be implemented. For open oceans where systems are ready to collect and analyze various data, their application to the monitoring of eutrophication seems realistic. However, for coastal areas where there is a greater need for remote sensing application, technology enabling higher resolution, high-frequency observations and the establishment of highly accurate algorithms is still required. As for the monitoring of oil spills, technology development for wider coverage and more frequent observations still needs to be established. The simultaneous use of field-monitoring data from vessels and buoys will continue to be important, because even if remote sensing technologies for the monitoring of eutrophication and oil spills are developed and applied, the operation of remote sensing needs adequate validation by the sea truth measurement.
3.1 China
In order to monitor ice in the Bohai Sea, data obtained by AVHRR, SeaWiFS and Stretched-Visible Infrared Spin Scan Radiometer (S-VISSR) sensors have been used and many different methods developed. An operational system has been put into practice. Scientists from China Ocean University, the First Institute of Marine Sciences of State Oceanic Administration (SOA) in Qingdao, and the National Ocean Environment Prediction Center of SOA conducted many studies on the application of remote sensing technologies to sea ice studies.
The Institute of Geography and the Institute of Oceanography of Chinese Academy of Sciences (CAS) have used Landsat images to conduct many studies on coastal monitoring, including coastal bank erosion and shoreline changes in the Yellow River Delta (Figure 1).
Many studies have been devoted to the monitoring of red tides in Chinese coastal oceans. Early work carried out at the Second Institute of Marine Science of SOA focused on the application of NOAA and SeaWiFS data. Various methods to extract red tide information from satellite images were developed and successfully applied to red tide monitoring in the Bohai Sea. A semi-analytical method of red tide detection, based on the analysis of MODIS images in many spectral channels, has been proposed (Figure 2).
In the early 1990’s, a comprehensive survey of land use and land cover along the coastal zone was conducted by the analysis of Landsat Thematic Mapper (TM)/ Enhanced Thematic Mapper Plus (ETM+) images. As a result, a land use and land cover database was developed. Central and provincial governments use this database for regional planning and management.
3.2 Japan
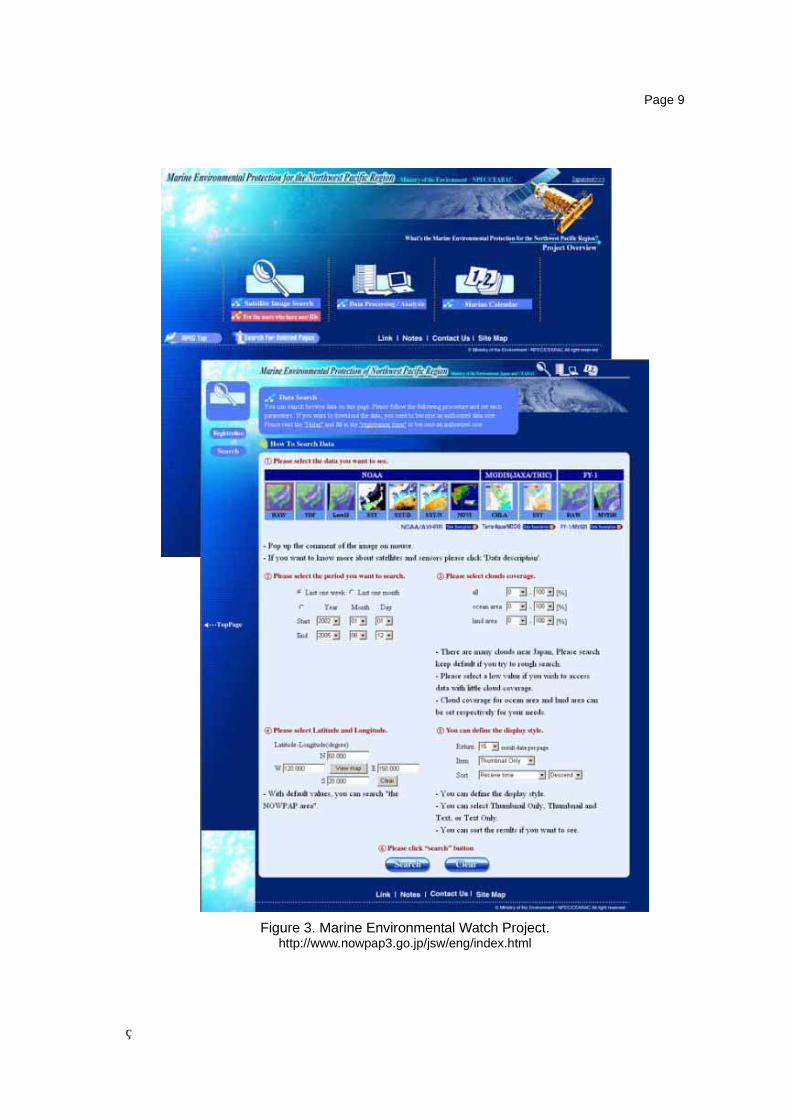
In order to promote NOWPAP, the Ministry of the Environment of Japan has been working with the Northwest Pacific Region Environmental Cooperation Center (NPEC). The goal is to prepare the Marine Environmental Watch Project utilizing satellite remote sensing data. The system has been available in an operational regime since March 2002 and includes data obtained by AVHRR and MVISR. Measured data are widely available through the Internet, providing images and data products of chlorophyll-a concentration, SST, a Normalized Difference Vegetation Index and so on. Required data can be selected by observation date, cloud coverage and other parameters (Figure 3).
In the coastal area of the Uwajima Sea, located between Kyushu and Shikoku Island, SST varies enormously due to the intrusion of the Kuroshio Current warm waters from the Pacific Ocean. Ehime Prefecture and the Center for Marine Environmental Studies at Ehime University collaboratively developed the Coastal Information System. This system provides information on SST changes and ocean color to fishermen and other users in a quasi-operational regime by

Page 7
processing NOAA AVHRR data and Terra and Aqua MODIS images, respectively. The MODIS ocean color images are adopted from higher-level products provided by EORC/JAXA (Figure 4).
Researchers in the faculty of fisheries at Nagasaki University organized the ‘Ariake Sea Project’. Effort is currently being made to accumulate daily images of chlorophyll-a concentration in the Ariake Sea, derived from MODIS higher-level products distributed by EORC/JAXA. The goal of this work is to clarify red tide dynamics through the analysis of these data (Ishizaka et al., 2005; Figure 5).
3.3 Korea
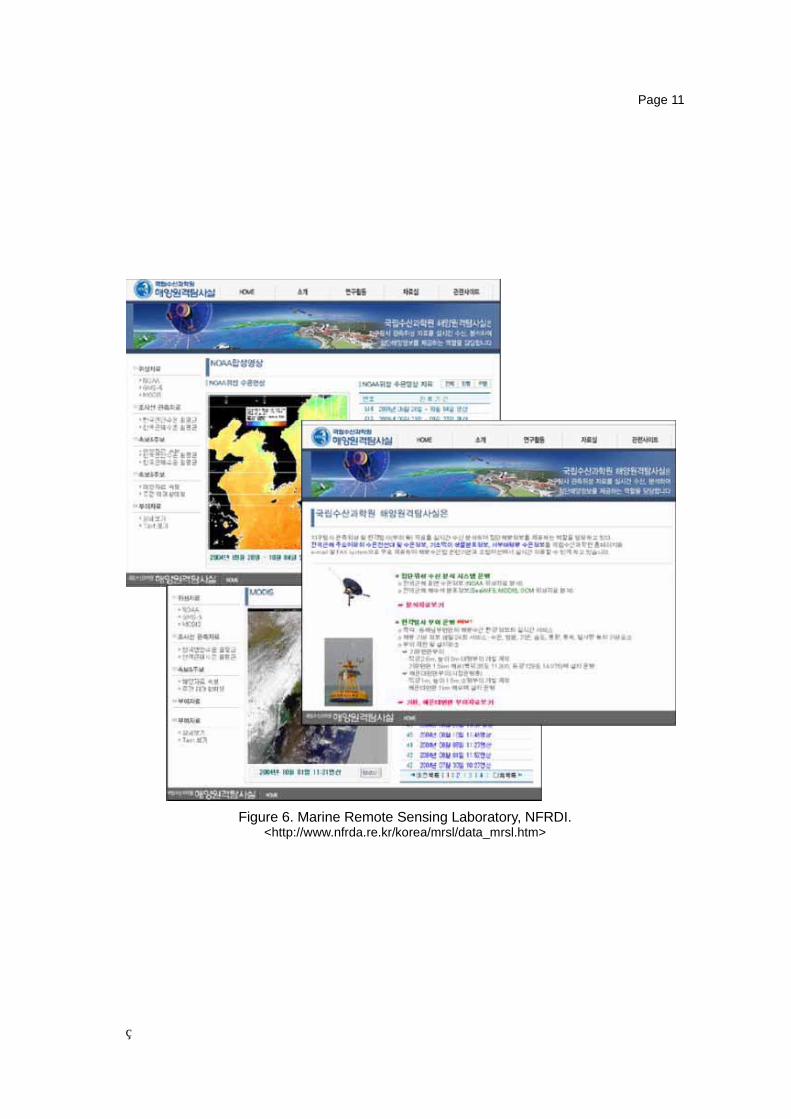
NFRDI under the Ministry of Maritime Affairs and Fisheries (MOMAF) has developed a satellite remote sensing system to derive information on oceanic fields and processes. Since 1996, this system has provided satellite-based information that is useful for finding and monitoring fishing grounds and for marine environmental conservation. Observations taken by AVHRR, SeaWiFS, MODIS, OCM and S-VISSR are used in the system. The SST charts with isotherms and 7-day composite color SST images for nighttime are downloaded through the Internet. MODIS-derived SS images and SeaWiFS-derived charts of chlorophyll-a concentration have been available since January 2004 (Figure 6).
KARI, KORDI, NFRDI, Pukyoung University and Yonsei University participated in the project (2002-2004) associated with applications of satellite data for ocean investigation. In particular, the application of OSMI data for fisheries oceanography was studied.
3.4 Russia
The V.I. Il’ichev Pacific Oceanological Institute of the Far Eastern Branch of the Russian Academy of Sciences (POI FEB RAS) participates in several ongoing ESA research projects dealing with oceanic dynamic phenomena in the NOWPAP Region. Results of preliminary POI research on oil spill detection and monitoring are summarized on the CEARAC Website, as shown in Figure 7. The database now consists of several tens of ERS-1 and ERS-2 SAR images. The number of SAR images is supposed to increase and provide an annotation for each image.
The FEB RAS Centre for the Regional Satellite Monitoring of Environment receives, processes, transfers and archives NOAA, Geostationary Meteorological Satellite (GMS) and Feng Yun-2 (FY-2) data for monitoring the ocean and atmosphere. The Centre’s products include calibrated images, SST maps and surface current velocities computed using a marine marker technique. The Centre conducts the regional satellite monitoring of various objects and processes in the framework of the scientific programs and applications of participating Institutes.
The most fruitful approach is the joint use and analysis of the various satellite products. This approach was realized in the All-Russia scientific-research and planning-construction Institute for Economy, Information and Automatic Systems of Management, where information technology for the remote determination of primary productivity in the ocean was developed. Data from NOAA, TOPEX/Poseidon, SeaWiFS and ERS-2, as well as information on catch, are used in the system to produce a new product by the integration of various data (Figure 8).

Page 8
Figure 1. Bohai Ice monitoring using ScanSAR in January 1999.
(a) September 1998 (SeaWiFS)
(b) May 2004 (MODIS)
Figure 2. Red tide monitoring in China.
Page 9
Figure 3. Marine Environmental Watch Project. http://www.nowpap3.go.jp/jsw/eng/index.html

Page 10
Figure 4. Ehime Prefecture Coastal Information System. http://www8.ocn.ne.jp/~ehchusui/
Figure 5. Links to Images of Chlorophyll-a concentration in the Ariake Sea by MODIS. <http://w3.fish.nagasaki-u.ac.jp/FISH/KYOUKAN/ISHIZAKA/MODIS/>
Page 11
Figure 6. Marine Remote Sensing Laboratory, NFRDI. <http://www.nfrda.re.kr/korea/mrsl/data_mrsl.htm>

Page 12
Figure 7. Oil spill monitoring in the NOWPAP Region, POI.http://cearac.poi.dvo.ru/
Figure 8. Integration of satellite products with fishing-boat catch.

Page 13
4 Status of research and development on remote sensing technology for marine environment monitoring
4.1 Sensors and Satellites
It is expected that marine environmental monitoring by remote sensing will contribute widely to preventing damage from emerging problems, such as eutrophication, red tides and oil spills. The continuous and systematic development of satellites and sensors is underway by the NOWPAP Members and related organizations, who are trying to meet the needs and actual uses in greater sophistication and diversity. In the near future, China plans to launch HY-1B, the successor to HY-1A; Japan plans to launch the Advanced Land Observing Satellite (ALOS), which is expected to contribute to the understanding of oceanic phenomena and monitoring oil spills; Korea plans to launch KOMPSAT-II and Communication Ocean and Meteorology Satellite (COMS), to be used for the monitoring of eutrophication and red tides; and Russia plans to launch Meteor-3M#2.
4.1.1 HY-1B (China)
HY-1B will be sent into orbit in 2006 to replace HY-1A. The technical indicators are the same as HY-1A. Like its precursor, HY-1B is also an ocean color monitoring satellite, but it will provide more precise data about the color and temperature of the ocean’s surface, and also monitor pollution and aid in mitigating disasters.
4.1.2 ALOS (Japan)
The main aims of the ALOS launching are to improve land observing technologies, i.e. cartography, regional land use, disaster monitoring and resources surveying, as well as to improve technology development compared to the Japanese Earth Resources Satellite-1 (JERS-1) and ADEOS by collecting global data with higher resolution.
ALOS has three earth observing sensors: the Panchromatic Remote-sensing Instrument for Stereo Mapping (PRISM) for digital elevation mapping; the Advanced Visible and Near Infrared Radiometer type 2 (AVNIR-2) for precise land coverage observation; and Phased Array type L-band Synthetic Aperture Radar (PALSAR) for day, night and all-weather land observations (Figure 9). In oceanography and coastal zone related research, PALSAR data are supposed to retrieve sea surface wind and wave height, and to monitor sea ice and oil spills. The corresponding algorithms of data processing are now under development. For oil spill detection, the use of PALSAR and AVNIR-2 is expected to contribute to effective surveillance, and thus to the better collection of oil and the reduction of oil spill damage. Furthermore, progress in studies of air-sea interactions, sea waves and dynamic oceanic phenomena, both in the open ocean and in coastal areas, will help to clarify the mechanisms of eutrophication and related red tides and their modeling.
Deriving the quantitative characteristics of oceanic phenomena, such as surface wind waves, internal waves, currents, upwellings and so on, depends on the SAR parameters of frequency, polarization and incidence angle. JERS-1 made observations primarily over land from 1992 to 1998. JERS-1 SAR provided many unique images over the ocean as well as information on wind waves, eddies, currents and sea surface roughness (Asanuma et al., 2003). It is expected that ALOS PALSAR will take over JERS-1 SAR in producing data for marine applications.

Page 14
Figure 9. ALOS - Overview. Source: ALOS@EORC
4.1.3 KOMPSAT-II (Korea)
Korea Multi-Purpose Satellite II (KOMPSAT-II; Figure 10) will carry a Multi-spectral Camera (MSC) of very high spatial resolution (4 m). Its spectral channels will correspond to Landsat-5 TM channels, which will enhance the understanding of intricate and striking patterns of small-scale biological and physical phenomena, especially in the coastal areas. KARI will launch KOMPSAT-II at the end of 2005.
4.1.4 COMS (Korea)
COMS is designed mainly for observations of the atmosphere and ocean. It will be launched in 2008. COMS has three major missions: weather monitoring; ocean monitoring; and satellite communication. The weather mission is especially useful for monitoring impending weather systems and tracing a storm’s location and evolution over great distances. The ocean mission is to monitor the marine environment around the Korean Peninsula, long-/short-term changes of marine ecosystems and to supply relevant users with fishery-related information (fields of chlorophyll-a,SST etc.). The satellite communication mission is an in-orbit test for the performance of advanced communication technologies and is conducting an experiment on wide-band multi-media communication services.
COMS (Figure 11) has two earth observing sensors: the Geostationary Ocean Color Imager (GOCI) for estimating chlorophyll-a concentration, SS, CDOM etc; and the Meteorological Imager (MI). GOCI, which has a spatial resolution of 500 m and a temporal resolution of 1 hour, will be used for monitoring red tides and variations in ocean color related to marine pollution.
Figure 10. KOMPSAT-II - Overview. Source: KARI
Figure 11. COMS - Overview. Source: KARI

Page 15
4.1.5 Meteor-3M #2 (Russia)
Meteor-3M #2 will be launched in 2006 (Figure 12). Observations of the ocean will be carried out with the use of several sensors, such as a visible-microwave scanner MTVZA-OK (4 channels in the visible range, 3 channels in the infrared range and 11 channels in the microwave range; swath width 2000 km), an optoelectronic multiband scanning device MSU-EU (3 visible bands, resolution 32 x 32 m), a medium resolution multiband scanning device MSU-S (2 visible bands, resolution 544 x 142 m), a scanning microwave sensor MIVZA (frequencies 20, 35 and 94 GHz) and a microwave scanning radiometer MTVZA (9 frequencies in the range 18.7 183.3 GHz; swath width 2600 km).
Figure 12. Meteor-3M - Overview. Source: RKA

Page 16
4.2 Algorithms for geophysical parameters
For the open ocean, estimation methods for SST and chlorophyll-a concentration by remote sensing have been developed and validated, to the level that they can be fully used for eutrophication monitoring. In coastal areas, however, the existing method for estimatingchlorophyll-a concentration is not yet accurate enough for practical use, as the effects of SS and CDOM in seawater and aerosols in the atmosphere, which are much greater than in the open ocean, still need to be accounted for. The NOWPAP Members are cooperating with various organizations to promote research that will implement eutrophication monitoring in coastal areas, where it is considered more useful than in the open ocean. Also, in order to establish high accuracy in monitoring, it is essential to improve the algorithms so that they reflect differences in the oceanic features of each sea area.
4.2.1 Sea surface temperature
The NGSST Development Group, with members from Tohoku University, NFRDI and other organizations, has been working on a new satellite-based SST product that overcomes the weakness of present operational SST products. The group developed the website ‘New Generation Sea Surface Temperature for Open Ocean Ver. 1.0 Real-time Demonstration Operation’ in June 2003. The new SST product, ‘Merged SST’, is generated from objectively merged SST data obtained from AVHRR, MODIS and AMSR-E, enabling the provision of proper SST data on a relatively small scale and with a quick response time (Figure 13). Currently, the NGSST is under development and is targeting coastal areas with a spatial resolution of 1 km and a distribution frequency of four times per day. This NGSST is a project of the Ocean Remote Sensing Programme of United Nations Educational, Scientific and Cultural Organization (UNESCO)/ The Intergovernmental Oceanographic Commission (IOC)/ IOC Sub-Commission for the Western Pacific (WESTPAC), and is supported by IOC and the Special Coordination Funds for Promoting Science and Technology for the ‘New Generation Sea Surface Temperature’ project.
Figure 13. New Generation Sea Surface Temperature on July 12, 2004.

Page 17
4.2.2 Chlorophyll-a concentration
In China, the Second Institute of Oceanography (SIO) and the National Marine Satellite Application Center collected many marine bio-optical in situ data sets. Those data sets have been subjected to HY-1A calibration and atmospheric correction. A neural network technique was used to estimate chlorophyll-a concentration.
After the launch of ADEOS-II at the end of 2002, EORC/JAXA made a calibration and verification for GLI to estimate chlorophyll-a concentration with in situ data of the East China Sea, the Ariake Sea, offshore of Sanriku, Tokyo Bay, Toyama Bay and others. In May 2004, the results were subjected to MODIS higher-level products to improve their accuracy. The improved algorithms were verified from ocean color observations by MODIS in the East China Sea from February to March 2004, and the estimated radiance spectrum and chlorophyll-a concentration agreed well with the in situ data (Figure 14). There was some discrepancy between the estimated values and the in situ data, which was due to an atmospheric correction error caused by aerosol absorption, and will be a future research topic (Murakami et al., 2004).
The Toyama Bay Project is on-going project that commenced in 2003. It aims to show the effectiveness of remote sensing as a monitoring technique for the marine environment. The project is conducted with the cooperation of the Ministry of the Environment of Japan, NPEC, Nagasaki University, Toyama University, Toyama Prefecture Fisheries Experimental Station and the Toyama Prefecture Environmental Science Research Center. In 2003, in situ surveys and accuracy verifications were conducted for SST and chlorophyll-a concentrations retrieved from AVHRR and MODIS data, respectively. In the fiscal year of 2004, the same surveys continued and more in situdata were obtained to improve the in-water algorithms that estimate chlorophyll-a concentration and SS. In order to demonstrate the effectiveness of remote sensing, the project will study past SeaWiFS data to understand interannual and seasonal variability of chlorophyll-a concentration in Toyama Bay.
X-axis shows in situ data. Y-axis shows data estimated by MODIS. Red dots show Terra. Blue dots show Aqua.
Figure 14. Comparison between in situ and estimated data (Murakami et al., 2004).

Page 18
4.2.3 Primary productivity
Asanuma (2004) proposed a depth and time resolved primary productivity model and validated it with in situ data. In the model, a vertical distribution of PAR is based on the chlorophyll-aconcentration in the surface layer, where it is assumed that the surface chlorophyll-a concentration determines the light field. A vertical distribution of chlorophyll-a concentration is modeled with an empirical equation, in which a chlorophyll maximum is observed along the vertical distribution of PAR. A carbon fixation rate is modeled as a function of PAR and water temperature. Based on the model’s optimum vertical distribution of PAR for various combinations of chlorophyll-aconcentration and a diffused attenuation coefficient, the depth and time resolved primary productivity model indicated a good correlation between in situ and model estimated primary productivities. Figure 15 shows the global distribution of primary productivity that was estimated by applying this model to GLI data.
Kameda and Ishizaka (2005) suggested an improvement to one of the most important parameters of a much simpler model, the Vertically Generalized Production Model (Behrenfeld and Falkowski, 1997), with the assumption of a two-phytoplankton model. Yamada et al. (2005) verified Kameda and Ishizaka’s model with primary production data in the eastern NOWPAP Region and found that the model could be applied to the area, although the data were sparse. Yamada et al. (2005) also estimated the primary productivity in the area and showed interannual variability.
Figure 15. GLI Ocean Primary Productivity in May 2003. Source: EORC, JAXA

Page 19
4.2.4 Sea surface salinity
In the summers between 1998 and 2001, huge floods occurred in the Yangtze River in the eastern China. Low-salinity waters (< 28 PSU), caused by the input of fresh river waters, were observed around the southwestern part of the Jeju Island, located to the south of the Korean Peninsula. These waters caused severe damage to the Korean fisheries. A method to detect low-salinity water was suggested and tested in the summer of 1998 to 2001 using the revealed correlations between low salinity at the sea surface, turbid water from the Yangtze River and SeaWiFS data in the northern East China Sea (Figure 16; Suh et al., 2004a).
4.2.5 Others
Global and regional algorithms to retrieve SST, wind speed, total atmospheric water vapor content and total cloud liquid water content were developed using numerical experiments with a model of microwave radiative transfer in the ocean-atmosphere system and a database of oceanic and atmospheric parameters collected in the world. Computations of the brightness temperatures were carried out for AMSR/AMSR-E frequencies with vertical and horizontal polarizations. The simulated brightness temperatures and parameters (SST, wind speed, total atmospheric water vapor content and total cloud liquid water content) were used for retrieval algorithm development (Mitnik and Mitnik, 2003). Retrieval errors of geophysical parameters can be decreased by the application of neural networks-based algorithms (Zabolotskikh et al., 2000, 2004).

Page 20
125.0 125.5 126.0 126.5 127.031.5
32.0
32.5
33.0
33.5JejuN
E
6–8 August 1998 4 August 1998
12–20 August 1999 19 August 1999
125.0 125.5 126.0 126.5 127.031.5
32.0
32.5
33.0
33.5JejuN
E
4–6 August 2000 6 August 2000
125.0 125.5 126.0 126.5 127.031.5
32.0
32.5
33.0
33.5JejuN
E
28.0
17–23 August 2001 16 August 2001
in situ salinity Estimated salinity from SeaWiFS data
Figure 16. Sea surface salinity (PSU) in August, 1998-2001 (Suh et al., 2004a).
125. 125. 126. 126. 127.31.
32.
32.
33.
33.N
E
.
125. 125. 126. 126. 127.E31.
32.
32.
33.
33.N
125. 125. 126. 126. 127.31.
32.
32.
33.
33.N
E
125. 125. 126. 126. 127.31.
32.
32.
33.
33.N
E
125. 125. 126. 126. 127.31.
32.
32.
33.
33.N
E

Page 21
4.3 Validation of geophysical parameters
For algorithms under development that enable the estimation of geophysical parameters and the accuracy of their products, it is essential to have in situ data that are systematically and sufficiently collected and rationally maintained. In the NOWPAP Region, in situ data have been collected with cooperation from the North-East Asian Regional GOOS (NEAR-GOOS, GOOS: The Global Ocean Observing System) and other projects/organizations. They are used for the development and validation of algorithms designed for processing the GLI and AMSR-E data. Additionally, a system to efficiently acquire in situ data is being deployed.
4.3.1 GLI match-up analysis
The JAXA/EORC GLI ocean group has been validating various physical quantities estimated from GLI data by match-up data sets to recognize errors in higher-level products and to adjust parameters and improve the algorithms. Match-up data sets consist of in situ data and clipped data from GLI observed in the same position at the same or nearly the same time. These data sets are managed by JAXA. Some of the data can only be used for calibration and validation or algorithm development. Validated results of the product by match-up data are shown in Table 1. The results suggest that the accuracy of chlorophyll-a concentration is good overall, but not good enough in coastal waters. The results also suggest that CDOM is underestimated. This is probably due to differences in CDOM concentrations among the various target areas that occurred during algorithm development and validation.
Table 1. Summary of GLI Validation (version 1 products). (JAXA/EORC GLI Ocean Group, 2004 with modification)
Parametercode Parameter name Final
target Ver. 1
accuracy Notes
NWLR Normalized water-leaving radiance
-35% to +50%(offshore)
-50%to+100%(coastal area)
16(-47% (CH01-(09)84-(284%
(CH10(-12)
- Select vicarious calibration coefficients (vical coef.) of SeaWiFS Apr-Jul base
- bad results longer than 565 nm are due to low (<1/20) nLw over the ocean
- looks better than the early OCTS - effects from absorptive aerosol are not
eliminated
PAR photosynthetically available radiation
-10% to +10%(10 km/month) 11% - agrees well with SeaWiFS PAR and Tropical
Atmosphere Ocean (TAO) solar irradiance
CHLA Chlorophyll-a concentration
-35% to +50%(offshore)
-50% to+100%(coastal area)
130% - large scatter caused by coastal points - comparable quality to OCTS
CDOM colored dissolved organic matter absorption at 440 nm -50% to+100% (82%) - insufficient sample size (now increasing)
SS Suspended sediment concentration -50% to+100% (34%) - insufficient sample size
K490 Attenuation at 490 nm -35% to +50% (78%) - insufficient sample size (now increasing)
SST bulk sea surface temperature 0.6 K 0.6 K
- cloud detection problem - Electric noise on Middle and Thermal Infrared
(MTIR) image

Page 22
4.3.2 Project on Ocean Productivity Profiling System
The ‘Project on Ocean Productivity Profiling System’ aims to provide real-time data for estimating primary productivity by ocean color remote sensing (Saino, 2001). As shown in Figure 17, the underwater automatic escalation buoy is composed of a submerged winch below the euphotic zone and a measurement buoy that rises from the winch to the water’s surface. The measurement buoy has a Fast Repetition Rate Fluorometer (FRRF) and Profiling Reflectance Radiometer (PRR) for obtaining vertical profiles. The system can be kept at a calm depth to reduce the influence of waves and minimize biofouling. It can also transfer the acquired data in real time, and the winch can be controlled in real time by acoustic and radio communications. Model 1 has recently been repeatedly tested in the ocean.
Figure 17. Project on Ocean Productivity Profiling System (POPPS).
4.3.3 Improvement of the algorithm for chlorophyll-a concentrations in Case 2 waters
Given the diversity of dissolved and suspended material, the ocean is divided into Case 1 and Case 2 waters. In Case 1 waters, phytoplankton pigments and their covarying detrital pigments dominate the seawater’s optical properties. In Case 2 waters, other substances that do not covary with chlorophyll-a, such as SS, organic particles and CDOM, are dominant. Even though Case 2 waters occupy a smaller area of the world ocean than Case 1 waters, because they occur in coastal areas with large river runoffs and high densities of human activities such as fisheries, recreation and shipping, they are equally important (Martin, 2004).
Korean scientists have not been using a standard algorithm, such as the OC2 algorithm for the estimation of physical quantities in Case 2 waters, as in the turbid waters of the Yellow Sea and the western East China Sea. Research carried out in the NFRDI showed that reflectances retrieved from remote sensing data are different for Case 1 and Case 2 waters (Figure 18). They conducted the following activities to calibrate and validate ocean color products:
1) Accuracy validation of the current product targeting the East China Sea

Page 23
2) Development of an in situ data collection system using NEAR-GOOS 3) Development of an empirical equation for estimating chlorophyll-a concentration in Case 2
waters4) Comparison of OSMI- and SeaWiFS-derived chlorophyll-a concentration.
NFRDI collected 140 sets of match-up data. These data sets will be available to scientists of the NOWPAP Region in the near future.
Figure 18. SeaWiFS spectral bands for the CalCOFI reference data set ( ) and NFRDI February data ( ) in the East China Sea (Suh et al., 2001).

Page 24
4.3.4 Validation of SST retrieval algorithms using AMSR-E, NEAR-GOOS and POI GIS
Aqua AMSR-E and ADEOS-II Advanced Microwave Scanning Radiometer (AMSR) data sets were provided by JAXA with the cooperation of JAXA and POI FEB RAS in the ADEOS-II Research activity. Also, match-up data sets were prepared by JAXA and provided to Principal Investigators.
Comparison of satellite-derived and in situ data can be performed daily using POI GIS, as shown in Figure 19. Users select the area and period of observations and use GIS to download both the available AMSR-E and in situ data for SST, wind speed and wind direction. The GIS extracts this data from its databases and also from the NEAR-GOOS project database. The former contains the data collected on the NEAR-GOOS site through the Global Telecommunication System. The user then calls up SST and wind speed retrieval algorithms from the GIS analytical support system. The retrieved SST and wind speed fields are displayed in map windows of the GIS. Retrieval errors are computed by comparison of the satellite-derived and in situ values for each algorithm under investigation.
Figure 19. Validation of SST retrieval algorithms using AMSR-E, NEAR-GOOS and GIS POI.

Page 25
5 Introduction to the latest findings
The latest findings in marine environmental monitoring by remote sensing in the NOWPAP Region are classified into two categories: the understanding of oceanic phenomena, such as eutrophication, red tides, sea ice and sea wind using various remote sensing products; and the development/improvement of an algorithm to increase the accuracy of the product itself. In the category of oceanic phenomena understanding, findings are reported on seasonal changes in chlorophyll-a concentration and the monitoring of red tides and sea ice. In the category of algorithm development, study outcomes are reported, such as research on algorithms for Case 2 waters.
5.1 Monitoring of red tide/harmful algal blooms
A Japanese study reported an extensive harmful algal bloom (HAB) off the southeastern Vietnamese waters from late June to July 2002. Data were collected using in situ observations and analysis of the oceanographic conditions by satellite remote sensing. This study indicated that the HAB was induced and supported by offshore upwelling driven by strong winds through Ekman transport when the winds were parallel to the coastline, bringing nutrients from the deep ocean to the surface, as well as from the coastal water to offshore water. The study demonstrated the possibility of utilizing a combination of satellite data for chlorophyll-a concentration, SST and wind velocity, together with coastal bathymetric information and in situ observations, to give a better understanding of the biological oceanography of HABs (Tang et al., 2004).
In another study in Japan, seasonal and interannual variability of chlorophyll-a concentration in the NOWPAP Region was detected spatially by ocean color satellite remote sensing. The starting time of the spring bloom was spatially variable. The spring bloom started from south of the subpolar in March, moved north of the subpolar front, the Primorye coast and off Hokkaido in April, and into the middle of the Japan Basin in May. The start of the spring bloom showed interannual variability that corresponded to wind speed in the area. The results of the study indicated that the timing of the seasonal bloom in the NOWPAP Region is largely affected by variability in global climate, such as due to El Nino/Southern Oscillation (ENSO) events (Yamada et al., 2004).
In September 2003, a bloom of the harmful dinoflagellate, Cochlodinium polykrikoides Margalef, suddenly occurred in the NOWPAP region of the coastal areas around the Tottori and Hyogo prefectures of Japan. The species first bloomed in the area in 2002 but in 2003 was on a larger scale and caused huge damage to coastal fisheries. This bloom is the first record of aquatic animals, other than fishes, being killed by C. polykrikoides. Judging from the flow pattern of the Tsushima Current and images of remotely sensed SST and chlorophyll-a concentration, it has been suggested that this current contributed to the transport of the bloom. The bloom was so widespread that careful ongoing monitoring and observations are necessary to prevent recurrent damage to fisheries in the area (Miyahara et al., 2005).
In Korea, monitoring activities at NFRDI have been extended to include all the coastal waters of Korea since the 1995 outbreak of a C. polykrikoides bloom. Several alternative methods are being used, including climatological analysis and spectral and optical methods, which potentially enable the detection of the major red tide species in Korean waters. In the climatological analysis, anomalies in chlorophyll-a concentrations from satellite data during red tide outbreaks were similar to the distribution of C. polykrikoides during the red tide. The distribution of differences in sea surface temperatures during the day and night also indicate a possibility for red tide detection. The results from the optical absorption of C. polykrikoides in the ultraviolet band (340 nm) showed that the use of optical characteristics from each red tide will make red tide detection feasible (Suh et al.,2004b).
In Russia, maps were prepared using SeaWiFS data from January 1998 to December 2002 to show the mean monthly distributions of chlorophyll-a concentration, the particle backscattering and the

Page 26
yellow substance absorption coefficients. As the semi-analytical algorithm for the yellow substance absorption coefficient for sea areas in other regions is not applicable, due to large errors in atmospheric correction, a simplified semi-analytical algorithm for the coefficient has been specially developed and used for the NOWPAP Region. The algorithm is based on the use of the values of the normalized water-leaving radiance for the 510 nm band, chlorophyll-a concentration and the particle backscattering coefficient calculated from the SeaWiFS data (Kopelevich et al.,2003).
5.2 Monitoring of dynamic oceanic phenomena
In Japan, wind jets and wind waves off the Pacific coast of northern Japan during the East Asian winter monsoon were investigated using a Quick Scatterometer (QuikSCAT), a SAR of ERS-2 and altimeters of TOPEX/Poseidon and ERS-2. The study indicated the important role of coastal topography in air-sea interactions by tracking wind-wave developments (Shimada and Kawamura, 2004).
In Korea, temporal and spatial variation in the mesoscale cold core eddy in the East China Sea was studied using satellite remote sensing. The mechanism of cold core eddy formation was investigated using boundary conditions between the East China coastal cold water and the Kuroshio Warm Current, wind data related to the monsoon measured by QuikSCAT and the bottom topography of the East China Sea (Suh et al., 2004c).
Another study in Korea has provided evidence that the changes in oceanic environmental conditions are useful indices for predicting stock structure and distribution of the Pacific saury (Cololabis saira). To do this, body length compositions and catch per unit fishing effort were examined in relation to SST anomalies in the Tsushima Warm Current region (Gong and Suh, 2003).
In Russia, the Scientific Research Centre ‘Planeta’ has developed technology for the routine mapping and long-term characteristics of ice cover by processing current and archival satellite information. The construction of ice condition maps was carried out using a multifunction ‘PlanetaMeteo’ program system (Trenina, 2004).
In another Russian study, the possibility and efficiency of using regular all-weather, high-precision combined data of altimeters of TOPEX/Poseidon and ERS-2 to study the structure and dynamics of the fronts in the southern part of the Indian Ocean was investigated. Mesoscale-level variability related to the fronts was demonstrated. Data with high spatial resolution and uniform representation of the entire basin enables ocean-scale synoptic charts of the ocean dynamic level to be built, indicating a significant advantage of the altimetry information compared to hydrographic surveys (Kostianoy et al., 2004).
5.3 Development of algorithms
In China, a genetic algorithm for the retrieval of water constituents from ocean color remote sensing data in Case 2 waters was developed. A genetic algorithm was developed as a global optimization scheme to simultaneously retrieve chlorophyll-a concentration, SS and yellow substance. Under noise-free conditions, three water constituents can be estimated accurately. Tests with noisy data show that the algorithm is robust against errors in reflectance data.
China has also developed a semi-analytical inversing model of water transparency using the theory of radiative transfer in water. Using this inversing model of water transparency and SeaWiFS data, serial images of water transparency distribution were generated with monthly averages for China’s seas in 1999.
A practical atmospheric correction algorithm for SeaWiFS was presented by researchers in China, which is based on the radiative transfer models and in situ data. As the atmospheric conditions above Case 1 waters are used for Case 2 waters, the correction model can be used to process SeaWiFS data for coastal areas where NASA’s model often fails in atmospheric correction. This

Page 27
model also solves the problem of the negative for the water-leaving radiance of the SeaWiFS 412 and 443 nm bands.
A temperature error control technology for an operational satellite application system was developed in China, employing standard reference temperature images to detect any temperature abnormalities. This method can efficiently detect a temperature abnormality, so as to remove abnormally low values of SST and improve the accuracy of satellite measured SST. It has been used for drawing fishery chart products in the North Pacific.
In Korea, two new methods, path-extraction and the spectral shape matching method (SSMM), have been introduced for the correction of atmospheric effects in Landsat imagery for the retrieval of meaningful information about ocean color, especially from Case 2 waters around the Korean Peninsula. The results of these methods were compared with classical atmospheric correction approaches based on the 6S radiative transfer model and standard SeaWiFS atmospheric algorithm. Validation suggested that the accurate retrieval of water-leaving radiance is not feasible using the invalid assumptions of classical algorithms, but is feasible with SSMM. The potential advantage of this method is that it can be easily adopted for any satellite optical imagery over any region of interest (Ahn and Shanmuganm, 2004).
Page 28
6 Strategies/Plans for remote sensing related activities
Now that the use of marine environmental monitoring by remote sensing has increased, it is vital to distribute products to users within and between countries and to strengthen cooperation between researchers for the faster development of satellites/sensors and algorithms. Remote sensing related activities are well in advance and are continuously conducted in the NOWPAP Region, and opinions and recommendations for further development have been voiced at the ‘International Workshop on Remote Sensing of the Marine Environment in the Northwest Pacific Region Workshops’, organized by NPEC since 1999.
6.1 China
In order to promote the application of remote sensing technologies into marine environmental monitoring, a Satellite Data Website is being constructed, and is sponsored by China central governments through the National Platform for Scientific Data Sharing Program. This website provides MODIS images and related higher-level products of China’s coastal areas in real time, including SST, chlorophyll-a concentration, and SS. At present, the dataset only covers the coastal areas, but more images will be added.
As part of a comprehensive marine environmental harnessing plan in China, the following programs are in place: (1) Bohai environmental monitoring and harnessing; (2) the China East Sea environmental monitoring system; and (3) the China coastal zone investigation. Also, two systems are in operation as a coastal hazard monitoring warning system. One is oil spill monitoring and detection system over the China seas, which was developed in 1998 by SOA. This system has successfully monitored several heavy oil spills over the Bohai Sea and the East Sea. The second system is a storm-surge monitoring system, which was developed in 1988 by the Dongying city government as a defense against the invasion of storm surges in the Yellow River.
6.2 Japan
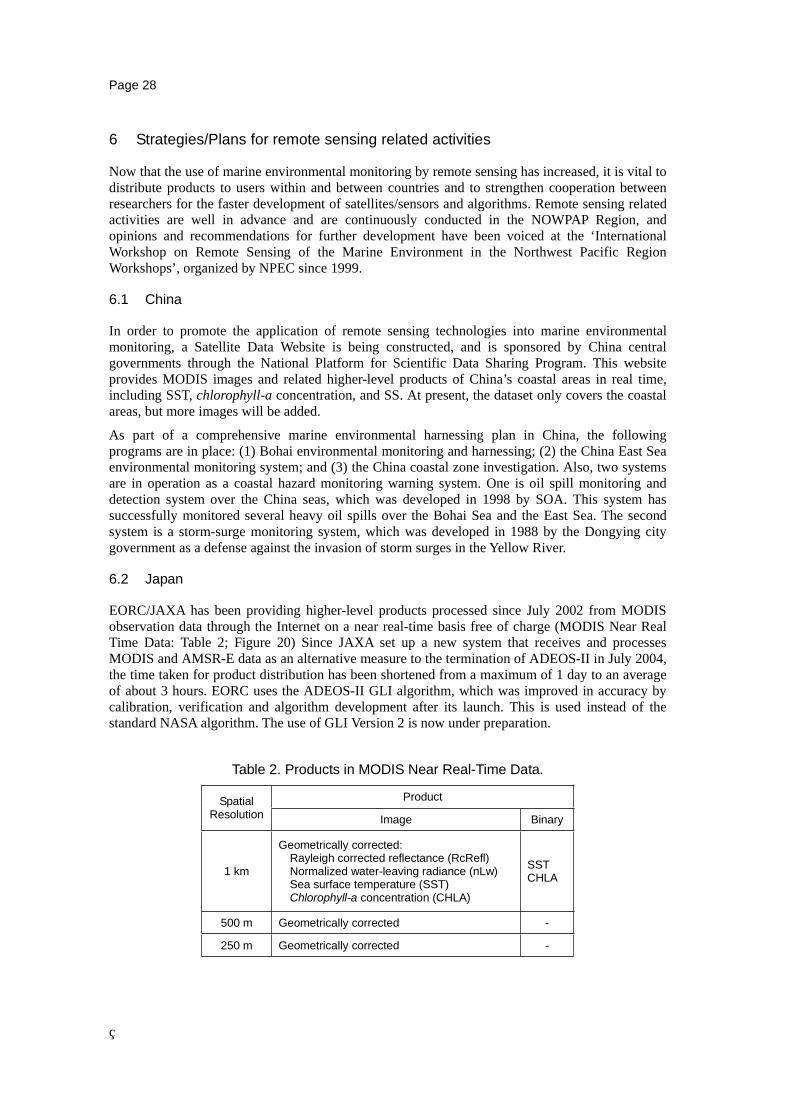
EORC/JAXA has been providing higher-level products processed since July 2002 from MODIS observation data through the Internet on a near real-time basis free of charge (MODIS Near Real Time Data: Table 2; Figure 20) Since JAXA set up a new system that receives and processes MODIS and AMSR-E data as an alternative measure to the termination of ADEOS-II in July 2004, the time taken for product distribution has been shortened from a maximum of 1 day to an average of about 3 hours. EORC uses the ADEOS-II GLI algorithm, which was improved in accuracy by calibration, verification and algorithm development after its launch. This is used instead of the standard NASA algorithm. The use of GLI Version 2 is now under preparation.
Table 2. Products in MODIS Near Real-Time Data.
ProductSpatial Resolution Image Binary
1 km
Geometrically corrected: Rayleigh corrected reflectance (RcRefl) Normalized water-leaving radiance (nLw) Sea surface temperature (SST) Chlorophyll-a concentration (CHLA)
SST CHLA
500 m Geometrically corrected -
250 m Geometrically corrected -

Page 29
Figure 20. MODIS Near Real-Time Data. <http://kuroshio.eorc.nasda.go.jp/ADEOS/mod_nrt/>
The ‘International Workshop on Remote Sensing of the Marine Environment in the Northwest Pacific Region’ aims to contribute to the development of marine environmental monitoring technologies derived from remote sensing. The first workshop (Toyama, March 2000) recommended that NOWPAP and NPEC should organize regular workshops and training courses, as well as promote the development of real-time information systems for the NOWPAP Region. The second workshop (Toyama, March 2002) focused mainly on ocean color remote sensing and the importance of Japan’s leadership in this field. The third workshop was held in October 2004 in Beijing.
The ‘Red Tide Watcher Project’, presented by Japanese scientists, is a 3-year project that started in October 2002. The project’s primary aim is for the establishment of red tide monitoring infrastructure based on a mutual understanding among related countries, including the integration of existing efforts and the latest technology, such as remote sensing. In March 2003, a workshop was held that combined the international ocean color satellite and red tide symposia, in which researchers of remote sensing and red tides from Asia, Europe and America gathered to share their common understandings, and present conditions and issues regarding the establishment of a red tide monitoring system. The Red Tide Watcher Project initiated an international ocean color observation forum to promote partnership among organizations and specialists relating to red tides, the marine environment and the remote sensing of ocean color along the Asian coast (Red Tide Watcher Project, 2003). The second workshop was held in March 2005.
6.3 Korea
NFRDI is going to set up a new system for analyzing Orbview-3 and the Multi-functional Transport Satellite (MTSAT) in 2004 and 2005. OrbView-3, launched in 2003, is among the world’s first commercial satellites to provide very high resolution imagery from space, with 1 m resolution panchromatic and 4 m resolution multi-spectral imagery. MTSAT series fulfills two functions: a meteorological function for the Japan Meteorological Agency (JMA); and an aviation control function for the Civil Aviation Bureau of the Ministry of Land, Infrastructure and Transport. The MTSAT series will succeed the GMS series as the next generation satellite series covering the East Asia and the Western Pacific regions.
Domestic and international research cooperation is to be promoted in product delivery/distribution

Page 30
systems and in holding workshops. The first Korean experts meeting of marine satellite remote sensing was held in NFRDI, March 2004, and 10 Korean experts in satellite remote sensing attended. The agenda of the meeting included red tide monitoring, ocean physical application and ocean color application. The second meeting was held in NFRDI, April 2005.
The marine remote sensing subcommittee was established under the Korean Society of Oceanography in May 2004. The International Symposium on Remote Sensing 2004 & 20th Anniversary of the Korean Society of Remote Sensing was held in Jeju, in October 2004. The second Japan-Korea Workshop on ocean color remote sensing (JKWOC-II) was held in KORDI in December 2004.
Several ocean color research activities are also underway at NFRDI, KORDI, KARI and Pukyung National University. NFRDI has established a satellite data receiving station (IRS-P4, MODIS and NOAA) and Fisheries environmental monitoring program under MOMAF, its major applications being the delineation of fishing ground information. Ocean color research activities are promoted at three laboratories established within KORDI, and they are working on ocean optics, ocean color remote sensing technique development (including atmospheric correction) and physical/chemical ocean application. At KARI, OSMI and MODIS, data reception and management are implemented. Pukyung National University conducts research into developing applications of coastal ocean monitoring by aircrafts.
6.4 Russia
The information system ‘Sputnik’ has been under development in the Scientific Research Center ‘Planeta’ since 1997. It is a joint project of ‘Planeta’ and the Russian Space Research Institute RAS (IKI). The aim of the system is primarily to organize different archives of raw satellite data. The main task of ‘Sputnik’ is to provide information about Russian weather satellites, NOAA satellites and so on. Fully automatic complexes for receiving, processing and presenting satellite data have been produced.
A system of fishery monitoring to control fisheries in the Far Eastern region has been developed. The system is common to an all-branch monitoring system and includes three subsystems: environment; fishery objects; and fishery fleet. Satellite observation is the central part of the system. The basic information in the system are the maps of SST and ice conditions derived from NOAA, and locations of fishery ships from NavStar. These information are exchanged between their ships and monitoring centers by INMARSAT.
Since January 2001, the ‘Uragan’ (Hurricane) program by the Russian segment of the International Space Station has been devoted to land-surface monitoring for natural resource surveys, environmental protection and for understanding the dynamics of natural and man-made disasters. The scientific supervision of the ‘Uragan’ program is handled by the Geographical Institute RAS. Changes in the ‘Uragan’ program have been implemented since 2004. Before then, the program aimed to solve scientific and methodological tasks. Now, it is directed to solve tasks formulated by administrations of different levels, state and private enterprises as well as by scientific and educational centers.
In accordance with the decision of the III Intergovernmental Summit of the Remote Sensing of the Earth (Tokyo, April 2004), an international space program of global observation of the Earth is planned. The second all-Russia conference ‘Current Aspects of Remote Sensing of the Earth from Space (physical basics, methods and monitoring technologies of an environment, potentially of dangerous phenomena and objects)’ was conducted at the Space Research Institute of the Russian Academy of Sciences (SRS RAS) in November 2004, which involved discussions to develop the scientific concepts and the programs of this global monitoring. The third conference will be at the SRS RAS in November 2005.
Page 31
7 Challenges and prospects
7.1 Real-time performance and continuity of observations
To proceed with the development of algorithms for practical use, infrastructure establishment and subsequent project formation, it is necessary to achieve real-time performance that provides status and continuity of the observations so that long-term variation can be understood. Real-time performance, such as ‘MODIS Near Real Time Data’ by JAXA and ‘Operation of Application System to Produce Ocean Information derived from Earth Observation Satellites’ by NFRDI, is ready for practical use and is expected to provide products in the near future. The continuity will be achieved in more than 10 years from now by observation plans, such as the Global Change Observation Mission (GCOM) of JAXA, KOMPSAT-II/COMS of KARI, and the National Polar-orbiting Operational Environment Satellite System (NPOESS) Preparatory Project of NASA that follow the currently operating SeaWiFS, OSMI and MODIS. However, to analyze long-term variations using products of OCTS, SeaWiFS, MODIS and GLI, product compatibility between sensors will be an issue due to the inevitable changes in sensors.
GCOM consists of a two-satellite series: GCOM-W, a sea surface observation mission with AMSR F/O and a scatterometer; and GCOM-C, an atmospheric and terrestrial observation mission with a second generation GLI (S-GLI). The S-GLI is a sensor that is expected to contribute to environmental monitoring in coastal areas with high resolution observations at 250 m. The first GCOM-C is considered to be launched in 2011.
7.2 Ocean color remote sensing in coastal areas
In ocean color remote sensing by OCTS, SeaWiFS, GLI and MODIS, and OSMI, the estimation algorithm of chlorophyll-a concentration that targets the open ocean is nearly complete and ready for practical use. However, issues still remain for targeting the coast. The relationship between ocean color and materials in coastal seawater is not as simple as in the open ocean, due to the influence of SS and CDOM on the optical characteristics of seawater, and also due to the influence of absorbing aerosols. For example, a new algorithm that applies neural networks to the in-water algorithm and atmospheric correction is currently under development to solve these issues. To further increase accuracy, region-specific algorithm development should supplement the current practice of using a uniform algorithm.
7.3 Collection of in situ data
In developing the algorithm for ocean color remote sensing in coastal areas, it is desirable to have enough in situ data to verify/calibrate estimated data obtained from satellites and to understand optical attributes, such as chlorophyll-a, SS and CDOM, of the target sea area. However, as the insitu data currently available in the NOWPAP Region are very limited in time and space, the collection of such data should be promoted actively, together with the development of algorithms. Also, the specification of in situ data should be optimized to reflect the operation of satellites installing new types of sensors.
7.4 Improvement of spatial and temporal coverage
For the operational use of eutrophication monitoring by ocean color remote sensing, and oil spill monitoring by microwave remote sensing, an intense spatial and temporal coverage (shorter revisit time) is required.
Page 32
7.5 Continuous development of algorithms and applications of satellite data
Continuous support is required for research activities regarding the development of algorithms for geophysical parameter retrieval, the expansion of satellite data applications and the enhancement of collaboration between NOWPAP Member researchers.
7.6 Education and public awareness
Effects on marine environment are mainly caused by land based human activities. To promote conservation of marine environment, it is important to understand and raise public awareness on the situations such as eutrophication and oil spills, and acknowledge the importance of the marine environment and what can deteriorate it. In this regard, remote sensing by satellite has advantageous features such as (1) wide surface coverage, (2) continuous and regular monitoring, and (3) borderlessness, which enables effective understanding and presentation of conservation needs, compared to monitoring by vessels or buoys. Parallel to advancing technological developments, presenting above-mentioned advantages and promoting the efforts for practical uses of remote sensing in the NOWPAP Region would be necessary.
7.7 Combined use of satellite data and other relevant information
Remote sensing by satellite is known to be able to capture marine information such as SST, ocean color, oil spills, and sea surface wind. Chlorophyll-a concentration, SS, and CDOM can be estimated from ocean color. NOWPAP WG4 is working on realizing the monitoring of eutrophication and oil spills using these data sets, but there are also other various marine environment problems frequently reported in the NOWPAP Region, such as coastline erosion. It would be necessary to assess the possibility of utilizing remote sensing technologies to solve such marine environment problems, by finding out the relationship between accumulated information on these issues and remote sensing data.

Page 33
8 Suggested activities for the NOWPAP Region
As a project, NOWPAP does not have any plans for the new installation of satellites/sensors, observation systems or analysis systems. NOWPAP Members that have already installed or are going to introduce such equipment/facilities are expected to construct cooperative monitoring network systems with their own equipment/facility. Given this, the following points are the proposed future activities for the NOWPAP Region.
8.1 Refinement of guidelines being prepared by the NPEC for local governments
The NPEC has been working on a project called the ‘Toyama Bay Project’ since 2002, in order to evaluate the usefulness of coastal zone eutrophication monitoring using ocean color satellite data, and recognizing that the distribution of chlorophyll-a is a good indicator of eutrophication. It is of great importance to share results and lessons from the project toward the establishment of cooperation monitoring, as it is the final goal of NOWPAP Working Group 4 (WG4).
A draft guideline for the monitoring of eutrophication in coastal areas using satellite data is under development by the NPEC, which is intended to be a basis for establishing common methods for evaluating and using satellite data for cooperative environmental monitoring in the NOWPAP Region, taking into account the results and issues raised in the ‘Toyama Bay Project’.
8.2 Enhancement of the technical training program
In order for NOWPAP Members to effectively help each other in the technical aspects of remote sensing, it is necessary to offer a training program on remote sensing data processing and analysis and its application to marine and coastal environment monitoring. The duration of the training program will be 1 week and is designed for young researchers, students and local government officers involved in any aspect of marine and coastal environment monitoring.
8.3 Development of remote sensing information network
During discussions at the first meeting of NOWPAP WG4 and the second CEARAC Focal Points Meeting (FPM), it was pointed out that common understanding and information sharing should be promoted on application and interpretation, the status and future prospects of research and development, and the real use of remote sensing in marine environmental monitoring. Based on such observations, NOWPAP WG4 considered the development of a remote sensing information network and started a portal site on the Internet. However, the portal site’s role of navigating locations of scattered information and data is limited in its quality and quantity, and the remote sensing information network requires constant updating to be useful. Thus, it is necessary to consider step-by-step procedures to develop a remote sensing information network, taking account of realistic limitations, such as development cost, content provision and so on. The portal site is now in operation to review and provide locations of scattered information and data. The next step is the development of a digital library that also provides information and data, based on the Marine Environmental Watch Project.

Page 34
8.4 Sustainable ocean observing system and regional cooperation
During the Earth Observation Summit II (Tokyo, April 2004), the Group on Earth Observations (GEO) adopted the position that observing and understanding the earth more completely and comprehensively will expand worldwide capacity and a means to achieve sustainable development. It will also yield advances in many specific areas of socioeconomic benefit, including: (1) reducing loss of life and property from natural and human-induced disasters; (2) understanding environmental factors affecting human health and well being; (3) improving the management of energy resources; (4) understanding, assessing, predicting, mitigating and adapting to climate variability and change; (5) improving water-resource management through a better understanding of the water cycle; (6) improving weather information, forecasting and warnings; (7) improving the management and protection of terrestrial, coastal and marine ecosystems; (8) supporting sustainable agriculture and combating desertification; and (9) understanding, monitoring and conserving biodiversity (GEO, 2004). The implementation of NOWPAP activities, including monitoring eutrophication and oil spills, should be made with due consideration of these social benefits.
GOOS has been developed by UNESCO/IOC, the United Nations Environment Programme (UNEP), the World Meteorological Organization (WMO) and the International Council for Science (ICSU). Its coastal module is designed by an advisory group, the Coastal Ocean Observations Panel, and its strategic design plan is now available (UNESCO, 2003). The sustainable coastal observing system should have the ability to rapidly detect and provide timely predictions of changes in a broad spectrum of marine phenomena that affect: (1) the safety and efficiency of marine operations; (2) the susceptibility of human populations to natural hazards; (3) the response of coastal ecosystems to global climate change; (4) public health and well being; (5) the state of marine ecosystems; and (6) the sustainability of living marine resources. Because of these overlapping working areas between GOOS/COOP and NOWPAP, cooperative activities in the development of the regional ocean observing system should be promoted.
The National GOOS Programmes and GOOS Regional Alliances (GRAs) provide the primary venue for identifying user groups, specifying data and information requirements and refining data products over time based on user feedback and new knowledge. NEAR-GOOS is one of the GRAs supported by IOC/WESTPAC. Because of the overlapping working areas between GOOS and NOWPAP, cooperative activities in the development of the regional ocean observing system need to be promoted.
8.5 Search for other possible uses of satellite remote sensing for environmental monitoring in the NOWPAP Region
Activities of NOWPAP WG4 have been implemented to date based on the agreement at the second CEARAC FPM that eutrophication and oil spills be the main targets of marine and coastal environmental monitoring by remote sensing. At the same time, it is also necessary to examine the feasibility of monitoring for other environmental issues of concern in coastal areas of the NOWPAP Region, such as coastal erosion and the influence of pollution loads from rivers.

Page 35
9 Summary and recommendations
9.1 Summary
1) Remote sensing technology is feasible for the monitoring of eutrophication and oil spills of the NOWPAP Region through the interplay of ship, buoy, airborne and satellite observations.
2) Previous, present and planned satellite sensors from both NOWPAP and non-NOWPAP Members are useful, and the continuation of carefully planned satellite programs along with ground-truth data collection are necessary.
3) Chlorophyll-a concentration measured by ocean color remote sensing for open ocean eutrophication monitoring is ready for operational use.
4) Chlorophyll-a concentration measured by ocean color remote sensing for coastal eutrophication monitoring is also useful, but careful evaluation of data quality is required for use at a regional level, and further refinement of the algorithm is necessary for some regions.
5) Red tides, suspended matter and organic matter are promising material for coastal eutrophication monitoring, but refinement of the algorithms is necessary.
6) Monitoring of eutrophication and oil spills by satellite remote sensing is feasible, but detailed and vast spatial and temporal coverage is necessary for its operational use.
7) Continuous support for research activities on algorithm development, the expansion of satellite data applications, and the enhancement of collaborations between researchers in NOWPAP Members is needed.
8) Use of satellite data by local governments in each NOWPAP Member should be encouraged. The guidelines for eutrophication monitoring from space being prepared by NPEC are useful and should be refined.
9) Public education about the usefulness of remote sensing technology should be encouraged. Information on CEARAC activity associated with environmental monitoring and education should be sent to local governments and published in local newspapers to raise public awareness.
10) Support for the integration efforts of satellite and other data between NOWPAP Members is necessary.
9.2 Recommendations on activities of WG4 for next two years
1) Refinement of the guidelines being prepared by NPEC for local governments of each country.
2) Training of young researchers, students, and officers of local governments, including a possible dedicated cruise.
3) Further development of a portal site, a web site on oil spill monitoring by remote sensing and an environmental watch system, including a reference database and digital library.
4) Joint activities with the IOC/WESTPAC ocean color project.
5) Search for other possible uses of satellite remote sensing for environmental monitoring in the NOWPAP Region.

Page 36
References
Ahn Y.H. and P. Shanmuganm (2004): New methods for correcting the atmospheric effects in Landsat imagery over turbid (Case-2) waters. Korean J Remote Sens., 20, 5, 1-11.
Asanuma I. (2004): Primary Productivity Model based on satellite measurement. Proc. The Third International Workshop on Marine Remote Sensing in Northwest Pacific Region.
Asanuma, I., K. Matsumoto, H. Okano, T. Kawano, N. Hendiarti, and S. I. Sachoemar (2003): Spatial distribution of phytoplankton along the Sunda Islands: The monsoon anomaly in 1998. J. Geophys. Res., 108(C6), 3202.
Behrenfeld, M.J., and P.G. Falkowski (1997): Photosynthetic rates derived from satellite-based chlorophyll concentration. Limnol. Oceanogr., 42, 1-20.
GEO (2004): From Observation to Action - Achieving Comprehensive, Coordinated, and Sustained Earth Observations for the Benefit of Humankind, Framework for a 10-Year Implementation Plan. Earth Observation Summit II.
Gong Y., Y.S. Suh (2003): Effect of the Environmental Conditions on the Structure and Distribution of Pacific Saury in the Tsushima Warm Current Region, Korean J. Environ Sci,12, 11, 1137-1144.
Ishizaka, J., A. Tanaka, H. Sasaki, H. Murakami, W.Z. Chen, K. Hosoda, K. Sasaoka, I. Asanuma, H. Kawamura, M. Toratani, H. Fukushima, R.J. Frouin and G.B. Mitchell (2004): Early scientific results of GLI ocean. Sensors, Systems, and Next-Generation Satellites VII. R. Meynart, S.P. Neeck, H. Shimoda, J.B. Lurie, M.L. Aten (eds), Proceedings of SPIE, 5234, 525-530.
Ishizaka, J., Y. Kitaura, Y. Touke, H. Sasaki, A. Tanaka, H. Murakami, T. Suzuki, K. Matsuoka and H. Nakata (2005): Satellite Detection of Red Tide in Ariake Sound, 1998-2001. J. Oceanogr.,in press.
JAXA/EORC GLI Ocean Group (2004): Development and application study of GLI ocean product (in Japanese). In: Ocean Home GLI EORC JAXA.
Kameda, T. and J. Ishizaka (2005): Size-fractionated primary production estimated by a two-phytoplankton community model applicable to ocean color remote sensing. J. Oceanogr.,61, 663-672.
Kawamura, H., and the OCTS-team (1998): OCTS mission overview. J. Oceanogr., 54, 383-399.
Kopelevich, O.V., V.I. Burenkov, S.V. Sheberstov, S.V.Vazyulya, E.A.Lukianova and M.A. Evdoshenko (2003): Mean monthly distributions of bio-optical characteristics in the Barents, White, Caspian, Black and Japan Seas from the data of the SeaWiFS satellite ocean color scanner. In: P.P.Shirshov Institute of Oceanology, RAS.
Kostianoy, A.G., S.A. Lebedev, K.Ts. Litovchenko, S.V. Stanichny and O.E. Pichuzhkina (2004): Satellite remote sensing of oil spill pollution in the southeastern Baltic Sea. Gayana, 68, 2, 327-332.
Martin, S. (2004): An Introduction to Ocean Remote Sensing. Cambridge University Press.
Mitnik, L.M. (2003): Microwave sensing of the ocean-atmosphere system: current state and outlooks (in Russian). Vestnik DVO., 3, 47-55.
Mitnik, L.M. and M.L. Mitnik (2003): Retrieval of atmospheric and ocean surface parameters from ADEOS-II AMSR data: comparison of errors of global and regional algorithms. Radio Sci., 38, 4, 8065.
Murakami, H., K. Sasaoka, K. Hosoda, B. G. Mitchell, R. Frouin, J. Ishizaka, A. Tanaka, H. Sasaki,
Page 37
S. Saitoh, K. Yokouchi, Y. Kiyomoto, and K. Matsumoto (2004): Version Up of Near Real-time High Level Processing of MODIS data around Japan (in Japanese). In: MODIS Near Real Time Data.
Miyahara, K., R. Uji, H. Yamada, Y. Matsui, T. Nishikawa, and G. Onitsuka (2005): A harmful bloom of Cochlodinium polykrikoides Margalef (Dinophyceae) in the coastal area of San-in, western part of the Japan Sea, in September 2003. Bull. Plankton Soc. Japan, 52, 1, 11-18.
NPEC (2003): The Second International Workshop on Remote Sensing of the Marine Environment in the Northwest Pacific Region, Summary Report.
Pan Delu (2004): The progress of Chinese ocean environment remote sensing in last 3 years, Proc. The Third International Workshop on Marine Remote Sensing in Northwest Pacific Region.
Red Tide Watcher Project (2003): Workshop on Red Tide Monitoring in Asian Coastal Waters, Program and Extended Abstracts.
Saino, T. (1998): Forward of Special Issue of ADEOS Field Campaign off Sanriku/North Pacific, J.Oceanogr., 54, 5, 381-382.
Saino, T. (2001): Project on Ocean Productivity Profiling System: Outline (in Japanese). Abstract Volume of Autumn Meeting of Oceanographic Society of Japan, 210.
Shimada, M., H. Oaku, Y. Mitomi, H. Murakami, A. Mukaida, Y. Nakamura, J. Ishizaka, Kawamura,H. T. Tanaka, M. Kishino, and H. Fukushima (1998): Calibration and validation of the ocean color version-3 product from ADEOS OCTS. J. Oceanogr., 54, 401-416.
Shimada, T., and H. Kawamura (2004): Wind jets and wind waves off the Pacific coast of northern Japan under winter monsoon captured by combined use of scatterometer, SAR and altimeter. J. Geophys. Res., 109, C12027.
Suh, Y.S., B.G. Mitchell, L.H. Jang, S.G. Lee, and S.J. Yoo (2001): Calibration and Validation of Ocean Color Satellite Imagery (in Korean). Korean J. Environ. Sci., 10, 6, 431-436.
Suh, Y.S., L.H. Jang, and N.K. Lee (2004a): Detection of low salinity water in the northern East China Sea during summer using ocean color remote sensing. Korean J. Remote Sens., 20, 3, 1-11.
Suh, Y.S., L.H. Jang, N.K. Lee, and J. Ishizaka (2004b): Feasibility of red tide detection around Korean waters using satellite remote sensing. J. Fish. Sci. Tech., 7, 3, 148-162.
Suh, Y.S., L.H. Jang, N.K. Lee, Y.H. Ahn and H.J. Yoon (2004c): Temporal and Spatial Variation of the Mesoscale Cold Core Eddy in the East China Sea Using Satellite Remote Sensing (in Korean). Korean J Remote Sens., 20, 4, 1-11.
Tang, D.L., H. Kawamura, H. Doan-Nhu, and W. Takahashi (2004): Remote sensing oceanography of a harmful algal bloom off the coast of southeastern Vietnam. J. Geophys. Res., 109, C03014.
Trenina, I.S. (2004): Space monitoring of ice cover for operational mapping and long-term investigations (in Russian). In: Actual problems of Space remote sensing of Earth. E.A. Lupyan and O.Yu. Lavrova (eds.), Moscow, Poligraph service Publishing House, 303-313.
UNESCO (2003): The Integrated, Strategic Design Plan for the Coastal Ocean Observations Module of the Global Ocean Observing System. In: GOOS Report No.125
Wilson, W.S., J.-L. Fellous, H. Kawamura and L. Mitnik (2005): A History of Oceanography from Space. In: Manual of Remote Sensing, Vol.7, Marine Environment. John Wiley & Sons Inc., in press.
Yamada, K., J. Ishizaka, S. Yoo, H.-C. Kim, and S. Chiba (2004): Seasonal and interannual variability of sea surface chlorophyll-a concentration in the Japan/East Sea (JES). Prog. Oceanogr., 61, 193-211.

Page 38
Yamada, K., J. Ishizaka and H. Nagata (2005): Spatial and temporal variability of satellite estimated primary production in the Japan Sea from 1998 to 2002. J. Oceanogr., 61, 857-869.
Zabolotskikh, E.V., L.M. Mitnik, L.P. Bobylev and O.M. Johannessen (2000): Development and validation of algorithms for sea surface wind speed retrieval from SSM/I data with using neural networks and physical constrains (in Russian). Earth Obs. Remote Sens., 9, 43-55.
Zabolotskikh, E.V., L.M. Mitnik, L.P. Bobylev and O.M. Johannessen (2004): Neural network algorithms for retrieval of the ocean-atmosphere system parameters from microwave satellite sensing data (in Russian). In: Actual problems of Space remote sensing of Earth. E.A. Lupyan and O.Yu. Lavrova (eds.) Moscow, Poligraph service Publishing House, 447-458.
ALOS@EORC <http://www.eorc.jaxa.jp/ALOS/>
EORC <http://www.eorc.jaxa.jp/en/index.html>
JAXA <http://www.jaxa.jp/index_e.html>
JMA <http://www.jma.go.jp/JMA_HP/jma/indexe.html>
KARI <http://www.kari.re.kr/>
KORDI <http://www.kordi.re.kr/eng/index.asp>
Marine Environmental Watch Project <http://www.nowpap3.go.jp/jsw/eng/index.html>
Marine Remote Sensing Laboratory, NFRDI <http://www.nfrda.re.kr/korea/mrsl/data_mrsl.htm>
MODIS Near Real Time Data <http://kuroshio.eorc.jaxa.go.jp/ADEOS/mod_nrt/> (in Japanese)
NFRDI <http://www.nfrdi.re.kr/home/eng_nfrdi/>
New Generation SST for Open Ocean Ver.1.0 Real-time Demonstration Operation <http://www.ocean.caos.tohoku.ac.jp/~merge/sstbinary/actvalbm.cgi?eng=1>
Ocean Home GLI EORC JAXA <http://suzaku.eorc.jaxa.jp/GLI/ocean/>
Oil spill monitoring in the NOWPAP Region, POI <http://cearac.poi.dvo.ru/>
ORBIMAGE Inc. <http://www.orbimage.com/>
P.P. Shirshov Institute of Oceanology, RAS <http://manta.sio.rssi.ru/>
RKA <http://www.federalspace.ru/> (in Russian)
SOA <http://www.soa.gov.cn> (in Chinese)

Page 39
List of acronyms
6S Second Simulation of the Satellite Signal in the Solar Spectrum ADEOS Advanced Earth Observing Satellite ALOS Advanced Land Observing Satellite AMSR Advanced Microwave Scanning Radiometer AMSR-E Advanced Microwave Scanning Radiometer for Earth Observing System ASAR Advanced Synthetic Aperture Radar AVHRR Advanced Very High Resolution Radiometers AVNIR-2 Advanced Visible and Near Infrared Radiometer type-2 CalCOFl California Cooperative Oceanic Fisheries Investigations CAS Chinese Academy of Sciences CBERS China Brazil Earth Resources Satellite CCD Charge-coupled Device CDOM Colored Dissolved Organic Matter CEARAC Coastal Environmental Assessment Regional Activity Center CMODIS Chinese Moderate Imaging Spectra Radiometer COCTS Chinese Ocean Color and Temperature Scanner COMS Communication Ocean and Meteorology Satellite COOP Coastal Ocean Observations Panel CVI Corrected Vegetation Index CZI Coastal Zone Imaging ENSO El Nino/Southern Oscillation ENVISAT Environment Satellite EOC Electro Optical Camera EORC Earth Observation Research and application Center (Japan) ERS-1 (2) European Remote Sensing Satellite-1 (2) ESA European Space Agency ETM+ Enhanced Thematic Mapper Plus FEB Far Eastern Branch (Russia) FPM Focal Points Meeting FSP Federal Space Program (Russia) FY-1 (2) Feng Yun-1 (2) GCOM Global Change Observation Mission GEO Group on Earth Observations GIS Geographic Information System GLI Global Imager GMS Geostationary Meteorological Satellite GOCI Geostationary Ocean Color Imager GOES Geostationary Operational Environmental Satellite GOOS Global Ocean Observing System GPS Global Positioning System GRAs GOOS Regional Alliances HAB Harmful Algal Bloom HY-1 (2, 3) Hai Yang-1 (2, 3) ICSU International Council for Science IKI Space Research Institute (IKI; in Russian) I-LAC Intensive Local Area Coverage INMARSAT International Marine Satellite telecommunication Organization IOC The Intergovernmental Oceanographic Commission JAXA Japan Aerospace Exploration Agency JERS-1 Japanese Earth Resources Satellite-1 JMA Japan Meteorological Agency

Page 40
KARI Korea Aerospace Research Institute KOMPAST-I (II) Korean Multi-Purpose Satellite I (II) KORDI Korea Ocean Research and Development Institute MI Meteorological Imager MODIS Moderate Resolution Imaging Spectrometer MOMAF Ministry of Maritime Affairs and Fisheries (Korea) MSC Multi-spectral Camera MTSAT Multi-functional Transport Satellite MVISR Multi-channel Visible and IR Scan Radiometer NASA National Aeronautics and Space Administration (US) NASDA National Space Development Agency of Japan (now JAXA) NDVI Normalized Difference Vegetation Index NEAR-GOOS North-East Asian Regional GOOS NFRDI National Fisheries Research and Development Institute (Korea) NGSST New Generation Sea Surface Temperature NOAA National Oceanic and Atmospheric Administration NOWPAP Northwest Pacific Action Plan NPEC Northwest Pacific Region Environmental Cooperation Center (Japan) NPOESS National Polar-orbiting Operational Environment Satellite System OC2 (4) Ocean Color OCTS Ocean Color and Temperature Scanner OCM Ocean Colour Monitor OSMI Ocean Scanning Multi-spectral Imager PALSAR Phased Array type L-band Synthetic Aperture Radar PAR Photosynthetically Available Radiation PI Principal Investigator POI Pacific Oceanological Institute (Russia) PRISM Panchromatic Remote-sensing Instrument for Stereo Mapping QuikSCAT Quick Scatterometer RAR Real Aperture Radar RAS Russian Academy of Sciences RKA Russian Aviation and Space Agency (RKA; in Russian) SAR Synthetic Aperture Radar SeaWiFS Sea-viewing Wide Field-of-view Sensor SIO Second Institute of Oceanography (China) SOA State Oceanic Administration (China) SRS RAS Space Research Institute RAS SS Suspended Solid SST Sea Surface Temperature S-VISSR Stretched-Visible Infrared Spin Scan Radiometer SZ-3 (4) Shen Zhou-3 (4) TAO Tropical Atmosphere Ocean TM Thematic Mapper UNEP United Nations Environment Programme UNESCO United Nations Educational, Scientific and Cultural Organization vical coef. vicarious calibration coefficients WESTPAC IOC Sub-Commission for the Western Pacific WG4 Working Group 4 WMO World Meteorological Organization


Photo by (c)Tomo.Yun, http://www.yunphoto.net