integrating value analysis and quality function deployment ... · pdf fileintegrating value...
TRANSCRIPT

Integrating Value Analysis and Quality Function Deploymentfor Evaluating Design AlternativesIgnacio Cariaga1; Tamer El-Diraby2; and Hesham Osman3
Abstract: This paper presents a hybrid framework that integrates value analysis and decision making for eliciting and evaluating designalternatives. Value analysis approach relies on the integration of the functional analysis through the systematic use of the functionalanalysis system technique and quality function deployment. This value analysis methodology enables customer requirements to be linkedto specific design alternatives during the project design stage. The degree of project complexity will affect the number of designalternatives to be evaluated. As such, the data envelopment analysis �DEA� is incorporated as a decision support tool to evaluate thedegree to which each design alternative satisfies the customer requirements. DEA is used to calculate a customer requirement efficiencyindex for each alternative. This index is a measure of how well a particular alternative achieves the requirements taking into account itsoverall cost. The framework was successfully used on a high-tech research facility construction project.
DOI: 10.1061/�ASCE�0733-9364�2007�133:10�761�
CE Database subject headings: Project management; Conceptual design; Evaluation; Decision support systems; Hybrid methods.
Introduction
Achieving end-user satisfaction and optimizing the total value ofa project design is a major goal of facility owners and developers.After identifying design objectives, a multitude of products/ op-tions with varying costs can be used to create alternatives thatmeet the design objectives. Owners have to carefully select themost optimum design alternative that combines the most valuableoptions and realize the design objectives within the project budget�or life-cycle costing�. This paper presents a framework for adecision support system to help owners identify the most valuabledesign alternative. The proposed approach uses value analysis�VA�, quality function deployment �QFD� and data envelopmentanalysis �DEA� to optimize the owner decision.
The underlying scenario of this paper is as follows: “A devel-oper or a facility owner wants to build �redevelop/rehab� a facilitythat will be used by customers �for example tenants or employ-ees�, who have a set of end-user requirements. The developerwants to select the design features �such as components and fin-ishes� that meet the customer requirements, present the most valu-
1Graduate Research Assistant, Dept. of Civil Engineering, Univ. ofToronto, 35 St. George St., Toronto, Canada M5S 1A4. E-mail:[email protected]
2Assistant Professor and Director, Center for Information Systems inInfrastructure and Construction, Dept. of Civil Engineering, Univ. ofToronto, 35 St. George St., Toronto, Canada M5S 1A4. E-mail:[email protected]
3Ph.D. Candidate, Dept. of Civil Engineering, Univ. Of Toronto, 35St. George St., Toronto M5S 1A4, Canada. E-mail: [email protected]
Note. Discussion open until March 1, 2008. Separate discussions mustbe submitted for individual papers. To extend the closing date by onemonth, a written request must be filed with the ASCE Managing Editor.The manuscript for this paper was submitted for review and possiblepublication on April 14, 2006; approved on January 16, 2007. This paperis part of the Journal of Construction Engineering and Management,Vol. 133, No. 10, October 1, 2007. ©ASCE, ISSN 0733-9364/2007/10-
761–770/$25.00.JOURNAL OF CONSTRUCTION E
Downloaded 31 Aug 2009 to 131.178.0.18. Redistribution subject to
able components �from engineering/functional view� andoptimize/meet budget requirements.”
A functional analysis system technique �FAST� diagram is firstused to define the “value” map of the design. i.e., What are theobjectives of the design/facility? This relates mainly to the engi-neering aspect of the “function” of the facility under design. Toachieve these functions or objectives, a set of different “products/options” can be acquired at varying “costs.” QFD is used to es-tablish a matrix that helps define the value of each option �thedegree by which each option satisfies the design objectives�. Dif-ferent combinations of available options constitute viable designalternatives. Each alternative has a value which is based on thevalue of the options included. DEA is then used to find the designalternative that optimizes the values within a certain budget.
The value of the integrated framework lies in its ability to: �1�elicit customer requirements �the “WHATs”� through the use ofFAST; �2� relate various design options �the “HOWs”� to eachcustomer requirement through the use of QFD; and �3� provide adecision-support environment to the project decision maker toassist in selecting the most suitable alternative �the “WHY”�. Thisintegrated framework was successfully applied during the designstage of a smart research facility at the University of Toronto.
Background
Value analysis �also referred to as value engineering� is an orga-nized, systematic, and multidisciplined team approach that ana-lyzes the functions of systems, equipment, facilities, services, andsupplies for the purpose of eliminating unnecessary costs, whilemaintaining the required performance, quality, and safety of thefunctions required by the customer �Dell’Isola 1998�. At the coreof VA lies the process of extracting the fundamental functionsexpected by the product/service. The functions of a facility �or aproduct� are defined through careful investigation and analysis of“what is it supposed to do?” Basic functions of a facility can beimplemented through innovative use of different alternatives or
deign components. FAST builds upon VA by linking the functionsNGINEERING AND MANAGEMENT © ASCE / OCTOBER 2007 / 761
ASCE license or copyright; see http://pubs.asce.org/copyright

of a product into a network/hierarchy of basic and secondaryfunctions �normally expressed in a verb-noun fashion�. The func-tional model provides a graphical representation of the functionsof the product or service under analysis and the relationship be-tween each function. FAST should not be considered an end prod-uct or result, but rather a beginning. It describes the item orsystem under study, and causes the team to think through thefunctions that the item or system performs. This forms the basisfor a wide variety of subsequent approaches and analysistechniques.
QFD is defined as deploying the attributes of a product orservice desired by the customer throughout all the functionalcomponents of an organization �Xie et al. 2003�. QFD is used asa tool for satisfying customers through design targets and qualityassurance points used throughout the production phase �Akosa etal. 1995�. It is important to emphasize that QFD is not a solution,but rather a systematic process towards finding one, therebyachieving a more satisfied customer. As such, QFD should not beconsidered an end in itself, but rather a means to an end, a moresatisfied customer �Mallon and Mulligan 1993�. Benefits of QFDare both tangible and intangible �ReVelle et al. 1998�. Tangiblebenefits include: Lowering design costs, elimination of most latedesign changes, early identification of high risk areas, up-frontdetermination of product process requirements, significant reduc-tion in development time, and a more efficient allocation ofresources. Intangible benefits include: Increase customer satisfac-tion, facilitation of multidisciplined teamwork, establishment ofknowledge transfer by maintaining documentation, and encour-agement of transfer training to other projects by teammates.
The QFD methodology is illustrated in Fig. 1 consists of astructured multiple matrix-driven process that could be explainedthrough a step translation operation. �Shillito 1994�. The QFDprocedure is best explained graphically through the house of qual-ity �HOQ�. The HOQ is the engine that drives the entire QFDprocess, and it provides means for combining planning, and com-munications. The structure of the HOQ takes the shape of a house�Fig. 1�b��. The exterior walls of the house describe the customerrequirements known as the WHATS. The ceiling of the house
Fig. 1. QF
describes the design characteristics known as the HOWS. The
762 / JOURNAL OF CONSTRUCTION ENGINEERING AND MANAGEMENT
Downloaded 31 Aug 2009 to 131.178.0.18. Redistribution subject to
interior of the house describes the relationship between the cus-tomer requirements and design characteristics known as theWHYS. The roof of the house contains the correlation or interre-lationships between the design characteristics. Finally, at thefoundation of the house lie the prioritized engineering designcharacteristics �Xie et al. 2003�.
QFD has been successfully utilized in a multitude of domains.The most extensive use of QFD has been in the manufacturingsector. Recently, some researchers have used QFD in constructionresearch. A study by Mallon and Mulligan, �1993� applied QFD tothe design and construction process of renovating a hypotheticalpersonal computer workroom facility. In this study, the goals ofthe QFD exercise were to decide if improvements were desirableor even needed, and to focus on the design elements of the pro-posed improvements. The study concluded that QFD can be suc-cessfully implemented if a company-wide commitment to qualityand improvement is in place. Furthermore, they argue that theimmediate effect of QFD on the design process will not be areduction in the cost or time required for the initial design; in-stead, the immediate effect will be a more focused conceptualiza-tion. The use of QFD in the capital project planning process wasproposed by Ahmed et al. �2003�. Capital project planning isdivided into four development phases: Project requirement, feasi-bility study, preliminary design, and detailed design. QFD is usedin parallel with the respective phases of the project planning pro-cess to enhance the quality of the output from each phase. The useof QFD helped in keeping track of the customer requirements,enhanced communication between client and design team, andsupported the evaluation of the project alternatives.
The application of QFD in strategic construction planning wasfirst examined by Dikmen et al. �2005�. The study argues thatalthough it is better to implement QFD as early as possible in aconstruction project, it is not too late to benefit from it even afterthe construction stage is over. This “post analysis” determines thebest marketing strategies to transfer experience gained from acurrent project to forthcoming projects. According to the findingsof the case, QFD can be utilized to determine the right marketingstrategy, to make a comparison with the competing alternatives,
thodology
D meand to collect data which could increase the client satisfaction
© ASCE / OCTOBER 2007
ASCE license or copyright; see http://pubs.asce.org/copyright

level in future projects. Finally, the study suggests that the assign-ment of the relationships and weights in the matrices is an impor-tant limitation of the QFD methodology, since the inaccuracy andvagueness in the inputs reduces the reliability of the decisions.
DEA is a nonparametric linear programming framework that isused to assess the relative efficiency of a particular solution withrespect to a group of peer solutions. In this regard, DEA is usefulin identifying solutions that are performing with an inferior levelof efficiency and those that are, theoretically, superiorly efficient.Applications of DEA are quite diverse and can be found in do-mains where the problem can be formulated in an input-to-outputefficiency framework. DEA applications can be found in health-care management �Steinmann and Zwrifel 2003�, educationalpolicy �Coates and Lamdin 2002�, and advertising �Luo and Don-thu 2001� to mention a few. Within the domain of civil engineer-ing, DEA has been utilized in efficiency assessment of: �1�irrigation systems �Rodriguez-Díaz et al. 2004�; �2� public transitsystems �Boilé 2001�; �3� construction prequalification �McCabeet al. 2005�; �4� water supply and sanitation systems �Akosa et al.1995�; and �5� industry-level construction productivity �Li et al.2005�.
A DEA formulation evaluates the efficiency of each solution asthe weighted sum of outputs divided by inputs �Eq. �1��. In DEAterminology, a solution is usually referred to as a decision-makingunit �DMU� The mathematical formulation of input-oriented DEAis given by the following set of equations:
Maximize : Ek =u1O1,k + . . . + uMOM,k
v1I1,k + . . . + vNIN,k�1�
Such that
Eik =
u1O1,i + . . . + uMOM,i
v1I1,i + . . . + vNIN,i� 1, i = 1, . . . ,N �2�
u1, . . . ,uM, v1, . . . ,vN � 0 �3�
where M =number of output attributes; N=number of input at-tributes, Oi,j=value of output attribute number i for unit k; Ii,j
=value of input attribute number i for unit k; ui=output weightfor output attribute number i; vi=input weight for input attributenumber i; Ek=efficiency of the current DMUk; and Ei
k
=efficiency of DMUi that is calculated for DMUk maximization.The variables in these equations are ui, vi, while Ek, Oi,j, and Ii,j
must be known for each DMU. This DEA formulation strives tomaximize the efficiency of DMUk, while maintaining the effi-ciency of all other DMU’s �1. Some of the strengths that DEAexhibits as a decision tool include �Thanassoulis 2001�:• The ability to deal with inputs and outputs that have heteroge-
neous units. For example, in a project optimization/evaluationscenario, the units of input could be project cost and time,while the output could include items like quality and environ-mental impact; and
• DEA does not need to have a functional form that relates in-puts and outputs. This is specifically useful for applicationswhere no formal models exist.On the other hand, some of the key issues that must be con-
sidered with DEA include:• DEA only estimates a relative measure of efficiency for a
DMU. Hence, it is only able to assess how an alternative per-forms in comparison to its peers not against a “hypothetical”
optimum solution.JOURNAL OF CONSTRUCTION E
Downloaded 31 Aug 2009 to 131.178.0.18. Redistribution subject to
• DEA cannot deal with uncertainty in the input or output vari-ables; and
• Large problems can be computationally complex.
Proposed Approach
The proposed integration approach between FAST, QFD, andDEA relies on utilizing the output of one method as a necessaryinput for the following method. FAST diagrams help identify de-sign objectives, while QFD can be used to compare the degree bywhich each design option satisfies these objectives. As such, thereis a need to complement these two tools with a decision supporttool. DEA is used to evaluate how each design alternative �i.e., acombination of options� attains the various objectives elicitedthrough the use of FAST and QFD. DEA evaluates how a particu-lar solution performs with respect to a measure of efficiency,which is generically the ratio between outputs and inputs. Respec-tive to evaluating the design alternatives, outputs could representvarious customer requirements/project objectives, while the in-puts could represent the total cost and/or time for a projectcompletion. Fig. 2 depicts the efficiency frontier for the DEAapproach to evaluating the design alternatives. The benefit of thisapproach is its ability to short-list a set of design alternatives thatbest meet the customer requirements �those lying on the effi-ciency frontier�. This reduces the solution space by filtering out“inefficient” solutions. In this regard, DEA is utilized as adecision-support rather than a decision-making tool, as thedecision-maker still retains the final decision for selecting themost appropriate solution from those that lie on the frontier. Inessence, integrating DEA with FAST and QFD closes thedecision-making loop by answering the questions of:1. What are my objectives? �FAST�.2. How can I attain them? �QFD�.3. Why should I select a particular alternative�s� �DEA�?
The major steps for integrating FAST, QFD, and DEA aredepicted in Fig. 3:1. Define the objectives �the WHATs�: FAST is used to formal-
ize a set of tangible objectives �J� that the project should
Fig. 2. Efficiency frontier in DEA
aspire to attain.
NGINEERING AND MANAGEMENT © ASCE / OCTOBER 2007 / 763
ASCE license or copyright; see http://pubs.asce.org/copyright

2. Assign relative weights for each objective �w�: This is donethrough pairwise comparison between the objectives. Typi-cally, this is done through interaction and collaboration be-tween the owner, the designer, facility users, and maybe a VAconsultant. The analytical hierarchy process �AHP� is used inthis research to obtain the weights based on the pairwisecomparison of objectives. Discussion of AHP is beyond thescope of this paper. The interested reader is referred to Saaty�1980�.
3. Identify the options: Any project can be broken down into aset of constituent design components �D�, normally for eachdesign component �such as building envelop, flooring sys-tem, and finishes� there are a set of different products/options�NDi� available in the market to implement the component�or achieve the design intent�. For example, the lighting sys-tem for a facility can be executed using an elaborate/customized light system, or using simple off-the-shelf lights.It also can be executed using different wiring configurationand styles. In total, there exists P design options where P=�i=1
D NDi. Each available and suitable option should be con-sidered by the owner.
4. Find the value of the options:• Establish the HOQ: QFD serves as the enabling mechanism
to contrast/compare several design options to the objectivesset forth by the FAST diagram. This is done by establishingthe HOQ using the objectives in the left column �theWHATs� and the options in the top row �the HOWs�;
Fig. 3. Proposed
• Populate the HOQ: In each cell of the HOQ matrix estab-
764 / JOURNAL OF CONSTRUCTION ENGINEERING AND MANAGEMENT
Downloaded 31 Aug 2009 to 131.178.0.18. Redistribution subject to
lish the value relationship between each option and eachobjective. How much does each option satisfy each objec-tive? The relationship strength �Ri,k� between “the WHATs”and “the HOWs” is assigned a value of 9 if the relationshipis strong, 3 if medium, 1 if weak, and 0 if no relationship.Ri,k refers to the relationship strength between objective iand option k; and
• Find the value of each option: The value �Vi,k� of eachoption �Pk� respective to an objective �Ji� is determined bymultiplying the relationship strength �Ri,k� by the weight�wi� of each corresponding objective �Ji�
Vi,k = Ri,k � wi �4�
5. Define the alternatives: The owner and the design teamshould develop a set of alternative designs �A�. An alterna-tive design is a complete design configuration that is com-posed by selecting a complementary set of products/options.Theoretically speaking, the total number of design alterna-tives available will depend on how many design elements�D� and options per design elements �NDi� are available. Themaximum number of design alternatives that can be gener-ated is A, where
A = �i=1
D
NDi
For example, assume that a project has 5 main design
ation framework
integrcomponents �D� and each component has 3 design options
© ASCE / OCTOBER 2007
ASCE license or copyright; see http://pubs.asce.org/copyright

�ND�. Then we would have 15 total options �P�. In addition,theoretically, the total number of option combinations or al-ternatives �A� would be 35=243 alternatives. Of course, inactual life, a more limited number of alternatives �the actual
set of alternatives A� can be identified as the really feasible
alternatives, such that A�A. The set of feasible alternativesis generated via a compatibility matrix that indicates whichdesign options are compatible within any single design alter-native. A binary compatibility value CVi,j refers to the com-patibility between option i and j. If CVi,j =1 the options arecompatible, whereas a value of 0 indicates incompatibility.
The set of feasible alternatives A is generated such that for
all design options CVi,j =1. For each feasible alternative �A�,develop an estimate of the total life-cycle cost �LCC�.
6. Find the total value of each feasible alternative �Vi,k� respec-
tive to each objective Ji: For every feasible alterative Ak, addthe values of each of its constituent design options respectiveto the same objective
Vi,k = �n=1
NDk
Vi,n �5�
7. Apply DEA:
• Formulate the DEA: The total LCC of the alterative Ak isselected as the input of the DEA, whereas the value matrix
for each alterative Vi,k is selected as the output. It should benoted that other input variables �e.g., total project duration,energy consumption, etc.� can be used if the decisionframework so requires; and
• Find the optimum frontier: Use DEA to find the combina-tion of alternatives that best optimize the total project bud-get �B� and maximize the values of all the alternatives �inachieving the objectives�.
8. Sensitivity analysis: Given that all costs are estimated costs,it is prudent to conduct a sensitivity analysis �to compare allthe options on the frontier� before selecting the single mostoptimum alternative�s�.
9. Final selection: The most optimum alternative should be se-lected either through DEA or through subjective consider-ation based on the sensitivity analysis.
Implementation
The framework for QFD and DEA integration was implementedin a simple easy-to-use programmable spreadsheet �Figs. 5–7�.The spreadsheet provides the following functionality:1. Elicitation of the weights for each objective based on a pair-
wise AHP, comparison.2. Generation of the HOQ based on objectives, design compo-
nents, and options for each component.
3. Automatic generation of the set of feasible alternatives Ak
and their associated value matrix for each objective Vi,k.4. Integration with an out-of-the-box DEA software �WinDEAP
1.10�.5. Capability to easily perform sensitivity analysis due to the
automated nature of the process.
JOURNAL OF CONSTRUCTION E
Downloaded 31 Aug 2009 to 131.178.0.18. Redistribution subject to
Case Study
The proposed approach was used to optimize the design of asmart laboratory at the University of Toronto. The project in-volved the creation of a new research facility: The Center forInformation Systems in Infrastructure and Construction �i2c�. Thecenter encompasses a state-of-the-art computer lab, board room,and lab for smart systems. The facility is equipped with varioussensors and actuators, and houses a green bio-wall that acts as aminiature ecosystem. The analysis procedures were as follows:1. FAST diagram: The FAST diagram was developed through
the help of a VA consultant. Fig. 4 shows a summary of theFAST diagram for the facility. The process involved devel-oping basic functions through several meetings with theowner, architect, and construction manager. This was fol-lowed by an open house meeting with prospective users�graduate and undergraduate students�. In this meeting, thestudents were introduced to the concept of VA, participatedin identifying several additional functions, and assisted in thedevelopment of a preliminary FAST diagram. A set of meet-ings with the owner and the architect culminated in the de-velopment of the final FAST diagram. The basic function ofthe space is to “conduct research.” The nonbasic functionsshown in the diagram were used as objectives in the HOQ.These include:
• Provide smartness: Create a responsive workspace, housesmart infrastructure systems facility, and portray an imageof a smart facility;
• Attract new students;• Attract collaborating partners;• Offer aesthetics;• Conserve energy;• Maintain flexibility: Provide a multiuse space that can be
easily reconfigured to accommodate various user needs;and
• Provide a comfortable space: Offering users of the facility acomfortable and relaxing work environment.
These functions act as the objectives that should be metby the facility.
2. Weights: A team composed of a representative set of poten-tial users and the owner of the facility were involved in se-lecting the weights for the objectives. A scale of 1–5 wasused to assess the relative importance between objectives�with 5 being extremely important�. These importance valueswere achieved via a consensus process. Fig. 5 shows thepairwise comparison of these objectives and the resultingweights that were calculated using AHP.
3. Option development: Five main design components wereselected by the architect for option development. They werecategorized as follows:
• External glass: The facility main façade is designed as acurved façade. The three main options for this category are:�1� Use butt-connected curved glass; �2� use small straightglass panels with aluminum frames; and �3� remove thecurve from the design and use straight glass. The costs ofthe options were estimated at $78,700, $38,200, and$34,900, respectively;
• Internal glass: There were two options for internal glass:�1� Use retractable glass panels; and �2� use fixed glasspanels with doors. The cost of each option was $42,000 and$18,000, respectively;
• Lighting: The proposed two options in this category are: �1�
Elaborate lighting configuration; and �2� a regular lightingNGINEERING AND MANAGEMENT © ASCE / OCTOBER 2007 / 765
ASCE license or copyright; see http://pubs.asce.org/copyright

configuration. The costs of these options were $76,750 and65,600, respectively;
• Furniture: This category included two main options: Ex-pensive furniture and simple furniture. The estimated costsfor these two options were $15,000 and $10,500, respec-tively; and
• HVAC: This category included two main options: �1� Al-lowing for individual controls of HVAC systems, and �2�limited control of HVAC system. The estimated costs forthese two options were $47,000 and $35,000, respectively.
4. Populate the HOQ: Table 1 shows the simplified HOQ. Thefirst two columns represent the objectives and the relativeweight of each objective. The remaining columns representthe relationship strength between each objective and each
Fig. 4. FAST diag
option �Ri,j: nonbold numbers�, and the value of each alter-
766 / JOURNAL OF CONSTRUCTION ENGINEERING AND MANAGEMENT
Downloaded 31 Aug 2009 to 131.178.0.18. Redistribution subject to
native with respect to the objectives �Vi,j: bold numbers�. Forexample, the option of “Individual HVAC Control” has arelationship strength of 5.4 and value of 98.3 �shown in boldface� with respect to the objective of “Provide Smartness.”The bottom row shows the estimated cost for each designoption. The values of each option were developed based onthe average assessment of a team composed of the architect,the owner, and a set of students.
5. Alternative generation: Using the compatibility matrix ap-proach, the compatibility of various design elements is as-sessed by the architect. Fig. 6 shows the compatibility of the11 design elements. In this example, all possible combina-tions were assumed feasible, and, hence, all compatibilityvalues are “1.” Fields marked “N/A” refer to the compatibil-
or the i2c facility
ram fity of elements within an individual design component �and,
© ASCE / OCTOBER 2007
ASCE license or copyright; see http://pubs.asce.org/copyright

l
hence, cannot simultaneously exist in an alternative�. Be-cause the design options were mutually exclusive, the avail-able combinations of all these options were 48 alternativedesigns �3�2�2�2�2�. The architect confirmed that all48 were viable alternatives and worthy of consideration. Al-though this example did not demonstrate the applicability ofthe compatibility matrix �all values were 1�, it is very com-mon for architectural design components to be incompatible.For example, some flooring options might not be compatiblewith lighting or furniture options for aesthetic considerations.The compatibility matrix allows these combinations to beexcluded from the feasible alternatives set before performingDEA. Fig. 7 shows design alternative numbers 27 and 28.
The shaded column to the right shows values of Vi,k. For
Fig. 5. Pairwise comparison
Table 1. HOQ for the Five Main Design Elements
Objective Weight
Exterior glass Interna
CurvedStraight with
framing
Removecurvature from
design Retractab
Providesmartness
18.2 0.6 0.6 0.6 0.4
10.9 10.9 10.9 7.3
Attractstudents
12.8 5.0 5.4 3.8 0.8
64.0 69.1 48.6 10.2
Attractcollaborationpartners
31.7 3.8 3.8 3.8 0.8
120.5 120.5 120.5 25.4
Offeraesthetics
7.6 7.8 5.0 5.4 3.0
59.3 38.0 41.0 22.8
Conserveenergy
5.1 0.0 0.0 0.0 1.8
0.0 0.0 0.0 9.2
Maintainflexibility
11.3 0.0 0.0 0.0 5.4
0.0 0.0 0.0 61.0
Providecomfortablespace
12.5 0.2 0.2 0.2 0.2
2.5 2.5 2.5 2.5
Cost �$� 38,200 34,900 78,700 42,000
JOURNAL OF CONSTRUCTION E
Downloaded 31 Aug 2009 to 131.178.0.18. Redistribution subject to
example, alternative number 28 has a cost of $175,510 andhas a value of 43.9 with respect to the objective of energyconservation.
6. DEA calculations: For all 48 design alternatives a singleinput �cost� and seven outputs �objectives� were compiled.Together, these eight attributes constitute the attributes of aDMU that is used in DEA analysis. An input-oriented DEAwith variable returns to scale was conducted on the 48DMUs. The efficiency frontier was found to be comprised of14 design alternatives. These alternatives have a superiormeasure of efficiency �output/input� compared to other alter-natives in the solution space. The weighted efficiency calcu-lated in Eq. �1� can be considered a customer requirementsefficiency index �CREI�. The index ranges in value from
jectives for the i2c facility
Design elements
Lighting Furniture HVAC
ed Elaborate Regular Expensive SimpleIndividual
control General contro
.4 4.2 0.8 0.2 0.2 5.4 0.8
.3 76.4 14.6 3.6 3.6 98.3 14.6
.4 3.2 1.2 3.0 1.2 6.6 1.2
.1 41.0 15.4 38.4 15.4 84.5 15.4
.4 3.8 1.2 4.2 1.2 5.4 1.2
.7 120.5 38.0 133.1 38.0 171.2 38.0
.8 4.8 1.4 6.6 1.6 0.6 0.2
.7 36.5 10.6 50.2 12.2 4.6 1.5
.8 6.0 1.6 0.0 0.0 6.0 0.8
.2 30.6 8.2 0.0 0.0 30.6 4.1
.0 0.8 0.4 0.8 0.4 0.6 0.2
.3 9.0 4.5 9.0 4.5 6.8 2.3
.2 0.8 0.4 9.0 2.6 6.0 2.4
.5 10.0 5.0 112.5 32.5 75.0 30.0
000 76,750 65,600 15,000 10,500 47,000 35,000
of ob
l glass
le Fix
0
7
0
5
0
12
1
13
1
9
1
11
0
2
18,
NGINEERING AND MANAGEMENT © ASCE / OCTOBER 2007 / 767
ASCE license or copyright; see http://pubs.asce.org/copyright

Fig. 6. Compatibility matrix for various design elements
Fig. 7. Sample alternatives
768 / JOURNAL OF CONSTRUCTION ENGINEERING AND MANAGEMENT © ASCE / OCTOBER 2007
Downloaded 31 Aug 2009 to 131.178.0.18. Redistribution subject to ASCE license or copyright; see http://pubs.asce.org/copyright
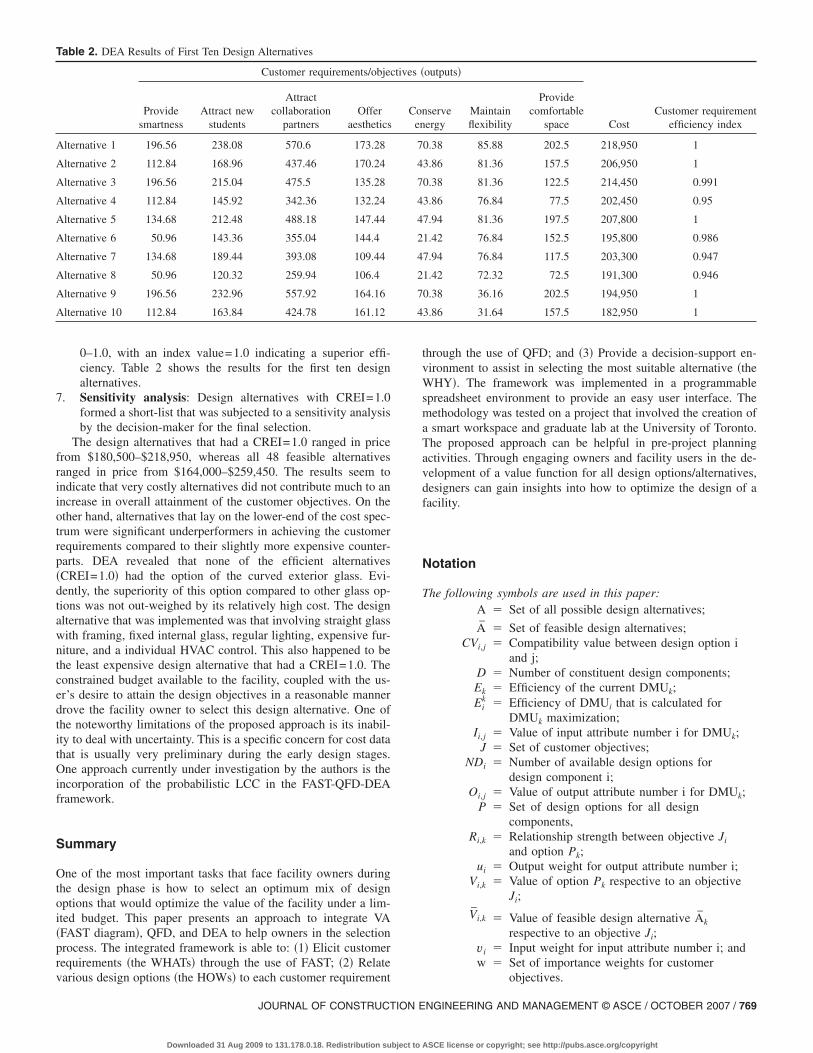
0–1.0, with an index value=1.0 indicating a superior effi-ciency. Table 2 shows the results for the first ten designalternatives.
7. Sensitivity analysis: Design alternatives with CREI=1.0formed a short-list that was subjected to a sensitivity analysisby the decision-maker for the final selection.
The design alternatives that had a CREI=1.0 ranged in pricefrom $180,500–$218,950, whereas all 48 feasible alternativesranged in price from $164,000–$259,450. The results seem toindicate that very costly alternatives did not contribute much to anincrease in overall attainment of the customer objectives. On theother hand, alternatives that lay on the lower-end of the cost spec-trum were significant underperformers in achieving the customerrequirements compared to their slightly more expensive counter-parts. DEA revealed that none of the efficient alternatives�CREI=1.0� had the option of the curved exterior glass. Evi-dently, the superiority of this option compared to other glass op-tions was not out-weighed by its relatively high cost. The designalternative that was implemented was that involving straight glasswith framing, fixed internal glass, regular lighting, expensive fur-niture, and a individual HVAC control. This also happened to bethe least expensive design alternative that had a CREI=1.0. Theconstrained budget available to the facility, coupled with the us-er’s desire to attain the design objectives in a reasonable mannerdrove the facility owner to select this design alternative. One ofthe noteworthy limitations of the proposed approach is its inabil-ity to deal with uncertainty. This is a specific concern for cost datathat is usually very preliminary during the early design stages.One approach currently under investigation by the authors is theincorporation of the probabilistic LCC in the FAST-QFD-DEAframework.
Summary
One of the most important tasks that face facility owners duringthe design phase is how to select an optimum mix of designoptions that would optimize the value of the facility under a lim-ited budget. This paper presents an approach to integrate VA�FAST diagram�, QFD, and DEA to help owners in the selectionprocess. The integrated framework is able to: �1� Elicit customerrequirements �the WHATs� through the use of FAST; �2� Relate
Table 2. DEA Results of First Ten Design Alternatives
Customer requirements/objec
Providesmartness
Attract newstudents
Attractcollaboration
partnersOffer
aesthetics
Alternative 1 196.56 238.08 570.6 173.28
Alternative 2 112.84 168.96 437.46 170.24
Alternative 3 196.56 215.04 475.5 135.28
Alternative 4 112.84 145.92 342.36 132.24
Alternative 5 134.68 212.48 488.18 147.44
Alternative 6 50.96 143.36 355.04 144.4
Alternative 7 134.68 189.44 393.08 109.44
Alternative 8 50.96 120.32 259.94 106.4
Alternative 9 196.56 232.96 557.92 164.16
Alternative 10 112.84 163.84 424.78 161.12
various design options �the HOWs� to each customer requirement
JOURNAL OF CONSTRUCTION E
Downloaded 31 Aug 2009 to 131.178.0.18. Redistribution subject to
through the use of QFD; and �3� Provide a decision-support en-vironment to assist in selecting the most suitable alternative �theWHY�. The framework was implemented in a programmablespreadsheet environment to provide an easy user interface. Themethodology was tested on a project that involved the creation ofa smart workspace and graduate lab at the University of Toronto.The proposed approach can be helpful in pre-project planningactivities. Through engaging owners and facility users in the de-velopment of a value function for all design options/alternatives,designers can gain insights into how to optimize the design of afacility.
Notation
The following symbols are used in this paper:A � Set of all possible design alternatives;
A � Set of feasible design alternatives;CVi,j � Compatibility value between design option i
and j;D � Number of constituent design components;Ek � Efficiency of the current DMUk;Ei
k � Efficiency of DMUi that is calculated forDMUk maximization;
Ii,j � Value of input attribute number i for DMUk;J � Set of customer objectives;
NDi � Number of available design options fordesign component i;
Oi,j � Value of output attribute number i for DMUk;P � Set of design options for all design
components,Ri,k � Relationship strength between objective Ji
and option Pk;ui � Output weight for output attribute number i;
Vi,k � Value of option Pk respective to an objectiveJi;
Vi,k � Value of feasible design alternative Ak
respective to an objective Ji;vi � Input weight for input attribute number i; andw � Set of importance weights for customer
outputs�
CostCustomer requirement
efficiency indexnserveergy
Maintainflexibility
Providecomfortable
space
0.38 85.88 202.5 218,950 1
3.86 81.36 157.5 206,950 1
0.38 81.36 122.5 214,450 0.991
3.86 76.84 77.5 202,450 0.95
7.94 81.36 197.5 207,800 1
1.42 76.84 152.5 195,800 0.986
7.94 76.84 117.5 203,300 0.947
1.42 72.32 72.5 191,300 0.946
0.38 36.16 202.5 194,950 1
3.86 31.64 157.5 182,950 1
tives �
Coen
7
4
7
4
4
2
4
2
7
4
objectives.
NGINEERING AND MANAGEMENT © ASCE / OCTOBER 2007 / 769
ASCE license or copyright; see http://pubs.asce.org/copyright

References
Ahmed, S. M., Sang, L. P., and Torbica, Z. M. �2003�. “Use of qualityfunction deployment in civil engineering capital project planning.” J.Constr. Eng. Manage., 129�4�, 358–368.
Akosa, G., Franceys, R., Barker, P., and Weyman-Jones, T. �1995�. “Ef-ficiency of water-supply and sanitation projects in ghana.” J. Infra-struct. Syst., 1�1�, 56–65.
Boilé, M. P. �2001�. “Estimating technical and scale inefficiencies ofpublic transit systems.” J. Transp. Eng., 127�3�, 187–194.
Coates, D., and Lamdin, J. �2002�. “School performance evaluation usingdata envelopment analysis.” Public finance and management, South-ern Public Administration Education Foundation, 2�4�, 556–591.
Dell’Isola, A. �1998�. “Value engineering: Practical applications for de-sign, maintenance, and operations.” R. S. Means Co., Van NostrandReinhold, New York.
Dikmen, I., Talat, M., and Kiziltas, S. �2005�. “Strategic use of qualityfunction deployment in the construction industry.” Build. Environ.,Elsevier, 40�2�, 245–255.
Li, X., Shen, Q., and Xue, X. �2005�. “Application of DEA-based malm-quist productivity index measure to the construction industry inChina.” Proc., ASCE Construction Research Congress: BroadeningPerspectives, San Diego.
Luo, X., and Donthu, N. �2001�. “Benchmarking advertising efficiency.”
770 / JOURNAL OF CONSTRUCTION ENGINEERING AND MANAGEMENT
Downloaded 31 Aug 2009 to 131.178.0.18. Redistribution subject to
J. Advertising Research, 41�6�, 7–18.Mallon, J. C., and Mulligan, D. E. �1993�. “Quality function
deployment—System for meeting customers’ needs.” J. Constr. Eng.Manage., 119�3�, 516–531.
McCabe, B., Tran, V., and Ramani, J. �2005�. “Construction prequalifica-tion using data envelopment analysis.” Can. J. Civ. Eng., 32�1�, 183–193.
ReVelle, J., Moran, J., and Cox, C. �1998�. The QFD handbook, Wiley,New York.
Rodriguez-Díaz, J. A., Camacho-Poyato, E., and López-Lunque, R.�2004�. “Application of data envelopment analysis to studies of irri-gation efficiency in andalusia.” J. Irrig. Drain. Eng., 130�3�, 175–183.
Saaty, T. �1980�. The analytic hierarchy process: Planning priority set-ting, resource allocation, McGraw-Hill, New York.
Shillito, L. �1994�. Advanced QFD: Linking technology to market andcompany needs, Wiley, New York.
Steinmann, L., and Zwrifel, P. �2003�. “On the �in�efficiency of Swisshospitals.” Appl. Econom., 35, 361–3701.
Thanassoulis, E. �2001�. Introduction to the theory and application ofdata envelopment analysis—A foundation text with integrated soft-ware, Kluwer Academic Publishers, Norwell, Mass.
Xie, M., Tan, K. C., and Goh, T. N. �2003�. “Advanced QFD applica-
tions.” ASQ Quality Press, Milwaukee, Wis.© ASCE / OCTOBER 2007
ASCE license or copyright; see http://pubs.asce.org/copyright