integrating weed control and restoration. the problem: cheatgrass (bromus tectorum) invasion in...
Post on 21-Dec-2015
222 views
TRANSCRIPT
Integrating Weed Control and Restoration

The problem: Cheatgrass (Bromus tectorum) invasionin Great Basin rangelands

Why is cheatgrass so successful?
BurnedUnburned
Young & Evans(1978)
Fre
quen
cy
Prolific seed production High competitive ability
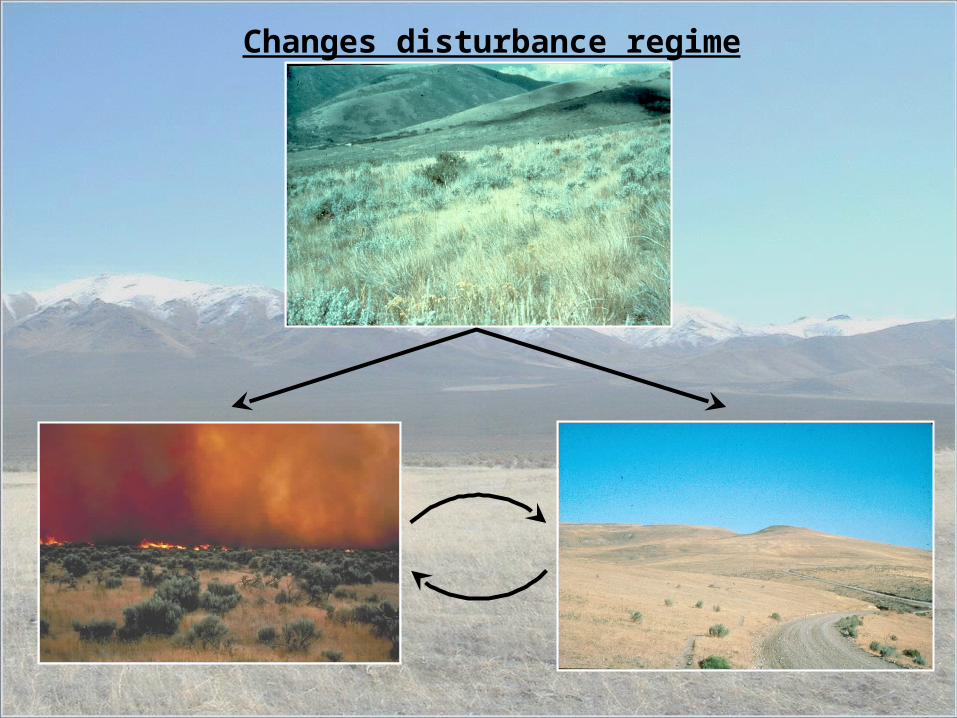
Changes disturbance regime

X
Solution
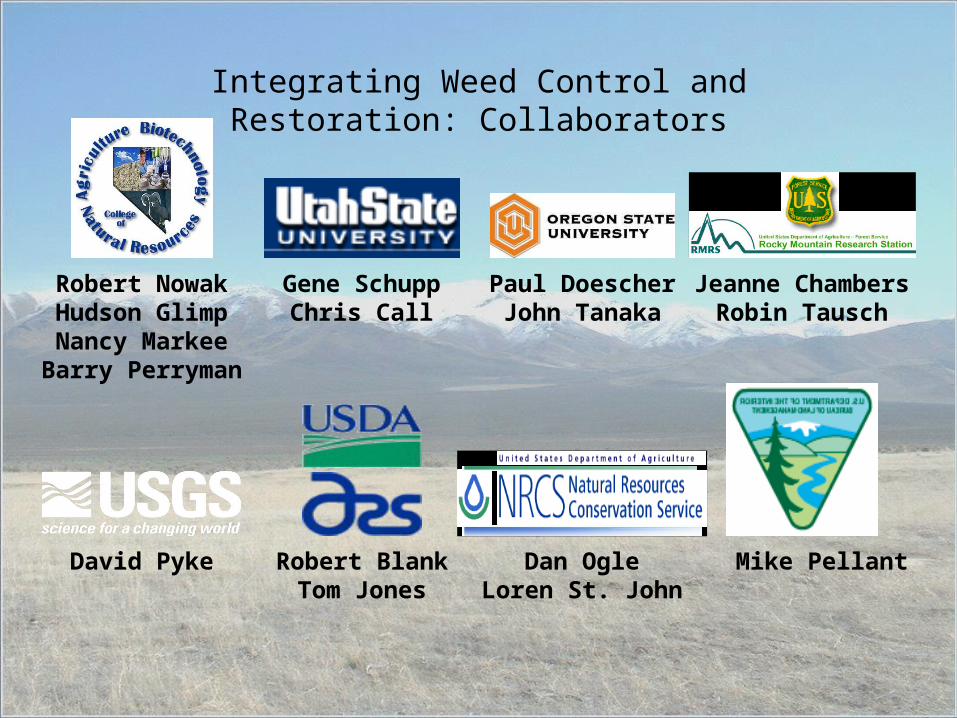
Integrating Weed Control and Restoration: Collaborators
Robert NowakHudson GlimpNancy Markee
Barry Perryman
Robert BlankTom Jones
Gene SchuppChris Call
Paul DoescherJohn Tanaka
Jeanne ChambersRobin Tausch
Dan OgleLoren St. John
Mike PellantDavid Pyke

• Plant materials for transition stageBluebunch wheatgrass – Anatone, Goldar, P-7, P-12Snake River wheatgrass – Secar, SERDP*Basin wildrye – Magnar, TrailheadSandberg bluegrass – Hanford, High Plains,
Mountain Home, ShermanThickspike wheatgrass – Bannock, CritanaSquirreltail – Sand Hollow, Shaniko Plateau*Western yarrow – Eagle, Great NorthernScarlet globemallowSiberian wheatgrass – VavilovCrested wheatgrass – CD-IIAnnual grass hybrids – Mountain rye,
Pioneer, Regreen, Stani
* Note: replaced with winterfat, shadscale, four-wing saltbush, &Rimrock indian ricegrass at Nevada’s Izzenhood Ranch study site
Experiment 1: A transition stage approach

390'
50'
50'
410'
50'
50'
70'
120'
10'
10'
20'
10'
Herbicide application
Individual study plots with varietal seeding randomly assigned. Each plot has 10 rows with 1‘ row spacing.
Experiment 1: A transition stage approach


Cheatgrass
Eden Valley Izzenhood Ranch
Bio
ma
ss (
g m
-2)
0.0
0.5
1.0
1.5
2.0
Contro
l
Herbic
ide
Experiment 1: A transition stage approach• Effects of herbicide treatments:
Reduces cheatgrass

Cheatgrass
Eden Valley Izzenhood Ranch
Bio
ma
ss (
g m
-2)
0.0
0.5
1.0
1.5
2.0
Contro
l
Herbic
ide
Other species
Eden Valley Izzenhood Ranch
Experiment 1: A transition stage approach• Effects of herbicide treatments:
Reduces cheatgrass, but other species increase

Cheatgrass
Eden Valley Izzenhood Ranch
Bio
ma
ss (
g m
-2)
0.0
0.5
1.0
1.5
2.0
Contro
l
Herbic
ide
Other species
Eden Valley Izzenhood Ranch
Seeded species
Eden Valley Izzenhood Ranch
Bio
ma
ss (
g m
-2)
0.00
0.01
0.02
0.03
0.04
0.05
Experiment 1: A transition stage approach• Effects of herbicide treatments:
Reduces cheatgrass, but other species increaseVariable for seeded species

Eden Valley
CD-II
Anatone
Goldar
P-12P-7
Magnar
Trailhead
Vavilov
Pla
nt d
ensi
ty (
# ft-2
)
0
1
2
3
4
Izzenhood Ranch
CD-II
Anatone
Goldar
P-12P-7
Magnar
Trailhead
Vavilov
Pla
nt d
ensi
ty (
# ft-2
)
0
1
2
3
Bluebunchwheatgrass
Basinwildrye
CWG
SibrnWG
Experiment 1: A transition stage approach
• Success of seeded species – Nevada

Eden Valley
CD-II
Anatone
Goldar
P-12P-7
Magnar
Trailhead
Pla
nt d
ensi
ty (
# ft-2
)
0
1
2
3
4
Izzenhood Ranch
CD-II
Sand Hollow
Shaniko
Bannock
Critana
Secar
SERDP
Pla
nt d
ensi
ty (
# ft-2
)
0
1
2
3
Squirreltail
Thickspikewheatgrass
CWG
Snake Riverwheatgrass
Experiment 1: A transition stage approach
• Success of seeded species – Nevada
Eden Valley
CD-II
Anatone
Goldar
P-12P-7
Magnar
Trailhead
Pla
nt d
en
sity
(#
ft-2
)
0
1
2
3
4
Izzenhood Ranch
CD-II
Hanford
High Plains
Mtn. Hom
e
Sherman
Mountain rye
Stani
Regreen
Pioneer
Pla
nt d
en
sity
(#
ft-2
)
0
1
2
3
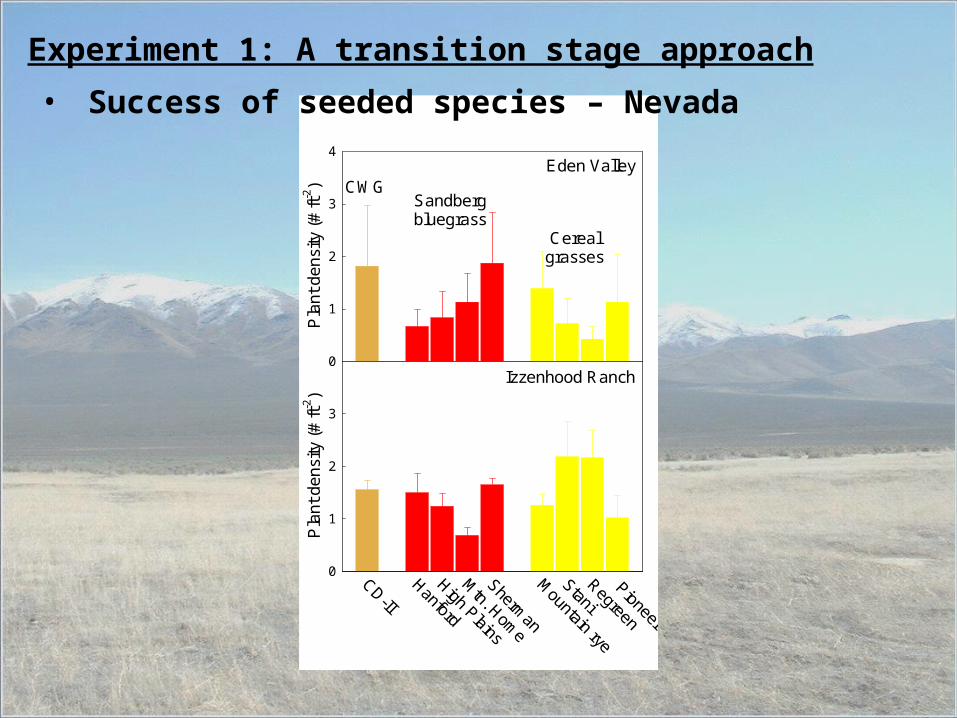
Sandbergbluegrass
Cerealgrasses
CWG
Experiment 1: A transition stage approach
• Success of seeded species – Nevada

Experiment 1: A transition stage approach
• Success of seeded species – All sitesBest performers (comparable to crested wheatgrass):
Anatone & P-12 bluebunch wheatgrassSERDP & Secar Snake River wheatgrassCritana thickspike wheatgrassSherman sandberg bluegrass

• Cheatgrass inhibited by low soil nitrogen,but natives are tolerant of low nitrogen
Experiment 2: A plant functional type approach

• Cheatgrass inhibited by low soil nitrogen,but natives are tolerant of low nitrogen
• Soil amendments to tie up nitrogen
Experiment 2: A plant functional type approach

• Cheatgrass inhibited by low soil nitrogen,but natives are tolerant of low nitrogen
• Soil amendments to tie up nitrogen (sucrose)• Mix of natives to deplete resources
sagebrush – evergreen; extensive rootingHigh Plains bluegrass – earliest; shallowestSand Hollow squirreltail – early; shallowAnatone bluebunch wheatgrass – mid; extensiveGreat Northern yarrow – mid; surface root matscarlet globemallow – early; extensive
Experiment 2: A plant functional type approach

No sugarSugar applicationHerbicide application
300'
350'15 m 15 m
15 m
15 m
2.5
m
1.5 m
2 m 2 m
2 m
2 m
15.5 m
23 m
Individual study plots with seeding treatments randomly assigned
Experiment 2: A plant functional type approach

Specific questions
1. Did sucrose reduce soil N?
2. Did the ‘target species’ benefit?
1. Did sucrose facilitate establishment?
2. Did cheatgrass reduce native recruitment?
3. Was cheatgrass adversely affected?
1. Did the 6-species mix reduce cheatgrass?
2. Was cheatgrass seed output, biomass, or density reduced?

Oct 2003 - Jan 2004 Jan 2004 - March 2004
P=0.02
P<0.001Mic
rogr
ams
NO
3 pe
r da
y1. Did sucrose reduce soil N ?

Experiment 2: A plant functional type approach• Success of seeded species:

2.2 Did cheatgrass reduce native recruitment ?
Target species density second season (NV):
• High precip site: species differ (p<0.001)
• Low precip site: species differ (p<0.001) & BRTE by sucrose interaction (p = 0.003)

BRTE density, 2004 seedings
planted species
estim
ated
pla
nts
per m
2
0
500
1000
1500
2000
2500
3000
no sugar sugar
BRTE density, 2003 seedings
planted species
estim
ated
pla
nts
per m
2
0
500
1000
1500
2000
2500
3000
no sugar sugar
3.1 Did the 6 species mix reduce cheatgrass?
sugar: p = 0.02 species: p = 0.001 species: p= 0.01

Low precipitation
ID NV OR UT0
10
20
30
40
50
60
70
80
High precipitation
ID NV OR UT
Se
ed
s p
er
pla
nt
0
20
40
60
80
100
120
140
160
180
No sucroseSucrose
Low precipitation
ID NV OR UT0.0
0.1
0.2
0.3
0.4
0.5
0.6
3.2 Was cheatgrass seed output, biomass or density reduced?
P = 0.0004
P = 0.005

Experiment 2: A plant functional type approach• Effects of sugar treatments:
Reduces cheatgrass biomass and seed productionConsistent effect among all sites
Cheatgrass seed production (per plant)
Effect size
-2.0 -1.5 -1.0 -0.5 0.0 0.5
Eden Valley
Izzenhood Ranch
Simpson Springs
Vernon Hills
Cinder Cone
Canyon Creek
Lincoln Bench
Succor Creek

Conclusions1. Did sucrose reduce soil N? YES
2. How well did ‘target species’ establish?1. Did sucrose facilitate establishment? No2. Did cheatgrass alter native recruitment? yes
3. Was cheatgrass adversely affected?1. Did the 6-species mix reduce cheatgrass?
NO2. Was cheatgrass seed output, biomass, or
density reduced? Sucrose YES, species mix NO; effect short-lived

Experiment 3: Large-scale restoration trials

Experiment 3 Overview
• Application of successful restoration techniques from Experiments 1 and 2– Transition community vs. Native mix– Restoration treatments targeted at:
– reduce cheatgrass seedbank– reduce available soil N
• Use ecological principles from first 2 experiments on large, management-scale plots
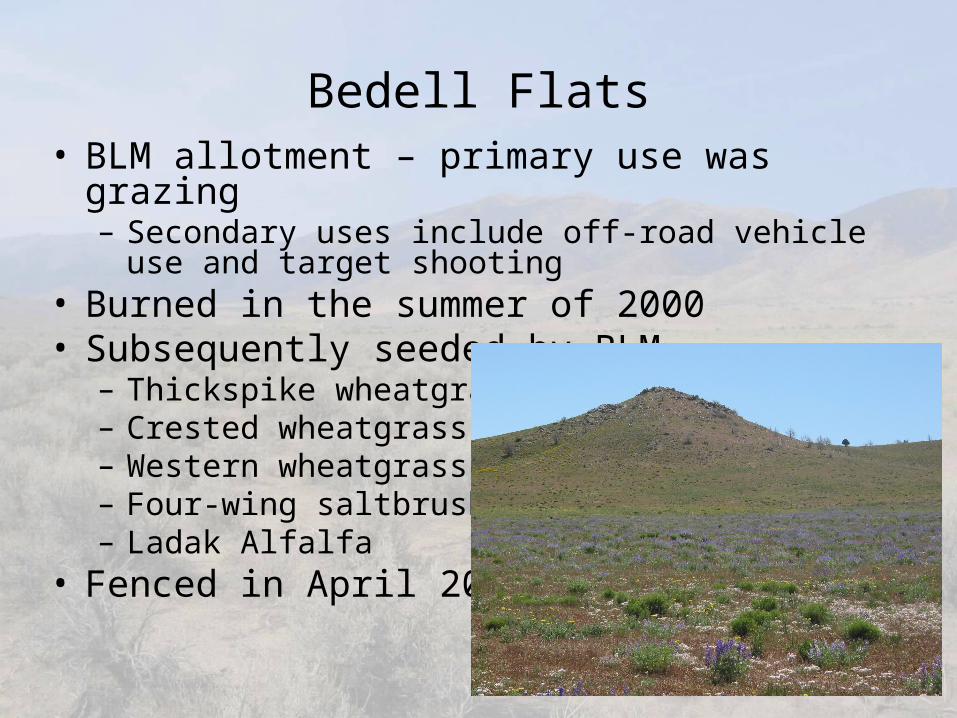
Bedell Flats• BLM allotment – primary use was grazing
– Secondary uses include off-road vehicle use and target shooting
• Burned in the summer of 2000• Subsequently seeded by BLM
– Thickspike wheatgrass– Crested wheatgrass– Western wheatgrass– Four-wing saltbrush– Ladak Alfalfa
• Fenced in April 2005

Objectives
• Determine the relative success of restoration strategies to control cheatgrass competition and its prolific seed production.
• Determine whether a transition community of competitive natives can be established more readily than a diverse community of different growth forms

Split-plot treatment polygons (170m x
340m)
BLM cultural survey area
Northern Fenced Region
Southern Fenced Region
TreatmentControlSeed-BurnHerbicideUnseeded Control
1a
2b2a
1b
3a3b
4b4a
5a5b
6a 6b
10a10b11b11a
12a12b
7a 7b
8b8a
9a
9b
Transect 1, zero point
•4 treatments
•3 replicates per treatment
•2 seed mixtures
Experimental Design

Treatments
4 treatments:– Seed-Burn-Seed
• Sterile winter wheat seeded October 2004
• Burned October 2005– Seed Only– Herbicide –Seed
• Herbicide treatment – April 2005
– Unseeded Control
– Perennial species Seeded in November 2005

• 2 seed mixtures:Chosen assessions based on performance in
Experiment 1• Anatone bluebunch wheatgrass • Nezpar Indian ricegrass • Sherman big bluegrass • Shaniko Plateau squirreltail • Bannock thickspike wheatgrass • Magnar basin wildrye
Chosen seed mixture based on performance in Experiment 2
• Anatone bluebunch wheatgrass • High Plains Sandberg’s bluegrass • Sand Hollow squirreltail • Globe mallow • Eagle yarrow • Wyoming big sagebrush
Seeding mixtures were randomly assigned to sub- plot “a” or “b” (split-plot)
Seedings

Response Variables Measured
• Background Plant Community
• Aboveground Biomass
• Plant Density
• Soil Nutrients
• Soil Seedbank

Results: Background Plant Community• One year following treatment:
– Decreases in cheatgrass cover (p=0.07) following herbicide treatment
– Decrease in shrub cover (p=0.07) following burn treatment
Cheatgrass Cover
Treatment
herbicide seed/burn seeded controlunseeded control
Pe
rce
nt
Co
ver
0
20
40
60
80
100
Experiment 1 seedingExperiment 2 seeding
Shrub Cover
Treatment
herbicide seed/burn seeded controlunseeded control
Pe
rce
nt
Co
ver
0
2
4
6
8
10
Experiment 1 Seeding Experiment 2 Seeding

No significant treatment effect seen for annual forb (p=0.22), perennial forb (p=0.62), or native bunchgrass (p=0.41) cover
Results: Background Plant Community
Perennial Forb Cover
Treatment
herbicide seed/burn seeded controlunseeded control
Pe
rce
nt
Co
ver
0
20
40
60
80
100
Experiment 1 SeedingExperiment 2 Seeding
Annual Forb Cover
Treatment
herbicide seed/burn seeded controlunseeded control
Pe
rce
nt
Co
ver
0
20
40
60
80
100
Experiment 1 Seeding Experiment 2 Seeding
Bunchgrass Cover
Treatment
herbicide seed/burn seeded controlunseeded control
Pe
rce
nt
Co
ver
0
5
10
15
20
Experiment 1 SeedingExperiment 2 Seeding
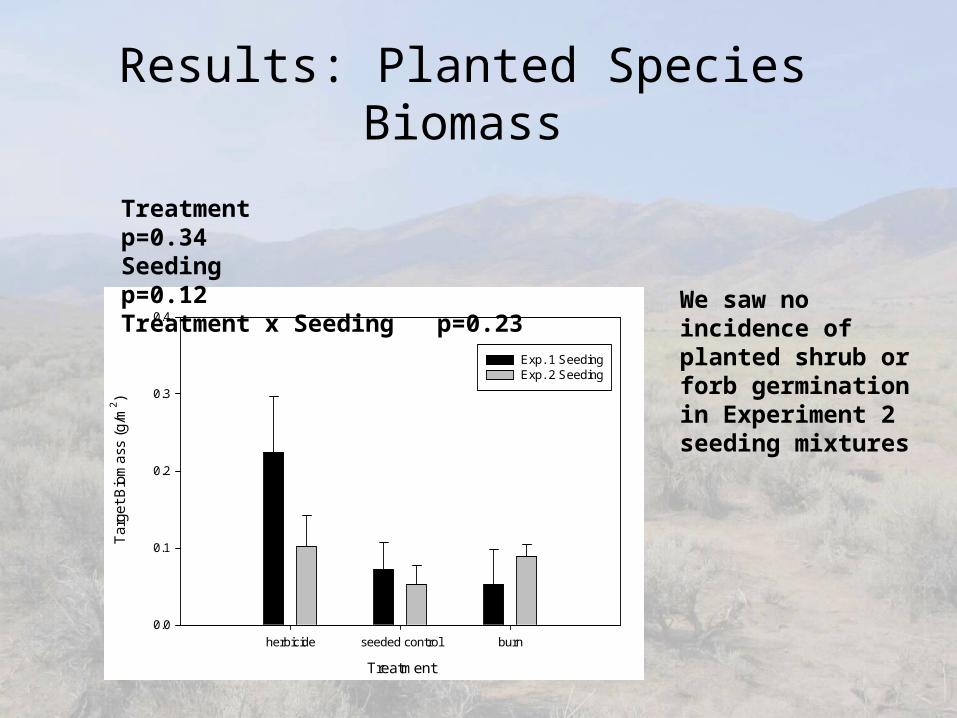
Results: Planted Species Biomass
Treatment
herbicide seeded control burn
Tar
get
Bio
mas
s (g
/m2)
0.0
0.1
0.2
0.3
0.4
Exp. 1 SeedingExp. 2 Seeding
Treatment p=0.34Seeding p=0.12Treatment x Seeding p=0.23
We saw no incidence of planted shrub or forb germination in Experiment 2 seeding mixtures

Results: Cheatgrass Biomass
Cheatgrass Biomass - Experiment 2 Seeding
Treatment
Bio
mas
s (g
/m2)
0
5
10
15
20
25
30
35
2005 2006
Cheatgrass Biomass - Experiment 1 seeding
Treatment
Bio
mas
s (g
/m2 )
0
5
10
15
20
25
30
35
2005 2006
*year p=0.02Treatment p=0.31Seeding p=0.42
Exp 1 Seeding Exp 2 Seeding

Results: Annual Forb Biomass
Annual Forb Biomass - Experiment 2 Seeding
Treatment
Biom
ass
(g/m
2 )
0
10
20
30
40
50
2005 2006
Annual Forb Biomass - Experiment 1 Seeding
Treatment
Biom
ass
(g/m
2 )
0
10
20
30
40
50
2005 2006
Exp 1 Seeding Exp 2 Seeding
*year p=0.01Treatment p=0.77Seeding p=0.58

• No treatment effect seen in perennial forb (p=0.82) or perennial grass (p=0.24) biomass one year following treatment
Results: Perennial Biomass

Results – Planted Species Density
Planted Species Density by Experimental Treatment and Seeding Treatment
Treatment
herbseed burn
seeded control
Den
sity
(In
divi
dual
s/m
2)
0
5
10
15
20
25
30
Seeding 1 Seeding 2
*Treatment p=0.003
* Seeding p=0.01Treatment x Seeding p=0.08
More germination in Exp 2 seeding plots
Higest number of germinants in herbicide treatments
We saw no incidence of planted shrub or forb germination in Experiment 2 seeding mixtures

Results: Cheatgrass Density
treatment
herb burn seeded control unseeded control
sqrt
BR
TE
/m2
0
10
20
30
40
50
Exp 1 SeedingExp 2 Seeding
Treatment p=0.07
* Seeding p=0.002
Lowest cheatgrass numbers in herbicide-treated plots
Difference in seedings due to planting (drill seeding vs. drill and broadcast seeding)?

Results: Density
• No treatment effect seen in forb (p=0.70) or bunchgrass (p=0.17) density one year following treatment

Results: Soil Nutrients
• Season Effect – Higher availability in later season– Early (February – April 2006)– Late (May – September 2006)
Resin capsule ammonium
Treatment
Control Herbicide Seed-Burn Seeding Control
Ug
per
day
NH
4
0.0
0.5
1.0
1.5
2.0
2.5
2/7/06-4/28/06 4/29/06-9/14/06
Resin capsule nitrate
Treatment
Control Herbicide Seed-Burn Seeding Control
Ug
pe
r d
ay
NO
3
0
1
2
3
4
5
6
2/7/06-4/28/06 4/29/06-9/14/06
*Ammonium: p<0.0001 Nitrate: p=0.07

Cheatgrass Seedbank:Results
Cheatgrass Seedbank
Treatment
burn herbicide seeded control unseeded control
0
1
2
3
4
5
6
sqrt litter sqrt soil
Sqr
t G
erm
inan
ts/m
2
Herbicide treatment significantly reduced cheatgrass litter (p<0.001) and soil (p=0.01) seedbank in first post-treatment year
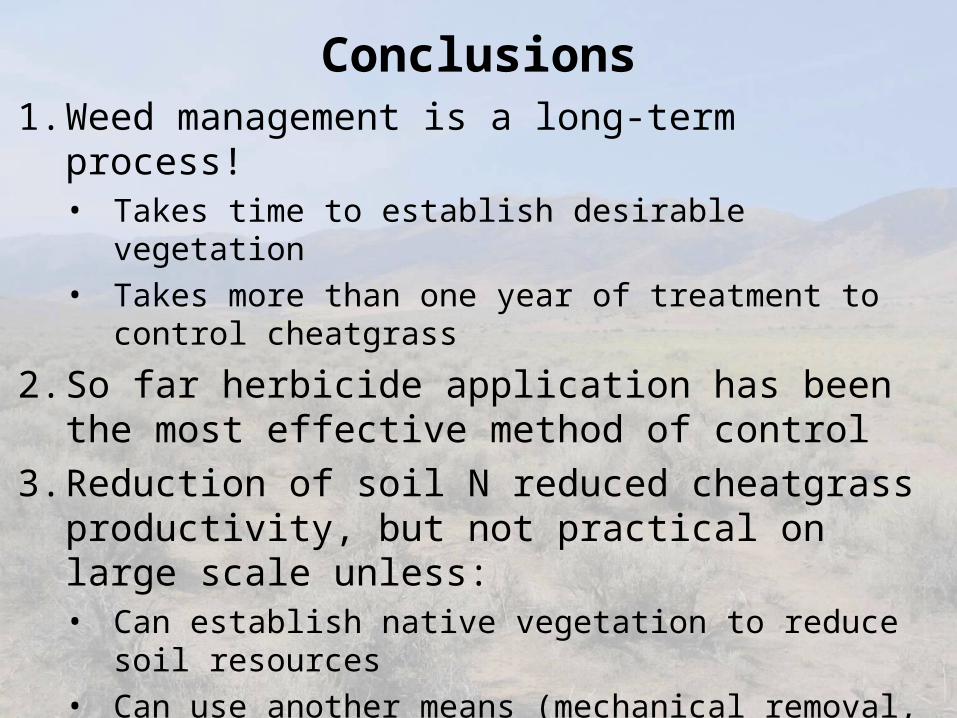
Conclusions1. Weed management is a long-term process!
• Takes time to establish desirable vegetation• Takes more than one year of treatment to control
cheatgrass
2. So far herbicide application has been the most effective method of control
3. Reduction of soil N reduced cheatgrass productivity, but not practical on large scale unless:• Can establish native vegetation to reduce soil resources• Can use another means (mechanical removal, burning) to
remove N from the system• Can suppress cheatgrass for > 1 season

Acknowledgements
• Funding: USDA CREES, NAES, BLM, USGS, USFS• Field and lab work: Laura Blonski, Jeff Burnham, Lisa
Ellsworth, Jacob Landmesser, Eugenie Montblanc, Christo Morris, Kendra Moseley, Scott Shaff, Carlos Wilson, and the many volunteers and student workers who set up plots and collected and processed data.
• Data analysis: David Turner, David Board, and George Fernandez – statistical consultation and expert SAS coding skills.