integration and optimization of trigeneration systems with...
TRANSCRIPT

INTEGRATION AND OPTIMIZATION OF TRIGENERATION SYSTEMS
WITH SOLAR ENERGY, BIOFUELS, PROCESS HEAT, AND FOSSIL FUELS
A Dissertation
by
EMAN ABDEL-HAKIM ALY MOHAMED TORA
Submitted to the Office of Graduate Studies of Texas A&M University
in partial fulfillment of the requirements for the degree of
DOCTOR OF PHILOSOPHY
December 2010
Major Subject: Chemical Engineering

INTEGRATION AND OPTIMIZATION OF TRIGENERATION SYSTEMS
WITH SOLAR ENERGY, BIOFUELS, PROCESS HEAT, AND FOSSIL FUELS
A Dissertation
by
EMAN ABDEL-HAKIM ALY MOHAMED TORA
Submitted to the Office of Graduate Studies of Texas A&M University
in partial fulfillment of the requirements for the degree of
DOCTOR OF PHILOSOPHY
Approved by:
Chair of Committee, Mahmoud EL-Halwagi Committee Members, Maria Barrufet Sergiy Butenko Sam Mannan Head of Department Michael Pishko
December 2010
Major Subject: Chemical Engineering

iii
ABSTRACT
Integration and Optimization of Trigeneration Systems with Solar Energy, Biofuels,
Process Heat and Fossil Fuels. (December 2010)
Eman Abdel-Hakim Aly Mohamed Tora, B.S., Elminia University;
M.S., Cairo University, Egypt; M.S., Texas A&M University
Chair of Advisory Committee: Dr. Mahmoud El-Halwagi
The escalating energy prices and the increasing environmental impact posed by the
industrial usage of energy have spurred industry to adopt various approaches to
conserving energy and mitigating negative environmental impact. This work aims at
developing a systematic approach to integrate solar energy into industrial processes to
drive thermal energy transfer systems producing power, cool, and heat. Solar energy is
needed to be integrated with other different energy sources (biofuels, fossil fuels,
process waste heat) to guarantee providing a stable energy supply, as industrial process
energy sources must be a stable and reliable system. The thermal energy transform
systems (turbines, refrigerators, heat exchangers) must be selected and designed
carefully to provide the energy demand at the different forms (heat, cool, power). This
dissertation introduces optimization-based approaches to address the following
problems:
• Design of cogeneration systems with solar and fossil systems
• Design and integration of solar-biofuel-fossil cogeneration systems
• Design of solar-assisted absorption refrigeration systems and integration with the
processing facility
• Development of thermally-coupled dual absorption refrigeration systems, and
• Design of solar-assisted trigeneration systems
Several optimization formulations are introduced to provide methodical and systematic
techniques to solve the aforementioned problems. The approach is also sequenced into
interacting steps. First, heat integration is carried out to minimize industrial heating and

iv
cooling utilities. Different forms of external-energy sources (e.g., solar, biofuel, fossil
fuel) are screened and selected. To optimize the cost and to overcome the dynamic
fluctuation of the solar energy and biofuel production systems, fossil fuel is used to
supplement the renewable forms of energy. An optimization approach is adopted to
determine the optimal mix of energy forms (fossil, bio fuels, and solar) to be supplied to
the process, the system specifications, and the scheduling of the system operation.
Several case studies are solved to demonstrate the effectiveness and applicability of the
devised procedure.
The results show that solar trigeneration systems have higher overall performance than
the solar thermal power plants. Integrating the absorption refrigerators improves the
energy usage and it provides the process by its cooling demand. Thermal coupling of the
dual absorption refrigerators increases the coefficient of performance up to 33%.
Moreover, the process is provided by two cooling levels.

v
ACKNOWLEDGEMENTS
First and foremost, I would like to express my deepest gratitude to the unique God most
merciful, my creator, for providing me knowledge, for guiding me in completing my
Ph.D., and for blessing my entire life.
Words cannot express my sincere appreciation and gratitude to Dr. Mahmoud El-
Halwagi for his guidance, teaching, caring, following up and supporting me during my
graduate studies at Texas A&M University. And special thanks to him for caring and
insisting on high quality research. He is more than an advisor and a mentor; he also
cares about people whoever they are. He always he has an open door, and more
appreciated, he always has an open mind and heart for everyone. Many thanks to Dr. El-
Halwagi for making me trust myself so that one day I could be a scholar.
Sincere thanks, gratitude, and appreciation go to the members of my committee, Dr. Sam
Mannan, Dr. Maria Barrufet, and Dr. Sergiy Butenko. Many thanks to Dr. Mannan for
his support all the time and his sincere help too. The feedback provided by Dr. Barrufet,
Dr. Butenko, and Dr. Mannan at my prelim is much appreciated. I am grateful that they
always challenged me to think more critically and I thank them for their helpful advice.
Many sincere thanks go to the Egyptian Government, the Ministry of Higher Education
and Scientific Research, and the National Research Center for funding me these four
years and for following my progress here continuously. Much care has been given by
them to assure that my research plan has progressed well. Also, I would like to thank my
advisor, Dr. Mahmoud EL-Halwagi, for supplementing the funds of my Ph.D. studies
and for allowing me to participate in three conferences.

vi
Many thanks to the Chemical Engineering Departments at the Egyptian National
Research Center, Cairo University, and Elminia University in Egypt.
I would like to express my heartfelt thanks to my dear mother for her support and for
encouraging me to study and to work hard all the time. Many thanks for her prayers for
me. Many thanks for my dear sister Dr. ‘Aml Tora’ for encouraging me to do more,
progress always and for her love, support, prayers, and encouragement.

vii
NOMENCLATURE
COP
Coefficient of performance
ih Enthalpy of stream i
.
m Flow rate (kg/s)
QBstr Bottom cycle stripper heat rate (kW)
Qevap Condenser heat rate (kW)
QEx-Pro Extracted heat from the process
Evaporator heat rate (kW)
QRef1 Refrigerant rate needed at first cooling level (kW)
QRef2 Refrigerant rate needed at second cooling level (kW)
QRefi Refrigeration needed at cooling level i (kW)
Qstr
Stripper heat rate (kW)
Rate of heat recovered from the top cycle to run the bottom cycle
(kW)
Rate of heat recovered from the top cycle to run the bottom cycle
(kW)
Rate of heat used to run the bottom cycle provided from external heat sources (kW)
DP
ctfTRe The dew point of the solution at the rectifier (oC)
Ts Source temperature of the a stream (oC)
Tt Target temperature of a stream (oC)
X Composition; mass fraction of the refrigerant at the mixture
As
Area of the sth solar collector
AFC
Annualized fixed cost
Fossil
fC Cost of fossil fuel
Fuel
pC Unit operating cost of the fossil fuel
fQRe
CondQ
TC
cv
QRe
ExtrQ

viii
ARSolar
spC_
, Unit operating cost of the solar energy for the AR system
CogenSolar
spC_
, Unit operating cost of the solar system for cogeneration
DirectSteamSolar
spC__
, Unit operating cost for the solar system for direct steam generation
f Index of fossil utility
FCP,u Flowrate*specific heat of hot stream u
CogenSteam
pH_ Enthalpy of steam received by the turbine in period p
TurbineExitSteam
pH__ Enthalpy of steam discharged by the turbine in period p
HCv,z,p Heat added to cold stream v in interval z during period p
HHu,z,p Heat removed from hot stream u in interval z during period p
DirectSteam
pH_ Heat needed for direct steam use during period p
NC Number of process cold streams
NH Number of process hot streams
Np Number of periods
p Index for periods
pPOWER Electric power produced during period p
QAbs Heat removed from the absorber
QCv,p Cooling load of utility v during period p
ARExternal
pQ_ External heat added to the stripper of the AR cycle through fossil
fuel and solar energy in period p
CogenFossil
pQ_ Heat added by the fossil fuel for cogeneration during period p
DirectSteamFossil
pQ__ Heat needed for direct steam usage by fossil fuel during period p
QHu,p Heating load of utility u during period p
Solar
psQ , Solar energy collected during period p
Annual
SolarQ Annual energy collected by the solar system
CogenSolar
pQ_ Heat added by the solar system for cogeneration during period p

ix
DirectSteamSolar
pQ__ Heat needed for direct steam usage by solar energy during period p
SolarUseful
psQ_
, Useful power collected (and delivered in a thermal form) per unit area of the sth solar collector in period t and As is the area of the sth solar collector
QStr Heat added to the stripper
QRef AR refrigeration duty
processStr
pzQ,
, Excess process heat added to the water loop
rz,p Residual heat leaving interval z during period p
s Index for solar collectors
TAbs Temperature of the absorber
Fossil
fT Temperature of fossil fuel
TRef AR refrigeration temperature
in
strT Minimum acceptable temperature for heating the water loop
Tus Supply temperature of hot stream u
Tut Target temperature of stream u
tz-1,p The cold-scale temperatures at the top line defining the zth interval
u Index of hot streams
v Index of cold streams
z Index for temperature intervals
Greek:
sα Function for the annualized fixed cost of the sth solar power plant
∆Tmin
Minimum approach temperature
pψ Function for steam-turbine power
HRExchT
,∆
Driving force of the heat exchanger recovering heat between the process and the AR hot water feed tank

x
Index:
i
Number of stream

xi
TABLE OF CONTENTS
Page
ABSTRACT………………………………………………………………………. iii
ACKNOWLEDGEMENTS………………………………………………………. v
NOMENCLATURE………………………………………………………………. vii
TABLE OF CONTENTS………………………………………………………… xii
LIST OF FIGURES………………………………………………………………. xv
LIST OF TABLES………………………………………………………………... xviii
CHAPTER
I INTRODUCTION……………………………………………………….. 1
I.1. Solar Hybrid Trigeneration……………………………………… 1 I.2. Solar Trigeneration System and Process Integration……………. 3 I.3. Integration of Refrigeration Cycles……………………………… 9 I.4. Overall Objective of the Dissertation and Research
Challenges………………………………………………..………
11 I.5. Problem Decomposition…………………………………………. 12 I.6. Dissertation Overview…………………………………………… 12
II BACKGROUND AND LITERATURE REVIEW……………………… 14
II.1. Solar Collectors………………………………………………….. 14 II.2. Performance of the Concentrating Collectors…………………… 25 II.3. Solar Systems………………………………………………………… 26 II.4. Solar Thermal Plants…………………………………………….. 28 II.5. Green House Gas Emissions and Global Warming……………... 33
III OPTIMAL DESIGN AND INTEGRATION OF SOLAR ENERGY, FOSSIL FUELS, AND/OR BIOFUELS FOR SUSTAINABLE AND STABLE POWER OUTLET, AND HEAT SUPPLY……………….........................................................
35
III.1. Introduction……………………………………………………… 35 III.2. Problem Statement………………………………………………. 37 III.3. Approach………………………………………………………… 39 III.4. Modeling of the Solar Collection System……………………… 41 III.5. Optimization Formulation……………………………………….. 43 III.5.1. Integration of Solar Energy and Fossil Fuel……….. 43 III.5.2. Integration of Solar Energy, Fossil Fuel, and
Biofuels……………………………………………
45

xii
CHAPTER Page
III.6. Case Study………………………………………………………. 49 III.6.1. Optimum Integration of Solar Energy, Process
Heat, and Fossil Fuels to Produce a Stable Power Supply……………………………...........................
49 III.6.2. Optimum Design and Integration of Solar
Energy, Biofuels, Process Heat, and Fossil Fuels to Produce a Stable Heat Supply…………….
51
IV INTEGRATION OF ABSORPTION REFRIGERATORS INTO INDUSTRIAL PROCESSES WITH HEAT EXTRACTION FROM SOLAR ENERGY, FOSSIL FUELS, AND EXCESS PROCESS HEAT ……………………………...
54
IV.1. Introduction……………………………………………………… 55 IV.2. Problem Statement………………………………………………. 58 IV.2.1. Integration of Absorption Refrigerators
into Industrial Processes with Heat Extraction from Solar Energy, Fossil Fuels, and Excess Process Heat……………………
58 IV.2.1.1. Approach……………………………. 60 IV.2.1.2. Objective Function………………….. 65 IV.2.1.3. Case Study…………………………... 66 IV.2.2. Thermal Coupling of Two-Level Dual
Absorption Refrigeration System with Integration to Industrial Process…………………...
82 IV.2.2.1. Objective…………………………….. 82 IV.2.2.2. Approach…………………………….. 82 IV.2.2.3. Case Study…………………………… 89 IV.2.2.4. Results and Discussion………………. 90
V INTEGRATED DESIGN OF SOLAR-ASSISTED TRIGENERATION SYSTEMS…………………………………………
97
V.1. Introduction……………………………………………………… 98 V.2. Problem Statement………………………………………………. 99 V.3. Approach………………………………………………………… 102 V.4. Mathematical Formulation………………………………………. 104 V.5. Case Study: Solar - assisted trigeneration in a pharmaceutical
plant………………………………………………………………
112
VI CONCLUSIONS AND RECOMMENDATIONS……………………… 117
REFERENCES…………………………………………………………………… 119
VITA……………………………………………………………………………… 125

xiii
LIST OF FIGURES
FIGURE Page
1.1 Power Generation Through a Steam Turbine System………………… 1
1.2 Combined Heat and Power (Process Cogeneration)………………….. 2
1.3 An Absorption Refrigeration Cycle…………………………………… 2
1.4 A Trigeneration System with Fossil Fuels……………………………. 3
1.5 Top and Bottom Cogeneration Configurations……………………… 8
1.6 Integrating MRM with Two Cooling Levels into Process GCC……… 10
1.7 Trigeneration Problem with Fossil Fuels, Solar Energy, and Biofuels…..............................................................................................
11
2.1 Flat-Plate Solar Collectors…………………………………………… 16
2.2 Evacuated Tube Solar Collectors System…………………………… 19
2.3 Evacuated Tube Solar Collectors, Two Concentration Configurations………………………………………………………..
20
2.4 Compound Parabolic Collector………………………………………... 21
2.5 Solar Radiation from Sun to Collector Aperture……………………… 24
2.6 Closed Solar System………………………………………………….. 27
2.7 Open Solar System…………………………………………………… 27
3.1 Schematic Representation of the Problem Statement………………. 38
3.2 Header Balance Resulting from Cogeneration Analysis……………… 40
3.3 Key Aspects Addressed by the Approach……………………………. 41
3.4 Balance around the dth Header……………………………………… 44
3.5
3.6
Structure Representation of the Problem……………………………
Monthly Solar and Fossil Contribution………………………………
47
51

xiv
FIGURE Page
4.1 Schematic Representation of the Problem Statement ………………. 60
4.2 A Typical AR System………………………………………………… 61
4.3 Heat Supply to AR via a Heat Recovery Network and a Hot Water Loop…………………………………………………….
62
4.4 Target Identification and Integration of the GCC Representation with the Hot Water Loop………………………………
63
4.5 A Simplified Flowsheet of the Pharmaceutical Process of Case Study I…………….......................................................................
67
4.6 The GCC of the Pharmaceutical Process……………………………… 68
4.7 Hourly Useful Collected Solar Energy………………………………… 69
4.8 A Simplified Flowsheet of the Formic Acid Process Used in Case Study II…………………………………………………………….
73
4.9 The GCC for the Formic Acid Process………………………………. 75
4.10 Acrylic Acid Production Flowsheet…………………………………… 78
4.11 Hourly Useful Solar Radiation at Abu Dhabi…………………………. 79
4.12 The GCC of the Acrylic Acid Production Process…………………… 81
4.13 AR Systems with Hot Water Loop for Heat Recovery………………. 83
4.14 Target Identification and Integration of the GCC Representation with the Hot Water Loop…………………………………………………..
84
4.15 The Two Cycles Coupled Thermally by Internal Heat Integration……………………………………………………….
86
4.16
The GCC for the Process with Thermal Coupling of the Two AR Cycles……………………………………………….......................
87
4.17 The Top Cycle Is“NH3/H2O” and the Bottom Cycle Is “H2O/LiBr” Simulation flow sheet…………………………………………………..
91
4.18 Simulation Results of the Temperature versus Vapor Fraction for Generator of the Top Cycle “NH3/H2O” ………………………….
92
4.19 Thermally Coupled Dual System……………………………………… 92
4.20 Effect of Top Cycle Size on the Bottom Cycle Size………………… 95

xv
FIGURE Page
4.21 Effect of the Top Cycle Heat Source on the Entire Dual System Performance……………………………………………………
96
5.1 Schematic Representation of the Problem Statement………………… 101
5.2 The Extended Transshipment Model for Trigeneration……………….. 108
5.3 A Simplified Flowsheet of the Pharmaceutical Process of Case Study I………………………………………………………………….
113
5.4 Percentage External Energy Supplied by the Solar Collectors for Two Levels of Carbon Credits……………………………………...
116

xvi
LIST OF TABLES
TABLE
Page
1.1 The Proposed Operation Mode for Cogeneration Plants ………………………………………………………………….
4
1.2 Proposed Prime Movers and Solar Collector Types for Solar Cogeneration Systems…………………………………………………..
6
1.3 Different Types of AR to be Integrated with Process Cogeneration Plant………………………………………………………
9
2.1 Absorptivity (α) and Emissivity (ε) of Some Collector Coating Materials………………………………………………………..
17
2.2 Comparison between the GI Collector with and without Selective Coating………………………………………………………
17
2.3 Number of the GI Collectors’ Covers on Its Performance……………... 18
2.4 Typical Heat Demand for H2O/LiBr AR to Produce 1 ton Refrigerant (1 TR)………………………………………………………
33
3.1 Monthly Average of Useful Collected Solar Energy………………….. 50
3.2 Cost and Availability of Biofuel……………………………………….. 52
3.3 Monthly Average of Collected Solar Energy…………………………... 53
3.4 Fractional Contribution of Each Form of Energy to the Monthly Heating Utility Requirement of the Process…………………..
53
4.1 Data for the Process Hot and Cold Streams for Case Study I………….. 68
4.2 Monthly Average of Usefully Collected Solar Energy ………………… 70
4.3 Percentage Contribution of Fossil versus Solar Energy to the Monthly Heating Requirement of the AR System for the Scenario: $5/tonne CO2 eq. GHG credit (Ac = 2,477 m2)…………….
71
4.4 Percentage Contribution of Fossil versus Solar Energy to the Monthly Heating Requirement of the AR System for the Scenario: $20/tonne CO2 eq. GHG credit (Ac = 4,779 m2)………………………………………………………..
72
4.5 Data for the Process Hot and Cold Streams for Case Study I……….. 74

xvii
TABLE
Page
4.6 Percentage Contribution of Fossil versus Solar Energy to the Monthly Heating Requirement of the AR System for Case Study II for the Scenario: $5/tonne CO2 eq. GHG credit (Cost = $53 k/yr, Ac = 1,272 m2)…………………………………….….
76
4.7 Percentage Contribution of Fossil versus Solar Energy to the Monthly Heating Requirement of the AR System for Case Study II for the Scenario: $20/tonne CO2 eq. GHG Credit (Ac = 2,348 m2)………………………………………………………….
77
4.8 Data of the Targeted Process Hot and Cold Streams for the Acrylic Acid Case Study ……………………………………………
79
4.9 Monthly Average of Usefully Collected Solar Energy for Abu Dhabi………………………………………………………..
80
4.10 AR Streams Data to be Integrated Thermally with the Process Streams………………………………………………………………….
88
4.11 Input Data Used in the Simulation……………………………………… 93
4.12 Summary of Simulation Results………………………………………... 94
5.1 Data for the Process Hot and Cold Streams for Case Study I…………. 114
5.2 Monthly Average of Usefully Collected Solar Energy…………………. 115

1
CHAPTER I
INTRODUCTION
I.1. SOLAR HYBRID TRIGENERATION
The dwindling fossil energy sources and the increasing concern about the consequences
of greenhouse gas emissions on global climatic changes provide much motivation for
the use of renewable energy sources. As such, there is a significant need to incorporate
renewable energy sources in industrial processes. There is also much need for
integrated energy systems that address the combined cooling, heating, and power needs
of the process “CCHP” which is referred to as trigeneration. Figures 1.1 and 1.2
describe power generation and cogeneration (combined heat and power) where steam
turbines are used to produce power and the discharged steam is used for heating. Figure
1.3 is an absorption refrigeration cycle where two fluids are used: a working fluid and
an absorbent. The mixture of the working fluid and the absorbent is pumped then the
working fluid is stripped using a heat source (e.g., steam). The stripped working fluid is
condensed at higher pressure to discharge heat to a high-temperature sink then let down
to an evaporator that extracts heat from a low-temperature heat source and the cycle
continues.
Figure 1.1. Power Generation through a Steam Turbine System [1].
This dissertation follows the style and format of International Journal of Energy
Research.
F l a m e
( H e a t i n )
P o w e r O u t
S t e a m
C o o l i n g
W a t e r
H e a t o u t )C o n d e n s e r
T u r b i n e
B o i l e r

2
Figure 1.2. Combined Heat and Power (Process Cogeneration).
Figure 1.3. An Absorption Refrigeration Cycle [1].
Figure 1.4 represents a trigeneration system which uses a fossil fuel to produce steam
which is fed to turbines for power generation and with the discharged steam used for
heating and for an absorption refrigeration cycle.
F la m e
(H ea t in )
P o w er O u t
S team
E x tra c tio n
T ur bin e
B o iler
P ro cess H e a t D e m a nd s
S te a m
C o n d e n s a te
High-TemperatureHeat Sink
TH
Low-TemperatureHeat Source
TL
Qout
Qin
Condenser
EvaporatorLow-pressure
vapor
High-pressure
vapor
Q2
Q1
Absorber
Stripper
W
Solution
Solution
Throttling
Valve
Pump
Source
of Heat?

3
Figure 1.4. A Trigeneration System with Fossil Fuels.
Trigeneration offers several advantages including improving the overall efficiency of the
energy system, the reduction of fuel consumption, and the reduction of greenhouse gas
“GHG” emissions.
I.2. SOLAR TRIGENERATION SYSTEM AND PROCESS INTEGRATION
In utilizing process integration, it is important to recognize the chemical process as an
integrated system and that problem solving strategies must deal with root causes and not
just symptoms of the problem. Traditional approaches to process development and
improvement have been limited in applicability, can be time and cost intensive, do not
guarantee the global solution, and do not reveal solutions that can be non-intuitive.
Integration techniques can be used in process synthesis and conserve valuable resources
[1].
Flame
(Heat in)
Power Out
Steam
Extraction
Turbine
Boiler
Process Heat Demands
Steam
Condensate
High-TemperatureHeat Sink
TH
Low-TemperatureHeat Source
TL
Qout
Qin
Condenser
EvaporatorLow-pressure
vapor
High-pressurevapor
Q2
Q1
Absorber
Stripper
W
Solution
Solution
Throttling
Valve
Pump
Absorption
Refrigeration for the Process

4
Cogeneration has been used for a while in industrial sectors. Primary cogeneration has
traditionally referred to combined heat and power production. Recently, cogeneration
has been used to refer to combined power and useful thermal energy production that
includes heating and/or cooling [2]. A cogeneration plant consists mainly of a prime
mover, a heat recovery unit, and an electric-power generator. The prime mover can be a
steam engine, a gas engine, or a reciprocating engine. The heat recovery unit is heat
recovery steam generator for steam or hot water production, and (or) absorption chiller
to produce cooling [2].
There are three modes of operation: 1) the base load system: the plant works at a full
load for more than 6000 hours per year; 2) the intermediate system: the plant works for
average 4000 hours per year; 3) the peak shaving system: the plant operates around 1000
hour per year to provide electricity at the hours of electricity peak [2]. At this work, we
propose certain cogeneration plant operation modes to be more suitable for specified
industrial processes as given by Table 1.1.
Table 1.1. The Proposed Operation Modes for Cogeneration Plants.
Cogeneration
Energy
forms
Cogeneration
Operation
mode
Hours/year System
equipment
Industry operation
mode
Power + Cool Peak shaving ≤ 1000 SC - AR - FFB Heavy continuous processes
Power + Heat Peak shave ≤1000 SC – TES -FFB
Power Cool + Heat
Base load ≥ 6000 SC – TES - AR – HRSG
FFB
Continuous heavy load
Power Heat or Cool
Intermediate ~ 4000 SC – AR – TES - HRSG - FFB
Batch process Seasonally process Commercial plants
Institutional SC: solar collectors; AR: absorption refrigerator; FFB: fossil fuel boiler; TES: solar thermal energy storage; HRSG: heat recovery steam generation.

5
These cogeneration systems are available as packages. However these packages have
some advantages. They are not customized for certain plants [2]. The design of topping
cogeneration systems is usually carried out according to the basics of the Public Utility
Regulatory Policies Act (PURPA). Large industrial gas- or oil-fired cogeneration plants
can be more efficient than using any combination of power and thermal energy separate
systems. To insure the cogeneration plant is well designed, it must have efficiency more
than 45% and provide more than 5% thermal energy; or provide thermal energy more
than 15% with efficiency more than 42.5 %, where the efficiency is defined as [2]
Fuel
ThermalPowercogtop
*5.0_
+=η (1.1)
For bottoming cycle using oil or gas as supplementary fuel, the efficiency must be more
than 45%, but the efficiency is defined as
Fuel
Powercog
Bot=_η (1.2)
PURPA restricts small plants (< 80 MW) to use solar energy, wind energy, wastes,
biomass, geothermal, or any combination of them without setting minimum efficiency
[2].
The following points should be considered in optimizing solar cogeneration approaches:
1. Process heat integration to determine:
a) Heating demand
b) Cooling demand
c) Power demand
2. Prime-mover selection to choose:
a) Steam turbine is used if the heat to power ratio (HPR) is high from
4-10; and if the process has big pressure reduction so the valve
can be replaced by steam turbine [2].

6
b) Gas turbine is used if the heat to power ration is in the range of 1-
3.
c) Combined gas and steam turbines are used if power is needed and
heat as well so the steam turbine produces extra steam.
d) Reciprocating engine if the HTPR is low typically 0.5.
3. Selecting the solar collectors
Each one of the previously mentioned prime movers requires a certain
temperature level and heating media. For steam engines, the working fluid is
steam. Therefore Fresnel reflector working at temperature typically 285oC [3]
and parabolic trough solar collectors working up to 400oC [4] are the suitable
solar collectors. The gas turbines use air at high temperature therefore
heliostats and central tower is more suitable for temperature typically 500oC.
Table 1.2 gives the proposed solar collectors types for each prime mover.
Table 1.2 Proposed Prime Movers and Solar Collector Types for Solar Cogeneration Systems.
Process Heat : Power
Ratio
Prime Mover T (oC)
Solar collectors types
High ≥ 4
Steam turbines “back-pressure”
400 285
Parabolic trough Compact Fresnel
Medium 1:3
Gas turbines 550 Central receiver
Zero Steam condensing turbines Sterling engine
400 285
Direct Power
Parabolic trough Fresnel Reflector
Parabolic dish

7
4. Selecting the fossil fuel
Steam turbine: solid fuels like coal are recommended for small steam
cogeneration plant [2]. For bigger plants (> 50MW) other fuels (gas, liquid)
work too.
Gas turbines: gas fuels are recommended. Natural gas gives less greenhouse
gas emissions (GHGE).
5. Schedule and optimize the integration between the different heat sources of
the prime mover based on economic analysis: solar radiation intensity varies
continuously; which requires having thermal energy storage and/or fossil fuel
as backup system. The fossil fuel is used in addition to the availability of
process excess or waste heat to be integrated as well. To get stable power,
heat, and cool supply, the different energy sources (solar, process heat, fossil)
availability and prices need to be considered simultaneously. Therefore,
optimum integration by optimizing design and operation aspects of the entire
system should be considered.
6. The environmental aspects (GHGE) are considered as well; solar energy is a
clean energy source.
Different industries have different power demands. Therefore, these demands need to be
optimized for each industry separately (e.g., petrochemical, pulp and paper, etc.). The
location of the power cycle (topping or bottoming) affects the cost and efficiency.
Industrial processes that require high temperatures like metal treating can use the
bottoming cogeneration; while industries that need medium or low temperatures can use
top power cycle. Figure 1.5 shows the differences between the two cases.

8
Figure 1.5. Topping and Bottoming Cogeneration Configurations.
7. Design of the heating system: based on the previous six items
8. Selecting and designing the suitable refrigeration cycle: based on the
previously mentioned seven items, considering deeply process cooling
demand (temperature levels, cooling amount, and profile). Absorption
refrigeration (AR) has different kinds, each requiring heat source at certain
temperature level, and may produce cooling at different conditions.
Therefore, Table 1.3 summarizes the suitable AR for different process
cooling requirements.
Topping Cogeneration
Bottoming Cogeneration
Power Production
Prime Mover
Prime Mover
Thermal energy (Steam)

9
Table 1.3. Different Types of AR to Be Integrated with a Process Cogeneration Plant.
AR type Driving
heat T(oC)
Cool production
T(oC)
working fluid
Single effect 85 1.5-25 H2O/LiBr 130 ≥ -33.3 NH3/H2O
Double effect >120 1.5-25 H2O/LiBr
>150 ≥ -33.3 NH3/H2O Thermally coupled dual ≥130 ≥1.5 level 1
≥-33.3 level 2 H2O/LiBr NH3/H2O
I.3. INTEGRATION OF REFRIGERATION CYCLES
Mechanical refrigeration machine (MRM) can be defined as a heat pump that absorbs
heat below the ambient temperature and rejects it at the ambient temperature level. This
allows integrating the refrigerators into the processes using pinch analysis as the heat
pump methodology. Therefore MRM can be integrated across the pinch [1, 4, 5]. The
grand composite curve (GCC) can determine how much heat is needed to be removed
and at what level. But that requires designing MRM providing different cooling levels if
the GCC shows that the cooling demand has different temperature levels [4-6]. MRM
has addressed this issue by having different compressors and different expansion valves;
each valve corresponds to certain cooling demand level as shown at Fig. 1.6.

10
Figure 1.6. Integrating MRM with Two Cooling Levels into Process GCC [5].
On the other hand, integrating absorption refrigerators (AR) has not received the same
level of attention as the MRM. Process integration needs to give more attention to AR in
two aspects where AR differs from the MRM; these two aspects are:
1. Any single-stage AR is designed to provide one cooling level; which is
considered a shortage of the AR in case of a desire to integrate it into industrial
processes requiring different cooling levels [4,5,7]. A more expensive double
effect AR is needed to provide two cooling levels. Double effect AR is not only
expensive, but it also requires a higher temperature heat source (>130oC).
2. AR absorbs heat below the ambient temperature like the MR but AR also absorbs
heat at temperatures above 80oC. This heat is the needed to drive AR. Extracting
extra heat from the process at this temperature level to drive AR gives the AR
potential to compete with MR as this heat is considered waste and is free to be
reused by AR.
3. Therefore, this dissertation will address these two issues in details.

11
I.4. OVERALL OBJECTIVE OF THE DISSERTATION AND RESEARCH
CHALLENGES
The problem to be addressed in this work is represented by Fig. 1.7. The overall
objective is to develop a systematic procedure for the optimal design and integration of a
trigeneration system with energy sources from solar sources and other energy sources
including fossil fuels and/or bio fuels. The research challenges include:
• What are the optimum heating and cooling requirements for the process?
• What fractions of energy should be provided by solar energy, fossil fuels, and/or
bio fuels?
• How to handle dynamic changes and price fluctuations for the different energy
forms while providing a steady-state performance to meet the process
requirements for heating, cooling, and power?
• What are the optimum design and operating variables of the system?
• What is the impact of GHG policies (e.g., carbon credits) on the system design?
Figure 1.7. Trigeneration Problem with Fossil Fuels, Solar Energy, and Biofuels.
Power O ut
Steam
Extraction
Turbine
Process Heat Demands
Steam
Condensate
H igh-Tem pera tureH eat Sink
T H
Low-Tem peratureH eat Sou rce
TL
Q out
Q in
C onde nser
Evapora torLow-pressurevapor
High-pressure
va por
Q 2
Q 1
A bsorber
Strip per
W
S oluti on
S oluti on
Throttling
Valve
Pump
Absorption Refrigeration for the Process
SteamGeneration
Solar energy
Biomass/Biofuel
FossilFuel

12
In this work, we consider solar energy and bio fuels in addition to fossil fuels. The
objective is to develop a systematic procedure for integrating the three forms of energy
to meet the thermal needs of an industrial process. The problem is posed as an
optimization program that seeks to minimize the overall cost subject to technical and
environmental constraints.
I.5. PROBLEM DECOMPOSITION
Because of the complexity of the problem to be addressed, it has been decomposed into
several problems of increasing complexity. These include:
• Solar and fossil for power generation
• Solar, bio, and fossil for cogeneration
• Solar energy, and fossil fuels integration with process extra heat to run
absorption refrigeration and produce cool
• AR systems using solar energy, excess process heat, and fossil fuels
• Thermal coupling of dual AR systems
• Solar-assisted trigeneration systems in industrial processes
I.6. DISSERTATION OVERVIEW
- CHAPTER II is a literature survey and background about solar energy industrial
basics and applications (heating, cooling, and power), global warming (GW),
greenhouse gas emissions, carbon tax, and absorption refrigeration.
- CHAPTER III outlines a systematic approach for the integration, design, and
optimization of solar energy into an industrial facility. The dynamic profile of solar
radiation through the entire year is adjusted to provide a stable power supply.
- CHAPTER IV covers the first topic “Optimal design and integration of solar
systems and fossil fuels for sustainable and stable power outlet”. The option of
integration of fossil-fuel with the solar system to provide a compensation effect (power

13
backup to supplement the power main source from solar energy) that leads to a stable
power outlet is considered.
- CHAPTER V considers integrating bio fuels with solar energy as well as fossil
fuel. The limited seasonal availability of bio fuels raw material acts as an upper limit of
the bio fuel contribution. Also solar energy availability is another variable limited by
solar collectors’ area. An optimization formulation to determine the optimum mix and
schedule under these restrictions has been developed.
- CHAPTER VI deals with the integration of absorption refrigerators into
industrial processes with heat extraction from solar energy, fossil fuels, and excess
process heat. The problem to be addressed involves the design and integration of an AR
system into an industrial facility and the optimal selection of the optimal mix of energy
sources which varies dynamically throughout the year.
- CHAPTER VII addresses the topic of thermal coupling of two-level dual
absorption refrigeration system with integration with industrial process.
- CHAPTER VIII puts the different problems together to form the trigeneration
system. The industrial trigeneration system has its own features. An extended
transshipment model is developed to serve as the basis for an optimization approach.
- CHAPTER IX summarizes the major conclusions of this work and offers
recommendations for future work.

14
CHAPTER II
BACKGROUND AND LITERATURE REVIEW
II.1. SOLAR COLLECTORS
Solar collectors (SC) are being used to collect solar radiation, absorb it by a working
fluid; which converts the solar radiation energy into hot fluids. SC can be considered a
special case of heat exchangers. With some critical differences regarding solar energy
has low and variable energy flux. In addition to that the working fluid at the collectors
gets heat by radiation. The maximum heat flux without optical concentration is typically
1.1 kW/m2, and the wave length varies from 0.3 to 3 µm [8]. SC can be divided into
concentrating and non-concentrating collectors.
Flat-plate collectors (FPC) are the simplest kind to be manufactured, and require little
maintenance. They can provide heat at moderate temperature up to around 100oC.
Therefore their applications are limited for low temperature processes, heat water, and
simple air conditioners.
FPC can have (a) liquid working fluid, and (b) air working fluid media.
The liquid FPC composed of:
1. Absorber: black metal/plastic sheet absorbs solar radiation and exchange it with
the working fluid.
2. Tubes: fluid tubes are the place where the working fluid is circulated
3. Cover: transparent glass cover reduces the convection and radiation loss.
4. Insulation: insulation is used to prevent back and side losses
5. Box: a container for all the four mentioned items
The air FPC is like the liquid FPC with replacing the fluid tubes by a duct for air
circulation [8-10]. The steady state useful energy output can be given by:

15
)([apmLcsu
TTUSAq −−= (2.1)
S (J/m2.h) refers to the average energy absorption rate in an hour, and it can be expressed
as:
)2
)(1()(
))2
(1()2
)(1()()1()()( 3
βατρ
ββαττα
CosI
SinfCos
AIRAIIS
gg
didbbidb
−
+++
−++=
(2.2)
The last equation is simplified to be expressed as:
bav
Tav IS
)(96.0)(
)(
τατα
τα
≅
=
(2.3)
The efficiency of a collector (thermal efficiency) is the ratio between the useful solar
radiations to the incident radiation and can be given by:
TI
qs=η
(2.4)
It is common to re-write equation 1 in the following form [8]:
)]()([aiLRTavRcu
TTUFGFAQ −−= τα (2.5)

16
The absorber is made of metal sheets with 1-2 mm thickness. The tubes are made of the
same metals with diameters of 1-1.5cm. The preferred metal is copper, that followed by
aluminum in case of copper unavailability. But aluminum requires special treated water;
therefore steel must be used in this case. The covers are made of 3-4 mm glass sheets.
And the insulation materials of the bottom and sides are glass wool, and mineral wool.
Figure 2.1 shows the FPSC with three possible alternatives to integrate the tubes into the
absorber. The tubes can be below, above, or in line with the absorber plate.
Figure 2.1 Flat-Plate Solar Collectors [8-10].
Plastics are candidates to replace the metals in all previously mentioned FPSC parts in
applications requiring temperatures less than 70oC to avoid its decomposition by higher
sun temperatures. Plastics production is cheaper and requires less energy than metals
production, but its thermal conductivity is lower and its thermal expansion is higher than
metals. The life cycle analysis recommend the metals as plastics are produced from
fossil fuel derivatives; thus the sustainability design need to consider that in case of
producing large amounts of FPSC from plastics.
The metal surface acting as absorber is coated with special coating materials that have
high absorptivity of radiation wave length < 4 µm, and low emissivity of radiation wave
length more than 4 µm. This is the desired property as solar radiation hits the collectors
Cover Absorber Tubes
Insulation Container

17
with wave length < 4 µm and this radiation comes off the absorber at longer wave length
(4-8) µm. This surface layer has thickness of 0.1 µm and almost made of copper oxide
on the copper absorber, black chrome on aluminum and steel, or nickel black on
galvanized iron; Table 2.1 shows their absorptivity and emissivity values with the
maximum temperature that can withstand and work under it [10].
Table 2.1. Absorptivity (Α) and Emissivity (ε) of Some Collector Coating Materials [8-10].
α ε Tmax(oC)
Copper oxide 0.89 0.17 300
Nickel black 0.89 0.12 300
Black chrome 0.868 0.088 400
Table 2.2 shows the effect of the coating on the performance of the galvanized collectors
(GC). The comparison is based on a collector with one cover collector.
Table 2.2. Comparison between the GI Collector with and without Selective Coating [8-10].
Non selective surface Selective surface
(τε) beam radiation 0.8316 0.7563
(τε) diffuse radiation 0.7567 0.6882
Ut (W/m2.K) 6.39 3.61
η 40.6 47
The covers made of glass have high transmittance. The covers number is from one to
three. Increasing the number decreases the losses but also decrease the transmittance (τ)

18
and the in turn the absorptivity; therefore there are an optimum number of covers. The
effect of the covers on the GI collector’s performance is given at Table 2.3. One cover
increases the efficiency by around 2% but adding the second cover decreases the
efficiency.
Table 2.3. Number of the GI Collectors’ Covers on Its Performance [10].
Number of covers 1 2 3
(τε) beam radiation 0.8316 0.7305 0.6447
(τε) diffuse radiation 0.7567 0.6424 0.5631
Ut (W/m2.K) 6.39 3.87 2.72
η 0.406 0.433 0.418
The calculation of useful solar radiation by any collector is done assuming that the
collectors are completely clean; however this is not a practical assumption. Collectors
need to be cleaned regularly like once monthly or more frequently.
This collector performance needs to be multiplied by a correction factor to consider that
dust cover the cover; which decreases its transmittance. The correction factor changes by
location, tilt angle, cover material (glass or plastic). But it is acceptable to have the dust
effect correction factor by 0.92-0.99; which means the real useful solar radiation by the
collector equals 0.92-0.99 of the estimated values [8-10].
To decrease the convection loss from the top of the FPSC, evacuating the space between
the absorber and the cover was proposed. In turn a tubular container and cover were a
necessity as only tubular bodies can withstand big pressure difference; that is introduced
evacuated tube solar collectors (ETSC). ETSC is an intermediate technology between

19
the FPSC and the concentrated solar collectors [8-10]. ETSC has two main types; FP-ET
and C-ET.
FP-ETSC consists of conventional FPSC with two tubes connected as U surrounded by
evacuated tube as shown at Figure 2.2. The modules are stacked together. The vacuum
eliminates the convection loss. The second type is the C-ET. Each module has three
tubes surrounded each other; the most outer diameter is 6-7 cm diameter. The modules
are separate, not stacked together, and below them there is a back diffuser. Therefore the
radiation hits the tubes are beam, diffuse, and reflected radiation from the back diffuser
as shown at Fig. 2.2. This back diffuser can have two shapes. The first is tubular
absorber with diffuse back reflector, and the second with specular cups reflectors as
shown at Fig. 2.3.
Figure 2.2 Evacuated Tube Solar Collectors System (Right: FP-ETSC; Left: C-ETSC) [10].
The performance of ETSC is much better than FPSC. The efficiency can increase more
than 50% under certain conditions of solar radiation and inlet temperature of the working
fluid. And the inlet and out let temperature can be much higher, as the ETSC can work
with inlet temperature up to 130oC [10].

20
Figure 2.3 Evacuated Tube Solar Collectors, Two Concentrating Configurations
(Right: ET with Diffuse Reflector; Left: ET with Cups Reflector) [8-10].
FPSC and ETSC applications are limited to typically 150oC. Higher temperatures require
concentrating solar collectors. Concentrating solar collectors (CSC) can provide
temperature for intermediate temperature processes (< 300oC), and high temperature
applications (>300oC).
CSC have an optical systems (mirrors, lenses) directing the solar radiation for a small
size absorber which causes less thermal loss. However there is an optical loss but the
total energy collection efficiency is higher than the un-concentrated SC due to have very
small absorber. SCSC can be divided into line focusing and point focusing collectors.
The line focusing collectors provide intermediate temperatures (<300oC) with efficiency
higher than the FPSC and ETSC especially at the range of 150oC, the efficiency can be
typically 60% compared to typically 40% respectively. The point focus CSC gives
higher temperatures more than 300oC and up to 2000oC [2].
Concentrating collectors compose of two parts; concentrator and receiver. The receiver
has an absorber and an evacuated glass tube surrounding it. The concentrator is mirrors
or other surfaces with certain optical properties to direct the incident solar radiation to
the absorber tube. The opening from where the solar radiation enters the concentrator is
called the aperture. The ratio between the apertures of the reflector to the area of the
absorber is called the concentration ratio (CR). The energy flux increased on the
absorber by a factor equal to this CR. Its value can be up to 100, 1000. The highest CR
happens with using the solar furnace. Increasing the CR means higher temperatures;
which matches the power and high temperature processes [8-10].

21
Two parabolas combine together to from the compound parabolic collector (CPC) as
shown at Fig. 2.4 CPC has high acceptance angle and concentration ratio typically 3-10
with seasonal adjustment [9].
Figure 2.4. Compound Parabolic Collector [5].
Parabolic trough solar concentrators (PTC) composed of three main parts:
1. Absorber: the absorber is 2-4 cm tube made of copper or mild steel. The tube is
located at the focal axis of the parabola. The absorber is surrounded by a glass
tube as cover to reduce convection loss; the diameter of this cover is more than
the diameter of the tube by 1-2 cm.
2. Concentrator: concentrators are reflectors to direct sun rays to the absorber tube
with an opening to enter the sun rays called aperture. The aperture width ranges
from 1 to 5 m, and the length is more than the width. The concentrators are made
of curved back-silvered glass or aluminium sheets (aluminized mylar, aluminized
acrylic); but aluminium sheets have lower strength to sun rays than the glass [9].
3. Concentric transparent cover: cover from glass or plastic is used to protect the
absorber and the reflecting surface from the weather conditions.
Water is used as the working fluid for applications require temperatures below
100oC.However high pressure water can be used for much higher temperatures. But it

22
can be work for higher temperatures but under high pressure. Almost these PTC are used
for applications require temperatures much higher than that, therefore thermic fluids are
used to replace water. The thermic fluids are organic fluids like oil acts as heat transfer
agent [10].
Compound parabolic dish (CPD) is one of the imaging and point focusing collectors.
Therefore it can concentrate solar radiation from 100 and up to thousand yielding
temperature up to 2000oC. But due to mechanical issues there are limits to the CPD size,
a dish of 6-7 m diameter is commercialized [11].
PDSC produce the highest temperature that can be obtained by solar energy. Therefore
the maximum solar electricity efficiency typically 30% is obtained. Each dish has a
sterling engine with a capacity of 1-25 MW [11].
A central receiver is located at the top of a tower where solar radiation is collected and
directed to this point by heliostats. Heliostats are independent mirrors with 3-5 m
dimensions and there is no limit in the number of mirrors used thus there is no limit on
the amount of energy can be obtained at the focus point that is located at top of tower
[11]. At the top of this tower there is a receiver. The receiver consists of external type or
cavity type.
Central receiver first plant was built in Barstow, CA in 1982 and worked till 1988 with a
capacity of 10 MW, the plant was called solar; its electricity capacity was 10MW
electricity with using water “steam” as the heating and working media to run the
Rankine cycle [11]. Then solar one plant has been retrofitted and molten salt at typically
535oC was used as solar thermal energy storage (TES); with using water as the Rankine
cycle working fluid. Solar two worked from 1996 to 1999. Currently in Soville, Spain
2009 is in operation since 2009; the plant capacity is 20 MW [11].

23
Fresnel lens or mirror is light and thin glass sheet than the conventional convex lenses. It
is made of single think glass sheet with separate sections. Its aperture is wide and its
focal point is short [12-14].
Fresnel reflectors solar power filed composes of number of thin long mirror sheets
reflect the sun rays to a central receiver (absorber). The FR has an advantage more than
the PTC that a receiver can be used by more than one reflector (concentrator); which can
reduce the cost. Also FR has an advantage over the central tower, FR uses one axis not
two tracking axis like the CT [12-14].
Hundred meters Fresnel reflectors have been set in Spain in 2007 with help of
Fraunhofer Institute for Solar Energy Systems ISE in Freiburg Germany [13, 14].
Fresnel field composes of long light mirrors that focus the sun rays with the aid of
another mirror to a small tube; Fresnel reflectors have potential to reduce solar energy
cost, and it is predicted to replace the currently most common PTC in the market soon.
The mirrors are made of glass and steel reflecting sun rays on tube acting as an absorber
where water under pressure is passing, by concentrated solar radiation the water is
heated up to 285oC and forming steam [15]. The Fresnel reflector plant stores solar
energy as pressurized hot water so capacity increase and can work day and night.
CLFR has been developed by Austra, CA. Recently Austra assigned a contract with
Pacific Gas& Electric to provide it with 177 MW from CLFR; and Ausra is claiming to
sell electricity by 10.4 ¢/kWh soon [16].
But the CLFR has a disadvantage makes PTSC and CTR are better in power plants. This
shortage that CLFR heat the water to a temperature less than the others concentrated
collectors. CLFR heat the water up to 545oF (285oC); which makes its power conversion
is less than the solar power plant using PTSC, and CTR. Currently there are two plants

24
in the land; first one was built as a prototype in 2007 and the second is 177MW in CA
[17].
According to thermodynamic, the maximum concentration ratio can be obtained by
reaching the maximum collector temperature [18-20]. The maximum temperature
happens when the absorber temperature ( )rT becomes equal to the sun temperature ( ST
).That happens when the solar energy radiated from the sun to the earth equals the
energy radiated from the earth and reached the sun as shown at Fig. 2.5.
)/( 224
: RrATQasrrS
σ= (2.6)
Ψ=rrSr
ATQ 4
: σ (2.7)
From equations 6 and 7, the maximum solar concentration occurs when:
maxmax )(r
a
A
ACR = (2.8)
That can be expressed as:
)(
122
2
maxθSinR
DCR == “Circular concentrators” (2.9)
)(
1max
θSinCR = “Linear concentrators” (2.10)
Figure. 2.5. Solar Radiation from Sun to Collector Aperture [8].
r
R
Aa Ar

25
II.2. PERFORMANCE OF THE CONCENTRATING COLLECTORS
The useful solar radiation is given by the absorbed solar energy by the absorber of
parabolic trough minus the thermal loss as given in next equation [10]:
)](
aA
rA
[ aiLaRu TTUSAFQ −−= (2.11)
γταγταρ KISb
)(= (2.12)
rrr LDA π= (2.13)
aoaa LDWA )( −= (2.14)
For a central receiver plant consists of receiver with area Ar located on the top of a tower
with H height; and the heliostats filed consist of N mirrors, each with area Am. The
mirrors cover Ag area with spaces; thus the real area is the fraction (ε) occupied of the
land times the Ag; that can be expressed as [10]:
gm
AAN .. ε= (2.15)
Therefore the useful solar radiation and the concentration factor are given as [20]:
)/)()(( CTTUrIAquapmavbbg
−−= ρταε (2.16)
p
g
p
m
A
A
A
ANC
ε== (2.17)

26
II.3. SOLAR SYSTEMS
Solar system composes of the solar collection filed, storage tank, pumps, relief valves,
and or controllers. They can be divided into two main systems; which are closed loop
and open loop.
The solar collectors’ fluid (SCWF) is kept in a closed cycle separate from the load heat
transfer media. Figure 2.6 shows the main components of the system. The SCWF is
circulated between the solar collectors SC and the storage tank that has variable
temperature. The flow rate is constant; therefore different temperatures are expected.
The storage tank content passes many times through the SC to be heated (2-5)oC in case
of active system, and 10oC in case of thermosyphon system. The storage tank has a coil
providing heat to the dispatch tank. The dispatch tank has adjusted temperature by the
fossil fuel exchange heat with the load through heat exchanger.
The temperature reached to the desired value by the load by:
1. Using the auxiliary heater if the SC storage tank temperature is less
2. Reducing the temperature if the SC tank temperature is higher by bypass
arrangement or pump.
Bypass arrangement: a three-way valve is used to be circulated the part of the load heat
transfer media, before be heated through the heat exchanger, to be mixed with the hot
fluid and adjust its temperature.
Bang-bang fashion of pump operation can be used; change the flow rate of the pump to
take the SCWF out when its temperature reaches the desired value. But this is not
recommended as it can cause pump failure [2].

27
Figure 2.6. Closed Solar System [2].
1: Solar Collector; 2: Storage Tank; 3: Pump; 4: Auxiliary Heater; 5: Process Load Heat Exchanger; 6: Bypass “Three- Way Valve”
The system here has two choices; the SCWF can be re-circulated or exchanged by new
WF. The storage tank gets its heat from the SCWF and provides heat to the process load
as shown at Fig. 2.7; but it is not allowed to return the process working fluid again to the
storage tank [21]. This is useful to keep the storage tank at the temperature of the SC exit
all the time.
Figure 2.7. Open Solar System [2, 10].
6
3
1
4
5
2

28
II.4. SOLAR THERMAL PLANTS
Solar energy is used since 1980s in the industrial plants. Eighty four plants are currently
in operation worldwide with a capacity of 24MWth. These are located in different
countries including Egypt, Greece, Italy, USA, etc. These industrial processes use solar
energy to provide heat at temperatures typically in the range of 60oC to 250oC using
solar collectors’ area of 34,000m2. The most common plants are textile, food, meat,
beverage, and paper industries [2].
Cogeneration has been used for while to refer to simultaneous power and heat
production; which includes parallel and series production. Cogeneration term used
widely in the period 1980s-1990s, but the term combined heat and power production
(CHP) has been used widely recently referring to cogeneration. Now the term
“cogeneration, CHP” refers to simultaneous production of power and useful thermal
energy; where this useful thermal energy can be heat or cool. Therefore cogeneration
mean simultaneous power production and one or more of the useful thermal energy
forms (hot water, steam, chilled water) [2].
Cogeneration can save money and fuel; therefore it can be a candidate for any plant
needs power and thermal energy (heat or cool) as long as the thermal energy usage
covers the cost of the cogeneration system. Therefore cogeneration can be used in
industrial sector, and in commercial, and institutional, and district plants as well. The
capacity is in the range of 100 kW to 100 MW [2].
Cogeneration widespread at the market depends on the price of the electricity and the
natural gas (NG); more specifically it depends on the relative prices between the natural
gas and the electricity. Increasing the NG prices motivate the CHP widespread [2].
Therefore the future of CHP is uncertain. It depends on many factors including the NG
prices, the electricity prices, grid connection and distribution, etc. [2]. But the increased

29
overall efficiency of the CHP is predicted to increase the market potential of the CHP
[2].
Therefore the overall efficiency of the cogeneration system is given by:
Fuel
rateheatthermalpowercog
)(+=η (2.18)
That can be written as
%65)(
>+=Fuel
rateheatthermal
Fuel
powercog
η (2.19)
This efficiency is always higher than 65% and can increase 85% in good design and
operated plants. But the conventional power plants has power efficiency is 30% average,
and boiler thermal efficiency is typically 80%. Thus the average of the two systems is
55%; which is less than the cogeneration efficiency [2]. Based on that the fuel
consumption and saving can be given as:
cog
cog
ThermalPowerFuel
η
+=
(2.20)
avconv
conv
ThermalPowerFuel
|η
+=
(2.21)
)11
()(|avconvcog
ThermalPowersavingFuelηη
−+= (2.22)
Cogeneration topping cycle means using the heat produced from combusting the fuel
first to produce power, then the exhaust hot gases are used to provide thermal energy
(heat-cool) by extracting the useful heat by heat recovery boiler (waste heat boiler
WHB); this is also called heat recovery steam generator (HRSG) [2]. Most of the

30
cogeneration plants are top cycle as power generation efficiency increase with increasing
the working fluid temperature.
Bottoming cogeneration refers to producing power after providing the heat demand. The
fuel burned to produce hot gas or heating media first for the heat demand, then low
temperature working fluid is used to drive turbine to produce power. The efficiency of
these system is lower, but bottoming cogeneration is still find potential in applications
require high heating like metals treatment [2].
In this bottoming cogeneration, the working fluid (water) can be replaced by organic
fluids like refrigerants (ammonia, propane...). As these organic fluids have lower boiling
point; which makes it more suitable to be used with the available low temperature. But
using these fluids requires special equipments from special materials; that increase the
cost [2]. The main equipments of the cogeneration plant include:
A. Prime mover: the prime mover is an equipment getting heat from fuel or thermal
energy source to produce steam or hot gases. Then this steam or hot gases are
used as heat source and to drive electricity generator [2]. The prime mover can be
one of three kinds; these are steam turbines (back-pressure turbines), gas
turbines, and reciprocating engine (internal combustion).
Steam turbines are very common in industry. It differs from the other two prime movers
(gas turbine, reciprocating engine) that is gets its heat demand from an external boiler.
The turbines used at the cogeneration plant are the backpressure turbines; which is non-
condensing turbines. Where high pressure and high temperature steam is passed through
the turbine rotating its blades producing electricity, and the exit steam still can be used
as heating media to produce cool or heat [2].
The capacity of back-pressure (non-condensing) turbines has the range of 50 kW to 100
MW and more. It requires steam pressure of 10-135 bars. The heat to power ratio is from

31
4 to 10 with increasing the efficiency with increasing the size or the power. The
efficiency ranges from 8-20% [2].
Gas turbines are used more in the power plants. Air and fuel are fed to the combustion
chamber where high temperature air is the product. The heat to power ratio is 1 to 3. The
efficiency increase with power from 20 to 45% if it complete at full load (not part load);
the size is 100 kW to 100 MW [21]. Liquid fuels (jet fuel, kerosene) and gaseous
(natural gas, propane) can be used. The highest efficiency is obtained with liquid fuels,
but the lowest GHG emissions are with using natural gas [2].
Reciprocating engine or also called the internal combustion (IC) has its internal
combustion unit. It differs from the other two prime movers; as it produces rotated
motions; which can be used with cogeneration but not common. The spark-ignited
gasoline engine is used in automobiles have been modified to be work continuously to
be suitable for cogeneration. The fuels also have been replaced by diesel, and/or diesel
fuel [2]. Its size is from 50 kW to 200 MW, also minim cogeneration units of size 6 kW
is manufactured now. The average heat to power ratio is 0.5. IC needs to be cooled by
liquids; the cooling liquid can be used as a low temperature (71oC) heat source [2].
B. Heat recover units include 1) heat recovery steam generator, and 2) absorber
refrigerator. The recovered heat can be used to produce steam for heating
purposes. But if the process has a cooling demand, the recovered heat can be
used to drive absorption refrigerators to produce the cooling demand.
Heat is recovered in form of hot water, or steam according to the temperature level. The
high temperature is used to superheat the working fluids, medium temperature can be
used for vaporizing the working fluid, and the low temperature is used to preheat the
working fluid at the economizer [2].

32
The efficiency of the heat recovery increase with decreasing the back pressure; but that
also accompanies with the cost increase as well. The known cogeneration plants have
back pressure average 0.03 bar; with temperature approach typically of 15oC to 45oC [2].
Absorption chiller is similar to the vapor compressor refrigerators but without the vapor
compressor. A pump, absorber, and heat generator replace the compressor. Thus heat is
needed to drive the absorption chiller. The heat needed is low quality; thus can be
supplied from different sources in different forms (hot water, low pressure steam, hot
gases…). Absorption refrigerators (AR) operation is based on absorbing the vapor
refrigerant in an absorbent; the yielding mixture is pumped to raise its pressure to a level
allow low temperature heat to strip it from the mixture [7].
Absorption refrigeration may be an essential item of the cogeneration plant technically
and economically in hot climate areas. In this case, cooling is needed more than heating;
so availability of AR is a necessity as the heating unit [18]. There are many advantages
of using AR into the cogeneration plant:
1. Eliminate the electricity beak that happens during cooling season if the vapor
compressor refrigerators (VCR) are used
2. Power production from the cogeneration becomes stable, as the power demand
for VCR is eliminated
3. In case of low heat demand, the thermal energy is used to produce cool instead of
venting and losing it; which increase the efficiency.
The AR can use the heat directly or indirectly from the prime mover. The indirect fired
AR are the units driven by hot water or steam. The direct fired units are using the hot
gases produced from the prime mover directly. With all the heating media (water, steam,
gases) of the AR, the higher its temperature the higher is the efficiency. Higher
temperature means less heating fluid flow rate and thus less energy. Table 2.4
summarizes the heat demand for some types of AR in case of in direct and direct fired
units [2].
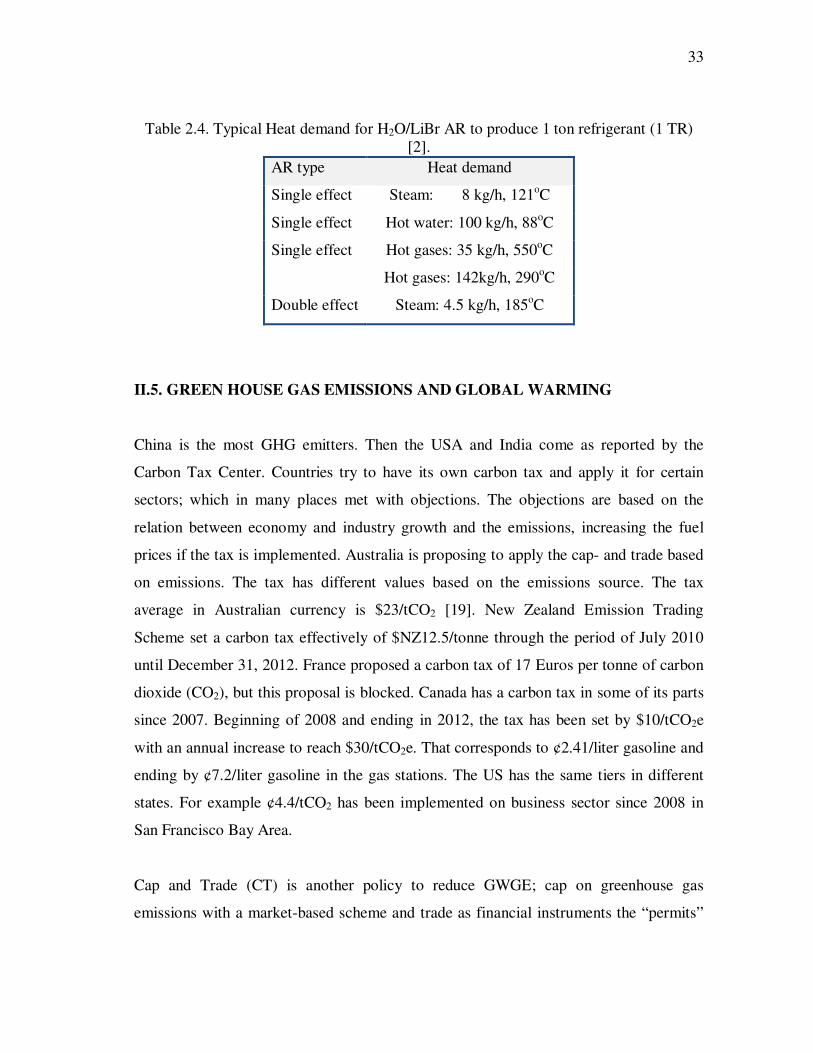
33
Table 2.4. Typical Heat demand for H2O/LiBr AR to produce 1 ton refrigerant (1 TR) [2].
AR type Heat demand
Single effect Steam: 8 kg/h, 121oC
Single effect Hot water: 100 kg/h, 88oC
Single effect Hot gases: 35 kg/h, 550oC
Hot gases: 142kg/h, 290oC
Double effect Steam: 4.5 kg/h, 185oC
II.5. GREEN HOUSE GAS EMISSIONS AND GLOBAL WARMING
China is the most GHG emitters. Then the USA and India come as reported by the
Carbon Tax Center. Countries try to have its own carbon tax and apply it for certain
sectors; which in many places met with objections. The objections are based on the
relation between economy and industry growth and the emissions, increasing the fuel
prices if the tax is implemented. Australia is proposing to apply the cap- and trade based
on emissions. The tax has different values based on the emissions source. The tax
average in Australian currency is $23/tCO2 [19]. New Zealand Emission Trading
Scheme set a carbon tax effectively of $NZ12.5/tonne through the period of July 2010
until December 31, 2012. France proposed a carbon tax of 17 Euros per tonne of carbon
dioxide (CO2), but this proposal is blocked. Canada has a carbon tax in some of its parts
since 2007. Beginning of 2008 and ending in 2012, the tax has been set by $10/tCO2e
with an annual increase to reach $30/tCO2e. That corresponds to ¢2.41/liter gasoline and
ending by ¢7.2/liter gasoline in the gas stations. The US has the same tiers in different
states. For example ¢4.4/tCO2 has been implemented on business sector since 2008 in
San Francisco Bay Area.
Cap and Trade (CT) is another policy to reduce GWGE; cap on greenhouse gas
emissions with a market-based scheme and trade as financial instruments the “permits”

34
to produce those emissions [20]. It differs from the tax. CT set an upper limit of CO2
emissions that a company can’t exceed. But the carbon tax is superior for it for several
reasons including CT not encouraging in investment in renewable energy sector, carbon
tax is easy and can be applied soon but CT need more time for negotiation, carbon tax
address emissions from different sectors but the CT is not yet.

35
CHAPTER III
OPTIMAL DESIGN AND INTEGRATION OF SOLAR ENERGY, FOSSIL
FUELS, AND/OR BIOFUELS FOR SUSTAINABLE AND STABLE POWER
OUTLET, AND HEAT SUPPLY*
III.1. INTRODUCTION
Solar energy is one of the most attractive sources of sustainable energies. Much attention
of research work has been paid to the design of solar energy systems for providing
thermal energy (e.g., solar collectors) or electric power (e.g., photovoltaic systems).
However, much less attention has been directed to the use of solar energy for process
cogeneration in industrial processes. Process cogeneration involves the utilization of
combined heat and power from certain sources. For instance, high pressure steam may
be generated in process boilers and fed to steam turbines that generate electric power and
deliver exhaust steam that is hot enough (usually low pressure steam) to be used for
process heating purposes. The dual usage of steam lends the name “cogeneration” and
typically leads to reduction in energy cost and reduction in greenhouse gas emissions. In
this regard, it is possible to conceive of promising cogeneration systems that involve the
partial usage of solar energy supplemented with the use of fossil fuels. Thus, the
collected solar heat may be converted to electric energy using power cycles that use
external heat source such as Rankine cycle. The solar-based Rankine power cycle
consists of a series of heat exchangers (that work as a solar boiler to produce steam), a
reheat turbine, generator, pumps and cooler “condenser”, and a steam turbine. Water is
used as the working fluid due to its low price and to match the need to steam in the
industrial processes. Rankine reheat cycles is designed to run a high pressure steam up to
* Part of this chapter is reprinted with permission from “Optimal design and integration of solar systems and fossil fuels for sustainable and stable power outlet” by Tora EA, El-Halwagi MM., 2009. Clean Technology and Environmental Policy, Vol. 11 (4), 401-407, Copyright (2010), Springer.

36
100 bars to produce electricity with possibility to draw steam at middle stage or hot
mixture water at the last stage. The steam produced at 100 bars is suitable to generate
power also at temperature of 371oC to assure achieving cycle efficiency not less than the
efficiency of the Rankine Organic cycle [22].
Solar power plants have been typically driven by the need for small-scale (200kW -
10MW) power systems in rural areas. There are several factors that motivate the move to
more and bigger solar systems. These factors include the dwindling fossil resources and
their increasing prices, the need for clean and sustainable energy resources, the global
warming problem, and the need for the privatization of the electricity sector in some
countries [23]. Another potential usage of solar systems in industrial facilities is intended
to shave off peak demands. The basic idea is to provide power supply at the peak
demand (peaking power system) that is needed primarily through the peaks load time. It
may be operated during all the sunshine time alone or with a back-up fossil fuel system.
Furthermore, its power yield can be extended beyond sundown by using solar energy
storage.
The solar heat may be collected using various collection systems that include:
a. Flat plat collector (FPC) that are simple in design and operation
b. Parabolic dish collectors (PDC) that are commonly used to produce electricity
directly in rural/ isolated locations
c. Central receiver towers that heat air to ~1000oC to run a gas turbine producing
electricity
d. Parabolic trough collectors (PTC) that produce high pressure superheated steam
PTC are among the most commonly used collectors used in power plants and has a
proven track-record of providing high efficiency and ability to operate at high
temperature [24-26]. As an illustration of a proven track-record, the Solar Electric
Generating Systems (SEGS) which usually use PTC and produce a power range of 20 –

37
200 MW have been operational since the mid 1980’s. For example, SEGS VI located in
Kramer Junction, California is operational since 1989 and produces 30 MW using PTC
over a 188,000 m2 field area. The PTC reflectors reflect the sunlight onto a central tube
receiver which passes the heat to a heat transfer fluid which subsequently flows through
heat exchangers that produce superheated steam at temperatures as high as 400oC and
pressures as high as 100 atm. The power plant is supplemented by the use of natural gas.
This natural gas contribution cannot exceed 25 percent of total energy contribution so as
to comply with federal laws providing incentives for solar power plants.
The objective of this chapter can be divided into two main parts:-
1. Development of a systematic approach to the integration of solar and fossil
systems to provide stable power outlet:- The approach involves the
combination of heat and power aspects of the process, the sizing of the solar
system, the distribution of energy input from the fossil, and the scheduling of
the operation of the integrated system.
2. Development of a systematic procedure for energy conservation and
incorporation of tow renewable sources of energy into industrial usage:
biofuels and solar energy.
III.2. PROBLEM STATEMENT
Given a continuous process with:
• A number NH of process hot streams (to be cooled) and a number NC of process
cold streams (to be heated). Given also are the heat capacity (flowrate x specific
heat) of each process hot stream, FCP,u ; its supply (inlet) temperature, Tus; and its
target (outlet) temperature, Tut, where u = 1,2,...,NH. In addition, the heat capacity,
fcP,v , supply and target temperatures, tvs and tv
t, are given for each process cold
stream, where v = 1,2,.,NC.
• Available for service are the following:

38
• A set C_UTILIITY = {c|c = 1,2, …, NCU}of cooling utilities whose supply and
target temperatures (but not flow rates) are known.
• A set FOSSIL_UTILITY = {f|f = 1,2, …, NFHU}of fossil-based heating utilities. For
each fossil-based heating utility, the temperature ( Fossil
fT ) and the cost ( Fossil
fC ) are
known.
• A candidate solar energy plant. The size and cost of the solar plant are unknown
and its delivery of thermal energy and temperature of the heating utility provided by
the solar plant will vary over time depending on the variations of solar intensity.
• Power is generated via extraction turbines that use the steam to produce electric
power and discharges steam for process heating purposes.
It is desired to develop a systematic approach to the integration of solar energy, fossil
fuel, and/or biofuels so as to produce a stable power outlet, or steam supply that can be
used for heating, and cooling purposes. The procedure should also determine the
dynamic performance of the system, the optimal sizing of the solar and power plants,
and the optimal mix of solar energy, fossil fuels, and biofuels throughout the year.
Figure 3.1 is a schematic representation of the problem.
Figure 3.1. Schematic Representation of the Problem Statement.

39
III.3. APPROACH
To streamline the development of the design procedure, the following assumptions are
used:
• The decision-making time horizon (e.g., a year) is discretized into Nt periods
leading to a set of operating periods: PERIODS = {t|t= 1,2, …,Nt}. Within each
time period, the values of energy usage are averaged and the analysis within that
period is carried out for the averaged energy values of each energy type.
• It is only allowed to have intra-period integration (i.e., no energy is stored,
integrated, or exchanged over more than one period). In selecting the number and
duration of the periods, it is important to reconcile the accuracy of fluctuations
(e.g., in solar energy) versus the computation efforts.
The first step in the approach is to perform heat integration to determine minimum
heating and cooling utilities and optimal level of utility usage and the extent of process
cogeneration via combined heat and power [1, 5]. The cogeneration analysis [27, 28]
also provides an optimum distribution of steam balances around the headers. Figure 3.2
shows a representation of the obtained information for the dth steam header. Steam enters
headers from two key sources: the process boilers and heat recovery/steam generating
units ( ocessHeader
dQ Pr_ ) as well as from other sources that include let downs from higher-
pressure headers, outlets of extraction turbines, etc. ( otherin
dQ _ ). The inlet steam is
distributed to satisfy process demands at that level for heating ( Heating
dQ ), non-heating (
heatingnon
dQ − ) such as stripping and blanketing, power generation by feeding to an
extraction turbine ( Turbine
dQ ), and letting it down to other headers, venting, and losses (
Down
dQ ). The heat balance around the header is expressed as:
Turbine
d
Down
d
heatingnon
d
Heating
d
otherin
d
External
dQQQQQQ +++=+ −_ d∀ (3.1)

40
Figure 3.2. Header Balance Resulting from Cogeneration Analysis.
Once the process utilities, the extent of power production through process cogeneration,
and the header balances are determined, the approach is carried out through a sequence
of steps. These steps include assessment and optimization as follows:
1. Modeling level: In this stage, the performance of the solar system and the power
plant is modeled. Specifically, the dynamic fluctuations of the solar-energy
collection and dispatch are modeled.
2. Integration level: should solar energy be used alone or in conjunction with fossil
fuel? To what extent? Should the solar energy be used directly or partially stored
via TES?
3. Operation mode: should the solar system be operated at full or partial load?
During which periods of the year?
4. Optimization objectives: there are several factors to be considered in
optimization such as fixed and operating costs, collector type and area, extent of
CO2 reduction (solar versus fuel which becomes important if there is a carbon
credit), etc. Figure 3.3 is a schematic representation of the elements addressed in
the approach.
d th H e a d e r
Pd
E x t e r n a l
dQ
H e a t i n g
dQ
h e a tin gN o n
dQ −
T u r b in e
dQ
D o w n
dQ
o t h e ri n
dQ_

41
Figure 3.3. Key Aspects Addressed by the Approach.
III.4. MODELING OF THE SOLAR COLLECTION SYSTEM
The following are the steps followed in solving the problem modeling the solar
collection system along with the associated equations and sources of information:
1. Determine the longitude and the latitude of the industrial location. The
following are good sources to determine this information:
- NASA maps “Or pick a location graphically”
http://eosweb.larc.nasa.gov
- Other web sites that has electronic Atlas, such as:
http://nationalatlas.gov/natlas/Natlasstart.asp
2. Get the weather data of the selected location; the direct normal radiation
(kWh/m2/day); these data are available for a large number of towns in:
- NASA website

42
http://eosweb.larc.nasa.gov/cgi-bin/sse/sse.cg
- Department of energy (DOE): EnergyPlus Energy Simulation Software- weather
data
http://www.eere.energy.gov/buildings/energyplus/cfm/weather_data.cfm
3. The weather data needed in these calculations include:
- average hourly statistical for dry bulb temperature
- average monthly statistical for dry bulb temperature
- monthly statistics for solar radiation (direct normal, diffuse, global
horizontal)Wh/m2
- average hourly statistics for direct normal solar radiation
- monthly statistics of wind speed
1. Determine the performance characteristics of the solar collector
Performance characteristics are available for many solar collectors through
manufacturers resources, professional organizations such as the American
Society of Heating, Refrigerating, and Air-Conditioning Engineers (ASHRAE),
or through engineering calculations. These characteristics include the optical
efficiency of the collector, the length, the aperture width, the inner and outer tube
diameters and the concentration ratio.
2. Calculate the portion of the incident solar radiation that will actually reach the
collectors.
3. Calculate the absorbed solar intensity; (actual available solar intensity minus the
losses due to the optical efficiency of the receiver of the collector).
4. Calculate the thermal losses from the absorber of the collectors.

43
8. Determine the net solar beam radiation “the useful radiation” (the absorbed
radiation less the thermal losses of the absorber tube of the collector).
9. Determine the efficiency of the Rankine cycle; which refers to how much useful
work “electricity” can be obtained from the solar net useful radiation.
10. Calculate the power per unit area of the collector receiver surface area. This is
equal to the useful net solar radiation times the efficiency of the Rankine cycle.
11. Now, we have the dynamic profile of solar radiation. This profile is used as
input data for the optimization formulation which is described in the next
section.
III.5. OPTIMIZATION FORMULATION
The optimization formulation has been developed to address the integration of solar
energy with fossil fuel. Then it has been modified to consider integrating the biofuels in
addition to the fossil fuel with solar energy. In all cases, process heat has been
considered available for free.
III.5.1. INTEGRATION OF SOLAR ENERGY AND FOSSIL FUEL
The following optimization formulation is developed to address the design challenges.
Objective function: Minimize total annualized cost =
t
s t
Solar
tds
Solar
tds
ds
Solar
st
f t
Fossil
tdf
d
Fossil
df DQCAFCDQC ∑ ∑∑∑∑ ∑∑ ++ *** ,,,,,,, (3.2)

44
where Fossil
dfC , is the cost of the fth fossil fuel providing steam to the dth header, Fossil
tdfQ ,, is
the rate of heating in the form of steam resulting from the fth fossil-based utility and
entering the dth header during period t, tD is the duration of period t, Solar
sAFC is the
annualized fixed cost of the sth solar plant, Solar
tdsC ,, is the operating cost of the sth solar
plant feeding the dth header in period t, and Solar
tdsQ ,, is the rate of heating in the form of
steam resulting from the sth solar plant and entering the dth header during period t.
Since the generated steam is provided from fossil and solar sources, Figure 3.3 can be re-
drawn to account for these sources as shown in Figure 3.4.
Figure 3.4. Balance around the dth Header.
The heat balance around the inlet of the dth steam header in period t is given by:
External
d
Solar
tds
s
Fossil
tdf
f
QQQ =+∑∑ ,,,, d∀ , t∀ (3.3)
Depending on the pressure of generated steam, it is fed to the steam header which has
the same or lower pressure.
d t h H e a d e r
Pd
F o s s i l
tdfQ ,,
S o l a r
tdsQ ,, H e a t i n g
dQ
h e a t in gN o n
dQ −
T u r b i n e
dQ
D o w n
dQ
o th e ri n
dQ_

45
Next, heat balances are carried out for the total rate of a given fuel is calculated by
summing the splits over the headers:
∑=d
Fossil
tdf
Fossil
tf QQ ,,, f∀ , t∀ (3.4)
∑=d
Solar
tds
Solar
ts QQ ,,, s∀ , t∀ (3.5)
The collected solar energy in period t is typically given by:
s
SolarUseful
ts
Solar
ts AQQ *_
,, = s∀ , t∀ (3.6)
where SolarUseful
tsQ_
, is the useful power collected (and delivered in a thermal form) per unit
area of the sth solar collector in period t and As is the area of the sth solar collector.
The annualized fixed cost of the sth solar power plant is given as a function ( sα ) of the
size:
)(Ss
Solar
sAAFC α= s∀ (3.7)
The power generated from the turbine during period t from the turbine connected to the
dth header is calculated through the turbine performance model, td ,ψ , as follows:
)( ,,,
Turbine
tdtdtd QP ψ= d∀ , t∀ (3.8)
wheretd
P , is the electric power produced during period t from the steam turbine(s)
connected to the dth steam header and Turbine
tdQ , is the heat rate provided to that turbine in
the form of steam during period t.
III.5.2. INTEGRATION OF SOLAR ENERGY, FOSSIL FUEL, AND BIOFUELS
Integrating biofuels makes the optimization more complex. As biofuels has a dynamic
profile considering both the price and availability. Biofuels as a fuel differs from solar
energy; biofuels have an upper limit that can’t be overcome.

46
Therefore, to simplify the problem, the following assumptions are introduced:
• The decision-making time horizon (e.g., a year) is discretized into Nt periods
leading to a set of operating periods: PERIODS = {t|t= 1,2, …,Nt}. Within each
time period, the values of energy usage are averaged and the analysis within that
period is carried out for the averaged energy values of each energy type.
• It is only allowed to have intra-period integration (i.e., no energy is stored,
integrated, or exchanged over more than one period). In selecting the number
and duration of the periods, it is important to reconcile the accuracy of
fluctuations (e.g., in solar energy) versus the computation efforts.
The approach decomposes the solution into two stages: heat integration followed by
energy assignment, design, and scheduling. In the first stage, heat integration is carried
out (graphically using thermal pinch analysis or mathematically using linear
programming) to determine minimum heating and cooling utilities and optimal level of
utility usage [1,5]. This includes the identification of heat to be provided to each steam
header characterized by heat and temperature ( Header
dQ and Header
dT ). In the second stage,
the optimal quantity of each type of energy is determined for each operating period and
the overall design of the system is synthesized. For each period t, a utility-header-
process structural representation (Figure. 3.5) is developed to embed potential
configurations of interest. Outputs from each energy type is split into fractions and
assigned to different steam headers which subsequently feed the process to satisfy the
optimal requirements from the heat integration analysis.

47
Figure 3.5. Structural Representation of the Problem.
The objective function is given by:
Minimize total annualized cost =
++∑∑∑ ∑ t
b t
Biofuel
tb
Biofuel
tbt
f t
Fossil
tf
Fossil
f DQCDQC *** ,,,
−++ ∑∑∑ t
s t
Solar
ts
Solar
ts
s
Solar
s DQCAFC ** ,,
t
s t
Solar
ts
Solar
st
b t
Biofuel
tb
Biofuel
b DQRDQR ∑∑∑∑ −− **** ,, (3.9)
where Fossil
fC is the cost of the fth fossil fuel, Fossil
tfQ , is the rate of heating of the fth fossil-
based utility during period t, tD is the duration of period t, Biofuel
tbC , is the cost of the bth
biofuel, Biofuel
tbQ , is the rate of heating of the bth biofuel-based utility during period t,
Solar
sAFC is the annualized fixed cost of the sth solar plant, Solar
tsC , is the operating cost of
the sth solar heating utility, Solar
tsQ , is the rate of heating of the sth solar-based utility
during period t, Biofuel
bR is the carbon credit of the bth biofuel, and Solar
sR is the carbon
credit of the sth solar utility.
The heat balance around the dth steam header in period t is given by:
Header
d
Solar
tds
Biofuel
tdb
Fossil
tdf QQQQ =++ ,,,,,, d∀ , t∀ (12)
Foss il
E nergy
P rocessBio fue ls
So larE nergy
S team He ader 1
S team He ader 2
S team H eader N H eaders

48
Solar
tds
Biofuel
tdb
Fossil
tdf QandQQ ,,,,,, ,, are the heat rates provided from the fossil, the biofeul, and the
solar sources, respectively, to the dth header. In assigning the heat flows from sources to
headers, attention is given to allowing only allocations with the temperature of the
source greater than or equal to the temperature of the header.
The total rate of a given fuel is calculated by summing the splits over the headers:
∑=d
Fossil
tdf
Fossil
tf QQ ,,, f∀ , t∀ (3.10)
∑=d
Biofuel
tdb
Biofuel
tb QQ ,,, b∀ , t∀ (3.11)
∑=d
Solar
tds
Solar
ts QQ ,,, s∀ , t∀ (3.12)
Although the heat collected and delivered by the solar plant will vary from one period to
another, for sizing the solar power plant, it should be large enough to accommodate the
largest solar heat provided to the headers (which is still unknown to be optimized), i.e.:
},...,2,1|max{arg ,
_
t
Solar
ts
SolarDesign
s NtQQ == s∀ (3.13)
Constraint (4.4) may be equivalently expressed as:
Solar
ts
SolarDesign
s QQ ,
_ ≤ s∀ , t∀ (3.14)
The annualized fixed cost of the sth solar power plant is given as a function ( sψ ) of the
size:
)( _ SolarDesign
ss
Solar
sQAFC ψ= s∀ (3.15)
The foregoing expressions constitute the mathematical program for the problem. In
general, it is a nonlinear program (NLP) and becomes a linear program when the
function sψ is linear (which may be a very good approximation in many solar
applications). The solution of the optimization program provides the optimal values for

49
each form of energy over each period, the distribution to the steam headers, and the
design of the solar power plant.
III.6. CASE STUDY
Two case studies have been solved. The first one treats integrating solar energy, process
heat, and fossil fuel to produce a stable power supply for the industrial facility. The
second case study illustrates the integration of biofuels with process heat, fossil fuels,
and solar energy to produce a stable heat supply to the process. This heat supply can be
used for heating and non heating purposes.
III.6.1. OPTIMUM INTEGRATION OF SOLAR ENERGY, PROCESS HEAT,
AND FOSSIL FUELS TO PRODUCE A STABLE POWER SUPPLY
An industrial facility is located at the city of Daggett which is located in San Bernardino
County in California with the following coordinates {N 34° 52'} {W 116° 46'}. Heat
integration and cogeneration analysis is first carried out for the process. The result is that
steam (at 14 atm and 310 oC) is fed to an extraction turbine that provides power and
heating to the process. The rate of heating of the steam entering the turbine is determined
to be 5,000 kW. The produced power is 2,000 kW. To provide this heating, both natural
gas and solar energy are considered. On an annual basis, it is desired to fulfill at least
65% of the heating load through solar energy to reduce greenhouse gas emissions and to
receive subsidy for the use of a renewable energy.
Solar energy is collected using the parabolic trough collectors that produce high pressure
superheated steam. The parabolic trough collectors are among the most commonly used
collectors and are recognized with a proven track-record of providing high efficiency
and ability to operate at high temperature. The data for the collected solar energy are

50
reported as monthly averages in Table 3.1. The total annualized cost ($/yr) of the solar
thermal system is given by:
Annual
SolarssSolarQAATAC 012.0085,13.15 6.0 ++= (3.16)
where As is the area of the solar collector (m2) and Annual
SolarQ is the annual useful energy
collected and delivered by the solar system (kWhr/yr) in a thermal form. The cost of
power generation using the steam turbine is $0.012/kWhr. The cost of steam produced
from natural gas is $5.0/109 J.
Table 3.1. Monthly Average of Useful Collected Solar Energy.
Month Monthly average of
collected solar energy kWhr/(m2.month)
January 60.6
February 69.5
March 115.8
April 162.3
May 186.2
June 169.5
July 159.1
August 159.0
September 138.9
October 104.6
November 67.5
December 51.1
Using the aforementioned approach and coding the optimization formulation using the
software LINGO, the minimum cost of the system (solar thermal, fossil, and power
production, excluding revenue from power or heat) was found to be $1.539 MM/yr. The
optimal area of the solar collectors was found to be 19,715 m2. Figure 3.6 summarizes
the optimization results of the monthly distribution of both forms of energy.

51
Figure 3.6. Monthly Solar and Fossil Contribution.
III.6.2. OPTIMUM DESIGN AND INTEGRATION OF SOLAR ENERGY,
BIOFUELS, PROCESS HEAT, AND FOSSIL FUELS TO PRODUCE A STABLE
HEAT SUPPLY
An industrial facility is located at the city of Daggett which is located in San Bernardino
County in California with the following coordinates {N 34° 52'} {W 116° 46'}. Upon
heat integration, the minimum heating utility of the process is determined to be 5,600
kW. On an annual basis, it is desired to fulfill at least 75% of the process heating utility
requirement using renewable sources (solar and biofuel). The biofuel is in the form of
biodiesel which is produced from a feedstock of waste cooking oil. The biodiesel
process is owned by the company and is based on the oil transestrification technology
[30]. The cost and availability of the biofuel are listed in Table 3.2.
Solar energy is collected using the parabolic trough collectors that produce high pressure
superheated steam. The parabolic trough collectors are among the most commonly used

52
collectors and are recognized with a proven track-record of providing high efficiency
and ability to operate at high temperature [25, 29]. The data for the collected solar
energy are reported as monthly averages in Table 3.3 The total annualized cost ($/yr) of
the solar system is given by:
Annual
SolarCCSolarQAATAC 012.0085,13.15 6.0 ++= (3.17)
AC is the area of the solar collector (m2) and Annual
SolarQ is the annual energy collected by
the solar system (kWhr/yr). The cost of the fossil fuel is $5.0/109 J.
Table 3.2. Cost and Availability of Biofuel.
Month Cost of biofuel $/109 J
Maximum available heat rate
kW
January 3.5 2,970 February 3.8 2,850
March 3.8 2,850
April 3.4 2,490 May 4.8 2,160
June 5.8 1,920 July 5.8 1,920
August 5.8 1,920 September 5.3 2,120
October 4.9 1,990
November 4.3 2,280 December 3.9 2,610

53
Table 3.3. Monthly Average of Collected Solar Energy.
Month Monthly average of collected solar energy kWhr/(m
2.month)
January 60.6
February 69.5
March 115.8
April 162.3
May 186.2
June 169.5
July 159.1 August 159.0
September 138.9
October 104.6
November 67.5
December 51.1
Using the aforementioned approach and coding the optimization formulation using the
software LINGO, the minimum cost of the heating utility was found to be $1,211,875/yr.
The optimal area of the solar collectors was found to be 11,300 m2. Table 3.4
summarizes the optimization results of the monthly distribution of the three forms of
energy.
Table 3.4 Fractional Contribution of Each Form of Energy to the Monthly Heating Utility Requirement of the Process.
Month Solar Biofuel Fossil
January 0.16 0.53 0.31
February 0.21 0.51 0.28 March 0.31 0.51 0.18
April 0.45 0.45 0.10 May 0.50 0.39 0.11
June 0.48 0.34 0.18 July 0.43 0.34 0.23
August 0.43 0.34 0.23
September 0.39 0.38 0.23 October 0.28 0.36 0.36
November 0.19 0.41 0.40 December 0.14 0.47 0.39

54
CHAPTER IV
INTEGRATION OF ABSORPTION REFRIGERATORS INTO INDUSTRIAL
PROCESSES WITH HEAT EXTRACTION FROM SOLAR ENERGY, FOSSIL
FUELS, AND EXCESS PROCESS HEAT*
Absorption refrigeration (AR) is gaining an increasing attention in industrial facilities to
utilize process heat to partially or completely drive a cooling cycle. We consider three
sources of energy to provide the necessary heat for AR. First, excess process heat is
effectively utilized instead of using coolants to remove such heat. Fossil fuels are
considered as needed. Furthermore, it is desirable to consider the inclusion of solar
energy as a sustainable source of heat. There are design and operational challenges in
integrating these energy sources and in incorporating AR into industrial facilities. The
design and efficiency of the entire system depend on numerous factors including the
quantity and quality of the collected solar energy, excess process heat, and fossil fuel.
Additionally, the dynamic nature of solar energy poses a complicating factor in design
and operation. A systematic approach is proposed for the design of AR systems with hot
water loops that are integrated with industrial facilities and employ a combination of
excess process heat, fossil fuels, and solar energy. First a graphical procedure is
developed to use process insights in determining key design factors. Thermal pinch
analysis is performed to determine how much excess heat is available and at what
temperature levels as well as the needed refrigeration and the associated temperature
levels. Process integration insights are used to determine the placement of the AR
system and the sources of heat. Next, a multi-period mathematical model and
optimization formulation is developed for the entire system.
*Part of this chapter is reprinted with permission from “Integration of solar energy into absorption refrigerators and industrial processes” by Tora EA, El-Halwagi MM., 2010. Chemical Engineering & Technology, Vol. 33 (9), 1495-1505, Copyright (2010), Wiley-VCH, GmbH & CoGaA, Weinhein..

55
The procedure determines the optimal mix of energy forms (solar versus fossil) to be
supplied to the process, the system specifications, and the dynamic operation of the
system. A case study is solved to demonstrate the effectiveness and applicability of the
devised procedure.
IV.1. INTRODUCTION
Industrial facilities are characterized by the use of significant amounts of cooling. There
are various technologies used for industrial refrigeration. Absorption refrigerators
(chillers) are among those technologies although they are less common than mechanical
refrigeration. The primary source of energy needed to drive the AR cycle is heat [6, 31].
Heat may be provided from different sources. A sustainable source of heat is solar
energy. Therefore, solar AR is one of the various types of solar-based cooling systems
which also include mechanical-vapor compression refrigeration, absorption, adsorption,
desiccant, and photovoltaic-operated refrigeration systems [32]. The energy supplied by
the solar system can be in the form of electrical energy from photovoltaic devices to run
vapor-compression units and also the thermal energy to drive the mechanical
compression systems or absorption units. Solar-powered AR units are gaining increasing
utilization in commercial facilities around the world with reviews available in literature
[33, 34]. LiBr-H2O and NH3-H2O are the most commonly used commercial AR
systems. Flat plate solar collectors and evacuated tube solar collectors are typically used
[35-36] although parabolic trough collectors have also been used [37]. Various models
have been developed for the characterization, assessment, and optimization of solar AR
systems [38-41]. Since solar energy cannot be collected continuously throughout the
day, it is usually supplemented with other forms of energy or with an energy storage
system. The storage of solar thermal energy may be carried out by storing the heat
through a medium (e.g., water in storage tanks) to be used later to run the solar cooling
system. Alternatively, the solar energy can be used directly to produce the cooling and
then this produced cooling can be stored. Typically, the former option is the common

56
storage method in industry. When water is used as the storage medium of the solar
thermal energy to run solar cooling system, its temperature should be optimized so as to
maximize the overall efficiency of the cooling system [42-43].
Since heat is the major contributor to the operating cost of AR systems, it is important to
endeavor to reduce this cost item. Process integration provides many effective methods
for the conservation and optimization of thermal energy [1, 4, 5]. It can also be used to
optimize the various forms of energy including combined heat and power [27- 28] and
refrigeration systems [44- 45].
While significant advances have been made in the areas of AR, solar systems, and
process integration, there is need to consider these three components simultaneously.
Indeed, there is significant potential for the optimization of process heat and its
integration with solar energy and fossil fuels to drive AR. The purpose is to introduce an
integrated approach to the design of AR systems that are coupled with the industrial
process while optimizing the use of excess process heat, fossil fuels, and solar energy.
Process integration techniques as well as a systems-based formulation are used to pose
the problem as an optimization problem. Targeting techniques are first used to determine
the optimal heat integration among process hot and cold streams, the availability of
excess process heat, and the amount and quality of the needed refrigeration. Next, a
mathematical program is developed to identify the optimal mix of energy forms and their
dynamic distribution throughout the year. Additionally, the impact of carbon tax/credit is
included in the mathematical formulation and the case study.
Many industrial processes require substantial amounts of low-temperature refrigeration.
When excess process heat is available, absorption refrigeration “AR” becomes a
promising candidate by utilizing the heat to drive the system. In order to integrate the
process heating and cooling duties with an absorption refrigeration systems, there are
several design challenges. These include the need to optimize process heating and

57
cooling demands and the performance of heat integration. There is also the need to
determine proper placement of the absorption refrigeration system and the quantity and
quality of process heat to be used. A systematic approach is introduced to optimizing
absorption refrigeration systems in processing plants. A process integration approach is
adopted to modify and optimize the dual AR system and to integrate it with the process.
First, thermal pinch analysis is carried out to determine the desired levels if process heat
integration, the quantities of heating and cooling utilities, and the temperature levels of
the required utilities. Special emphasis is given absorption refrigeration providing
cooling at two different levels. A dual cascade double effect NH3/H2O-H2O/LiBr
absorption refrigeration system is considered. The NH3/H2O cycle is the “top cycle”
using heat sources at temperature typically 130oC. The top generator is cascaded with
the bottom generator by recovering the heat from desorbing the refrigerant of the top
cycle to run the bottom generator. A case study is solved to illustrate the developed
procedure.
Industrial refrigeration is typically required in large quantities for numerous processing
facilities. Several technologies are used to provide the required cooling. While
mechanical refrigeration is the leading technology, absorption refrigerators “AR” have
distinct advantages in industrial plants possessing excess process heat since the primary
source of energy needed to drive the AR cycle is heat [46-47]. The LiBr/H2O and the
H2O/NH3 systems are still the most commonly used cycles used in absorption
refrigerators. Single-, double, and triple-effect H2O/LiBr cycles have a coefficient of
performance “COP” typically around 0.7, 1.2, and 1.7, respectively. The single-effect
NH3/H2O cycle has COP typically around 0.5 and it is cable of providing cooling at low
temperature down to -77.7oC. On the other hand, H2O/LiBr cycle typically provides
cooling above 0oC. The principles of designing and modeling AR systems are covered in
literature [6, 46].

58
IV.2. PROBLEM STATEMENT
Industrial facilities may have excess process heat which can be used to drive absorption
refrigerators to produce the process refrigeration demand. In many cases, this heat may
not be enough. Therefore, it is desired to integrate solar energy and fossil fuel to provide
the necessary heat. The problem is divided into the following two topics:-
1. Integration of absorption refrigerators into industrial processes with heat
extraction from solar energy, fossil fuels, and excess process heat.
2. Thermal Coupling of two-level dual absorption refrigeration system with
integration in industrial process.
IV.2.1. INTEGRATION OF ABSORPTION REFRIGERATORS INTO
INDUSTRIAL PROCESSES WITH HEAT EXTRACTION FROM SOLAR
ENERGY, FOSSIL FUELS, AND EXCESS PROCESS HEAT
The design and integration of an AR system into an industrial facility and the optimal
selection of the optimal mix of energy sources which varies dynamically throughout the
year has been addressed. The problem is formally stated as follows:
Given a continuous process with:
• A number NH of process hot streams (to be cooled) and a number NC of process
cold streams (to be heated) with known heat duties and supply and target
temperatures. Available for service are two sets of cooling and heating utilities
whose operating temperatures are known but not their heat duties.
• Solar energy is a candidate as a source of heat. The size and cost of the solar energy
collection system are unknown and are to be determined through optimization. An
economic incentive (e.g., a carbon tax credit) may be available for the use of solar
energy to reduce the emission of greenhouse gases GHGs.
• Process refrigeration demand is to be fulfilled using AR. These refrigerators can
obtain the needed heat from process excess heat, solar energy, and fossil fuel. Hot

59
water loops are used to pick up the heat from the three energy sources and deliver
the heat to the AR System.
It is desired to develop a systematic approach to integrate AR into industrial facilities
with the consideration of solar energy and fossil fuel as supplemental sources of heat so
as to produce a stable refrigeration outlet.
The procedure should address the following design challenges:
- How to determine the optimal size, placement, and specifications of the AR
system?
- Where and how much should the excess process heat be extracted?
- How to account for the dynamic performance of the solar system and how to size
it?
- What is the optimal mix of solar and fossil fuels throughout the year?
Figure 4.1 is a schematic representation of the problem. It shows the three sources of
energy as excess process heat, solar energy, and fossil fuels which are used to provide
heat to the water tanks that are employed to drive the AR system. The extent
contribution of each energy source is unknown and is to be determined via optimization
so as to minimize the cost of the system.

60
Figure 4.1. Schematic Representation of the Problem Statement.
IV.2.1.1. APPROACH
First, let us consider a typical AR system (Figure 4.2). The system is driven primarily by
thermal energy. Two fluids are used in the cycle: an absorbent (water or LiBr) and a
working fluid (e.g., ammonia or water, respectively). Different working fluids lead to
different refrigeration temperatures. Later, the use of the LiBr-water system is illustrated
in the case studies. A low-pressure vapor from the evaporator is absorbed in the
absorbent. Heat is released as a result of absorption. The working fluid-absorbent
solution is pressurized using a pump. Then, the working fluid is desorbed in a stripper
(or generator) where heat is added to the solution. The absorbent is returned to the
absorber, the high-pressure vapor is fed to the condenser to condense at a moderate
Solar
Collector
Hot-Water
Tanks
Fossil-Based
Utility
Process
(Industrial Facility)
Excess
Process
Heat
Absorption
Refrigeration
Refrigerant
Heat-Transfer
Medium
Heat-
Transfer
Medium

61
temperature (e.g. ambient). The high-pressure working fluid is let down and passed
through an evaporator which extracts the refrigeration duty at a low temperature.
Because the pumping energy is relatively small compared to the heat input, the
coefficient of performance (COP) for the AR system is defined as:
Str
f
Q
QCOP
Re= (4.1)
Figure 4.2. A Typical AR System [1].
The heat added to the stripper can be delivered via a heat transfer medium. In this
chapter, we consider hot-water loops. Recirculating water is passed via heat exchangers
to pick up heat from the three considered sources of energy (excess process heat, fossil,
and solar). The heat needed to drive the AR is delivered to the stripper through the hot
water then returned back to the heat recovery system. Heat recovered beyond that
needed to immediately drive the AR system is stored in well-insulated tanks for later
usage. This is particularly important for the solar energy because of its dynamic
performance. Energy during daylight hours may be used instantaneously and/or stored in
H i g h - T e m p e r a t u r eH e a t S i n k
T H
L o w - T e m p e r a t u r eH e a t S o u r c e
T L
Q o u t
Q R e f
C o n d e n s e r
E v a p o r a t o r
E x p a n s i o n
V a l v e
L o w - p r e s s u r e
v a p o r
H i g h - p r e s s u r e
v a p o r
Q S t r
Q 1
A b s o r b e r
S t r i p p e r
W
S o l u t i o n
S o l u t i o n
T h r o t t l i n g
V a l v e
P u m p

62
water tanks to be utilized. The temperature of the hot water is an important optimization
variable. In many cases, this temperature has to be at least 80 oC. Concentrating solar
collectors are particularly useful in this regard since they can reach high-enough
temperature levels. Figure 4.3 is a schematic representation of the AR system coupled
with a hot water loop that extracts heat from a heat recovery and storage-tank network.
The hot water is used to provide the heat necessary to strip the high-pressure vapor then
the water is returned to be heated again through the heat recovery and storage tank
network.
Figure 4.3. Heat Supply to AR via a Heat Recovery Network and a Hot Water Loop.
Before utilizing external energy sources (fossil and solar), it is beneficiary to maximize
the use of excess process heat. Therefore, thermal-pinch and heat-integration analyses
[1, 4, 5, 44] should be implemented first to transfer heat between process hot and cold
streams, to determine minimum heating and cooling utilities, and to determine minimum
refrigeration load. The grand-composite curve (GCC) is developed for the process by
H ig h - T e m p e r a t u r eH e a t S in k
T H
L o w - T e m p e r a t u r eH e a t S o u r c e
T L
Q o u t
Q R e f
C o n d e n s e r
E v a p o r a t o r
E x p a n s i o n
V a l v e
L o w - p r e s s u r e
v a p o r
H ig h - p r e s s u r e
v a p o r
Q 1
A b s o r b e r
S t r i p p e r
W
S o l u t i o n
S o l u t i o n
T h r o t t li n g
V a lv e
P u m p
H e a t R e c o v e r y
a n d S t o r a g e T a n kN e t w o r k
E x c e s sP r o c e s s
H e a t S o l a r F o s s i l
H o t
W a t e rL o o p
i n
S trT
o u t
S t rT

63
plotting temperature (arithmetic average of hot and cold temperatures) versus residual
enthalpy (Figure 4.4). The pinch point corresponds to the zero-residual point.
Additionally, the top and bottom residuals represent the minimum heating and cooling
utilities. Next, it is important to use the GCC to derive additional insights specifically for
the AR system. Noting that the hot water leaving the stripper enters the heat recovery
network at a temperature ( out
StrT ). This temperature is represented on the GCC by adding
half of the minimum approach temperature between the hot and the cold stream (
2/minTT out
Str∆+ ). Therefore, the excess process heat must be higher than this
temperature at least with a minimum heat-transfer driving force, i.e.,
HRExchout
StrTTT ,min 2/ ∆+∆+ . From the GCC, one can determine the excess heat to be
recovered for usage in AR. This is shown on Fig. 4.4 as oExQ Pr, . This heat recovery
offers two benefits: reduction of the required cooling lead for the process and
contribution to the heat needed to drive the AR system. In order to reduce the cooling
cost of the process, cooling water is used to remove the maximum feasible load which
corresponds to the temperature of the cooling water. This load is referred to as QCW.
Finally, the remaining heat load defines the minimum refrigeration demand for the
process to be provided by the AR system (QRef).
Figure 4.4. Target Identification and Integration of the GCC Representation with the Hot Water Loop.
Q R e f
Q C W
Q E x _ P r oH RE x c hi n
S t r TT
T,
m in
2∆+
∆+
T
H∆
P in c hP o i n t
m in
HQ
r e fE x c h
LT
TT
,m i n
2∆+
∆+
2
m inT
TC W
∆+

64
The graphical approach identifies the values of QRef and QEx_Pro. For a given COP, the
total heating rate needed for AR is determined via Eq. 1.
Next, a dynamic model is developed to represent the temporal variation of the collected
solar energy at the plant location throughout the year. It is worth noting that for targeting
purposes, the daily average values of useful collected solar energy are sufficient to
determine the area of the solar collector. Two sets of hot-water tanks are used for
recovery and dispatch. The temperature of the water fluctuates in the recovery tank
during heat collection until it reaches a final desirable state. Then, it is switched to
become the dispatch tank delivering water at the desired temperature. Once the targets
are identified, the details of recovery and dispatch can be determined using hourly rates.
In designing the solar system, it is common to use the data of a Typical Meteorological
Year (TMY). The TMY statistically-averaged data set of solar radiation intensity derived
from the data saved in the archives of the National Solar Radiation Data Base (NSRD)
archives. As such the TMY accounts for the uncertainty in solar data and is aimed at
developing a nominal design value for the area of the solar collector. Once the design is
established, then the uncertainty will impact the operation of the system leading to
collected solar energy that may be somewhat higher or lower than that anticipated by
TMY. Depending on the actual amount of the collected solar energy, the fossil fuel
usage is adjusted so as to close the balance for the needed energy. The procedure
described by Tora and El-Halwagi [40] is used to extract the pertinent solar data and
represent them in a form ready to be used in an optimization formulation [47]. In order
to develop an algebraic formulation of the optimization program, the decision-making
time horizon (e.g., a year) is discretized into Nt periods leading to a set of operating
periods: PERIODS = {t|t= 1,2, …,Nt}. Within each time period, the values of energy
usage are averaged and the analysis within that period is carried out for the averaged
energy values of each energy type.

65
IV.2.1.2. OBJECTIVE FUNCTION
The objective function for the optimization program is given by:
Minimize total annualized cost =
Tanks
t
Solar
t
t
Solar
t
Solar
t
t
Solar
t
Solar
t
t
Fossil
tf
f
Fossil
f
Cost
DQRDQCAFCDQC
+
−++ ∑∑∑∑ *****,
(4.2)
where Fossil
fC is the cost of the fth fossil fuel, Fossil
tfQ , is the rate of heating of the fth fossil-
based utility during period t, tD is the duration of period t, SolarAFC is the annualized
fixed cost of the solar plant, Solar
tC is the operating cost of the solar heating utility, Solar
tQ
is the rate of heating of the solar-based utility during period t, and SolarR is the carbon
credit of the solar utility. CostTanks is the annualized cost of the storage tanks. These are
usually much smaller than the overall investment in the AR system, the solar collectors,
and the fossil-based utility units. The following are the necessary constraints for the
optimization formulation:
Rate of heat demand for the heat recovery network during any period t:
COP
QQQQ
fSolar
t
f
Fossil
tf
oExRe
,
Pr_ =++∑ (4.3)
While the supplies of the solar and the fossil forms of energy are allowed to vary
dynamically, the excess process heat and the refrigeration duty of the process are taken
as their steady-state values.
In assigning the heat flows from sources to the hot water loop, attention is given to
allowing only allocations with the temperature of the source greater than or equal to the
temperature minimum acceptable temperature for heating the water.

66
The area of the solar collector needed in each time period is related to the needed heating
rate from the solar source through the design equation:
)( Solar
t
Solar
tAQ ζ= (4.4)
Although the heat collected and delivered by the solar plant will vary from one period to
another, for sizing the solar power plant, it should be large enough to accommodate the
largest needed collector area (which is still unknown to be optimized), i.e.:
},...,2,1|max{arg_
t
Solar
t
SolarDesignNtAA == (4.5)
which may be expressed as:
tAASolar
t
SolarDesign ∀≥_ (4.6)
The annualized fixed cost of the solar power plant is given as a function (ψ ) of the size:
)( _ SolarDesignSolarAAFC ψ= (4.7)
The foregoing expressions constitute the mathematical program for the problem. In
general, it is a nonlinear program (NLP) and becomes a linear program when the
functions ζ and ψ are linear (which may be a very good approximation in many solar
applications). The solution of the optimization program provides the optimal values for
each form of energy over each period, the distribution to the water heating loop, and the
design of the solar plant.
IV.2.1.3. CASE STUDY
CASE STUDY I: A PHMARMCEUTICAL PLANT
A pharmaceutical processing facility is located at the city of Daggett in San Bernardino
County in California with the following coordinates {N 34° 52'} {W 116° 46'}. The
process flowsheet [48] is given by Figure 4.5. The feed mixture (C1) is first heated to 513
K, then fed to an adiabatic reactor where an endothermic reaction takes place. The off-gases

67
leaving the reactor (H1) at 398 K are cooled to 338 K before it is sent to the recovery unit.
The mixture exiting from the bottom of the reactor is separated into a vapor and slurry
streams. The vapor stream (H2) leaves the separation unit at 358 K and is to be cooled to
298 before storage. The slurry stream is washed with a hot immiscible liquid at 328 K. The
wash liquid is purified and recycled to the washing unit. During purification, the
temperature drops to 308 K. Therefore, the recycled liquid (C2) is heated to 328 K. The top
stream from the purification unit is cooled from 318 to 298 K to condense a solvent which
is recycled back to the separation system. The data for the process hot and cold streams are
given in Table 4.1. Cooling water may be used as an external utility to cool the hot streams
down to 314 K below which an LiBr-water AR system is used to provide chilling water at
283 K. A minimum driving force ( ∆Tmin ) value of 10 K is used.
Figure 4.5. A Simplified Flowsheet of the Pharmaceutical Process of Case Study I [48].
C1C2
H1
H2
308 K 513 K
398 K
338 K
358 K
298 K
308 K
328 K
Adiabatic
Reactor
Washing
Purification
Separation
To
Recovery
To
Storage
To
Finishing
298 K
To
Waste
Disposal
Impurities
H3318 K

68
Table 4.1. Data for the Process Hot and Cold Streams for Case Study I.
Stream Supply temperature, K
Target temperature, K
Rate of Enthalpy Change
kW H1 398 338 -2,325 H2 358 298 -1,125 H3 318 298 -875 C1 308 513 4,100 C2 308 328 725
By carrying out a thermal-pinch heat integration analysis, the GCC for the process is
developed as shown by Figure 4.6. The data extracted from the GCC indicate that the
process has refrigeration need of 1 MW and that the process can offer 0.75 MW of
excess process heating at 358 K that can be used as part of the energy supply to drive the
AR system. Hot water is used as the heat transfer medium in the LiBr-Water AR system
whose COP is 0.7.
Figure 4.6. The GCC of the Pharmaceutical Process.
0 0.5 1.0 1.5 2.0 2.5
533
493
453
413
373
333
293
253
T (K)
H∆ (MW)
QCW=
0.25 MW
QEx_Pro = 0.75 MW
QRef= 1.00 MW
QH = 2.50 MW

69
Solar energy is collected using parabolic trough collectors that produce hot water that
can be used directly or stored in insulated water tanks for later use to drive the AR
system. A parabolic trough solar collector is used with the following specifications:
• Aperture width =5.7m
• Aperture length = 99 m
• Receiver diameter = 0.07 m
• Optical efficiency= 0.80
• Receiver absorptivity = 0.96
• Mirror reflectivity = 0.96
• Receiver emittance = 0.19
The procedure reported by Tora [40] is used to evaluate the hourly useful collected solar
energy and is shown in Figure 4.7. The hourly data are integrated over the month to
calculate the monthly average collected energy as reported in Table 4.2. The total
annualized cost ($/yr) of the solar system is given by:
Annual
SolarCCSolarQAATAC 012.0085,120 6.0 ++= (4.8)
where AC is the area of the solar collector (m2) and Annual
SolarQ is the annual energy
collected by the solar system (kWhr/yr). The cost of the fossil fuel is $6.0/109 J.
Figure 4.7. Hourly Useful Collected Solar Energy.

70
Table 4.2. Monthly Average of Usefully Collected Solar Energy.
Month
Useful Collected Energy Per Unit
Area of Solar Collector
(kWh/m2.month) January 94.24
February 103.88
March 158.72
April 205.50
May 213.28
June 228.90
July 221.34
August 203.98
September 179.70
October 142.29
November 102.30
December 85.25
The use of solar energy earns the company a GHG credit of $0.008/kWh is the avoided
CO2 is worth $1/ton CO2 equivalent [49]. A sensitivity analysis is carried out for GHG
credits ranging from no credit up to $20/ ton CO2 equivalent.
The aforementioned optimization formulation has been applied to the case study and
coded using LINGO (which is a software that can solve linear, nonlinear, and mixed-
integer programming problems. For more details on LINGO, the reader is referred to
(www.LINDO.com). The objective function taken as the minimum cost of the heating
utility (expressed as annual cost of fossil fuel + total annualized cost of the solar energy
– GHG credit for the solar energy) was identified under the various scenarios of GHG

71
credit. In all these scenarios, the excess process heat provides 0.75/(1.00/0.7)*100% =
52.5%. In the case of no GHG credit, the solution indicates that fossil fuel is the
preferred external source of energy. All of the external heating utility was provided by
the fossil fuel at an annual cost of $128 k/yr. However, with a modest GHG credit of
$5/tonen CO2 eq., solar energy become more competitive requiring a collector area of
3,943 m2 and incurring a utility cost (including the GHG credit) of $126 k/yr. When the
credit is increased to $20/ tonne CO2 eq., then almost all of the external heat if provided
by solar energy. It is worth noting that several European countries are already providing
carbon credits higher than $20/tonne CO2 eq. [49]. Tables 4.3 and 4.4 summarize the
optimization results of the monthly distribution of the fossil and solar forms of energy
for the two scenarios of GHG credit.
Table 4.3. Percentage Contribution of Fossil versus Solar Energy to the Monthly Heating Requirement of the AR System for the Scenario: $5/tonne CO2 eq. GHG credit (Ac = 2,477 m2).
Month Solar Fossil
January 22.0 25.5 February 26.8 20.7
March 37.0 10.5
April 47.5 0.0 May 47.5 0.0
June 47.5 0.0 July 47.5 0.0
August 47.5 0.0 September 43.3 4.2
October 33.2 14.3
November 24.6 22.9 December 19.9 27.6

72
Table 4.4 Percentage Contribution of Fossil versus Solar Energy to the Monthly Heating Requirement of the AR System for the Scenario: $20/tonne CO2 eq. GHG credit (Ac = 4,779 m2).
Month Solar Fossil
January 42.4 5.1
February 47.5 0.0
March 47.5 0.0
April 47.5 0.0
May 47.5 0.0
June 47.5 0.0
July 47.5 0.0
August 47.5 0.0
September 47.5 0.0
October 47.5 0.0
November 47.5 0.0
December 38.3 7.2
CASE STUDY II: FORMIC ACID PROCESS
Consider the formic acid process shown by Fig. 4.8 [50-51]. The feed mixture of carbon
monoxide and methanol is fed to a carbonylation reactor that operates at 353 K and 4 MPa
in the presence of an alkoxide catalyst to produce methyl formate. The reaction products are
fed to the methyl formate distillation column where methyl formate is separated as the
distillate while methanol and catalyst are collected as bottoms and sent back to the
carbonylation reactor. The bottom stream entering the reboiler (C1) is heated to create the
boilup vapor to be returned to the column. A partial condenser is used for the top vapor
product (H1) followed by a refrigerant-using condenser acting on the remaining vapor (H2)
to recover methyl formate from the rest of the stream which is sent to an incinerator as a

73
purge gas. Methyl formate is heated (C2) then reacted with water in the hydrolysis reactor
to produce formic acid. The reaction products are flashed to recover methanol and methyl
formate which are cooled (H3) and recycled to the hydrolysis reactor.
Figure 4.8. A Simplified Flowsheet of the Formic Acid Process Used
in Case Study II[50-51].
The bottom product from the flash tank is fed to a distillation column to recover recyclable
components (methanol and methyl formate). The column requires cooling and heating
duties for the overhead condenser and the reboiler (H4 and C3, respectively). The bottom
product of the recycle distillation column is fed to the formic acid. The column requires
cooling and heating duties for the overhead condenser and the reboiler (H5 and C4). The
concentrated formic acid (H6) leaves the separation unit at 423 K and is to be cooled to 308
before storage. The stream data are given in Table 4.5.
H1
H2
H3
H4
H5
H6
C1
C2
C3
C4
Water
Recycled Water
Purge
Gas
Formic
Acid
Recycled Methyl Formate
and Methanol Recycled Methyl
Formateand Methanol
Recycled Methanol
and Catalyst
Carbon
Monoxide
Makeup
Methanol
and
Catalyst

74
Cooling water may be used as an external utility to cool the hot streams down to 308 K
below. Also, available for service is an LiBr-water AR system which can be used to cool
the hot stream to 288 K. A minimum driving force ( ∆Tmin ) value of 10 K is used. The
solar collector and site location described in Case Study I are also used in Case Study II.
Table 4.5. Data for the Process Hot and Cold Streams for Case Study I.
Stream Supply temperature, K
Target temperature, K
Rate of Enthalpy Change
MW H1 338 333 -5.3
H2 333 288 -0.3
H3 330 288 -1.4
H4 310 308 -2.7
H5 393 308 -4.3
H6 423 308 -0.2
C1 368 370 5.8
C2 333 393 0.8
C3 368 383 2.9
C4 423 430 4.7
The key results of the thermal pinch analysis for the process are illustrated by the GCC
shown by Figure 4.9. The process requires 12.90 MW of heating utility and it has
refrigeration requirement of 0.80 MW. The analysis also shows that the process can
provide 0.78 MW of excess process heating at 358 K that can be used as part of the
energy supply to drive the AR system. Similar to Case Study I, hot water is used as the
heat transfer medium in the LiBr-Water AR system whose COP is 0.7. Hence, the
external heat (solar and/or fossil) needed to drive the AR system is 0.36 MW. The data

75
for the process location, solar collector, fossil fuel, and GHG credit were given in Case
Study I.
Figure 4.9. The GCC for the Formic Acid Process.
The proposed optimization formulation is applied to the data of the formic acid case
study and solved using the software LINGO. The minimum cost of the heating utility
(expressed as annual cost of fossil fuel + total annualized cost of the solar energy – GHG
credit for the solar energy) was determined under various scenarios of GHG credit.
While the excess process heat provided 68.2% of the total energy needed to drive AR,
the solar and fossil forms of energy were used to supply the rest of the needed energy.
In a similar trend to the pharmaceutical process case study, in the case of no GHG credit,
fossil fuels is the preferred external source of energy. Nonetheless, as GHG credit
increases, the portion of solar contribution increases reaching almost all the required
268
288
308
328
348
368
388
408
428
448
468
0 1 2 3 4 5 6 7 8 9 10 11 12 13 14
)(MWH∆
T (K)
QH = 12.90 MW
QEx_Pro= 0.78 MW
QCW= 11.32 MW
QRef=0.80 MW

76
external energy when the credit is increased to $20/ tonne CO2 eq. These results are
summarized in Tables 4.6 and 4.7.
Table 4.6. Percentage Contribution of Fossil versus Solar Energy to the Monthly Heating Requirement of the AR System for Case Study II for the Scenario: $5/tonne CO2 eq. GHG credit (Cost = $53 k/yr, Ac = 1,272 m2).
Month Solar Fossil
January 14.1 17.7
February 17.2 14.5
March 23.7 8.0
April 31.8 0.0
May 31.8 0.0
June 31.8 0.0
July 31.8 0.0
August 30.5 1.3
September 27.8 3.9
October 21.3 10.5
November 15.8 16.0
December 12.8 19.0

77
Table 4.7. Percentage Contribution of Fossil versus Solar Energy to the Monthly Heating Requirement of the AR System for Case Study II for the Scenario: $20/tonne CO2 eq. GHG credit (Ac = 2,348 m2).
Month Solar Fossil
January 26.0 5.8
February 31.8 0.0
March 31.8 0.0
April 31.8 0.0
May 31.8 0.0
June 31.8 0.0
July 31.8 0.0
August 31.8 0.0
September 31.8 0.0
October 31.8 0.0
November 29.2 2.6
December 23.5 8.3
CASE STUDY III: ACRYLIC ACID PROCESS
An industrial plant producing acrylic acid is to be located in Abu Dubai (N 24o 25`, E
54o 39`), United Arab Emirates. The process flowsheet [50-54] is shown by Figure 4.10.
The plant consists mainly of two parts: the oxidation reactions and the product
separation and purification. The oxidation part has two exothermic reactors. A feed
mixture of propylene, steam, and air is fed to the first reactor where acrolein is produced.
The product stream is fed to the second reactor to be converted to acrylic acid as the
main product. A cooler is used between these two reactors to adjust the temperature of
the stream leaving the first reactor before entering the second reactor. The temperature
inside the reactors is adjusted by using molten salt to cool the reactors down to the
design temperature. This salt is used to produce steam. The product separation and

78
purification include a solvent extraction unit, solvent stripping, and distillation columns
to get the desired purity of acrylic acid. The solvent recovery has a distillation column
that requires refrigeration at 10oC to condense the evaporated solvent then circulate it to
the solvent extraction unit. The process stream data is given at Table 4.8.
Figure 4.10 Acrylic Acid Production Flow Sheet [51-54].

79
Table 4.8. Data of the Targeted Process Hot and Cold Streams for the Acrylic Acid Case Study.
Stream# Supply Temperature
(K)
Target Temperature
(K)
Rate of Enthalpy
Change (kW)
H1 623 563 -75
H2 288 288 -7,500
H3 383 313 -423
C1 443 448 233
C2 443 448 1212
C3 443 448 30
For the solar data, the typical meteorological year is obtained from the Energy Plus web
site: http://apps1.eere.energy.gov/buildings/energyplus/cfm/weather_data.cfm. The net
hourly useful solar radiation is estimated using parabolic trough solar collector used in
the previous two case studies. Figure 4.11 shows the hourly useful solar radiation
through the year and Table 4.9 gives the monthly average data for Abu Dhabi.
Figure 4.11 Hourly Useful Solar Radiations at Abu Dhabi.
0
100
200
300
400
500
600
700
800
5 7 9 11 13 15 17 19
qsu
(W
h/m
2)
Hour
January
February
March
April
May
June
July
August
Septmber
October
Novmber
December

80
Table 4.9. Monthly Average of Usefully Collected Solar Energy for Abu Dhabi.
Month qsu(kWh/m2.month)
January 77.28 February 105.34
March 108.93
April 130.62 May 175.77
June 173.01 July 157.33
August 161.20
September 143.19 October 121.18
November 85.71 December 68.54
Process heat integration is performed and the resulting GCC is plotted in Fig. 4.12. The
GCC shows that 151 kW of heat can be extracted from the process at temperature (358
K) suitable to run a single effect LiBr-H2O AR. The cooling-water load is 272 kW and
the refrigeration demand for AR is 7,500 kW. After recovering 151 kW from the
process and using an AR system with a COP of 0.7, there is still a need of 10,563 kW of
heat from the external sources to run the AR.

81
Figure 4.12 The GCC of the Acrylic Acid Production Process.
The optimization formulation is developed for the acrylic acid case study then solved
using LINGO optimization program. For the case of no GHG credit, the optimal solution
is to use fossil fuel as the only external energy source. The annual cost is $1.999 MM/yr.
However, when the GHG credit is increased to $5/tonne CO2 eq., 90% of the annual
energy needed to drive the AR is provided by the solar system (Ac = 64,852 m2). The
solar energy becomes more competitive in this case than in the previous two case studies
primarily to the economy of scale since the heat duty of this application is significantly
larger than the previous two case studies.
248
298
348
398
448
498
548
598
648
0 1000 2000 3000 4000 5000 6000 7000 8000
)(MWH∆
T (K)
QH = 1400 kW
QEx_Pro= 151 kW
QCW= 272 kW
QRef= 7500 kW

82
IV.2.2. THERMAL COUPLING OF TWO-LEVEL DUAL ABSORPTION
REFRIGERATION SYSTEM WITH INTEGRATION TO INDUSTRIAL
PROCESS
IV.2.2.1. OBJECTIVE
It is aimed at the development of a systematic procedure for the integration of AR
systems into industrial systems. Specifically, the following contributions are
methodically addressed:
• Utilization of excess process heat to drive AR
• Delivery of two cooling levels using two AR systems which are heat
integrated by extracting the heat from one cycle and using it to drive the other
The result of such a thermally-coupled double-effect AR system that utilizes heat
recovered from one cycle to the other and process heat is an enhancement of the
coefficient of performance of the system and a reduction in the overall energy
consumption.
IV.2.2.2. APPROACH
Heat is used to drive the cycle and two fluids are recirculated: a working fluid (e.g.,
water or ammonia) and an absorbent (LiBr or water, respectively). First, an absorbent is
used to dissolve a low-pressure vaporous working fluid from the evaporator resulting in
the release of exothermic heat. The working fluid-absorbent solution is pressurized using
a pump. Then, the working fluid is desorbed in a stripper (or generator) where heat is
added to the solution. The regenerated absorbent is recirculated back to the absorber. On
the other hand, the high-pressure vaporous working fluid is sent to the condenser to
condense at a moderate temperature (e.g. ambient). The high-pressure working fluid is

83
throttled and fed to the evaporator which extracts the refrigeration duty at a low
temperature.
Because the pumping energy is relatively small compared to the heat input, the
coefficient of performance (COP) for the AR system is defined as:
Str
f
Q
QCOP
Re= (4.9)
The heat added to the stripper can be delivered via a heat transfer medium. We consider
hot-water loops. Recirculating water is passed via heat exchangers to extract heat from
hot sources then dispatched to provide the necessary heat for stripping. Figure 4.13 is a
schematic representation of common configurations AR cycle using the NH3/H2O and
the H2O/LiBr cycles. Each of the two cycles need heat source at a certain temperature
level. The single-effect NH3/H2O cycle requires heat source at a temperature higher than
that needed for the H2O/LiBr cycle. The two cycles have the same units but the
NH3/H2O cycle requires an additional rectifier for high-level separation of NH3 from
H2O.
Figure 4.13. AR Systems with Hot Water Loop for Heat Recovery.

84
Prior to using external sources of heat, it is useful to extract excess process heat. In this
context, thermal-pinch analysis [6-10] should be implemented first to transfer heat
between process hot and cold streams, to determine minimum heating and cooling
utilities, and to determine minimum refrigeration load and excess heat below the pinch
to be extracted to drive the AR cycle.
The grand-composite curve (GCC) is developed for the process by plotting temperature
(arithmetic average of hot and cold temperatures) versus residual enthalpy as shown by
Fig. 4.14.
Figure 4.14. Target Identification and Integration of the GCC Representation with the Hot Water Loop.
The pinch point corresponds to the zero-residual point. Additionally, the top and bottom
residuals represent the minimum heating and cooling utilities. Next, it is important to use
the GCC to derive additional insights specifically for the AR system. Noting that the hot
water leaving the top stripper enters the heat recovery network at a temperature ( out
StrT ).
This temperature is represented on the GCC by adding half of the minimum approach
QRef2
QCW
QEx_Pro
HRExchin
Str TT
T ,min
2∆+
∆+
T
H∆
Pinch
Point
min
HQ
2
minT
TCW
∆+
QRef12
1,min
1Re
refTT f
∆+
2
2,min
2Re
refTT f
∆+

85
temperature between the hot and the cold stream ( 2/minTT out
Str∆+ ); where min
T∆ refers
to the minimum approach temperature between hot and cold streams used in
constructing the GCC. Therefore, the excess process heat must be higher than this
temperature at least with a minimum heat-transfer driving force, i.e.
HRExchout
StrTTT ,min 2/ ∆+∆+ ;where HRExch
T,∆ is the driving force of the heat exchanger
recovering heat from the process streams to the AR hot water tank. One can determine
the excess heat to be recovered for usage in AR. This is shown by Fig. 4.2 as oExQ Pr, .
This heat recovery offers two benefits: reduction of the required cooling lead for the
process and contribution to the heat needed to drive the AR system. In order to reduce
the cooling cost of the process, cooling water is used to remove the maximum feasible
load which corresponds to the temperature of the cooling water. Finally, the remaining
heat loads are distributed to the two refrigerants depending on their temperatures to
determine the minimum refrigeration demands for the process to be provided by the two
AR systems (QRef1 and QRef2); where QRef1 is needed at a temperature below the ambient
temperature and QRef2 is needed at a temperature above the ambient temperature.
The graphical approach identifies the values of QRefi and QEx_Pro. Consequently, the
external heat demand for the top cycle and the bottom cycle can also be determined. For
a given COP, the total heating rate needed for AR is determined via Eq. 1.
Since the external heat is one of the largest operating cost items of AR, it is desired to
reduce such heat usage. In addition to using excess process heat, we also propose the use
of heat from the hot stream leaving the stripper (generator) of the top cycle
(NH3/H2O).to provide heat to the stripper (generator) of the bottom cycle (H2O/LiBr). In
addition to reducing (or eliminating) the amount of external heat needed of the bottom
cycle, this thermal coupling also reduces the amount of cooling needed in the rectifier of
the top cycle. The proposed system is shown by Fig.4.15.

86
Figure 4.15. The Two Cycles Coupled Thermally by Internal Heat Integration.
The H2O/LiBr cycle produces cooling at temperatures above water freezing temperature
typically around 5oC and the (NH3/H2O) cycle produces cooling at lower temperatures
typically around -33oC, and can be down to -77oC.

87
Figure 4.16. The GCC for the Process with Thermal Coupling of the Two AR Cycles.
The heat release by both AR cycles is added to the GCC to determine the extent of
thermal coupling between the two cycles as well as the rest of the process. Figure 4.16 is
a schematic representation of the GCC for the process and the two AR cycles. The
H2O/LiBr cycle is represented by four streams: two cold streams passing through the
generator and the evaporator and two hot streams passing through the absorber and the
condenser. On the other hand, the NH3/H2O cycle is represented by five streams because
of the presence of one hotter stream passing through the rectifier. Table 4.10 summarizes
the streams involved in heat integration.
QRef2
QCW
QEx_Pro
HRExchin
StrT
TT ,
min
2∆+
∆+
T
H∆
Pinch
Point
minHQ
2
minT
TCW
∆+
QRef12
1,min
1Re
refTT f
∆+
2
2,min
2Re
refTT f
∆+
Heat recovered
from top cycle
Heat recovered
By bottom cycle

88
Table 4.10: AR Streams Data to be Integrated Thermally with the Process Streams.
Top cycle: (NH3/H2O)
Stream Supply Temperatu
re Ts
Target Tempera
ture Tt
Q *
H1
in
CondT
DP
ctfTRe
out
CondT
CondQ
H2 in
ctfTRe DP
ctfTRe ctfQRe
H3 Solution
PTXAbsT | Des
AbsT AbsQ
C1
out
strT
in
strT StrQ
=
COP
Q REf 1
C2 in
EvpT out
EvpT EvpQ
1REfQ
Bottom cycle (H2O/LiBr)
H1 in
CondT out
CondT
CondQ
H2 Solution
PTXAbsT | Des
AbsT AbsQ
C1
out
strT in
strT StrQ
COP
Q REf 1
C2
in
EvpT out
EvpT EvpQ
= 1REfQ

89
Considering the H2O/LiBr cycle shown by Fig. 4.13; the following expressions are used
to evaluate the heat duties of the different components:
78 hhQCond −= (4.10)
)( 34
7
347 hh
m
mhhQStr −+−= (4.11)
910 hhQEvp −= (4.12)
11661010 hmhmhmQAbsf −+= (4.13)
Similar expressions are used for the NH3/H2O cycle shown by Fig. 4.13 with one more
equation for the rectifier:
)( 87
87
7997Re hh
xx
xxhhQ ctf −
−
−+−= (4.14)
The enthalpy for any stream is a function of temperature, pressure, and composition, i.e.
),,( iiii XPTfh = (4.15)
IV.2.2.3. CASE STUDY
The GCC of an industrial food plant determines the need for cooling at two levels. The
refrigeration duties (in refrigeration tons) are 17.2 kWat and 148.4 kW at -7oC. The
GCC also determines that the plant has excess heat below the pinch with temperature
typically 130oC. That can be extracted to drive AR instead of paying electricity in case
of vapor-compression refrigerator usage.
The proposed thermally-coupled H2O/LiBr-NH3/H2O is considered for providing the
cooling demand at the two required levels with the objective of minimizing or
eliminating the need to external heat to drive the H2O/LiBr cycle.

90
It is also desired to make sensitivity analysis to investigate the feasibility of using the
proposed system at the plant if the plant operates at less-than-maximum capacity (which
will require lower refrigeration duties).
Aspen Plus simulation tool is used to simulate the AR system and to estimate its
performance. The top cycle has an evaporator operating at -10oC; while the bottom cycle
has an evaporator operating at 5oC.
IV.2.2.4. RESULTS AND DISCUSSION
The two AR cycles have been simulated using ASPEN Plus. The simulation used the
Peng Robinson equation of state in case of the NH3-H2O cycle. The desorber (generator)
has been simulated as a three-stage distillation column (using ASPEN’s RadFrac
module) with no condenser. Optimum feed stages and the numbers of the stages that
minimize the reboiler heat duty have been determined by a sensitivity analysis. The
strong solution from the absorber is fed to stage number 1. The rectifier is simulated as a
flash column; with a design specification to set the NH3 purity at the vapor stream at
0.9996 by changing the temperature of the flash column. The separated water from the
rectifier is circulated again to the desorber column at stage 1. Also the rectifier can be
simulated as part of the desorber (RadFrac.) by selecting a RadFrac with partial
condenser as shown by Fig.4.17.
Figure 4.18 shows the heating curve for the generator of the top cycle. The other heat-
exchange units have been represented by heater blocks; except the solution heat
exchanger which has been simulated as HeatX; which is a shell-tube heat exchanger
module in ASPEN Plus. Similarly, the H2O/LiBr cycle has been simulated without using
a rectification step.

91
The simulation used the thermodynamic databases electrolyte NRTL model considering
the salt (LiBr) and formation of ions. The entire system has been simulated with thermal
coupling by connecting the two cycles by a heat exchanger. Figure 4.19 gives the
ASPEN Plus Representation of the thermally-coupled double-effect AR System.
Figure 4.17. The Top Cycle is“NH3/H2O” and the Bottom Cycle is “H2O/LiBr” Simulation Flow Sheet.
-14
2
012
-10
2
0
13
40
16
0
9
40
16
010
41
2
16B
40
3
1
1
106
16
1
3
126
16
1
4
41
16
1
5
41
2
1
6
40
16
12
H-EVPQ=148322
H-COND
Q=-156613
H-ABSRQ=-193501
H-DES-RC
QC=-68273
QR=268833
H-ABSEXV
PUMPW=1521
H-EXPVLSSHX
Q=349848
Temperature (C)
Pressure (bar)
Mass Flow Rate (kg/sec)
Q Duty (Watt)
W Power(Watt)
7
8
COP=0.55
Temperature (C)
Pressure (kPa)
Vapor Fraction
Q Duty (Watt)
W Power(Watt)
BDESR
QC=0
QR=14222
64
7
03
76
7
1
7
89
7
04
BSSHX
Q=3031
32
7
0
2
51
7
0
5
B3
43
1
0
6B
BABS
Q=-13960
BPUMP
W=0
32
1
0
1
43
1
0
6
1
1
110
BEVP
Q=10744
1
1
09
BCOND
Q=-11385
BEXPV
40
7
0
13 COP=0.75

92
Figure 4.18. Simulation Results of the Temperature versus Vapor Fraction for Generator
of the Top Cycle “NH3/H2O”.
Figure 4.19. Thermally Coupled Dual System.
10B
6BOT
1B
LI-HOT
7B
4B
2B
5B
LI-C
6BB
9B 13B
NH3-HOT
NH3-C
12
13
10
6BTOP
1
3
456
2
BABS
BDESR
BSSHX
BOT-EXV
BPUMP
BEVP
BCOND
BEXPVHI-HX
H-EVP
H-COND
H-ABSR
H-DES-RC
H-ABSEXV
PUMP
H-EXPVLSSHX
7
8

93
Process simulation was also used to investigate the potential merits of the thermally-
coupled AR systems. Table 4.11 summarizes the conditions of the simulation. The
conditions of the absorber, the condenser, and the evaporator have been fixed.
Meanwhile, conditions of the other units have been varied and assessed through a
sensitivity analysis.
The minimum temperature needed to run the bottom cycle was taken to be 85oC. The
effect of the temperature of the heat source driving the top cycle has been studied in the
range of (125-165)oC. The following results have been observed:
A. Increasing the heat source of the top cycle improves the NH3/H2O cycle COP to
certain limit, but increasing the temperature more than 130oC decreases the COP
B. Increasing the temperature of the top cycle heat source provides more recovered
heat to the bottom cycle.
Table 4.11. Input Data Used in the Simulation.
Top cycle T(oC) P(kPa) X
Evaporator -10 240 0.99965
Absorber 31 240 0.3686
Condenser 40 1555 0.99965
Bottom cycle T(oC) P(kPa) X
Evaporator 1.3 0.673 1
Absorber 31 0.673 0.433
Condenser 40 7.4 1
X = refrigerant mass fraction (kg/kg)

94
This is explained by increasing the temperature approach between the minimum
temperature needed to run the H2O/LiBr cycle and the available recovered heat. Table
4.12 provides a summary of the simulation results and the merits of thermal coupling of
the two AR cycles; and also the results are shown at Fig. 4.20.
The COP of the proposed dual cycle thermally coupled through the desorbers can be
better than the individual NH3/H2O cycle under certain circumstances. This is mainly at
heat temperatures higher than 130oC. Therefore using the dual system is recommended
when the heat sources available at temperatures higher than that needed to run the single
cycle and lower than that needed to run the two-stage NH3/H2O cycle. The result is that
this dual system increases the entire COP and produces extra cooling at the second level.
Table 4.12. Summary of Simulation Results.
TOP CYCLE
Rec
over
ed
Q (
kW
)
Bottom cycle NH3/H2O
COP
Dual system COP
COP%
increase Boiler Exit T
oC
Desorber oC
Evaporator Q(kW)
Pump kW
Q kW
126 125-99 147.3 1.60 6.7 4.7 0.592 0.611 3.2
133 132-104 148.3 2.14 14.9 10.4 0.572 0.612 7.0
140 139-109 148.4 2.05 24.6 17.2 0.552 0.617 11.8
153 152-117 147.9 2.75 47.2 33.0 0.508 0.622 22.4
164 163-120 147.7 3.35 66 46 0.456 0.609 33.6

95
Figure 4.20. Effect of Top Cycle Size on the Bottom Cycle Size.
C. Increasing the heat source of the top cycle improves the NH3/H2O cycle COP to
certain limit, but increasing the temperature more than 130oC decreases the COP.
D. Increasing the temperature of the top cycle heat source provide more recovered
heat to the bottom cycle, this is explained by increasing the temperature approach
between the minimum temperature needed to run H2O/LiBr cycle and the
available recovered heat.
Figure 4.21 shows that COP of the dual cycle can be better than the only NH3/H2O cycle
under certain circumstances. That is mainly at heat temperatures higher than 130oC.
Therefore using the dual system is recommended when the heat sources available at
temperatures higher than needed to run the single cycle and lower then the needed to run
the two stage NH3/LiBr cycle. As this dual system increases the entire COP and
produces extra cooling at the second level. Under the simulation assumed conditions, the
optimum COP of the proposed dual system is 0.61 corresponding to 0.515 in case of
only using NH3/H2O single effect cycle; this takes place when using high pressure of the
y = 0.0316x + 0.0101
0.568
0.572
0.576
0.58
0.584
0.588
0
0.5
1
1.5
2
2.5
3
3.5
4
4.5
5
0 50 100 150 200
CO
P
Bo
tto
m c
ycl
e c
ap
aci
ty (
kW
)
Top cycle capacity (kW)
Effect of the top cycle capacity on the dual system performance
free Cool at level 2 COP_Nh3/H2OCOP_Dual Linear (free Cool at level 2)

96
top cycle equal 2000 KPa (139oC); which is 19% increase in COP of the entire system,
in addition to producing typically 6 TR free at 2 oC.
Figure 4.21. Effect of the Top Cycle Heat Source on the Entire Dual System Performance.
0.4
0.45
0.5
0.55
0.6
0.65
125 130 135 140 145 150 155 160 165
CO
P
Top cycle heat source temperature (oC)
Effect of heat source on the proposed system performance compared to single NH3/H2O cycle
NH3/H2O cycle alone
Proposed dual system

97
CHAPTER V
INTEGRATED DESIGN OF SOLAR-ASSISTED TRIGENERATION SYSTEMS
The growing concern about the depleting fossil-energy sources and the increasing desire
to reduce greenhouse gas (GHG) emissions are motivating the process industries to
adopt various approaches to conserving energy and moving to more sustainable energy
sources. This work is aimed at the development of a systematic procedure for energy
conservation through the integrated design of trigeneration systems (combined cooling,
heating, and power “CCHP”) while incorporating solar energy as a renewable form of
energy with low GHG emissions. Absorption refrigeration is used to utilize excess
process heat and any needed external energy in the form of fossil and/or solar energy. To
account for the fluctuation in collected solar energy, the decision-making horizon is
discretized into multiple periods. An extended transshipment representation is
developed to embed potential configurations of interest. Power generation is achieved
through steam turbines and refrigeration is induced through absorption refrigeration.
Next, a nonlinear programming formulation is developed. Heat integration and energy
transformation constraints are included. The integrated systems exchange energy
through feasible intervals that are tied to the models characterizing the different
components of the system. The solution of the optimization formulation determines the
optimal levels of power, external heating, external cooling, heat integration, mix of
fossil/solar energy forms to be supplied to the process, and the scheduling of the system
operation. A case study is solved to show the applicability of the devised approach.

98
V.1. INTRODUCTION
The dwindling fossil energy sources and the increasing concern about the consequences
of greenhouse gas emissions on global climatic changes provide much motivation for the
use of renewable energy sources. As such, there is a significant need to incorporate
renewable energy sources in industrial processes. There is also much need for integrated
energy systems that address the combined cooling, heating, and power needs of the
process which is referred to as trigeneration. Several advantages accrue as a result of
using trigeneration. Thermodynamic and thermo-economic analyses indicate an
enhanced performance and increased cost effectiveness when trigeneration systems are
properly designed and operated [55-59] report that for cases when the efficiency of a
conventional power plant was reported to be about 40%, the use of trigeneration can
enhance the plant efficiency by a factor of 2. Trigeneration contributes to enhanced
sustainability through the reduction of greenhouse gas (GHG) emissions [60]. It has been
shown that 200 kg CO2/ MWh-1 reduction can be achieved when trigeneration is applied
instead of a conventional power cycle [61]. Trigeneration can use a variety of sources
including waste heat [62] and offers enhanced flexibility [62]. More details on
trigeneration can be found in recent literature reviews [63-64].
There are several configurations of trigeneration systems that can be integrated into the
process industries. Because of the critical role played by heat transfer in industrial
processes, this work focuses on trigeneration systems that employ extraction steam
turbines for power generation with the exhaust steam used for heating. For low-
temperature cooling, absorption refrigerators (AR) are considered in this work because
they are largely driven by heat which may be extracted from process sources or provided
from external energy. In addition to using fossil fuels for supplying external energy, this
work includes the use of solar energy as a renewable and sustainable form of energy.
Since solar energy cannot be collected continuously throughout the day, it is usually
supplemented with other forms of energy or with an energy storage system. This poses

99
an additional level of complexity in designing solar-assisted trigeneration systems. Solar
systems are being increasingly considered in industrial facilities for combined heat and
power (cogeneration) systems [64] and in absorption refrigeration [65].
The overall objective of this work is to develop a systematic procedure for the optimal
design trigeneration systems that are integrated with the process. The system includes
extraction turbines, heating, cooling, and absorption refrigeration. Heat integration is to
be considered among the process hot and cold streams as well as with the trigeneration
components. Fossil and solar forms of energy are used to provide external sources of
energy. The developed procedure is aimed at answering the following questions:
• What are the optimum heating and cooling requirements for the process?
• What fractions of energy should be provided by solar energy and fossil fuel?
• How to handle dynamic changes for the solar energy while providing a steady-
state performance to meet the process requirements for heating, cooling, and
power?
• What are the optimum design and operating variables of the system?
• What is the impact of GHG policies (e.g., carbon credits) on the system design?
To address these challenging tasks, process integration techniques are coupled with an
optimization formulation to evolve an effective and methodical approach.
V.2. PROBLEM STATEMENT
Consider a process with several process hot and cold streams. Heat may be exchanged
among the hot and cold streams and external utilities may also be needed to provide
external heating and cooling at different temperature levels. In addition to heat
integration, the process is considering the following options:
- Combined heat and power: Steam may be provided directly to the process or
through a power-generation extraction turbine

100
- Absorption refrigeration: excess process heat or external heating sources may be
used to induce refrigeration through an absorption refrigeration cycle
- Solar energy and fossil fuel are considered for usage as external sources of heat
(to be used in steam generation and/or absorption refrigeration)
The problem to be addressed involves the design and integration of a cogeneration
system and an AR cycle into an industrial facility and the optimal selection of the
optimal mix of energy (solar and fossil) sources which vary dynamically throughout the
year. The problem is formally stated as follows:
Given a continuous process with:
• A number NH of process hot streams (to be cooled) and a number NC of process
cold streams (to be heated). Given also are the heat capacity (flowrate x specific
heat) of each process hot stream, FCP,u ; its supply (inlet) temperature, Tus; and its
target (outlet) temperature, Tut, where u = 1,2,...,NH. In addition, the heat capacity,
fcP,v , supply and target temperatures, tvs and tv
t, are given for each process cold
stream, where v = 1,2,.,NC.
• Available for service are the following:
• A set C_UTILIITY = {c|c = 1,2, …, NCU}of cooling utilities whose supply and
target temperatures (but not flow rates) are known.
• A set FOSSIL_UTILITY = {f|f = 1,2, …, NFHU}of fossil-based heating utilities. For
each fossil-based heating utility, the temperature ( Fossil
fT ) and the cost ( Fossil
fC ) are
known.
• Solar energy is a candidate as a source of heat. The useful collected solar energy
varies dynamically. The size and cost of the solar energy collection system are
unknown and are to be determined through optimization. An economic incentive
(e.g., a carbon tax credit) may be available for the use of solar energy to reduce the
emission of greenhouse gases GHGs.

101
• The cogeneration system involves the use of a steam turbine to produce power and
heat. The optimal values of power and steam are to be determined.
• A portion of the process refrigeration demand is to be fulfilled using AR. These
refrigerators can obtain the needed heat from process excess heat, solar energy, and
fossil fuel. Hot water loops are used to pick up the heat from the three energy
sources and deliver the heat to the AR System. The rest of the cooling duty of the
process is to be provided by other cooling utilities (e.g., cooling water, refrigerants).
Figure 5.1 is a schematic representation of the problem.
Figure 5.1. Schematic Representation of the Problem Statement.
Industrial Process
Steam
Generation
Solar Energy
Fossil Fuel Power OutExtraction
Turbine
Steam
Steam
Steam
Absorption
Refrigeration
Solar Energy
Fossil Fuel
Excess Process Heat
Other Heating
Utilities
RefrigerationOther
Cooling
Utilities

102
V.3. APPROACH
The first step in the solution methodology is to develop a structural representation which
embeds the potential configurations of interest. An “extended transshipment model” is
introduced. It is an extension of the transshipment model developed by [66] for the
synthesis of heat-exchange networks. The transshipment model starts by developing a
temperature-interval diagram (TID) by representing each stream as a vertical arrow
between supply and target temperatures. Horizontal lines are drawn at the locations of
the supply and target temperatures. The distance between each two consecutive
horizontal lines is referred to as a temperature interval. Within the same interval, heat
may be transferred from hot to cold streams. Furthermore, heat may be transferred down
where it can exchange heat with a cold stream at a lower interval.
We now revise the transshipment model to the multi-period extended transshipment
model by introducing the following modifications and assumptions:
• The decision-making time horizon (e.g., a year) is discretized into Np periods
leading to a set of operating periods: PERIODS = {p|p= 1,2, …,Np}. Within
each time period, the values of energy usage are averaged and the analysis within
that period is carried out for the averaged energy values of each energy type. In
selecting the number and duration of the periods, it is important to reconcile the
accuracy of fluctuations (e.g., in solar energy) versus the computation efforts.
• For absorption refrigeration, a heat recovery system along with a hot-water
storage and dispatch network are used. This arrangement enables the collection
of heat from different sources and the inter-period heat integration (i.e., storing
heat in one period and dispatching it in another period)
• For steam generation for cogeneration, it is only allowed to have intra-period
integration (i.e., no energy is stored, integrated, or exchanged over more than one
period)

103
• For each period, the transshipment model is now extended by introducing
cogeneration and absorption refrigeration as follows:
• Solar energy and fossil fuel are considered for steam generation. The relative
contribution of each type of energy may vary from one period to another. The
generated steam is allowed to go through an extraction turbine which produces
power and lets down steam for further usage as a heating medium. The power
generated from the turbine during period p is calculated through the turbine
performance model, p
ψ , as follows:
),( ___ TurbineExitSteam
p
CogenSteam
ppp HHPOWER ψ= p∀
wherep
POWER is the electric power produced during period p from the steam
turbine receiving steam enthalpy CogenSteam
pH_ and discharging steam enthalpy
TurbineExitSteam
pH__ during period p. Steam is also allowed to bypass the power
generation system and to be used directly for heating. The outlet steam splits
(from the turbines or from the steam-generation system) are assigned to different
temperature intervals depending on their temperatures and the steam headers to
which they are allocation. The flow rates of the steam splits are to be determined
through optimization.
• The AR system is driven largely by heat. There are two fluids employed in AR: a
working fluid (e.g., ammonia or water) and an absorbent (e.g., water or LiBr,
respectively). When a low-pressure vapor from the evaporator is absorbed in the
absorbent, heat is released. The absorption mixture of the working fluid and
absorbed is pumped and fed to a stripper (generator) where heat is added to the
solution and the working fluid is released as a high-pressure vapor. The
absorbent is returned to the absorber while the high-pressure vapor is fed to the
condenser to condense at a moderate temperature. The high-pressure working
fluid is throttled and fed to an evaporator which extracts the refrigeration duty at
a low temperature. An effective method for delivering heat to the stripper is
through the use of hot-water loops. Recirculating water is passed via heat

104
exchangers to pick up heat from the three considered sources of energy (excess
process heat, fossil, and solar). The heat needed to drive the AR is delivered to
the stripper through the hot water then returned back to the heat recovery system.
Heat recovered beyond that needed to immediately drive the AR system is stored
in well-insulated tanks for later usage. Such a heat storage and dispatch system is
quite useful in handling the dynamic fluctuation in the collected solar energy.
Therefore, the transshipment model is modified by including the following:
• Steam allocation to the corresponding temperature intervals from the exit of the
steam turbines or directly from the steam-generation system.
• Extraction of heat from the temperature intervals to the hot-water loop storage
and dispatch network. Such extraction is limited to intervals that lie above the
minimum acceptable temperature for heating the water loop to obtain in
strT . The
amount of heat (QStr) is to be determined via optimization.
• Extraction of the AR refrigeration duty (QRef) at the refrigeration temperature
TRef. At this temperature, an interval (u = Ref) is created specifically for the
withdrawal of QRef. The value of QRef is an optimization variable.
• Addition of heat from the absorber of the AR cycle. An interval is created at the
temperature TAbs and the heat to be removed from the absorber (QAbs) is added to
this interval. When the pumping energy is neglected compared to the heat duties
of the AR cycle, then QAbs can be related to QRef and QStr through heat balance
and the COP.
V.4. MATHEMATICAL FORMULATION
Let us first start with developing the heat balances over the temperature intervals. The
exchangeable load of the uth hot stream (assuming that it is losing sensible heat but it can

105
be readily modified to account for latent heat) which passes through the zth interval is
defined as
HHu,z,p = Fu,p Cp,u,p (Tz-1,p - Tz,p) (5.1)
where Tz-1,p and Tz,p are the hot-scale temperatures at the top and the bottom lines defining
the zth interval for period p. On the other hand, the exchangeable capacity of the vth cold
stream (gaining sensible heat) which passes through the zth interval is computed through
HCv,z,p = fv,p cp,v,p (tz-1,p - tz,p) (5.2)
where tz-1,p and tz,p are the cold-scale temperatures at the top and the bottom lines defining
the zth interval for period p.
By summing up the heating loads and cooling capacities, we get:
pzu
wherez interval through passesu
Total
pz HH = HH ,,
N ......, 2, 1,=u
,
H
Σ (5.3)
and
pzv
Nvandz interval through passes v
Total
pz HC = HC
C
,,
,....,2,1
, Σ=
(5.4)
Next, we move to incorporating heating and cooling utilities (excluding steam and AR).
For temperature interval z, the heat load of the uth heating utility is given by:
HHUu,z,p = FUu,p Cp,u,p (Tz-1,p - Tz,p) (5.5)
where u = NH +1, NH +2, ..., NH + NHU
where FUu,p is the flowrate of the uth heating utility during period p. The sum of all heating
loads of the heating utilities in interval is expressed as:

106
pzu
uwherez interval through passesu
Total
pz HUU = HHU ,,
N + N ......, 2,+ N 1,+ N
,
HUHHH
Σ=
(5.6)
The total heating load of the uth utility in the network during period p may be evaluated by
summing up the individual heat loads over intervals:
pzu
z
pu HHUQH ,,, ∑= (5.7)
Similarly, during the pth period, the cooling capacities of the vth cooling utility in the zth
interval is calculated as follows:
HCUv,z,p = fUv,p cp,v,p (tz-1,p - tz,p), v = NC +1, NC +2, ..., NC + NCU (5.8)
where fUv,p is the flowrate of the vth cooling utility during period p.
The sum of all cooling capacities of the cooling utilities during period p is expressed as:
pzv
vwherez interval through passes v
Total
pz HCU = HCU ,,
N + N ......, 2,+ N 1,+ N
,
CUCCC
Σ=
(5.9)
The total cooling capacity of the uth utility in the network over period p may be evaluated
by summing up the individual cooling loads over intervals:
pzv
z
pv HCUQC ,,, ∑= (5.10)
During period p, the heat added by steam allocated directly from the steam-generation
system is given by:
∑=z
DirectSteam
pz
DirectSteam
p HH _
,
_ (5.11)

107
Similarly, during period p, the heat added by steam allocated from the exit of the turbines is
given by:
∑=z
TurbineExitSteam
pz
TurbineExitSteam
p HH __
,
__ (5.12)
For the zth temperature interval lying above the minimum acceptable temperature to heat
the stripper via the hot-water loop, the amount of heat extracted from the process excess
heat to the hot-water loop is designated by processStr
pzQ,
, . Hence, for such intervals, one can
write the following heat-balance equation for period p as follows:
pzpz
processStr
pz
TurbineExitSteam
pz
DirectSteam
pz
Total
pz
Total
pz
Total
pz
Total
pz
rrQ
HH HHCHHU HC HH
,,1
,
,
__
,
_
,,,,,
−=−
++−+−
−
z = 1,2,... nTstr (5.13)
where rz-1,p and rz,p are the residual heats entering and leaving interval z during period p.
For the temperature interval corresponding to the absorber temperature, the heat balance is
written as follows:
pzpz
Abs
processStr
pz
TurbineExitSteam
pz
DirectSteam
pz
Total
pz
Total
pz
Total
pz
Total
pz
rrQ
QHH HHCHHU HC HH
p ,,1
,
,
__
,
_
,,,,,
−=+
−++−+−
−
z = Abs (5.14)
For the temperature interval where the AR refrigeration duty is withdrawn, the heat
balance may be expressed as:
pzpz
Abs
p
TurbineExitSteam
pz
DirectSteam
pz
Total
pz
Total
pz
Total
pz
Total
pz rrQHH HHCHHU HC HH ,,1
__
,
_
,,,,, −=−++−+− −
Z = Ref (5.15)
The following additional constraints are also needed:
0,,0 int==
pnprr (5.16)
This guarantees that all heat duties are in balance within the network.

108
0, ≥pz
r 1,....2,1 int −= nz (5.17)
This insures that heat flows downwards. Furthermore, non-negativity constraints are written
for the flows and heat duties of the utilities.
Figure 5.2 is a schematic representation of the proposed extended transshipment model for
the trigeneration system.
Figure 5.2. The Extended Transshipment Model for Trigeneration.
The contributions of fossil fuel and solar energy are calculated for cogeneration, direct
steam heating, and absorption refrigeration through the following expressions:
Cold
Cold
Interval 1
Interval 2
Interval z
Interval Ref
Interval N
Steam
Generation
Solar Energy
Fossil FuelPower Out
ExtractionTurbine
Steam
Steam
Steam
Hot
.
.
.
Hot
.
.
.
Cold
Cold
Cold
Heat
Recovery,
Storage, and
Dispatch of
Hot Water
System
Solar
Energy
Fossil
Fuel
Excess
Process
Heat
Absorption
Refrigeration
Hot
Hot
Hot
Interval AbsColdHot
QAbs
QRef

109
CogenSteam
p
CogenFossil
p
CogenSolar
p HQQ___ =+ (5.18)
With the turbine modeling equation that relates the power to the inlet and outlet steam
conditions, i.e.,
),( ___ TurbineExitSteam
p
CogenSteam
ppp HHPOWER ψ= p∀ (5.19)
DirectSteam
p
DirectSteamFossil
p
DirectSteamSolar
p HQQ_____ =+ (5.20)
Where
∑=pz
DirectSteam
pz
DirectSteam
p HH _
,
_ (5.21)
Similarly, for the AR system,
ARExternal
p
ARFossil
p
ARSolar
p QQQ___ =+ (5.22)
where ARExternal
pQ_ is the external heat added to the stripper of the AR cycle through fossil
fuel and solar energy. The heat added to the hot-water loop heating the stripper may come
from excess process heat and/or external sources (fossil and solar), i.e.
ARExternal
p
ocessStr
p
Str
p QQQ_Pr_ += (5.23)
where the excess process heat is collected from the intervals above the minimum acceptable
temperature for the hot-water loop, i.e.
∑=
=Tstrn
z
ocessStr
pz
ocessStr
p QQ1
Pr_
,
Pr_ (5.24)
Because the pumping energy in the AR cycle is relatively small compared to the heat
input, the coefficient of performance (COP) for the AR system is defined as:
Str
p
f
p
pQ
QCOP
Re
= (5.25)

110
The COP is assumed to be known for the selected type of AR. Hence, the COP provides the
linkage between the heat added to the stripper and the refrigeration duty of the AR system.
The evaluation of the dynamic performance of solar systems and its dependence on location
and collector characteristics has been described by another researcher [67]. The following
is a brief description of relating the collected energy to the surface area of the collector. The
solar energy collected by the sth collector in period p is given by:
s
SolarUseful
ps
Solar
ps AQQ *_
,, = s∀ , p∀ (5.26)
SolarUseful
psQ_
, is the useful power collected (and delivered in a thermal form) per unit area
of the sth solar collector in period t and As is the area of the sth solar collector.
Therefore,
Cogen
ps
SolarUseful
ps
CogenSolar
ps AQQ ,
_
,
_
, *= (5.27)
SteamDirect
ps
SolarUseful
ps
SteamDirectSolar
ps AQQ_
,
_
,
__
, *= (5.28)
AR
ps
SolarUseful
ps
ARSolar
ps AQQ ,
_
,
_
, *= (5.29)
The design value of the surface area of the collector is the largest over all the periods,
i.e.,
Cogen
s
Cogen
ps AA ≤, p∀ (5.30)
SteamDirect
s
SteamDirect
ps AA__
, ≤ p∀ (5.31)
AR
s
AR
ps AA ≤, p∀ (5.32)
The annualized fixed cost of the sth solar power plant is given as a function ( sα ) of the
size:
)( Cogen
ss
Cogen
sAAFC α= (5.33)

111
)( __ SteamDirect
ss
SteamDirect
sAAFC α= (5.34)
)( AR
ss
AR
sAAFC α= (5.35)
It is worth noting that the cogeneration terms in the previous equations refer to the
simultaneous production or power and useful thermal energy [11]. The solar collectors and
fossil-fuel systems may be designed to provide energy for the cogeneration and AR systems
separately or jointly. The foregoing equations describe the more general case of installing
separate units for each. When the same energy systems are used simultaneously for
cogeneration and AR, the problem representation and formulation become simpler with a
single term describing the performance and cost of the energy systems [37].
The objective of the optimization formulation is to minimize the total annualized cost of the
system which may be expressed as:
Minimize: )( ____ ARFossil
p
DirectSteamFossil
p
CogenFossil
pp
Fuel
pQQQC ++∑
+ ARSolar
s
DirectSteamSolar
s
CogenSolar
sAFCAFCAFC
____ ++
+
)( __
,
____
,
__
,
ARSolar
p
ARSolar
sp
DirectSteamSolar
p
DirectSteamSolar
sp
CogenSolar
pp
CogenSolar
spQCQCQC ++∑
+ CogenARAFCAFC + + +∑∑
+
+=pu
NN
Nu
pu
p
QHCHHUH
H
,
1
, * pv
NN
Nv
pv
p
QCCCCUC
C
,
1
, *∑∑+
+=
(5.36)
where Fuel
pC , ARSolar
sp
DirectSteamSolar
sp
CogenSolar
sp CCC_
,
__
,
_
, ,, are the unit operating costs of the
fossil fuel, the solar system used for cogeneration, the solar system used for direct steam
generation, and the solar system used for heating the stripper in the AR cycle,
respectively, in period p. The AFC is the annualized fixed cost. Also, CHu,p designates
the cost of the uth heating utility and CCv,p designates the cost of the vth cooling utility in
period p. When credits are given for the reduction of greenhouse gas emissions resulting

112
from the use of solar systems, a credit terms (carbon credit per tonne of CO2-
equivalent*annual reduction in tonnes of CO2-equivalent emissions). This formulation is
a nonlinear program that can be solved using commercially available software (e.g.,
LINGO).
V.5. CASE STUDY: SOLAR - ASSISTED TRIGENERATION IN A
PHMARMCEUTICAL PLANT
Consider the pharmaceutical processing facility shown in Fig. 5.3 adapted from El-
Halwagi [65]. The plant is located at the city of Daggett in San Bernardino County in
California with the following coordinates {N 34° 52'} {W 116° 46'}. The data for the
process hot and cold streams are given in Table 5.1. A steam turbine is used in cogenerating
heat and power. The combined power and thermal efficiencies of cogeneration are 70%
(distributed as 38% for power and 32% for heating using the outlet steam at 545 K).
Exchanges to the power grid are allowed. Therefore, when the cogeneration system
produces more than the demand for the plant, the additional power is exported to the grid.
Conversely, when the power generated from cogeneration is less than the process demand,
external power is imported from the grid. Cooling water may be used as an external utility
to cool the hot streams down to 314 K below which an LiBr-water AR system is used to
provide chilling water at 283 K. A minimum driving force ( ∆Tmin ) value of 10 K is used.
Hot water is used as the heat transfer medium in the LiBr-Water AR system whose COP
is 0.7.

113
Figure 5.3. A Simplified Flow Sheet of the Pharmaceutical Process of Case Study I.
C1C2
H1
H2
308 K 513 K
398 K
338 K
358 K
298 K
308 K
328 K
Adiabatic
Reactor
Washing
Purification
Separation
To
Recovery
To
Storage
To
Finishing
298 K
To
Waste
Disposal
Impurities
H3318 K

114
Table 5.1. Data for the Process Hot and Cold Streams for Case Study I.
Stream Supply temperature, K
Target temperature, K
Rate of Enthalpy Change
kW H1 398 338 -186
H2 358 298 -90
H3 318 298 -70
C1 308 513 328
C2 308 328 58
Solar energy is collected using parabolic trough collectors. The procedure monthly
average collected energy data are calculated according to the procedure reported by [68]
and are reported in Table 5.2. The total annualized cost ($/yr) of the solar system is
given by:
Annual
SolarssSolarQAATAC 012.0085,120 6.0 ++= (5.37)
As is the area of the solar collector (m2) and Annual
SolarQ is the annual energy collected by the
solar system (kWhr/yr). The cost of the fossil fuel is $6.0/109 J. The use of solar energy
earns the company a GHG credit of $0.008/kWh when the avoided CO2 is worth $1/ton
CO2 equivalent [69]. For the case study, a sensitivity analysis is carried out for GHG
credits ranging from no credit up to $20/ ton CO2 equivalent.

115
Table 5.2. Monthly Average of Usefully Collected Solar Energy.
Month
Useful Collected Energy Per Unit
Area of Solar Collector
(kWh/m2.month) January 94.24 February 103.88 March 158.72 April 205.50 May 213.28 June 228.90 July 221.34
August 203.98 September 179.70
October 142.29 November 102.30 December 85.25
Using the aforementioned formulation and solving the resulting optimization problem
using LINGO 11, we get a trigeneration system which produces 0.24 MW of power,
0.20 MW of heating, and 0.08 MW of refrigeration. The optimization program was
solved for different values of carbon credit. In the case of no carbon credit, all of the
external energy is supplied by the fossil fuel for an annual cost of $128 k/yr. However,
when the carbon credit is $5/tonne CO2 eq., solar energy becomes more competitive
requiring a collector area of 3,943 m2 and incurring a utility cost (including the GHG
credit) of $126 k/yr. When the credit is increased to $20/ tonne CO2 eq., then almost all
of the external heat if provided by solar energy. Figure 5.4 shows the percentage of
external energy provided by the solar collectors for two scenarios of carbon credit.

116
Figure 5.4. Percentage External Energy Supplied by the Solar Collectors for Two Levels of Carbon Credits.
0
10
20
30
40
50
60
70
80
90
100
1 2 3 4 5 6 7 8 9 10 11 12
$5/tonne CO2
$20/tonne CO2
Month
% External
Energy
Provided
By Solar
System

117
CHAPTER VI
CONCLUSIONS AND RECOMMENDATIONS
A set of systematic procedures have been introduced for the design and integration of
energy systems that employ solar energy directly or used in conjunction with fossil fuel
and/or biofuel. The work has also addressed the following design problems involving:
• Solar and fossil for power generation
• Solar, bio, and fossil for cogeneration
• Solar energy, and fossil fuels integration with process extra heat to run
absorption refrigeration and produce cool
• AR systems using solar energy, excess process heat, and fossil fuels
• Thermal coupling of dual AR systems
• Solar-assisted trigeneration systems in industrial processes
The developed procedures include a combination of gathering and generation of certain
required data, modeling the various components, analyzing different scenarios and
configurations, optimizing system performance, and estimating the system economics.
Several case studies have been solved to illustrate the applicability of the developed
procedures and to evaluate the results. Although the power, heating, and cooling
generated by the solar-fossil or solar-bio-fossil hybrid systems may be more expensive
than that commercially generated by fossil fuels, there are significant environmental and
sustainability merits for using the solar system. For instance, the operation of a solar
system is virtually free of greenhouse gas emissions. As such, if there are carbon credits,
the cost gap between the solar/biofuels and the fossil energies can be readily diminished.
The case studies show that a credit of $5 to 20/tonne CO2 equivalent can render the
solar-assisted systems commercially viable.

118
The following future work is recommended:
• Integration of molecular design approaches with the developed procedures for the
synthesis and screening of refrigerants
• Design under uncertainty: the design procedures can be modified to account for
uncertainties in solar energy and process performance
• Incorporation of safety metrics in the objective functions of the design procedures
• Incorporation of commercial solar-design software in the developed procedures

119
REFERENCES
1. El-Halwagi, MM. Process Integration, Process Systems Engineering, Vol. 7.
Elsevier: New York, 2006.
2. Kreith F, Goswami YD. Handbook of Energy Efficiency and Renewable Energy.
CRC Press: Boca Raton, FL, 2007.
3. Zakhidov RA, Anarbaev AI. Application of Solar Heat Sources at Thermal Electric
Power Plants. Applied Solar Energy 2010; 46: 66–70.
4. Stoecker WF. Industrial Refrigeration Handbook. McGraw-Hill: New York, 1998.
5. Smith R. Chemical Process: Design and Integration. John Wiley& Sons Ltd: West
Sussex, UK, 2005.
6. Kemp I. Pinch Analysis and Energy Integration: A User Guide on Process
Integration for the Efficient Use of Energy. Elsevier: New York, 2006.
7. Herold KE, Radermacher R, Klein SA. Absorption Chillers and Heat Pumps. CRC
Press, Inc: Boca Raton, FL, 1996.
8. Duffie JA, Beckman WA. Solar Engineering of Thermal Process. John Wiley &
Sons: New York, 2006.
9. Meniel AB, Meinel MP. Applied Solar Energy: An Introduction. Addison-Wesley
Publishing Company: Reading, MA, 1976.
10. Sukhatme SP, Nayak NK. Solar Energy: Principles of Thermal Collection and
Storage. Tata McGraw-Hill Publishing Company Limited: New Delhi, India, 2008.
11. Potential for Renewable Energy in the San Diego Region August 2005. Access on
17th. October 2010. http://www.renewablesg.org/docs/Web/AppendixE.pdf.
12. Vogel W, Kalb H. Large-Scale Solar Thermal Power: Technologies, Costs and
Development. John Wiley& Sons: New York, 2010.
13. Weiss W. Rommel M. Process Heat Collectors State of the Art within Task 33/IV.
IEA SHC-Task 33 and SolarPACES-Task IV: Solar Heat for Industrial. AEE
INTEC: Gleisdorf, Feldgasse 19, Austria, 2008.

120
14. Compact Linear Fresnel Reflector: Simple. Compact. Durable. Reliable. Access on
17th. October 2010. http://www.ausra.com/technology/
15. Canada S, Cohen G, Cable R, Brosseau D, Price H. Parabolic Trough Organic
Rankine Cycle Power Plant. NREL/CP-550-37077: National Renewable Energy
Laboratory, Golden, CO 80401-3393, January 2005.
16. Srikhirin P, Aphornratana S, Chungpaibulpatana S. A Review of Absorption
Refrigeration Technologies. Renewable and Sustainable Energy Reviews 2001; 5:
343-372.
17. Australia Government: The Treasury, Chapter 5: Mitigation Scenarios -International
results. Access on 17th. October 2010.
http://www.treasury.gov.au/lowpollutionfuture/report/html/05_Chapter5.asp
18. Adams DC. Agriculture and Greenhouse Gas Cap-and-Trade. AAEA Agricultural
& Applied Economics Association. PI3- June 2009. Access on 17th October 2010.
http://www.aaea.org/publications/policy-issues/PI3.pdf
19. Cape and Trade: A New Tax in Energy. Access on 17th October 2010,
http://www.alec.org/AM/Template.cfm?Section=Cap_and_Trade
20. Herrmann U, Kelly B, and Price H. Two-tank Molten Salt Storage for Parabolic
Trough Solar Power Plants. Energy 2004; 29: 883-893.
21. Hassani V, Price H. Modular Trough Power Plants: Proceedings of Solar Forum
2001. Solar Energy: The Power to Choose, Washington, DC, APRIL 21-25, 2001.
22. DC Badran O, Eck M. The Application of Parabolic Trough Technology under
Jordanian Climate. Renewable Energy 2006; 31: 791-802.
23. Eck M, Zarza E. Direct Steam Process with Direct Steam Generating Parabolic
Troughs. Solar Energy 2006; 80: 1424-1433.
24. Cohen GE, Kearney DW, Price HW. Performance History and Future Costs of
Parabolic Trough Solar Electric Systems. Journal of Physics 1999; 9: 169-179.
25. Al-Azri N, Al-Thubaiti M, El-Halwagi MM. An Algorithmic Approach to the
Optimization of Process Cogeneration. Journal of Clean Technology and
Environmental Policy 2009; 11:329-338.

121
26. El-Halwagi MM, Harell D, Spriggs HD. Targeting Cogeneration and Waste
Utilization through Process Integration. Applied Energy 2009; 86: 880-887.
27. Cohen GE, Kearney DW, Price HW. Performance History and Future Costs of
Parabolic Trough Solar Electric Systems, Proceedings of the 9th SolarPACES
International Symposium on Solar Thermal Concentrating Technologies, Font-
Romeu, France, June 22 – 26, 1998; Pr3-169-Pr3-179.
28. Myint L, El-Halwagi MM. Process Analysis and Optimization of Biodiesel
Production from Soybean Oil. Journal of Clean Technology and Environmental
Policy 2009; 11: 263- 276.
29. Ziegler F, Riesch P. Absorption Cycles: A Review with Regard to Energetic
Efficiency. Heat Recovery Systems & CHP 1993; 13: 147-159.
30. Klein SA, Reindl DT. Solar Refrigeration. ASHRAE Journal 2005; 9: S26-S30.
31. Kim DS, Ferreira CAI. Solar Refrigeration Options: A State-of-the-Art Review.
International Journal of Refrigeration 2008; 31: 3-15.
32. Zhai XQ, Wang RZ. A Review of Absorption and Adsorption Solar Cooling
Systems in China. Renewable and Sustainable Energy Reviews 2009; 13:1523-1531.
33. Hwang Y, Radermacher R, Al Alili A, Kubo I. Review of Solar Cooling
Technologies. HVAC&R Research 2008; 14: 507-528.
34. Assilzadeh F, Kalogirou SA, Ali Y, Sopian K. Simulation and Optimization of a
LiBr Solar Absorption Cooling System with Evacuated Tube Collectors. Renewable
Energy 2005; 30: 1143-1159.
35. Masloumi M, Naghashzadegan M, Javaherdeh K. Simulation of Lithium Bromide –
Water Absorption Cooling System with Parabolic Trough Collector. Energy
Conversion and Management 2008; 49: 2820-2832.
36. Vargas JVC, Ordonez JC, Dilay E, Parise JAR. Modeling, Simulation, and
Optimization of a Solar Collector Driven Water Heating and Absorption Cooling
Plant. Solar Energy 2009; 83: 1232-1344.

122
37. Desideri U, Proietti S, Sdringola P. Solar Powered Cooling Systems: Technical and
Economic Analysis and Air-Conditioning Applications. Applied Energy 2009; 86:
1376-1383.
38. Abu Ein SQ, Fayyad SM, Momani W, Al-Bousoul M. Performance Analysis of
Solar Powered Absorption Refrigeration System. Heat Mass Transfer 2009; 46:137-
145.
39. Hovsapian R,Vargas JVC, Ordonez JC, Krothapalli A, Parise JAR, Bernadsen AJC.
Thermodynamic Optimization of a Solar System for Cogeneration of Water Heating
and Absorption Cooling. International Journal of Energy Research 2008; 32: 1210-
1227.
40. Fathi R, Guemimi C, Ouaskit S. An Irreversible Thermodynamic Model for Solar
Absorption Refrigerator. Renewable Energy 2004; 29: 1349-1365.
41. Dhole V, Linnhoff B. Total Site Targets for Fuel, Co-generation, Emissions and
Cooling, Computers and Chemical Engineering 1993; 17: s101-s109.
42. Linnhoff B, Townsend DW, Boland D, Hewitt GF, Thomas BEA, Guy AR.
Marsland RH. A User Guide on Process Integration for the Efficient Use of Efficient
Use of Energy. IChemE: London, UK, 1982.
43. Lecuona A, Ventas M, Venegas A, Salgado R. Optimum Hot Water Temperatura
for Solar Cooling. Solar Energy 2009;83: 1806-1814.
44. Tora EA, Optimal Design and Integration of Solar Systems and Fossil Fuels for
Process Cogeneration. M.S.2008, Texas A&M University, College Station.
45. Gorsek A, Glavi P. Process Integration of a Steam Turbine. Applied Thermal
Engineering 2003; 23: 1227-34.
46. Elder JE, Lonzetta CM, Hall TA, Sornson JD, Klughers PD, Kaminski A, Ebert DA.
Single Reactor for Preparing Acrylic Acid from Propylene Having Improved
Catalyst. US Patent 6384274B1, 2002.
47. Tora EA, El-Halwagi MM. Optimal Design and Integration of Solar Systems and
Fossil Fuels for Sustainable and Stable Power Outlet. Clean Technologies and
Environmental Policy 2009; 4: 401-407.

123
48. Reutemann W, Kieczka H. Formic Acid in Ullmann Encyclopedia of Industrial
Chemistry. Wiley-VCH: Weinheim, 2005.
49. Foster R, Ghassemi M, Cota A. Solar Energy: Renewable Energy and the
Environment. CRC Press; Boca Raton, FL, 2009.
50. Karim K, Bhat SY, Zaheer SI. Catalysts for Low Conversion of Propylene, US
Patent 006143928A, 2000.
51. Elder JE, Lonzetta CM, Hall TA, Sornson JD, Klughers PD, Kaminski A, Ebert DA.
Single Reactor for Preparing Acrylic Acid from Propylene Having Improved
Catalyst. US Patent 6384274B1, 2002.
52. Mark HF, Othmer DF, Overberger CG, Seaborg GT. Encyclopedia of Chemical
Technology. Vol. 1, pp 341. John Wiley & Sons: New York, 1963.
53. Gebreslassie BH. Economic Performance Optimization of an Absorption Cooling
System under Uncertainty. Applied Thermal Engineering 2009; 29: 3491-3500.
54. Stoecker WF. Industrial Refrigeration Handbook. McGraw-Hill: New York, 1998.
55. Herold KE, Radermacher R, Klein SA. Absorption Chillers and Heat Pumps. CRC
Press, Inc: Boca Raton, FL, 1996.
56. Alefeld G, Radermacher R. Energy Conversion System. CRC Press: New York,
1993.
57. Wu S, Eames IW. Innovations in Vapor-Absorption Cycles. Applied Energy 2000;
24:251-166.
58. Al-Sulaiman F, Hamdullahpur F, Dincer I. Tri-generation: A Comprehensive Review
Based on Prime Movers. International Journal of Energy Research 2010; DOI:
10.1002/er.1687.
59. Trigeneration Technologies. Access on October 17th 2010.
http://www.trigeneration.com/
60. Horlock JH. Technical and Economic Impact of Co-generation. Seminar: Steam
Plant Committee of the Power Industries. Mechanical Engineering Publications for
the Institution of Mechanical Engineers: London, 1986.

124
61. Lai SM, Hui CW. Feasibility and Flexibility for a Trigeneration System. Energy
2009; 34: 1693–1704.
62. Buck R, Friedmann S. Solar-assisted Small Solar Tower Trigeneration. Journal of
Solar Energy Engineering 2007; 129: 349-354.
63. Heller P, Pfänder M, Denk T, Tellez F, Valverde A, Fernandez J, Ring A. Test and
Evaluation of a Solar Powered Gas Turbine System. Solar Energy 2006; 80: 1225–
1230.
64. Cohen GE. Solar Electrical Generating Systems for Nevada: Eldorado Solar
Electric Generating System. National Solar Energy Conference: Portland, 2004.
65. El-Halwagi MM. Polution Prevention through Process Integration. Academic Press:
San Deigo,1997.
66. Kearney D. Solar Electric Generating Stations (SEGS). IEEE Power Engineering
Review. 1989; 9(8):4-8.
67. LI B, MA S. Analysis on Prospects of Solar Trough Thermal Power in China,
International Conference on Power Engineering, Hangzhou, China, October 23-27,
2007.
68. Duran MA, Grossmann IE. Simultaneous Optimization and Heat Integration of
Chemical Processes, AIChE Journal 1986; 32: 123-138.
69. Lecuona A, Ventas R, Venegas M, Zacarı A,Salgado R. Optimum Hot Water
Temperature for Absorption Solar Cooling. Solar Energy 2009; 83:1806–1814.

125
VITA
Eman Abdel-Hakim Aly Mohamed Tora was born and raised in Elminia City, Egypt.
She received a Bachelor of Science in chemical engineering from Elminia University in
2000. She worked at the Egyptian National Research Center in 2001 as a research
assistant. She joined the graduate program at the Department of Chemical Engineering in
Cairo University in 2001 and completed her Master of Science degree in July 2005. The
Egyptian Government gave her a scholarship to study for her Ph.D. in the USA. She
joined Texas A&M University in August 2006. Eman completed her Master of Science
degree in August 2008, and completed her Ph.D. in December of 2010. While at Texas
A&M University, she was involved with process systems related to solar energy
integration into industrial processes. Her research addressed integrating and optimizing
solar energy, biofuels, process low quality/waste heat and fossil fuels into industrial
processes to provide power, heat, and cool. She has also participated in other projects
including development of new biofuels pathway, educational modules for Qatar
University, Qatar natural gas thermodynamic database, and new generation of Fischer
Tropsch reactors.
Her permanent contact details are:
Eman Abdel-Hakim Aly Mohamed Tora
Chemical Engineering Department - National Research Center
Cairo- Egypt
011-2-012-690-2346