integration of cytogenetic and genetic linkage … · integration of cytogenetic and genetic...
TRANSCRIPT
Copyright � 2008 by the Genetics Society of AmericaDOI: 10.1534/genetics.108.089532
Integration of Cytogenetic and Genetic Linkage Maps Unveils the PhysicalArchitecture of Tomato Chromosome 2
Dal-Hoe Koo,*,†,1 Sung-Hwan Jo,*,‡,1 Jae-Wook Bang,§ Hye-Mi Park,**Sanghyeob Lee*,†† and Doil Choi*,**,2
*Plant Genome Research Center, Korea Research Institute of Bioscience and Biotechnology, Daejeon, 305-600, Korea, §School ofBioscience and Biotechnology, Chungnam National University, Daejeon 305-764, Korea, **Department of Plant Sciences,
College of Agricultural and Life Sciences, Seoul National University, Seoul, 151-742, Korea, ‡Department ofFunctional Genomics, University of Science and Technology, Daejeon, 305-333, Korea, †Department of
Horticulture, University of Wisconsin, Madison, Wisconsin 53706 and ††Dongbu AdvancedResearch Institute, Dongbu Hitek, Daejeon, 305-708, Korea
Manuscript received March 25, 2008Accepted for publication May 10, 2008
ABSTRACT
We report the integration of the linkage map of tomato chromosome 2 with a high-density bacterialartificial chromosome fluorescence in situ hybridization (BAC–FISH)-based cytogenetic map. The euchro-matic block of chromosome 2 resides between 13 and 142 cM and has a physical length of 48.12 mm, with1 mm equivalent to 540 kb. BAC–FISH resolved a pair of loci that were 3.7–3.9 Mb apart and were notresolved on the linkage map. Most of the regions had crossover densities close to the mean of�200 kb/cM.Relatively hot and cold spots of recombination were unevenly distributed along the chromosome. Thedistribution of centimorgan/micrometer values was similar to the previously reported recombinationnodule distribution along the pachytene chromosome. FISH-based physical maps will play an importantrole in advanced genomics research for tomato, including map-based cloning of agronomically importanttraits and whole-genome sequencing.
ECONOMICALLY, the Solanaceae compose the thirdmost important plant taxon, and consist of .3000
species. Distinctive aspects of development and thevariety of phenotypes and habitats make the Solanaceaegood models for investigation of the genetic bases ofdiversification and adaptation. To this end, the ‘‘In-ternational Solanaceae Genome Project (SOL)’’ waslaunched (Mueller et al. 2005). Tomato is well suited torepresent the Solanaceae because it has a relatively smallgenome and a strong genetics, genomics, and cytoge-netics foundation.
Peterson et al. (1999) provided an overview of theDNA content and physical length of all 24 chromosomearms. Tomato has pericentromeric heterochromatin, asdo other Solanaceae. The synaptonemal complex karyo-type data indicate that 77% of the tomato genome islocated in heterochromatin and 23% in euchromatin(Peterson et al. 1996). The genome size (1C) is �95 pgof DNA (Michaelson et al. 1991), implying 212 Mb ofeuchromatin (Bennett and Smith 1976; http://www.sgn.cornell.edu; tomato sequencing scope and comple-tion criteria).
Excellent morphological and molecular genetic mapsof the tomato genome are available (Rick and Yoder
1988; Tanksleyet al. 1992). For example, .1000 restric-tion fragment length polymorphisms (RFLPs), mutants,and isozymes have been located on a map that totals.1276 cM (Tanksley et al. 1992). In addition, 67 RFLPand 1175 amplified fragment length polymorphism(AFLP) markers were used to construct a RFLP–AFLPmap that totals 1482 cM (Haanstra et al. 1999). To date,2037 markers have been used to create a map that totals1460 cM; this map is available from the SolanaceaeGenome Network (SGN) database (http://www.sgn.cornell.edu; EXPEN 2000 map) and is used for the‘‘SOL’’ project. This linkage map, which represents allthe chromosomes, does not provide sufficient detail tosupport genome sequencing. Because linkage mapdistances are not simply related to physical distances,physical mapping is needed to determine the locationsof markers on chromosomes. For this purpose, bacterialartificial chromosome (BAC) fingerprinting and overgohybridization have been applied. Currently, 3439 con-tigs have been anchored on the EXPEN 2000 map.
As participants in the international SOL consortium,we are responsible for sequencing the euchromaticregion of chromosome 2, the third largest chromosomeof tomato (Sherman and Stack 1992). Critical steps inthis process are identification of the boundaries of theeuchromatin and determination of the physical loca-
1These authors contributed equally to this study.2Corresponding author: Department of Plant Sciences, College of
Agriculture and Life Sciences, Seoul National University, Seoul, 151-742, Korea. E-mail: [email protected]
Genetics 179: 1211–1220 ( July 2008)
tions of markers. Pachytene chromosome analysis in-dicates that the physical size of the euchromatin is 22–26Mb (Peterson et al. 1996; Chang 2004). The charac-teristic morphology of chromosome 2, with its nucleolarorganizing region (NOR) and acrocentric structure,makes it easily distinguishable from the other chromo-somes. Furthermore, the entire euchromatic block islocated on the distal region of the long arm of thechromosome and is clearly separated from the pericen-tromeric heterochromatin. The linkage map of chro-mosome 2 has been well defined using 308 molecularmarkers, and its size is estimated as 143 cM (EXPEN2000 map). A physical map has also been constructedfor chromosome 2 using 75 marker-anchored BAC clones(EXPEN 2000 map). However, neither map providessufficient detail of the physical locations of markers toinitiate genome sequencing. ‘‘Molecular cytogenetics’’can contribute significantly to the genome map by resolv-ing the order of closely linked markers and confirmingthe physical positions of markers on the linkage groups(Anderson et al. 2004; Van Der Knaap et al. 2004; Chang
et al. 2007).Fluorescence in situ hybridization (FISH) is the most
versatile and accurate method for determining theeuchromatic–heterochromatic boundaries, the locationsof chromosome-specific BAC clones, and the locations ofrepetitive and single-copy DNA sequences (Fransz et al.2000; Cheng et al. 2001a,b; Wang et al. 2006). Here, wereport the cytological and physical structure of tomatochromosome 2 in relation to the linkage map, usingBAC–FISH mapping.
MATERIALS AND METHODS
Plant material: Tomato (Lycopersicon esculentum cv. Micro-Tom) plants were grown in a controlled-environment room at26� 6 1� under 16 hr light/8 hr dark.
BAC probe preparations: All BAC clones used for BAC–FISH were kindly provided by S. Tanksley and J. Giovannoni atCornell University, Ithaca, New York. Tomato BAC probes werelabeled with digoxigenin-11-dUTP or biotin-16-dUTP by nicktranslation according to the protocols provided by the manu-facturer of the labeling kits (Roche, Basel, Switzerland). TheArabidopsis pAtT4 clone (Richards and Ausubel 1988) andthe wheat pTa71 clone containing a 9.1-kb fragment of 45SrDNA (Gerlach and Bedrock 1979) were used to detecttelomeric and rDNA regions, respectively.
Chromosome preparation: Pollen mother cells (PMCs)were separated using the method of Fransz et al. (2000) withsome modification. Immature flower buds were fixed inethanol:acetic acid (3:1) for 2 hr and stored at 4�. These wererinsed in distilled water and incubated in an enzyme mix(0.3% pectolyase, 0.3% cytohelicase, and 0.3% cellulase) incitrate buffer (10 mm sodium citrate, pH 4.5) for 2 hr. Eachbud was softened in 60% acetic acid on an uncoated, ethanol-cleaned microscopic slide kept at 45� on a hot plate. Thecontents were smeared on the slide, fixed with ice-coldethanol:acetic acid (3:1), and dried.
FISH: The FISH procedure was previously reported by Koo
et al. (2004). In brief, chromosomal DNA on the slides was
denatured with 70% formamide at 70� for 2.5 min, followed bydehydration in a 70, 85, 95, and 100% ethanol series at �20�for 3 min each. The probe mixture containing 50% formam-ide (v/v), 10% dextran sulfate (w/v), 5 ng/ml salmon spermDNA, and 50 ng/ml labeled probe DNA was heated at 90� for10 min and then kept on ice for 5 min. A 20-ml aliquot of thismixture was applied to the denatured chromosomal DNA andcovered with a glass coverslip. The slides were then placed in ahumid chamber at 37� for 18 hr. Probes were detected withavidin–FITC and anti-digoxigenin Cy3 (Roche). Chromo-somes were counterstained with 1 mg/ml 49,6-diamidino-2-phenylindole (DAPI) (Sigma, St. Louis). The signals weredetected using a cooled CCD camera (CoolSNAP; Photo-metrics, Tokyo). The images were obtained with a Leica epi-fluorescence microscope equipped with FITC–DAPI two-wayor FITC–rhodamine–DAPI three-way filter sets (Leica, Tokyo)and were processed with Meta Imaging Series TM 4.6 software.The final printed images were prepared using Photoshop 7.0(Adobe, San Jose, CA).
Fiber-FISH: Leaf nuclei were prepared as described byJackson et al. (1998). A suspension of nuclei was deposited atone end of a poly-l-lysine-coated slide (Sigma) and air driedfor 10 min. STE lysis buffer (8 ml) was added, and the slide wasincubated at room temperature for 4 min. A clean coverslipwas used to slowly drag the contents along the slide. Thepreparation was air dried, fixed in ethanol:glacial acetic acid(3:1) for 2 min, and baked at 60� for 30 min. The DNA fiberpreparation was incubated with a probe mixture, covered witha 22 3 40-mm coverslip, and sealed with rubber cement. Theslide was placed in direct contact with a heated surface in anoven at 80� for 3 min, transferred to a wet chamber that hadbeen prewarmed at 80� for 2 min, and then transferred to37� for overnight incubation. The posthybridization washingstringency was the same as in FISH of chromosome spreads.Signal detection was performed according to Koo et al. (2004).
Chromosome identification and measurement: The imagesof 20 DAPI-stained pachytene bivalents at approximately thesame stage were captured from different PMCs to study thedistributions of heterochromatin, positions of FISH signals,and lengths of pachytene chromosomes. The images weremeasured directly on the screen using the FISH Image System(Meta Imaging Series TM 4.6).
RESULTS
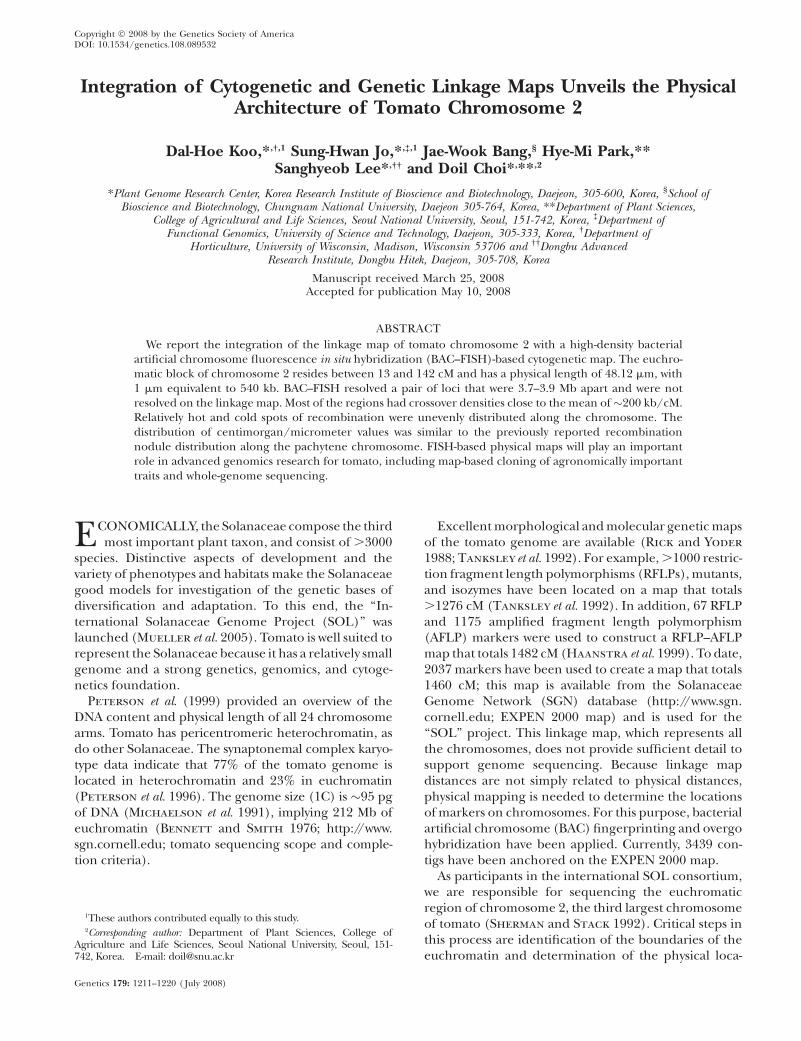
Cytological architecture of chromosome 2: Thepachytene chromosome 2 of tomato is easily distin-guished from the other chromosomes because it isacrocentric and bears a large secondary structure, theNOR, on the short arm (Peterson et al. 1996). TheDAPI staining of the pachytene chromosome demon-strated striking differences between the euchromatinand the heterochromatin. Brightly fluorescing hetero-chromatic regions were detected next to the centro-mere of the long arm and over the entire short arm(Figure 1A). Weakly fluorescing euchromatin was ob-served on the long arm (Figure 1A). Chromosome 2 atmeiotic prophase I was a fully paired bivalent with amean length of 70.22 mm, based on 20 independentmeasurements. The lengths of the euchromatic andheterochromatic regions (including the NOR) were48.12 6 3.17 and 22.1 6 1.23 mm, respectively. Previousstudies estimated the size of the euchromatic region of
1212 D.-H. Koo et al.
chromosome 2 as 22–26 Mb (Sherman and Stack 1992;Peterson et al. 1996; Chang 2004). We used the largestsize estimation (26 Mb), following guidelines of theInternational Tomato Genome Sequencing Project.Thus, we considered the euchromatin of the pachytenechromosome to have an average of 540 kb/mm.
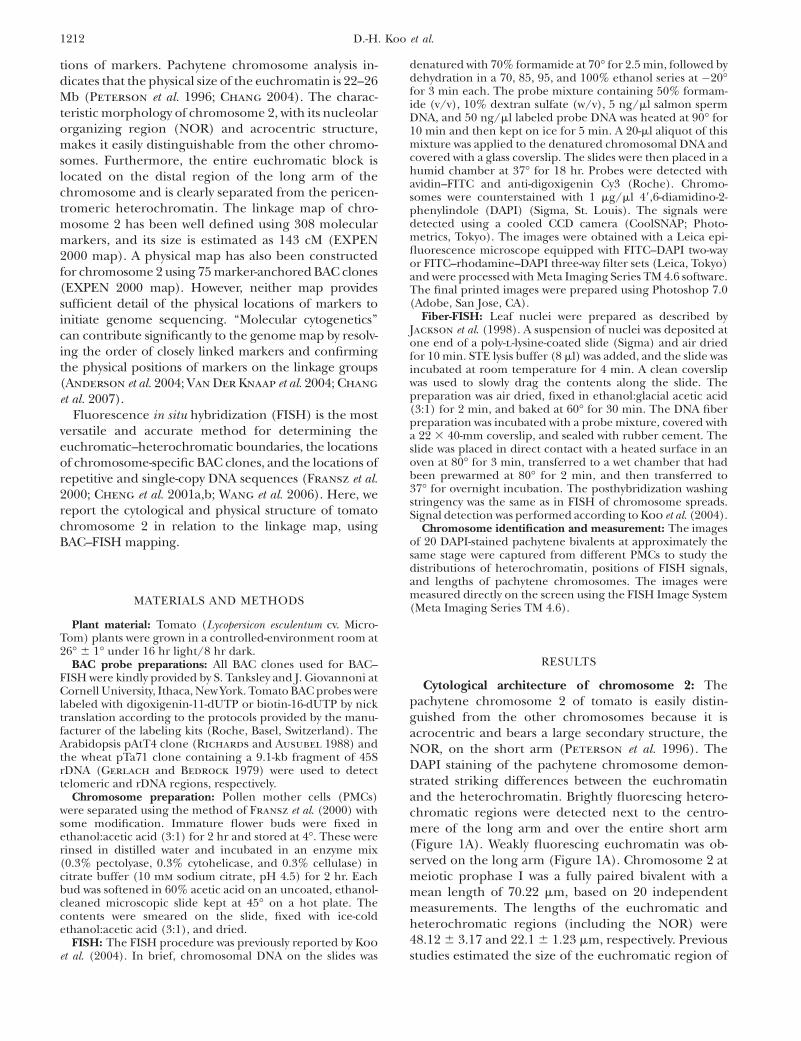
Determination of the euchromatin borders: SeveralBAC probes anchored at each end of linkage group 2were hybridized to pachytene bivalents, and the physicallocations of the BAC–FISH signals were examined. Themarker cLER-1-H17 was mapped onto 0.0 cM, which isthe north end of linkage group 2. The FISH signal forthe BAC clone LE_HBa0007F24 anchored by cLER-1-H17 was detected on the distal end of the short arm ofchromosome 2 where it covered the NOR (Figure 2A),and minor signals were also detected on the pericen-tromeric regions of some pachytene chromosomes(data not shown). The other BAC clones anchored tomolecular markers located between 0 and 12 cM gavemultiple FISH signals in the pericentromeric hetero-chromatic regions of all chromosomes (data not
shown). The BAC–FISH signal of the T1238 (13 cM)-anchored LE_HBa0303I24 BAC was seen only near theboundary of the euchromatin and pericentromericheterochromatin. This was located at 3.5 6 1.3 mmfrom the pericentromeric heterochromatic region ofthe long arm (Figure 1B). The south end of the eu-chromatin was verified by the T1554 (142 cM)-anchoredBAC clone LE_HBa0177F12. The FISH signal forLE_HBa0177F12 was detected at the distal end of thelong arm of the pachytene chromosome 2 (Figure 1B).Sequencing revealed that SL_MboI0006E22, containingtelomere-specific repeated sequences, is located 100 kbfrom LE-HBa0177F12 (Figure 2, B–D). The biotin-labeled SL_MboI0006E02 (green) was detected at thedistal ends of several pachytene chromosomes, includ-ing chromosome 2 (Figure 2B). The digoxigenin-labeled Arabidopsis telomere-specific probe (pAtT4,red) was colocalized with green signals generated fromSL_MboI0006E02 (Figure 2C). These data taken to-gether identified the euchromatin between 13 and 142cM as suitable for our study.
Figure 1.—Cytological architecture of tomatochromosome 2. (A) DAPI-stained pachytenechromosome 2. (B) FISH pattern on pachytenechromosome 2 using probes for both digoxigenin-labeled BAC clone LE_HBa0303I24 and biotin-labeled BAC clone LE_HBa0177F12. DAPI-stainedchromosomes and FISH signals were convertedto a black-and-white image to enhance the visual-ization of distribution of euchromatin and het-erochromatin on the pachytene chromosome.NOR, nucleolar organizing region; CEN, centro-mere; PH, pericentromeric heterochromatin;TEL, telomere; EU, euchromatin; HETERO, het-erochromatin. Bar, 10 mm.
Figure 2.—Physical coverage of thegenetic linkage map of tomato chromo-some 2. (A) The FISH signal from theBAC clone located at the 0-cM positionwas detected on the nucleolar organizingregion (NOR). Digoxigenin-labeled LE_HBa0007F24 (red) anchored by cLEC-7-P21 (0 cM) was observed at the distalends of the short arm, which is markedby a 45S rDNA locus. (B) Pachytene chro-mosomes of tomato were hybridized withbiotin-labeled SL_MboI0006E22 (green).Arrowheads indicate pachytene chromo-some 2. (C) The pachytene chromosomesin B were hybridized with digoxigenin-labeled Arabidopsis pAtT4 containingthe telomere-specific sequence. (D)Sequencing results indicate that thetelomere-specific repeat sequence con-taining SL_Mbo0006E22 is 100 kb awayfrom LE_HBa0032J10. Bar, 10 mm.
Physical Architecture of Tomato Chromosome 2 1213
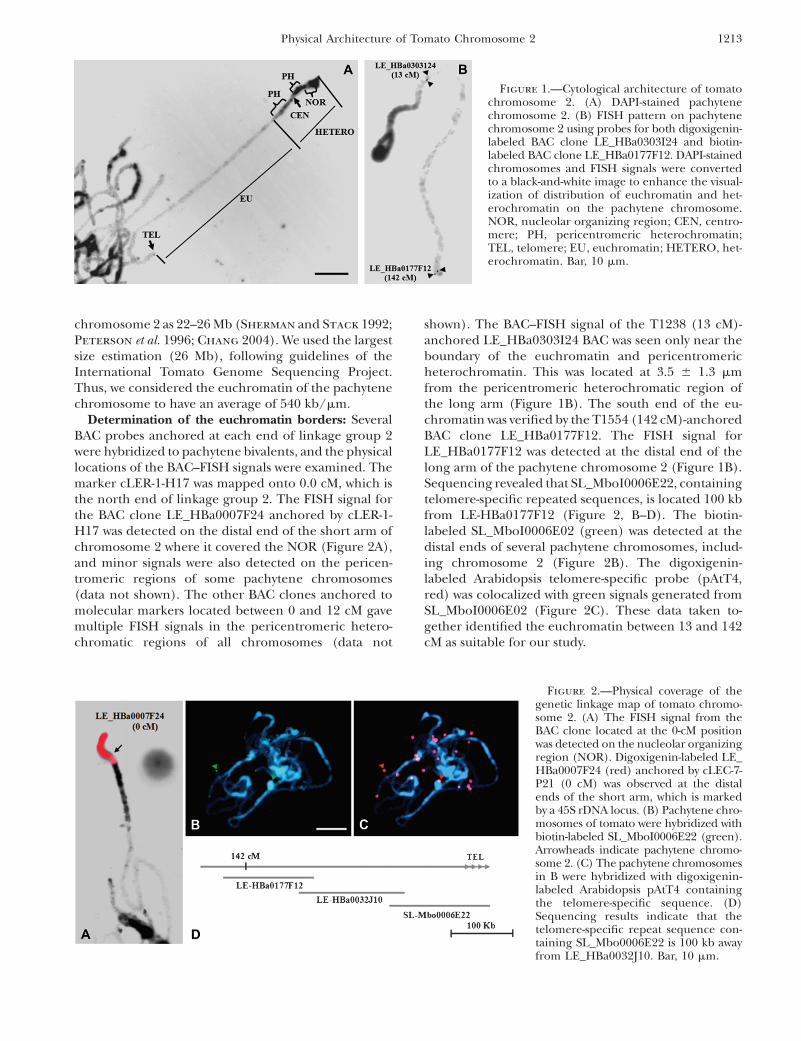
Integration of the cytogenetic and linkage maps: Toconstruct an integrated high-density cytogenetic map ofchromosome 2, we selected 28 BAC clones anchored tomolecular markers that were dispersed along the entirelinkage group 2 (Table 1). These BAC-derived probesyielded strong FISH signals in pachytene chromosome 2and clearly demonstrated the corresponding positionand order of the selected BAC clones (Figure 3, A1–A4).The order of the selected marker-anchored BAC cloneswas the same as in the linkage map, except for aninversion of the markers located at 66 and 70 cM (Reddotted circles in Figure 3, A2). In addition to theidentification of this inversion, the BAC–FISH mapsometimes resolved loci that were not resolved on thelinkage map. For example, T1555 and T1535 resided atthe same position in the linkage map, but, in the BAC–FISH map, the signals anchored to the two markers werevisibly separated (pink dotted circles in Figure 3, A3).
Physical gaps in linkage map 2: The initial selectionof marker-anchored BAC clones suggested four gaps(i.e., the absence of molecular marker-anchored BACregions) that were $10 cM long: 18–28 cM, 46–66 cM,96–106 cM, and 112–130 cM. However, the BAC–FISHanalysis demonstrated that the gap that occurred
between 46 and 70 cM (note the inversion of loci at 66and 70 cM) was the only real physical gap (blue dottedcircle in Figure 3, A2). The distance between the twoFISH signals observed from LE_HBa0072A04 (46 cM)and LE_HBa0329G05 (70 cM) was 7.28 mm (data notshown), implying a physical distance of �3.93 Mb (i.e.,7.28 mm 3 540 kb/mm). On the basis that 1 cM ¼ 185kb, the 20-cM interval is estimated to be 3.70 Mb. Thus,the two calculations gave similar physical distances forthe large gap on chromosome 2.
Estimation of the base pair/centimorgan relation-ship: Molecular marker-anchored BAC–FISH mappingwas used to determine the relationship between basepairs and centimorgans (Cheng et al. 2002; Chang et al.2007). We used five BAC-derived probes for the globaldetermination of the base pair/centimorgan relation-ship. The five BAC–FISH signals were detected andeasily separated into four physical blocks, G1, G2, G3,and G4 (Figure 3, A), according to genetic distances of33, 27, 33, and 36 cM, respectively. The physical portionsof these four blocks composed 24% (G1, 5.8 Mb), 20.9%(G2, 5.1 Mb), 35.3% (G3, 8.5 Mb), and 19.6% (G4, 4.7Mb) of the entire euchromatic portion of chromosome2. The base pair/centimorgan relationships calculatedfrom these observations were 176 kb/cM (G1), 189 kb/cM (G2), 258 kb/cM (G3), and 131 kb/cM (G4).
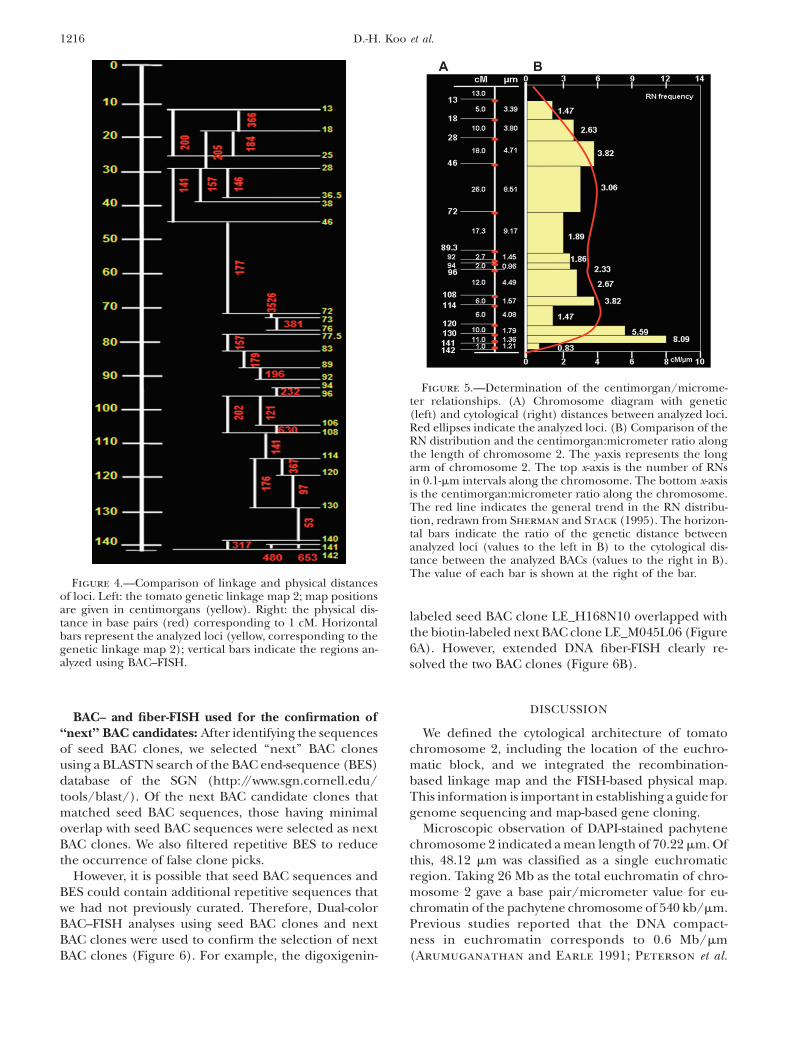
In addition to these rather global measurements ofthe base pair/centimorgan relationship, we measuredmore local base pair/centimorgan relationships using28 BAC clones covering the entire chromosome 2(Table 2). For most of chromosome 2, the base pair/centimorgan relationship was ,200 kb/cM (Figure 4).Some hot spots were detected between 120 and 140 cM,and some cold spots between 72 and 73 cM (Figure 4).Both ends of the euchromatin block have less recombi-nation than the rest of chromosome 2 (Figure 4).
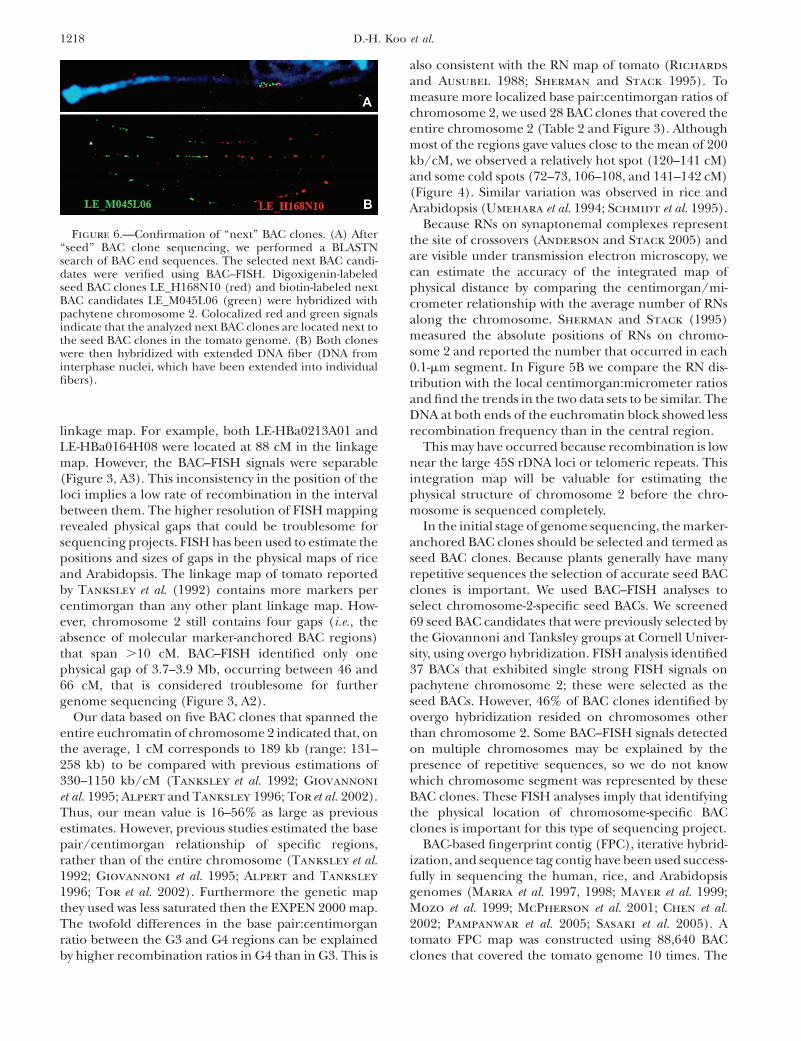
Recombination nodules (RNs) represent real cross-overs in the genome and are available for tomato(Sherman and Stack 1995). Therefore, we comparedthe centimorgan/micrometer relationship with the aver-age number of RNs along chromosome 2. The calculatedcentimorgan:micrometer ratio trends are similar to theRN distribution redrawn from Sherman and Stack
(1995) (Figure 5B).BAC–FISH-identified chromosome 2-specific BAC
clones: Because plant genomes contain many repetitiveand redundant sequences, the first task in sequencingthe entire euchromatic region of chromosome 2 is theselection of chromosome 2-specific anchored BACclones. Thus, we first selected all BAC clones anchoredto molecular markers located between 13 and 142 cM inlinkage group 2. In total, 69 BAC clones were selectedfrom the SGN database (http://www.sgn.cornell.edu).BAC–FISH analyses of these BAC clones demonstratedseveral different types of hybridization patterns (Table3): a single FISH signal was located on pachytenechromosome 2 for 37 BACs; multiple FISH signals were
TABLE 1
List of BAC clones used to integrate the geneticand cytogenetic maps
Position in linkagegroup 2 BAC
13 LE_HBa0303I2418 LE_HBa0025N1528 LE_HBa0025A2237 LE_HBa0155C0438 LE_HBa0160F0546 LE_HBa0072A0466 LE_HBa0059M1770 SL_MboI0019I0172 LE_HBa0167J2174.5 LE_HBa0320D0477.5 LE_HBa0291P1982 LE_HBa0013N1883.5 LE_HBa0009K0688 LE_HBa0164H0888 LE_HBa0213A0189.3 LE_HBa0134G0992 LE_HBa0016A1294 LE_HBa0011A0296 SL_MboI0014P22106 LE_HBa0172G12108 LE_HBa0046M08110.9 LE_HBa0150M11112 LE_HBa0111M10120 LE_HBa0073P13130 LE_HBa0155D20140 LE_HBa0064B17141 LE_HBa0194L19142 LE_HBa0177F12
1214 D.-H. Koo et al.

located on the pericentromeric heterochromatin re-gions of the pachytene chromosomes, including chro-mosome 2, for three BACs; no FISH signal was locatedon pachytene chromosome 2, but was located on otherchromosomes for one BAC; and no FISH signal wasobserved on any chromosome for 28 BACs. BAC–FISH
identified 37 BAC clones that could be used as ‘‘seed’’BACs for sequencing. This analysis also indicated thatone BAC clone (LE_HBa0258N07) that was previouslyassigned to chromosome 2 by overgo hybridization actu-ally occurs on other chromosomes, but not on chromo-some 2 (data not shown).
Figure 3.—Integration of cytogenetic and genetic maps. (A) Pachytene chromosome hybridized using five biotin- or digoxi-genin-labeled BAC clones (LE_HBa0303I24, 13 cM; LE_HBa0072A04, 46 cM; LE-HBa0204D01, 74.5 cM; LE_HBa0172G12, 106cM; LE_HBa0177F12, 142 cM). G1–G4 represent designated genetic distance blocks of 33, 27, 33, and 36 cM, respectively. (A1–A4)Twenty-eight BAC clones hybridized to pachytene chromosome 2. The green and red dots on each line indicate BAC–FISH resultsfrom the left and the right, respectively; the distance is not proportional to the actual distance. The blue dotted circle indicates thephysical gap. The red dotted circle indicates the reversed order of loci between the genetic and the cytogenetic maps. The pinkdotted circle indicates two separate loci that were colocalized in the genetic map.
TABLE 2
Comparison of cytogenetic and genetic distances between loci
BAC clones (position in genetic map)Mean
distance 6 SD (mm)Linkage
distance (cM) kb/cM cM/mmNo. of
measurements
LE_HBa0303I24(13)–LE_HBa025N15 (18) 3.39 6 2.06 5 366 1.5 3LE_HBa0303I24(13)–LE_HBa0209K17 (25) 4.46 6 0.48 12 200 2.7 3LE_HBa025N15(18)–LE_HBa0209K17(25) 2.38 6 0.49 7 184 2.9 6LE_HBa025N15(18)–LE_HBa0025A22 (28) 3.8 10 205 2.6 1LE_HBa0025A22(28)–LE_HBa0155C04 (36.5) 2.31 8.5 146 3.7 1LE_HBa0025A22(28)–LE_HBa0160F05 (38) 2.91 10 157 3.4 1LE_HBa0025A22(28)–LE_HBa0072A04 (46) 4.71 18 141 3.8 1LE_HBa0066C13(46)–LE_HBa0167J21 (72) 8.51 6 1.16 26 177 3.1 6LE_HBa0167J21(72)–LE_HBa0204D01 (73) 6.53 6 5.5 1 3,526 0.1 3SL_MboI0108P14(72)–LE_HBa0204D01 (73) 21.86 6 0.44 1 11,806 0.0 5LE_HBa0204D01(73)–LE_HBa0198A03 (76) 2.11 6 0.2 3 381 1.4 3LE_HBa0291P19(77.5)–LE_HBa0060J03 (83) 1.6 6 0.35 5.5 157 3.4 14LE_HBa0060J03(83)–LE_HBa0164H08 (89) 1.99 6 0.27 6 179 3.0 6LE_HBa0164H08(89)–LE_HBa0016A12 (92) 1.09 6 0.31 3 196 2.8 3LE_HBa0011A02(94)–SL_MboI1014P22 (96) 0.86 6 0.16 2 232 2.3 3SL_MboI1014P22(96)–LE_HBa0172G12 (106) 2.25 6 0.52 10 121 4.4 15
Physical Architecture of Tomato Chromosome 2 1215
BAC– and fiber-FISH used for the confirmation of‘‘next’’ BAC candidates: After identifying the sequencesof seed BAC clones, we selected ‘‘next’’ BAC clonesusing a BLASTN search of the BAC end-sequence (BES)database of the SGN (http://www.sgn.cornell.edu/tools/blast/). Of the next BAC candidate clones thatmatched seed BAC sequences, those having minimaloverlap with seed BAC sequences were selected as nextBAC clones. We also filtered repetitive BES to reducethe occurrence of false clone picks.
However, it is possible that seed BAC sequences andBES could contain additional repetitive sequences thatwe had not previously curated. Therefore, Dual-colorBAC–FISH analyses using seed BAC clones and nextBAC clones were used to confirm the selection of nextBAC clones (Figure 6). For example, the digoxigenin-
labeled seed BAC clone LE_H168N10 overlapped withthe biotin-labeled next BAC clone LE_M045L06 (Figure6A). However, extended DNA fiber-FISH clearly re-solved the two BAC clones (Figure 6B).
DISCUSSION
We defined the cytological architecture of tomatochromosome 2, including the location of the euchro-matic block, and we integrated the recombination-based linkage map and the FISH-based physical map.This information is important in establishing a guide forgenome sequencing and map-based gene cloning.
Microscopic observation of DAPI-stained pachytenechromosome 2 indicated a mean length of 70.22 mm. Ofthis, 48.12 mm was classified as a single euchromaticregion. Taking 26 Mb as the total euchromatin of chro-mosome 2 gave a base pair/micrometer value for eu-chromatin of the pachytene chromosome of 540 kb/mm.Previous studies reported that the DNA compact-ness in euchromatin corresponds to 0.6 Mb/mm(Arumuganathan and Earle 1991; Peterson et al.
Figure 4.—Comparison of linkage and physical distancesof loci. Left: the tomato genetic linkage map 2; map positionsare given in centimorgans (yellow). Right: the physical dis-tance in base pairs (red) corresponding to 1 cM. Horizontalbars represent the analyzed loci (yellow, corresponding to thegenetic linkage map 2); vertical bars indicate the regions an-alyzed using BAC–FISH.
Figure 5.—Determination of the centimorgan/microme-ter relationships. (A) Chromosome diagram with genetic(left) and cytological (right) distances between analyzed loci.Red ellipses indicate the analyzed loci. (B) Comparison of theRN distribution and the centimorgan:micrometer ratio alongthe length of chromosome 2. The y-axis represents the longarm of chromosome 2. The top x-axis is the number of RNsin 0.1-mm intervals along the chromosome. The bottom x-axisis the centimorgan:micrometer ratio along the chromosome.The red line indicates the general trend in the RN distribu-tion, redrawn from Sherman and Stack (1995). The horizon-tal bars indicate the ratio of the genetic distance betweenanalyzed loci (values to the left in B) to the cytological dis-tance between the analyzed BACs (values to the right in B).The value of each bar is shown at the right of the bar.
1216 D.-H. Koo et al.

1996; Budiman et al. 2004). Thus, although differentchromosomes and independent chromosome-spreadingtechniques were used, similar DNA compactness wasdetermined, indicating that the mean base pair/micro-meter relationship of euchromatin of the tomato pachy-tene is 0.5–0.6 Mb/mm.
To assess whether molecular marker loci existed forthe distal ends of the chromosome arms, BAC probescorresponding to the ends of linkage group arms werehybridized to pachytene bivalents, and the physicallocations of the FISH signals were examined. Most ofthe BACs derived from markers located between 0.0 and12 cM showed multiple FISH signals in the pericentro-meric heterochromatic region of all chromosomes,including the NOR or the pericentromeric heterochro-matin of chromosome 2, except for one BAC (LE-HBa0155E05, 2 cM), which showed a single FISH signalin the heterochromatic region of the short arm ofchromosome 2 (data not shown). Both FISH and DAPIdata indicate that this segment may be composed ofclusters of repetitive sequences. This result forced us toignore this segment of the euchromatic region whenselecting BAC clones for further sequencing projects.Thus, we used the euchromatic block between 13 and142 cM for this project.
Comparing the linkage map EXPEN 2000 with ourBAC–FISH map revealed an inversion in chromosome 2(Figure 3, A2). This inconsistency in the position of theloci may have been caused by variation among thestrains examined. Such apparent inversions have beenreported in maize and tomato (Peterson et al. 1999).The order of the loci on the genetic and cytologicalmaps was generally the same, as expected.
BAC–FISH maps sometimes allowed us to resolve thelocations of markers that were not resolved on the
TABLE 3
BAC clones used for the selection of ‘‘seed’’ BAC clones
Marker
Positionin linkagegroup 2 BAC
Hybridizationpatterna
T1238 13 LE_HBa0303I24 1T0888 13 LE_HBa0306D07 4CT140 16 LE_HBa0163K16 1T1706 18 LE_HBa0025N15 1T0869 21 LE_HBa0280E02 1SSR40 22 LE_HBa0107I05 4SSR66 25 LE_HBa0209K17 1cLED-19-B18 28 LE_HBa0025A22 1T1768 31 LE_HBa0282E10 4T1698 34 LE_HBa0320M09 1T1361 34 LE_HBa0052L14 4SSR96 36.5 LE_HBa0155H19 2SSR104 37 LE_HBa0155C04 1T1668 37 LE_HBa0168N10 1T0683 38 LE_HBa0160F05 1T1516 42 LE_HBa0060P24 2T1516 42 LE_HBa0123G24 4cLEC-27-M9 46 LE_HBa0066C13 1T1654 46 LE_HBa0134A15 1TG451 46 LE_HBa0168N18 4cLPT1E8 47 LE_HBa0002C08 4TG139 57 LE_HBa0139G01 4T0266 66 LE_HBa0059M17 1T1532 69 LE_HBa0273J19 1T1438 70 LE_HBa0329G05 1T1625 72.5 LE_HBa0323A14 1TG154 72.5 LE_HBa0118P10 4TM34 73 LE_HBa0204D01 1TG131 73.4 LE_HBa0147E11 4T1537 74.5 LE_HBa0320D04 1T0702 76 LE_HBa0198A03 1T0086 76 LE_HBa0105H04 4SSR26 77.5 LE_HBa0291P19 1TM20 78 LE_HBa0236H12 2TM20 78 LE_HBa0221D04 4cLET1A5 79 LE_HBa0238L13 4TG373 79.5 LE_HBa0011A02 4T0759 82 LE_HBa0060J03 1T1671 82 LE_HBa0010B01 1CT229 82.5 LE_HBa0121J22 4TG583 83.2 LE_HBa0023K06 4C2_At4g38630 83.5 LE_HBa0009K06 4T1535 88 LE_HBa0164H08 1T1555 88 LE_HBa0213A01 1TG48 92 LE_HBa0016A12 1TG373 94 LE_HBa0011A02 1cLED-19B24 100 SL_EcoRI0010H16 4T1480 106 LE_HBa0172G12 1d 107 SL_EcoRI0092M23 1P61 108 LE_HBa0046M08 1cLEC-7-L24 108 LE_HBa0124N09 4T1158 108 LE_HBa0167P17 4T1158 109 LE_HBa0150M11 4TG34 111 LE_HBa0046M08 4cTOB-9-L18 112 LE_HBa0111M10 1cLPT-1-A21 114 LE_HBa0210D10 1
(continued )
TABLE 3
(Continued)
Marker
Positionin linkagegroup 2 BAC
Hybridizationpatterna
T1744 117 LE_HBa0208N01 4TG167 118 LE_HBa0266G08 4T1400 119 LE_HBa0194N24 4U153274 120 LE_HBa0073P13 1T0706 128 LE_HBa0080H21 4T0634 130 LE_HBa0155D20 1CT24 140 LE_HBa0064B17 1T1096 141 LE_HBa0194L19 1T1202 142 LE_HBa0257H21 1T1554 142 LE_HBa0177F12 1T1566 142 LE_HBa0258N07 3cLEF-2-A11 142 LE_HBa0219K15 4SSR50 143 LE_HBa0256J01 4
a 1, hybridized only on pachytene chromosome 2; 2, hybrid-ized on multiple chromosomes; 3, hybridized on chromo-somes other than chromosome 2; 4, no hybridization.
Physical Architecture of Tomato Chromosome 2 1217
linkage map. For example, both LE-HBa0213A01 andLE-HBa0164H08 were located at 88 cM in the linkagemap. However, the BAC–FISH signals were separable(Figure 3, A3). This inconsistency in the position of theloci implies a low rate of recombination in the intervalbetween them. The higher resolution of FISH mappingrevealed physical gaps that could be troublesome forsequencing projects. FISH has been used to estimate thepositions and sizes of gaps in the physical maps of riceand Arabidopsis. The linkage map of tomato reportedby Tanksley et al. (1992) contains more markers percentimorgan than any other plant linkage map. How-ever, chromosome 2 still contains four gaps (i.e., theabsence of molecular marker-anchored BAC regions)that span .10 cM. BAC–FISH identified only onephysical gap of 3.7–3.9 Mb, occurring between 46 and66 cM, that is considered troublesome for furthergenome sequencing (Figure 3, A2).
Our data based on five BAC clones that spanned theentire euchromatin of chromosome 2 indicated that, onthe average, 1 cM corresponds to 189 kb (range: 131–258 kb) to be compared with previous estimations of330–1150 kb/cM (Tanksley et al. 1992; Giovannoni
et al. 1995; Alpert and Tanksley 1996; Tor et al. 2002).Thus, our mean value is 16–56% as large as previousestimates. However, previous studies estimated the basepair/centimorgan relationship of specific regions,rather than of the entire chromosome (Tanksley et al.1992; Giovannoni et al. 1995; Alpert and Tanksley
1996; Tor et al. 2002). Furthermore the genetic mapthey used was less saturated then the EXPEN 2000 map.The twofold differences in the base pair:centimorganratio between the G3 and G4 regions can be explainedby higher recombination ratios in G4 than in G3. This is
also consistent with the RN map of tomato (Richards
and Ausubel 1988; Sherman and Stack 1995). Tomeasure more localized base pair:centimorgan ratios ofchromosome 2, we used 28 BAC clones that covered theentire chromosome 2 (Table 2 and Figure 3). Althoughmost of the regions gave values close to the mean of 200kb/cM, we observed a relatively hot spot (120–141 cM)and some cold spots (72–73, 106–108, and 141–142 cM)(Figure 4). Similar variation was observed in rice andArabidopsis (Umehara et al. 1994; Schmidt et al. 1995).
Because RNs on synaptonemal complexes representthe site of crossovers (Anderson and Stack 2005) andare visible under transmission electron microscopy, wecan estimate the accuracy of the integrated map ofphysical distance by comparing the centimorgan/mi-crometer relationship with the average number of RNsalong the chromosome. Sherman and Stack (1995)measured the absolute positions of RNs on chromo-some 2 and reported the number that occurred in each0.1-mm segment. In Figure 5B we compare the RN dis-tribution with the local centimorgan:micrometer ratiosand find the trends in the two data sets to be similar. TheDNA at both ends of the euchromatin block showed lessrecombination frequency than in the central region.
This may have occurred because recombination is lownear the large 45S rDNA loci or telomeric repeats. Thisintegration map will be valuable for estimating thephysical structure of chromosome 2 before the chro-mosome is sequenced completely.
In the initial stage of genome sequencing, the marker-anchored BAC clones should be selected and termed asseed BAC clones. Because plants generally have manyrepetitive sequences the selection of accurate seed BACclones is important. We used BAC–FISH analyses toselect chromosome-2-specific seed BACs. We screened69 seed BAC candidates that were previously selected bythe Giovannoni and Tanksley groups at Cornell Univer-sity, using overgo hybridization. FISH analysis identified37 BACs that exhibited single strong FISH signals onpachytene chromosome 2; these were selected as theseed BACs. However, 46% of BAC clones identified byovergo hybridization resided on chromosomes otherthan chromosome 2. Some BAC–FISH signals detectedon multiple chromosomes may be explained by thepresence of repetitive sequences, so we do not knowwhich chromosome segment was represented by theseBAC clones. These FISH analyses imply that identifyingthe physical location of chromosome-specific BACclones is important for this type of sequencing project.
BAC-based fingerprint contig (FPC), iterative hybrid-ization, and sequence tag contig have been used success-fully in sequencing the human, rice, and Arabidopsisgenomes (Marra et al. 1997, 1998; Mayer et al. 1999;Mozo et al. 1999; McPherson et al. 2001; Chen et al.2002; Pampanwar et al. 2005; Sasaki et al. 2005). Atomato FPC map was constructed using 88,640 BACclones that covered the tomato genome 10 times. The
Figure 6.—Confirmation of ‘‘next’’ BAC clones. (A) After‘‘seed’’ BAC clone sequencing, we performed a BLASTNsearch of BAC end sequences. The selected next BAC candi-dates were verified using BAC–FISH. Digoxigenin-labeledseed BAC clones LE_H168N10 (red) and biotin-labeled nextBAC candidates LE_M045L06 (green) were hybridized withpachytene chromosome 2. Colocalized red and green signalsindicate that the analyzed next BAC clones are located next tothe seed BAC clones in the tomato genome. (B) Both cloneswere then hybridized with extended DNA fiber (DNA frominterphase nuclei, which have been extended into individualfibers).
1218 D.-H. Koo et al.
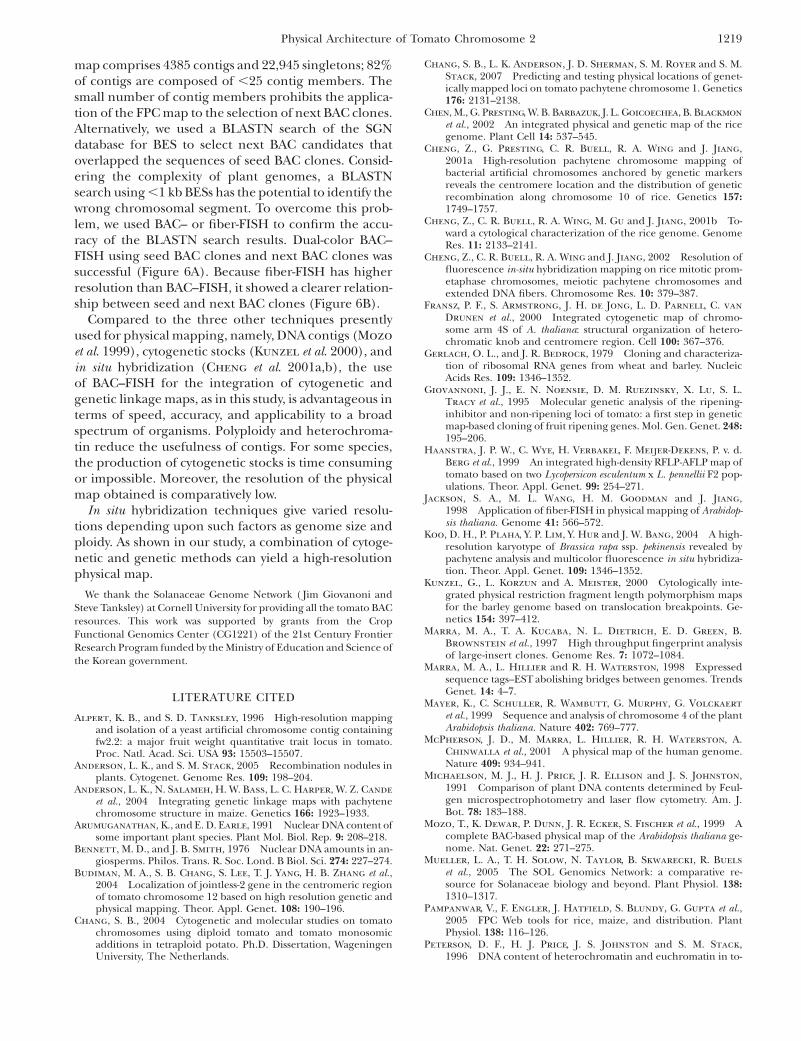
map comprises 4385 contigs and 22,945 singletons; 82%of contigs are composed of ,25 contig members. Thesmall number of contig members prohibits the applica-tion of the FPC map to the selection of next BAC clones.Alternatively, we used a BLASTN search of the SGNdatabase for BES to select next BAC candidates thatoverlapped the sequences of seed BAC clones. Consid-ering the complexity of plant genomes, a BLASTNsearch using ,1 kb BESs has the potential to identify thewrong chromosomal segment. To overcome this prob-lem, we used BAC– or fiber-FISH to confirm the accu-racy of the BLASTN search results. Dual-color BAC–FISH using seed BAC clones and next BAC clones wassuccessful (Figure 6A). Because fiber-FISH has higherresolution than BAC–FISH, it showed a clearer relation-ship between seed and next BAC clones (Figure 6B).
Compared to the three other techniques presentlyused for physical mapping, namely, DNA contigs (Mozo
et al. 1999), cytogenetic stocks (Kunzel et al. 2000), andin situ hybridization (Cheng et al. 2001a,b), the useof BAC–FISH for the integration of cytogenetic andgenetic linkage maps, as in this study, is advantageous interms of speed, accuracy, and applicability to a broadspectrum of organisms. Polyploidy and heterochroma-tin reduce the usefulness of contigs. For some species,the production of cytogenetic stocks is time consumingor impossible. Moreover, the resolution of the physicalmap obtained is comparatively low.
In situ hybridization techniques give varied resolu-tions depending upon such factors as genome size andploidy. As shown in our study, a combination of cytoge-netic and genetic methods can yield a high-resolutionphysical map.
We thank the Solanaceae Genome Network ( Jim Giovanoni andSteve Tanksley) at Cornell University for providing all the tomato BACresources. This work was supported by grants from the CropFunctional Genomics Center (CG1221) of the 21st Century FrontierResearch Program funded by the Ministry of Education and Science ofthe Korean government.
LITERATURE CITED
Alpert, K. B., and S. D. Tanksley, 1996 High-resolution mappingand isolation of a yeast artificial chromosome contig containingfw2.2: a major fruit weight quantitative trait locus in tomato.Proc. Natl. Acad. Sci. USA 93: 15503–15507.
Anderson, L. K., and S. M. Stack, 2005 Recombination nodules inplants. Cytogenet. Genome Res. 109: 198–204.
Anderson, L. K., N. Salameh, H. W. Bass, L. C. Harper, W. Z. Cande
et al., 2004 Integrating genetic linkage maps with pachytenechromosome structure in maize. Genetics 166: 1923–1933.
Arumuganathan, K., and E. D. Earle, 1991 Nuclear DNA content ofsome important plant species. Plant Mol. Biol. Rep. 9: 208–218.
Bennett, M. D., and J. B. Smith, 1976 Nuclear DNA amounts in an-giosperms. Philos. Trans. R. Soc. Lond. B Biol. Sci. 274: 227–274.
Budiman, M. A., S. B. Chang, S. Lee, T. J. Yang, H. B. Zhang et al.,2004 Localization of jointless-2 gene in the centromeric regionof tomato chromosome 12 based on high resolution genetic andphysical mapping. Theor. Appl. Genet. 108: 190–196.
Chang, S. B., 2004 Cytogenetic and molecular studies on tomatochromosomes using diploid tomato and tomato monosomicadditions in tetraploid potato. Ph.D. Dissertation, WageningenUniversity, The Netherlands.
Chang, S. B., L. K. Anderson, J. D. Sherman, S. M. Royer and S. M.Stack, 2007 Predicting and testing physical locations of genet-ically mapped loci on tomato pachytene chromosome 1. Genetics176: 2131–2138.
Chen, M., G. Presting, W. B. Barbazuk, J. L. Goicoechea, B. Blackmon
et al., 2002 An integrated physical and genetic map of the ricegenome. Plant Cell 14: 537–545.
Cheng, Z., G. Presting, C. R. Buell, R. A. Wing and J. Jiang,2001a High-resolution pachytene chromosome mapping ofbacterial artificial chromosomes anchored by genetic markersreveals the centromere location and the distribution of geneticrecombination along chromosome 10 of rice. Genetics 157:1749–1757.
Cheng, Z., C. R. Buell, R. A. Wing, M. Gu and J. Jiang, 2001b To-ward a cytological characterization of the rice genome. GenomeRes. 11: 2133–2141.
Cheng, Z., C. R. Buell, R. A. Wing and J. Jiang, 2002 Resolution offluorescence in-situ hybridization mapping on rice mitotic prom-etaphase chromosomes, meiotic pachytene chromosomes andextended DNA fibers. Chromosome Res. 10: 379–387.
Fransz, P. F., S. Armstrong, J. H. de Jong, L. D. Parnell, C. van
Drunen et al., 2000 Integrated cytogenetic map of chromo-some arm 4S of A. thaliana: structural organization of hetero-chromatic knob and centromere region. Cell 100: 367–376.
Gerlach, O. L., and J. R. Bedrock, 1979 Cloning and characteriza-tion of ribosomal RNA genes from wheat and barley. NucleicAcids Res. 109: 1346–1352.
Giovannoni, J. J., E. N. Noensie, D. M. Ruezinsky, X. Lu, S. L.Tracy et al., 1995 Molecular genetic analysis of the ripening-inhibitor and non-ripening loci of tomato: a first step in geneticmap-based cloning of fruit ripening genes. Mol. Gen. Genet. 248:195–206.
Haanstra, J. P. W., C. Wye, H. Verbakel, F. Meijer-Dekens, P. v. d.Berg et al., 1999 An integrated high-density RFLP-AFLP map oftomato based on two Lycopersicon esculentum x L. pennellii F2 pop-ulations. Theor. Appl. Genet. 99: 254–271.
Jackson, S. A., M. L. Wang, H. M. Goodman and J. Jiang,1998 Application of fiber-FISH in physical mapping of Arabidop-sis thaliana. Genome 41: 566–572.
Koo, D. H., P. Plaha, Y. P. Lim, Y. Hur and J. W. Bang, 2004 A high-resolution karyotype of Brassica rapa ssp. pekinensis revealed bypachytene analysis and multicolor fluorescence in situ hybridiza-tion. Theor. Appl. Genet. 109: 1346–1352.
Kunzel, G., L. Korzun and A. Meister, 2000 Cytologically inte-grated physical restriction fragment length polymorphism mapsfor the barley genome based on translocation breakpoints. Ge-netics 154: 397–412.
Marra, M. A., T. A. Kucaba, N. L. Dietrich, E. D. Green, B.Brownstein et al., 1997 High throughput fingerprint analysisof large-insert clones. Genome Res. 7: 1072–1084.
Marra, M. A., L. Hillier and R. H. Waterston, 1998 Expressedsequence tags–EST abolishing bridges between genomes. TrendsGenet. 14: 4–7.
Mayer, K., C. Schuller, R. Wambutt, G. Murphy, G. Volckaert
et al., 1999 Sequence and analysis of chromosome 4 of the plantArabidopsis thaliana. Nature 402: 769–777.
McPherson, J. D., M. Marra, L. Hillier, R. H. Waterston, A.Chinwalla et al., 2001 A physical map of the human genome.Nature 409: 934–941.
Michaelson, M. J., H. J. Price, J. R. Ellison and J. S. Johnston,1991 Comparison of plant DNA contents determined by Feul-gen microspectrophotometry and laser flow cytometry. Am. J.Bot. 78: 183–188.
Mozo, T., K. Dewar, P. Dunn, J. R. Ecker, S. Fischer et al., 1999 Acomplete BAC-based physical map of the Arabidopsis thaliana ge-nome. Nat. Genet. 22: 271–275.
Mueller, L. A., T. H. Solow, N. Taylor, B. Skwarecki, R. Buels
et al., 2005 The SOL Genomics Network: a comparative re-source for Solanaceae biology and beyond. Plant Physiol. 138:1310–1317.
Pampanwar, V., F. Engler, J. Hatfield, S. Blundy, G. Gupta et al.,2005 FPC Web tools for rice, maize, and distribution. PlantPhysiol. 138: 116–126.
Peterson, D. F., H. J. Price, J. S. Johnston and S. M. Stack,1996 DNA content of heterochromatin and euchromatin in to-
Physical Architecture of Tomato Chromosome 2 1219
mato (Lycopersicon esculentum) pachytene chromosomes. Genome39: 77–82.
Peterson, D. G., N. L. Lapitan and S. M. Stack, 1999 Localizationof single- and low-copy sequences on tomato synaptonemal com-plex spreads using fluorescence in situ hybridization (FISH). Ge-netics 152: 427–439.
Richards, E. J., and F. M. Ausubel, 1988 Isolation of a higher eu-karyotic telomere from Arabidopsis thaliana. Cell 53: 127–136.
Rick, C. M., and J. I. Yoder, 1988 Classical and molecular genetics oftomato: highlights and perspectives. Annu. Rev. Genet. 22: 281–300.
Sasaki, T., T. Matsumoto, B. A. Antonio and Y. Nagamura,2005 From mapping to sequencing, post-sequencing and be-yond. Plant Cell Physiol. 46: 3–13.
Schmidt, R., J. West, K. Love, Z. Lenehan, C. Lister et al.,1995 Physical map and organization of Arabidopsis thalianachromosome 4. Science 270: 480–483.
Sherman, J. D., and S. M. Stack, 1992 Two-dimensional spreadsof synaptonemal complexs from solanaceous plants. V. Tomato(Lycopersicon esculentum) karyotype and ideogram. Genome 35:354–359.
Sherman, J. D., and S. M. Stack, 1995 Two-dimensional spreadsof synaptonemal complexes from solanaceous plants. VI. High-resolution recombination nodule map for tomato (Lycopersiconesculentum). Genetics 141: 683–708.
Tanksley, S. D., M. W. Ganal, J. P. Prince, M. C. de Vicente,M. W. Bonierbale et al., 1992 High density molecular link-age maps of the tomato and potato genomes. Genetics 132:1141–1160.
Tor, M., K. Manning, G. J. King, A. J. Thompson, G. H. Jones et al.,2002 Genetic analysis and FISH mapping of the Colourlessnon-ripening locus of tomato. Theor. Appl. Genet. 104: 165–170.
Umehara, Y., A. Inagaki, H. Tanoue, Y. Yasukochi, Y. Nagamura
et al., 1994 Construction and characterization of a rice YAClibrary for physical mapping. Mol. Breed. 1: 78–89.
van der Knaap, E., A. Sanyal, S. A. Jackson and S. D. Tanksley,2004 High-resolution fine mapping and fluorescence in situ hy-bridization analysis of sun, a locus controlling tomato fruit shape,reveals a region of the tomato genome prone to DNA rearrange-ments. Genetics 168: 2127–2140.
Wang, C. J., L. Harper and W. Z. Cande, 2006 High-resolutionsingle-copy gene fluorescence in situ hybridization and its usein the construction of a cytogenetic map of maize chromosome9. Plant Cell 18: 529–544.
Communicating editor: F. W. Stahl
1220 D.-H. Koo et al.