linkage and genetic mapping in eukaryotes in - …anisam2.yolasite.com/resources/linkage and...
TRANSCRIPT

::
5
In
LINKAGE AND
GENETIC MAPPING
IN EUKARYOTES
Chapter 2, we were introduced to Mendel’s laws of inheritance. Accord- ing to these principles, we expect that two different genes will segregate and independently assort themselves during the process that creates gametes. After Mendel’s work was rediscovered at the turn of the twentieth century, chromo- somes were identified as the cellular structures that carry genes. The chromo- some theory of inheritance explained how the transmission of chromosomes is responsible for the passage of genes from parents to offspring. When geneticists first realized that chromosomes contain the genetic mate- rial, they began to suspect that a conflict might sometimes occur between the law of independent assortment of genes and the behavior of chromosomes dur- ing meiosis. In particular, geneticists assumed that each species of organism must contain thousands of different genes, yet cytological studies revealed that most species have at most a few dozen chromosomes. Therefore, it seemed likely, and turned out to be true, that each chromosome would carry many hundreds or even thousands of different genes. The transmission of genes located close to each other on the same chromosome violates the law of independent assortment. In this chapter, we will consider the pattern of inheritance that occurs when different genes are situated on the same chromosome. In addition, we will briefly explore how the data from genetic crosses are used to construct a genetic map—a diagram that describes the order of genes along a chromosome. Newer strategies for gene mapping are described in Chapter 20. However, an understanding of traditional mapping studies, as described in this chapter, will strengthen our appreciation for these newer molecular approaches. More impor- tantly, traditional mapping studies further illustrate how the location of two or more genes on the same chromosome can affect the transmission patterns from parents to offspring.
CHAPTER OUTLINE
5.1
5.2
5.3
Linkage and Crossing Over
Genetic Mapping in Plants and Animals
Genetic Mapping in Haploid Eukaryotes
5.1 LINKAGE AND CROSSING OVER
In eukaryotic species, each linear chromosome contains a very long segment of DNA. A chromosome contains many individual functional units—called genes—that influence an organism’s traits. A typical chromosome is expected to contain many hundreds or perhaps a few thousand different genes. The term linkage has two related meanings. First, linkage refers to the phenomenon that two or more genes may be located on the same chromosome. The genes are physically linked to each other, because each eukaryotic chromosome contains a single, continuous, linear molecule of DNA. Second, genes that are close
Crossing over during meiosis. This event provides a way to reassort the alleles of genes that are located on the same chromosome.

5.1 LINKAGE AND CROSSING OVER 101
together on the same chromosome tend to be transmitted as a unit. This second meaning indicates that linkage has an influ- ence on inheritance patterns. Chromosomes are sometimes called linkage groups, because a chromosome contains a group of genes that are physi- cally linked together. In each species, the number of linkage groups equals the number of chromosome types. For example, human somatic cells have 46 chromosomes, which are composed of 22 types of autosomes that come in pairs plus one pair of sex chromosomes, the X and Y. Therefore, humans have 22 autoso- mal linkage groups, an X chromosome linkage group, and a Y chromosome linkage group. Geneticists are often interested in the transmission of two or more traits in a genetic cross. When a geneticist follows the variants of two different traits in a cross, this is called a dihybrid cross; when three traits are followed, it is a trihybrid cross; and so on. The outcome of a dihybrid or trihybrid cross depends on whether or not the genes are linked to each other along the same chromosome. In this section, we will examine how linkage affects the transmission patterns of two or more traits.
B A
B A
b a
b a B
A b aa
Diploid cell after chromosome replication
Diploid cell after chromosome replication
Meiosis Meiosis
B A
B A
B A
B a
b a
b a
b a
b A
Crossing Over May Produce Recombinant Genotypes
Even though the alleles for different genes may be linked along the same chromosome, the linkage can be altered during meio- sis. In diploid eukaryotic species, homologous chromosomes can exchange pieces with each other, a phenomenon called crossing over. This event occurs during prophase of meiosis I. As dis- cussed in Chapter 3, the replicated chromosomes, known as sis- ter chromatids, associate with the homologous sister chromatids to form a structure known as a bivalent. A bivalent is composed of two pairs of sister chromatids. In prophase of meiosis I, a sis- ter chromatid of one pair commonly crosses over with a sister chromatid from the homologous pair. Figure 5.1 considers meiosis when two genes are linked on the same chromosome. One of the parental chromosomes car- ries the A and B alleles, while the homologue carries the a and b alleles. In Figure 5.1a, no crossing over has occurred. There- fore, the resulting haploid cells contain the same combination of alleles as the original chromosomes. In this case, two haploid cells carry the dominant A and B alleles, and the other two carry the recessive a and b alleles. The arrangement of linked alleles has not been altered. In contrast, Figure 5.1b illustrates what can happen when crossing over occurs. Two of the haploid cells contain combina- tions of alleles, namely A and b or a and B, which differ from those in the original chromosomes. In these two cells, the group- ing of linked alleles has been changed. An event such as this, lead- ing to a new combination of alleles, is known as genetic recom- bination. The haploid cells carrying the A and b, or the a and B, alleles are called nonparental or recombinant cells. Likewise, if such haploid cells were gametes that participated in fertilization, the resulting offspring are called nonparental or recombinant offspring. These offspring can display combinations of traits that are different from those of either parent. In contrast, offspring
Possible haploid cells
(a) Without crossing over, linked alleles segregate together.
Possible haploid cells
(b) Crossing over can reassort linked alleles.
Consequences of crossing over during meiosis. (a) In the absence of crossing over, the A and B alleles and the a and b alleles are maintained in the same arrangement found in the parental chromosomes. (b) Crossing over has occurred in the region between the two genes, creating two nonparental haploid cells with a new combination of alleles.
FI GU R E 5 . 1
that have inherited the same combination of alleles that are found in the chromosomes of their parents are known as paren- tal or nonrecombinant offspring. In this section, we will consider how crossing over affects the pattern of inheritance for genes linked on the same chromo- some. In Chapter 17, we will consider the molecular events that cause crossing over to occur.
Bateson and Punnett Discovered Two Traits That Did Not Assort Independently
An early study indicating that some traits may not assort inde- pendently was carried out by William Bateson and Reginald Pun- nett in 1905. According to Mendel’s law of independent assort- ment, a dihybrid cross between two individuals, heterozygous for two genes, should yield a 9:3:3:1 phenotypic ratio among the off- spring. However, a surprising result occurred when Bateson and Punnett conducted a cross in the sweet pea involving two differ- ent traits—flower color and pollen shape. As seen in Figure 5.2, they began by crossing a true- breeding strain with purple flowers (PP) and long pollen (LL) to

102 C H A P T E R 5 :: LINKAGE AND GENETIC MAPPING IN EUKARYOTES
P generation P generation
x
Purple flowers, long pollen (PPLL)
F1 offspring
F1 generation
Purple flowers, long pollen (PpLl )
Self-fertilization
Red flowers, round pollen (ppll )
x
Xywm Xywm Xy +w +m + Y
x
F1 generation contains wild-type females and yellow-bodied, white-eyed, miniature-winged males.
Xywm Y F2 offspring
Purple flowers, long pollen Purple flowers, round pollen Red flowers, long pollen Red flowers, round pollen
Observed number
296 19 27 85
Ratio
15.6 1.0 1.4 4.5
Expected number
240 80 80 27
Ratio
9 3 3 1
Xy +w +m+ Xywm
F2 generation
Gray body, red eyes, long wings Gray body, red eyes, miniature wings Gray body, white eyes, long wings Gray body, white eyes, miniature wings Yellow body, red eyes, long wings Yellow body, red eyes, miniature wings Yellow body, white eyes, long wings Yellow body, white eyes, miniature wings
Females
439 208 1 5 7 0 178 365
Males
319 193 0 11 5 0 139 335
Total
758 401 1 16 12 0 317 700
F IG UR E 5.2 An experiment of Bateson and Punnett with sweet peas, showing that independent assortment does not always occur. Note: The expected numbers are rounded to the nearest whole number.
Genes gTraits Two genes that govern flower color and pollen shape are found on the same chromosome. Therefore, the offspring tend to inherit the parental combinations of alleles (PL or pl). Due to occasional crossing over, a lower percentage of offspring inherit nonparental combinations of alleles (Pl or pL).
F IG UR E 5. 3 Morgan’s trihybrid cross involving three X-linked traits in Drosophila.
a strain with red flowers (pp) and round pollen (ll). This yielded an F1 generation of plants that all had purple flowers and long pollen (PpLl). An unexpected result came from the F2 genera- tion. Even though the F2 generation had four different pheno- typic categories, the observed numbers of offspring did not conform to a 9:3:3:1 ratio. Bateson and Punnett found that the F2 generation had a much greater proportion of the two phe- notypes found in the parental generation—purple flowers with long pollen and red flowers with round pollen. Therefore, they suggested that the transmission of these two traits from the parental generation to the F2 generation was somehow coupled and not easily assorted in an independent manner. However, Bateson and Punnett did not realize that this coupling was due to the linkage of the flower color gene and the pollen shape gene on the same chromosome.
Genes gTraits Three genes that govern body color, eye color, and wing length are all found on the X chromosome. Therefore, the offspring tend to inherit the parental combinations of alleles (y+ w+ m+ or y w m). Figure 5.4 explains how single and double crossovers can create nonparental combinations of alleles.
Morgan Provided Evidence for the Linkage of X-Linked Genes and Proposed That Crossing Over Between X Chromosomes Can Occur
The first direct evidence that different genes are physically located on the same chromosome came from the studies of Thomas Hunt Morgan in 1911, who investigated the inheritance pattern of different traits that had been shown to follow an X-linked pat-
tern of inheritance. Figure 5.3 illustrates an experiment involv- ing three traits that Morgan studied. His parental crosses were wild-type male fruit flies mated to females that had yellow bodies (yy), white eyes (ww), and miniature wings (mm). The wild-type alleles for these three genes are designated y+ (gray body), w+ (red eyes), and m+ (long wings). As expected, the phenotypes of the F1 generation were wild-type females, and males with yellow bodies, white eyes, and miniature wings. The linkage of these genes was revealed when the F1 flies were mated to each other and the F2 generation examined. Instead of equal proportions of the eight possible pheno- types, Morgan observed a much higher proportion of the com- binations of traits found in the parental generation. He observed 758 flies with gray bodies, red eyes, and long wings, and 700 flies with yellow bodies, white eyes, and miniature wings. The combi- nation of gray body, red eyes, and long wings was found in the males of the parental generation, while the combination of yel- low body, white eyes, and miniature wings was the same as the females of the parental generation. Morgan’s explanation for this
5.1 LINKAGE AND CROSSING OVER 103
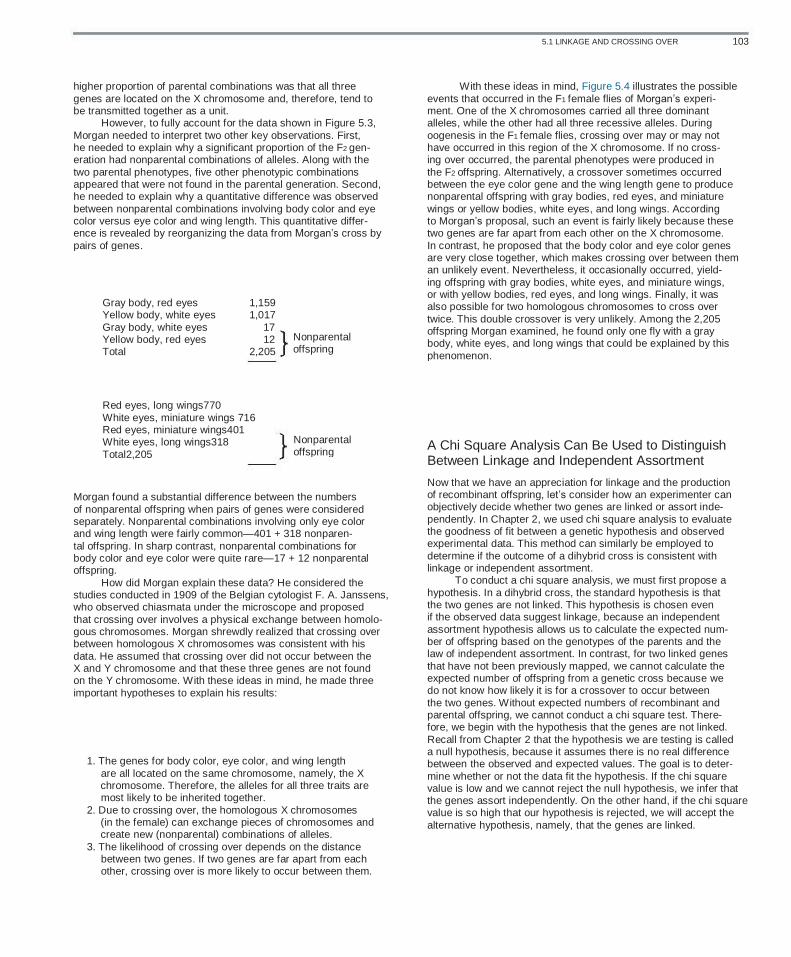
higher proportion of parental combinations was that all three genes are located on the X chromosome and, therefore, tend to be transmitted together as a unit. However, to fully account for the data shown in Figure 5.3, Morgan needed to interpret two other key observations. First, he needed to explain why a significant proportion of the F2 gen- eration had nonparental combinations of alleles. Along with the two parental phenotypes, five other phenotypic combinations appeared that were not found in the parental generation. Second, he needed to explain why a quantitative difference was observed between nonparental combinations involving body color and eye color versus eye color and wing length. This quantitative differ- ence is revealed by reorganizing the data from Morgan’s cross by pairs of genes.
Gray body, red eyes Yellow body, white eyes Gray body, white eyes Yellow body, red eyes Total
1,159 1,017 17 12 2,205
Nonparental offspring
Red eyes, long wings770 White eyes, miniature wings 716 Red eyes, miniature wings401 White eyes, long wings318 Total2,205
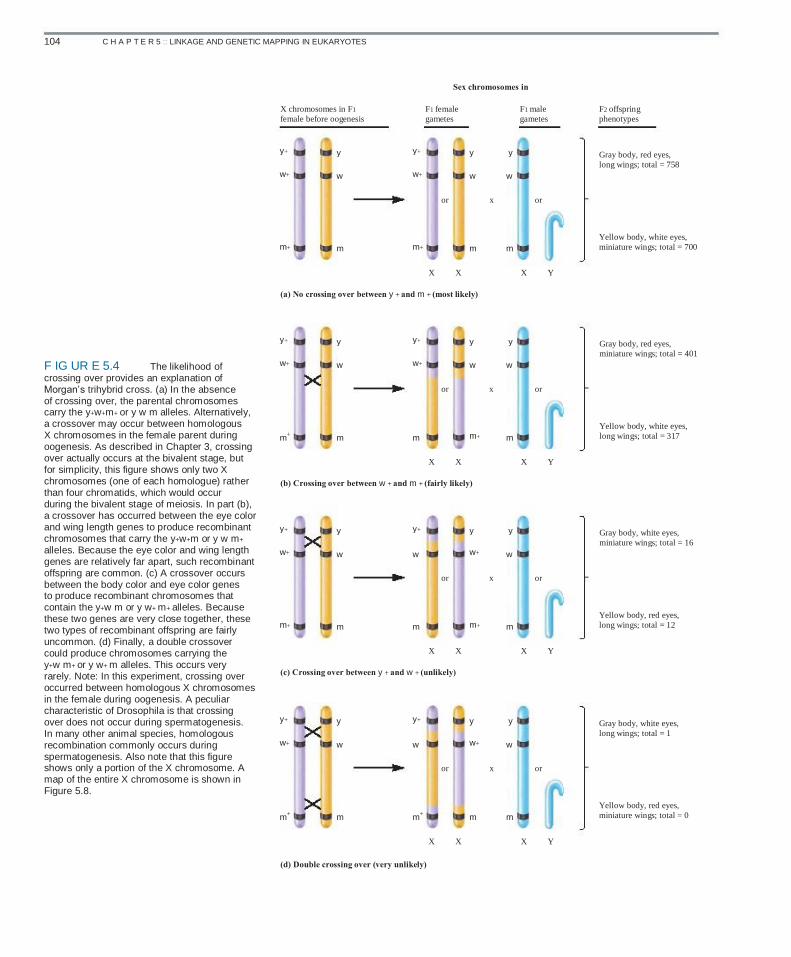
With these ideas in mind, Figure 5.4 illustrates the possible events that occurred in the F1 female flies of Morgan’s experi- ment. One of the X chromosomes carried all three dominant alleles, while the other had all three recessive alleles. During oogenesis in the F1 female flies, crossing over may or may not have occurred in this region of the X chromosome. If no cross- ing over occurred, the parental phenotypes were produced in the F2 offspring. Alternatively, a crossover sometimes occurred between the eye color gene and the wing length gene to produce nonparental offspring with gray bodies, red eyes, and miniature wings or yellow bodies, white eyes, and long wings. According to Morgan’s proposal, such an event is fairly likely because these two genes are far apart from each other on the X chromosome. In contrast, he proposed that the body color and eye color genes are very close together, which makes crossing over between them an unlikely event. Nevertheless, it occasionally occurred, yield- ing offspring with gray bodies, white eyes, and miniature wings, or with yellow bodies, red eyes, and long wings. Finally, it was also possible for two homologous chromosomes to cross over twice. This double crossover is very unlikely. Among the 2,205 offspring Morgan examined, he found only one fly with a gray body, white eyes, and long wings that could be explained by this phenomenon.
Nonparental offspring A Chi Square Analysis Can Be Used to Distinguish
Between Linkage and Independent Assortment
Now that we have an appreciation for linkage and the production of recombinant offspring, let’s consider how an experimenter can objectively decide whether two genes are linked or assort inde- pendently. In Chapter 2, we used chi square analysis to evaluate the goodness of fit between a genetic hypothesis and observed experimental data. This method can similarly be employed to determine if the outcome of a dihybrid cross is consistent with linkage or independent assortment. To conduct a chi square analysis, we must first propose a hypothesis. In a dihybrid cross, the standard hypothesis is that the two genes are not linked. This hypothesis is chosen even if the observed data suggest linkage, because an independent assortment hypothesis allows us to calculate the expected num- ber of offspring based on the genotypes of the parents and the law of independent assortment. In contrast, for two linked genes that have not been previously mapped, we cannot calculate the expected number of offspring from a genetic cross because we do not know how likely it is for a crossover to occur between the two genes. Without expected numbers of recombinant and parental offspring, we cannot conduct a chi square test. There- fore, we begin with the hypothesis that the genes are not linked. Recall from Chapter 2 that the hypothesis we are testing is called a null hypothesis, because it assumes there is no real difference between the observed and expected values. The goal is to deter- mine whether or not the data fit the hypothesis. If the chi square value is low and we cannot reject the null hypothesis, we infer that the genes assort independently. On the other hand, if the chi square value is so high that our hypothesis is rejected, we will accept the alternative hypothesis, namely, that the genes are linked.
Morgan found a substantial difference between the numbers of nonparental offspring when pairs of genes were considered separately. Nonparental combinations involving only eye color and wing length were fairly common—401 + 318 nonparen- tal offspring. In sharp contrast, nonparental combinations for body color and eye color were quite rare—17 + 12 nonparental offspring. How did Morgan explain these data? He considered the studies conducted in 1909 of the Belgian cytologist F. A. Janssens, who observed chiasmata under the microscope and proposed that crossing over involves a physical exchange between homolo- gous chromosomes. Morgan shrewdly realized that crossing over between homologous X chromosomes was consistent with his data. He assumed that crossing over did not occur between the X and Y chromosome and that these three genes are not found on the Y chromosome. With these ideas in mind, he made three important hypotheses to explain his results:
1. The genes for body color, eye color, and wing length are all located on the same chromosome, namely, the X chromosome. Therefore, the alleles for all three traits are most likely to be inherited together. 2. Due to crossing over, the homologous X chromosomes (in the female) can exchange pieces of chromosomes and create new (nonparental) combinations of alleles. 3. The likelihood of crossing over depends on the distance between two genes. If two genes are far apart from each other, crossing over is more likely to occur between them.
104 C H A P T E R 5 :: LINKAGE AND GENETIC MAPPING IN EUKARYOTES
Sex chromosomes in
X chromosomes in F1 female before oogenesis
y+
w+
y
w
y+
w+
or
F1 female gametes
y
w
x
y
w
or
F1 male gametes
F2 offspring phenotypes
Gray body, red eyes, long wings; total = 758
m+ m m+
X X
m m
X Y
Yellow body, white eyes, miniature wings; total = 700
(a) No crossing over between y + and m + (most likely)
y+ y
w
y+
w+
or
y
w
x
y
w
or
The likelihood of crossing over provides an explanation of Morgan’s trihybrid cross. (a) In the absence of crossing over, the parental chromosomes carry the y+w+m+ or y w m alleles. Alternatively, a crossover may occur between homologous X chromosomes in the female parent during oogenesis. As described in Chapter 3, crossing over actually occurs at the bivalent stage, but for simplicity, this figure shows only two X chromosomes (one of each homologue) rather than four chromatids, which would occur during the bivalent stage of meiosis. In part (b), a crossover has occurred between the eye color and wing length genes to produce recombinant chromosomes that carry the y+w+m or y w m+ alleles. Because the eye color and wing length genes are relatively far apart, such recombinant offspring are common. (c) A crossover occurs between the body color and eye color genes to produce recombinant chromosomes that contain the y+w m or y w+ m+ alleles. Because these two genes are very close together, these two types of recombinant offspring are fairly uncommon. (d) Finally, a double crossover could produce chromosomes carrying the y+w m+ or y w+ m alleles. This occurs very rarely. Note: In this experiment, crossing over occurred between homologous X chromosomes in the female during oogenesis. A peculiar characteristic of Drosophila is that crossing over does not occur during spermatogenesis. In many other animal species, homologous recombination commonly occurs during spermatogenesis. Also note that this figure shows only a portion of the X chromosome. A map of the entire X chromosome is shown in Figure 5.8.
F IG UR E 5.4 w+
Gray body, red eyes, miniature wings; total = 401
m + m m
X X
m+ m
X Y
Yellow body, white eyes, long wings; total = 317
(b) Crossing over between w + and m + (fairly likely)
y+
w+
y
w
y+
w
or
y
w+
x
y
w
or
Gray body, white eyes, miniature wings; total = 16
m+ m m
X X
m+ m
X Y
Yellow body, red eyes, long wings; total = 12
(c) Crossing over between y + and w + (unlikely)
y+
w+
y
w
y+
w
or
y
w+
x
y
w
or
Gray body, white eyes, long wings; total = 1
m + m m + m
X X
m
X Y
Yellow body, red eyes, miniature wings; total = 0
(d) Double crossing over (very unlikely)
5.1 LINKAGE AND CROSSING OVER 105
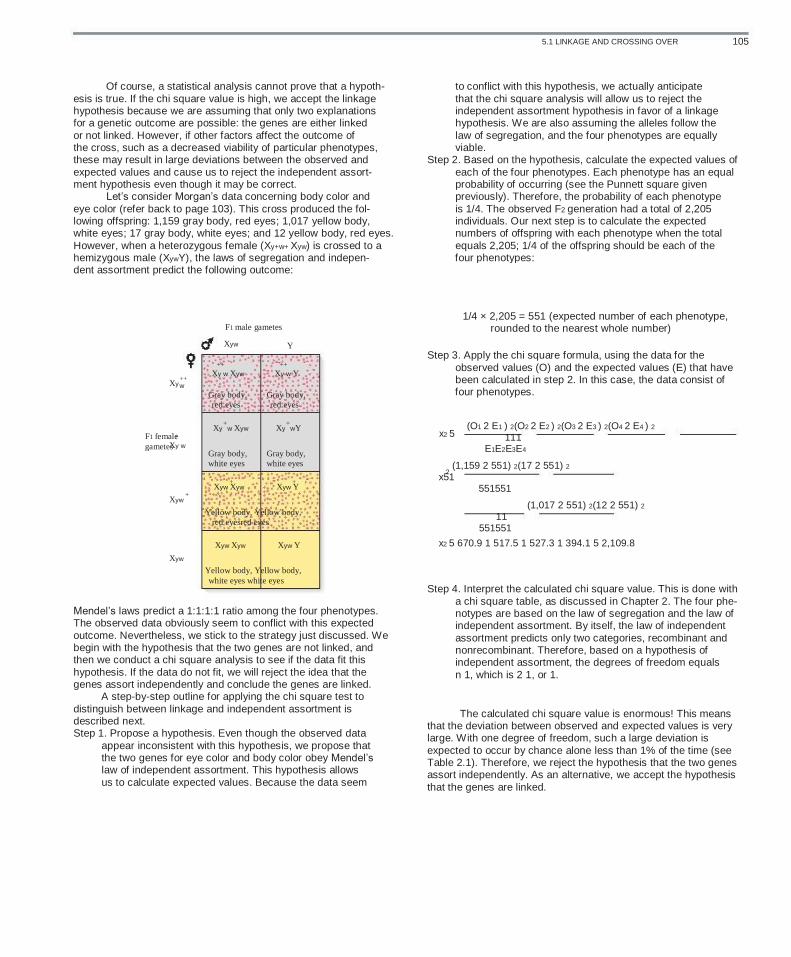
Of course, a statistical analysis cannot prove that a hypoth- esis is true. If the chi square value is high, we accept the linkage hypothesis because we are assuming that only two explanations for a genetic outcome are possible: the genes are either linked or not linked. However, if other factors affect the outcome of the cross, such as a decreased viability of particular phenotypes, these may result in large deviations between the observed and expected values and cause us to reject the independent assort- ment hypothesis even though it may be correct. Let’s consider Morgan’s data concerning body color and eye color (refer back to page 103). This cross produced the fol- lowing offspring: 1,159 gray body, red eyes; 1,017 yellow body, white eyes; 17 gray body, white eyes; and 12 yellow body, red eyes. However, when a heterozygous female (Xy+w+ Xyw) is crossed to a hemizygous male (XywY), the laws of segregation and indepen- dent assortment predict the following outcome:
F1 male gametes Xyw
++ Xy w Xyw
to conflict with this hypothesis, we actually anticipate that the chi square analysis will allow us to reject the independent assortment hypothesis in favor of a linkage hypothesis. We are also assuming the alleles follow the law of segregation, and the four phenotypes are equally viable. Step 2. Based on the hypothesis, calculate the expected values of each of the four phenotypes. Each phenotype has an equal probability of occurring (see the Punnett square given previously). Therefore, the probability of each phenotype is 1/4. The observed F2 generation had a total of 2,205 individuals. Our next step is to calculate the expected numbers of offspring with each phenotype when the total equals 2,205; 1/4 of the offspring should be each of the four phenotypes:
1/4 × 2,205 = 551 (expected number of each phenotype, rounded to the nearest whole number)
Step 3. Apply the chi square formula, using the data for the observed values (O) and the expected values (E) that have been calculated in step 2. In this case, the data consist of four phenotypes.
x2 5
2
Y
++ Xy w Y
Xy ++ w
Gray body, red eyes
F1 female
gametes + Xy w
Gray body, red eyes
Xy + wY Xy + w Xyw
Gray body, white eyes
+
Gray body, white eyes
Xyw Y +
(O1 2 E1 ) 2(O2 2 E2 ) 2(O3 2 E3 ) 2(O4 2 E4 ) 2 111 E1E2E3E4
Xyw Xyw + (1,159 2 551) 2(17 2 551) 2 x51 551551
(1,017 2 551) 2(12 2 551) 2 11 551551
x2 5 670.9 1 517.5 1 527.3 1 394.1 5 2,109.8
Xyw Yellow body, Yellow body, red eyesred eyes
Xyw Xyw Xyw
Yellow body, Yellow body, white eyes white eyes
Xyw Y
Mendel’s laws predict a 1:1:1:1 ratio among the four phenotypes. The observed data obviously seem to conflict with this expected outcome. Nevertheless, we stick to the strategy just discussed. We begin with the hypothesis that the two genes are not linked, and then we conduct a chi square analysis to see if the data fit this hypothesis. If the data do not fit, we will reject the idea that the genes assort independently and conclude the genes are linked. A step-by-step outline for applying the chi square test to distinguish between linkage and independent assortment is described next. Step 1. Propose a hypothesis. Even though the observed data appear inconsistent with this hypothesis, we propose that the two genes for eye color and body color obey Mendel’s law of independent assortment. This hypothesis allows us to calculate expected values. Because the data seem
Step 4. Interpret the calculated chi square value. This is done with a chi square table, as discussed in Chapter 2. The four phe- notypes are based on the law of segregation and the law of independent assortment. By itself, the law of independent assortment predicts only two categories, recombinant and nonrecombinant. Therefore, based on a hypothesis of independent assortment, the degrees of freedom equals n 1, which is 2 1, or 1.
The calculated chi square value is enormous! This means that the deviation between observed and expected values is very large. With one degree of freedom, such a large deviation is expected to occur by chance alone less than 1% of the time (see Table 2.1). Therefore, we reject the hypothesis that the two genes assort independently. As an alternative, we accept the hypothesis that the genes are linked.
106 C H A P T E R 5 :: LINKAGE AND GENETIC MAPPING IN EUKARYOTES
EXPERIMENT 5A
Creighton and McClintock Showed That Crossing Over Produced New Combinations of Alleles and Resulted in the Exchange of Segments Between Homologous Chromosomes
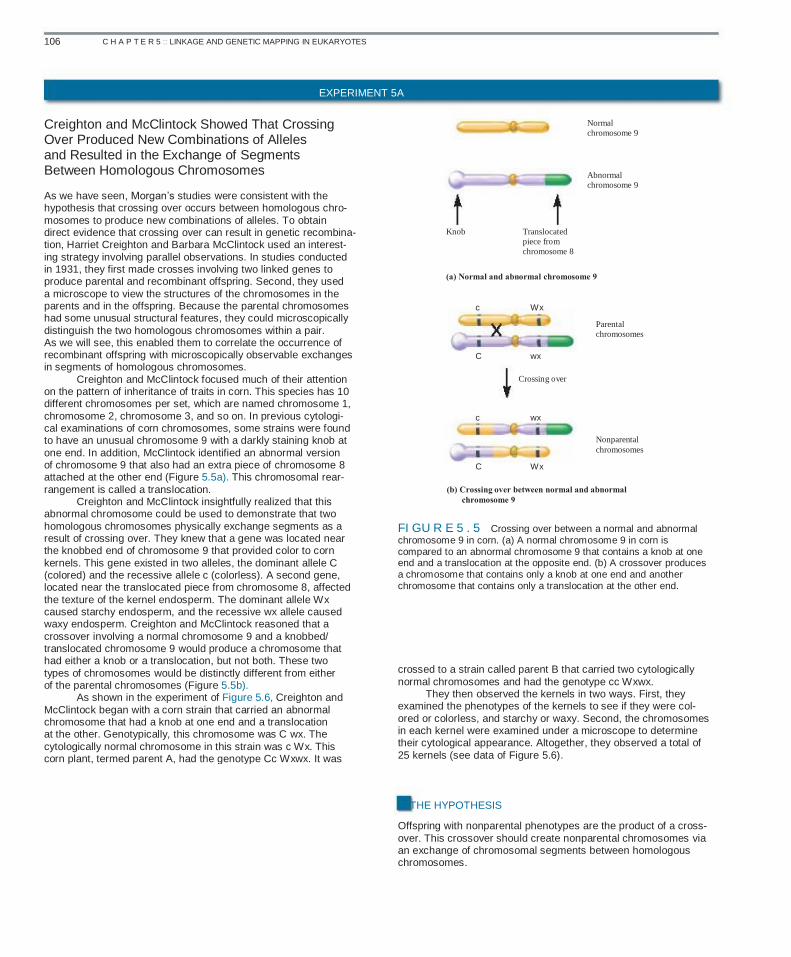
As we have seen, Morgan’s studies were consistent with the hypothesis that crossing over occurs between homologous chro- mosomes to produce new combinations of alleles. To obtain direct evidence that crossing over can result in genetic recombina- tion, Harriet Creighton and Barbara McClintock used an interest- ing strategy involving parallel observations. In studies conducted in 1931, they first made crosses involving two linked genes to produce parental and recombinant offspring. Second, they used a microscope to view the structures of the chromosomes in the parents and in the offspring. Because the parental chromosomes had some unusual structural features, they could microscopically distinguish the two homologous chromosomes within a pair. As we will see, this enabled them to correlate the occurrence of recombinant offspring with microscopically observable exchanges in segments of homologous chromosomes. Creighton and McClintock focused much of their attention on the pattern of inheritance of traits in corn. This species has 10 different chromosomes per set, which are named chromosome 1, chromosome 2, chromosome 3, and so on. In previous cytologi- cal examinations of corn chromosomes, some strains were found to have an unusual chromosome 9 with a darkly staining knob at one end. In addition, McClintock identified an abnormal version of chromosome 9 that also had an extra piece of chromosome 8 attached at the other end (Figure 5.5a). This chromosomal rear- rangement is called a translocation. Creighton and McClintock insightfully realized that this abnormal chromosome could be used to demonstrate that two homologous chromosomes physically exchange segments as a result of crossing over. They knew that a gene was located near the knobbed end of chromosome 9 that provided color to corn kernels. This gene existed in two alleles, the dominant allele C (colored) and the recessive allele c (colorless). A second gene, located near the translocated piece from chromosome 8, affected the texture of the kernel endosperm. The dominant allele Wx caused starchy endosperm, and the recessive wx allele caused waxy endosperm. Creighton and McClintock reasoned that a crossover involving a normal chromosome 9 and a knobbed/ translocated chromosome 9 would produce a chromosome that had either a knob or a translocation, but not both. These two types of chromosomes would be distinctly different from either of the parental chromosomes (Figure 5.5b). As shown in the experiment of Figure 5.6, Creighton and McClintock began with a corn strain that carried an abnormal chromosome that had a knob at one end and a translocation at the other. Genotypically, this chromosome was C wx. The cytologically normal chromosome in this strain was c Wx. This corn plant, termed parent A, had the genotype Cc Wxwx. It was
Normal chromosome 9
Abnormal chromosome 9
Knob Translocated piece from chromosome 8
(a) Normal and abnormal chromosome 9
c Wx Parental chromosomes
C wx
Crossing over
c wx
Nonparental chromosomes
C Wx
(b) Crossing over between normal and abnormal chromosome 9
FI GU R E 5 . 5 Crossing over between a normal and abnormal chromosome 9 in corn. (a) A normal chromosome 9 in corn is compared to an abnormal chromosome 9 that contains a knob at one end and a translocation at the opposite end. (b) A crossover produces a chromosome that contains only a knob at one end and another chromosome that contains only a translocation at the other end.
crossed to a strain called parent B that carried two cytologically normal chromosomes and had the genotype cc Wxwx. They then observed the kernels in two ways. First, they examined the phenotypes of the kernels to see if they were col- ored or colorless, and starchy or waxy. Second, the chromosomes in each kernel were examined under a microscope to determine their cytological appearance. Altogether, they observed a total of 25 kernels (see data of Figure 5.6).
■ THE HYPOTHESIS
Offspring with nonparental phenotypes are the product of a cross- over. This crossover should create nonparental chromosomes via an exchange of chromosomal segments between homologous chromosomes.

5.1 LINKAGE AND CROSSING OVER 107
■ TESTING THE HYPOTHESIS — FIGURE 5.6 crossing over.
Experimental correlation between genetic recombination and
Starting materials: Two different strains of corn. One strain, referred to as parent A, had an abnormal chromosome 9 (knobbed/translo- cation) with a dominant C allele and a recessive wx allele. It also had a cytologically normal copy of chromosome 9 that carried the reces- sive c allele and the dominant Wx allele. Its genotype was Cc Wxwx. The other strain (referred to as parent B) had two normal versions of chromosome 9. The genotype of this strain was cc Wxwx.
Experimental level
1. Cross the two strains described. The tassel is the pollen-bearing structure, and the silk (equivalent to the stigma and style) is connected to the ovary. After fertilization, the ovary will develop into an ear of corn.
Tassel
C
x
Conceptual level
c
x
c c
Silk wx Wx Wx wx
Parent A Cc Wxwx
Parent B cc Wxwx
2. Observe the kernels from this cross.
F1 ear of corn Each kernel is a separate seed that has inherited a set of chromosomes from each parent.
F1 kernels
3. Microscopically examine chromosome 9 in the kernels.
Colored/waxy Colorless/waxy
From parent B
C c
A recombinant chromosome
c c
wx Microscope
wx
From parent A
wx wx
This illustrates only 2 possible outcomes in the F1 kernels. The recombinant chromosome on the right is due to crossing over during meiosis in parent A. As shown in The Data, there are several possible outcomes.
108 C H A P T E R 5 :: LINKAGE AND GENETIC MAPPING IN EUKARYOTES
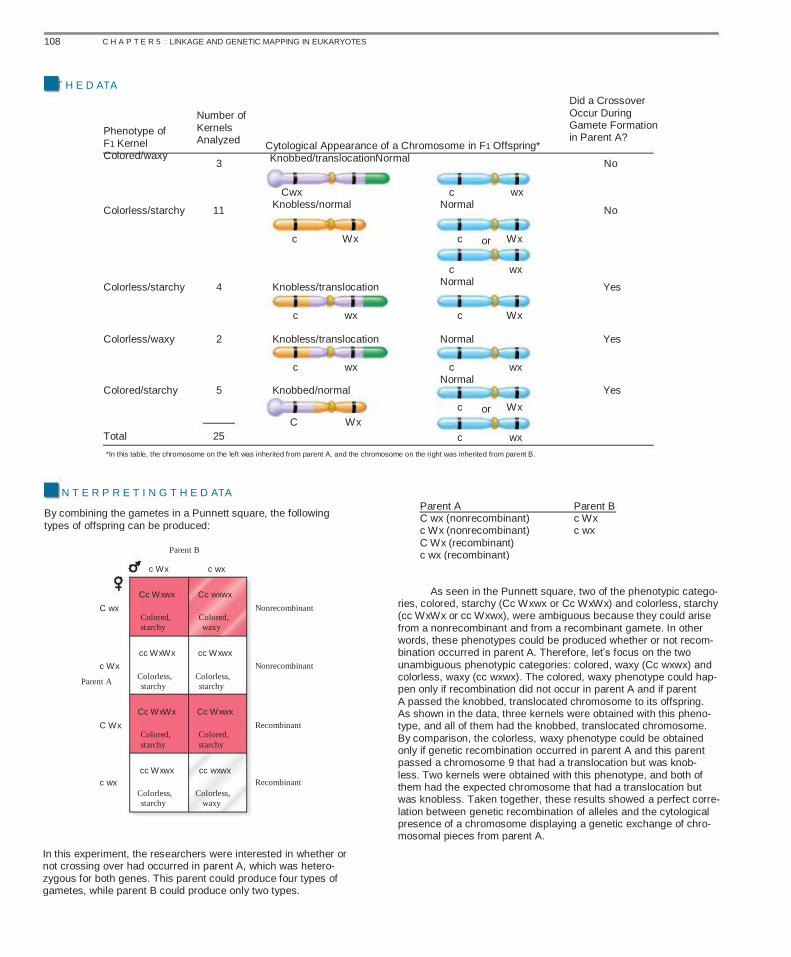
■ T H E D ATA
Phenotype of F1 Kernel Colored/waxy
Number of Kernels Analyzed
3
Did a Crossover Occur During Gamete Formation in Parent A?
No Cytological Appearance of a Chromosome in F1 Offspring* Knobbed/translocationNormal
Cwx Knobless/normal
c Wx
c Normal
c
c Normal
c
Normal
c Normal
c C Wx
c wx
or
wx
or
wx
Colorless/starchy 11 No
Wx
wx Yes
Wx
Yes
Colorless/starchy 4 Knobless/translocation
c wx
Colorless/waxy 2 Knobless/translocation
c wx
Colored/starchy 5 Knobbed/normal Wx
Yes
Total 25 *In this table, the chromosome on the left was inherited from parent A, and the chromosome on the right was inherited from parent B.
■ I N T E R P R E T I N G T H E D ATA
By combining the gametes in a Punnett square, the following types of offspring can be produced:
Parent B
c Wx
Cc Wxwx C wx
Colored, starchy
cc WxWx c Wx
Parent A Colorless, starchy
Cc WxWx C Wx
Colored, starchy
cc Wxwx c wx
Colorless, starchy
Colorless, waxy
Colored, starchy
cc wxwx Recombinant
Colorless, starchy
Cc Wxwx Recombinant
Colored, waxy
cc Wxwx Nonrecombinant
c wx
Cc wxwx Nonrecombinant
Parent A C wx (nonrecombinant) c Wx (nonrecombinant) C Wx (recombinant) c wx (recombinant)
Parent B c Wx c wx
In this experiment, the researchers were interested in whether or not crossing over had occurred in parent A, which was hetero- zygous for both genes. This parent could produce four types of gametes, while parent B could produce only two types.
As seen in the Punnett square, two of the phenotypic catego- ries, colored, starchy (Cc Wxwx or Cc WxWx) and colorless, starchy (cc WxWx or cc Wxwx), were ambiguous because they could arise from a nonrecombinant and from a recombinant gamete. In other words, these phenotypes could be produced whether or not recom- bination occurred in parent A. Therefore, let’s focus on the two unambiguous phenotypic categories: colored, waxy (Cc wxwx) and colorless, waxy (cc wxwx). The colored, waxy phenotype could hap- pen only if recombination did not occur in parent A and if parent A passed the knobbed, translocated chromosome to its offspring. As shown in the data, three kernels were obtained with this pheno- type, and all of them had the knobbed, translocated chromosome. By comparison, the colorless, waxy phenotype could be obtained only if genetic recombination occurred in parent A and this parent passed a chromosome 9 that had a translocation but was knob- less. Two kernels were obtained with this phenotype, and both of them had the expected chromosome that had a translocation but was knobless. Taken together, these results showed a perfect corre- lation between genetic recombination of alleles and the cytological presence of a chromosome displaying a genetic exchange of chro- mosomal pieces from parent A.
5.2 GENETIC MAPPING IN PLANTS AND ANIMALS 109
Overall, the observations described in this experiment were consistent with the idea that a crossover occurred in the region between the C and wx genes that involved an exchange of seg- ments between two homologous chromosomes. As stated by Creighton and McClintock, “Pairing chromosomes, heteromor- phic in two regions, have been shown to exchange parts at the same time they exchange genes assigned to these regions.” These results supported the view that genetic recombination involves a physical exchange between homologous chromosomes. This microscopic evidence helped to convince geneticists that recom-
binant offspring arise from the physical exchange of segments of homologous chromosomes. As shown in solved problem S4 at the end of this chapter, an experiment by Curt Stern was also con- sistent with the conclusion that crossing over between homolo- gous chromosomes accounts for the formation of offspring with recombinant phenotypes.
A self-help quiz involving this experiment can be found at the Online Learning Center.
Crossing Over Occasionally Occurs During Mitosis
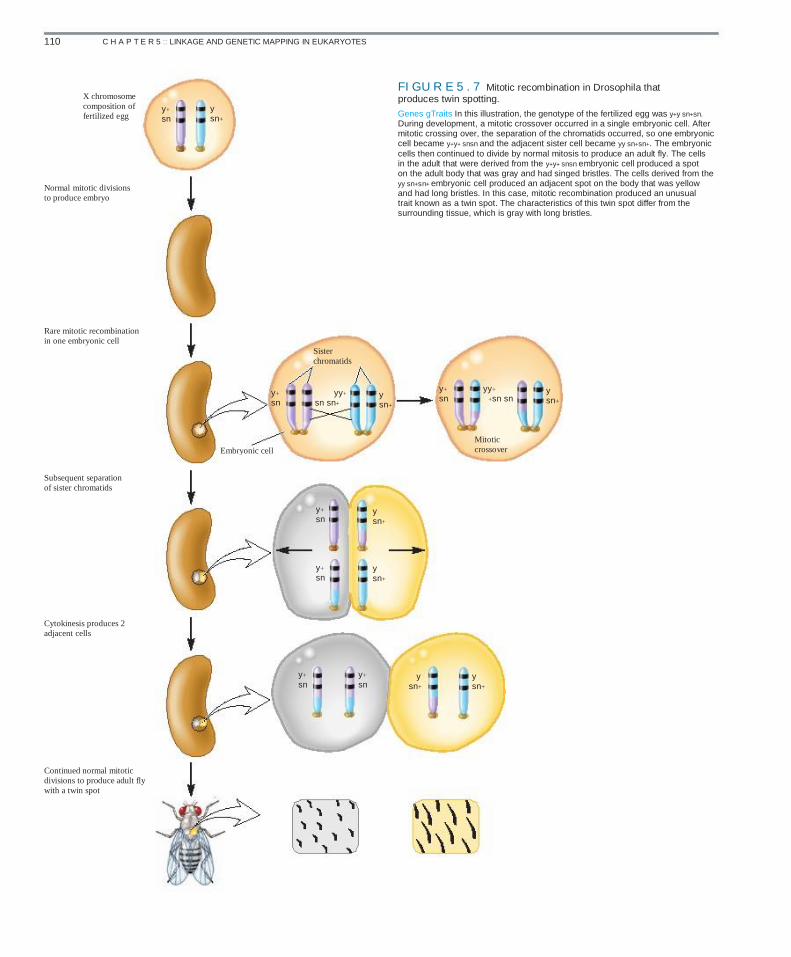
In multicellular organisms, the union of egg and sperm is fol- lowed by many cellular divisions, which occur in conjunction with mitotic divisions of the cell nuclei. As discussed in Chapter 3, mitosis normally does not involve the homologous pairing of chromosomes to form a bivalent. Therefore, crossing over dur- ing mitosis is expected to occur much less frequently than during meiosis. Nevertheless, it does happen on rare occasions. Mitotic crossing over may produce a pair of recombinant chromo- somes that have a new combination of alleles, an event known as mitotic recombination. If it occurs during an early stage of embryonic development, the daughter cells containing the recom- binant chromosomes continue to divide many times to produce a patch of tissue in the adult. This may result in a portion of tissue with characteristics different from those of the rest of the organism. In 1936, Curt Stern identified unusual patches on the bodies of certain Drosophila strains. He was working with strains carry- ing X-linked alleles affecting body color and bristle morphology (Figure 5.7). A recessive allele confers yellow body color (y), and another recessive allele causes shorter body bristles that look singed (sn). The corresponding wild-type alleles result in gray body color (y+) and long bristles (sn+). Females that are y+y sn+sn are expected to have gray body color and long bristles. This was generally the case. However, when Stern carefully observed the bodies of these female flies under a low-power microscope, he occasionally noticed places in which two adjacent regions were different from the rest of the body—a twin spot. He concluded that twin spotting was too frequent to be explained by the random positioning of two inde- pendent single spots that happened to occur close together. How then did Stern explain the phenomenon of twin spotting? He pro- posed that twin spots are due to a single mitotic recombination within one cell during embryonic development. As shown in Figure 5.7, the X chromosomes of the fertil- ized egg are y+ sn and y sn+. During development, a rare cross- over can occur during mitosis to produce two adjacent daughter cells that are y+y+ snsn and yy sn+sn+. As embryonic development proceeds, the cell on the left will continue to divide to produce many cells, eventually producing a patch on the body that has gray color with singed bristles. The daughter cell next to it will produce a patch of yellow body color with long bristles. These two adjacent patches—a twin spot—will be surrounded by cells
that are y+y sn+sn and have gray color and long bristles. Twin spots provide evidence that mitotic recombination occasionally occurs.
5.2 GENETIC MAPPING
IN PLANTS AND ANIMALS
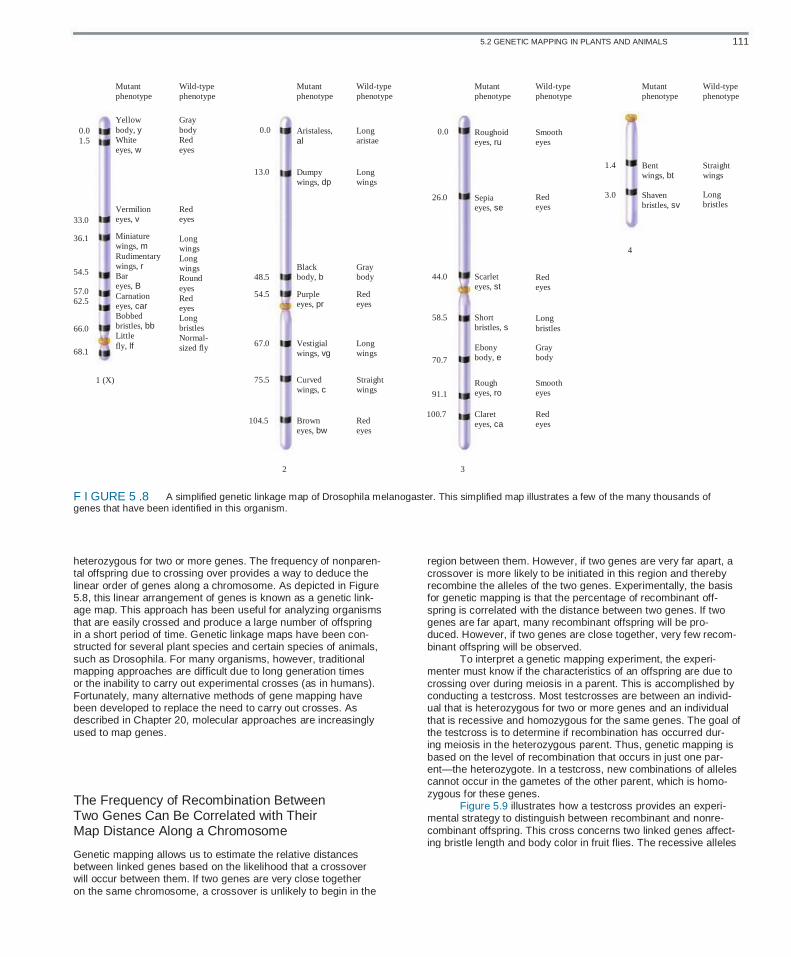
The purpose of genetic mapping, also known as gene mapping or chromosome mapping, is to determine the linear order and distance of separation among genes that are linked to each other along the same chromosome. Figure 5.8 illustrates a simplified genetic map of Drosophila melanogaster depicting the locations of many different genes along the individual chromosomes. As shown here, each gene has its own unique locus—the site where the gene is found within a particular chromosome. For example, the gene designated brown eyes (bw), which affects eye color, is located near one end of chromosome 2. The gene designated black body (b), which affects body color, is found near the middle of the same chromosome. Why is genetic mapping useful? First, it allows geneticists to understand the overall complexity and genetic organization of a particular species. The genetic map of a species portrays the under- lying basis for the inherited traits that an organism displays. In some cases, the known locus of a gene within a genetic map can help molecular geneticists to clone that gene and thereby obtain greater information about its molecular features. In addition, genetic maps are useful from an evolutionary point of view. A comparison of the genetic maps for different species can improve our understanding of the evolutionary relationships among those species. Along with these scientific uses, genetic maps have many practical benefits. For example, many human genes that play a role in human disease have been genetically mapped. This infor- mation can be used to diagnose and perhaps someday treat inher- ited human diseases. It can also help genetic counselors predict the likelihood that a couple will produce children with certain inherited diseases. In addition, genetic maps are gaining increasing importance in agriculture. A genetic map can provide plant and animal breeders with helpful information for improving agricul- turally important strains through selective breeding programs. In this section, we will examine traditional genetic mapping techniques that involve an analysis of crosses of individuals that are
110 C H A P T E R 5 :: LINKAGE AND GENETIC MAPPING IN EUKARYOTES
X chromosome composition of fertilized egg
FI GU R E 5 . 7
y+ sn
y sn+
Mitotic recombination in Drosophila that produces twin spotting.
Normal mitotic divisions to produce embryo
Genes gTraits In this illustration, the genotype of the fertilized egg was y+y sn+sn. During development, a mitotic crossover occurred in a single embryonic cell. After mitotic crossing over, the separation of the chromatids occurred, so one embryonic cell became y+y+ snsn and the adjacent sister cell became yy sn+sn+. The embryonic cells then continued to divide by normal mitosis to produce an adult fly. The cells in the adult that were derived from the y+y+ snsn embryonic cell produced a spot on the adult body that was gray and had singed bristles. The cells derived from the yy sn+sn+ embryonic cell produced an adjacent spot on the body that was yellow and had long bristles. In this case, mitotic recombination produced an unusual trait known as a twin spot. The characteristics of this twin spot differ from the surrounding tissue, which is gray with long bristles.
Rare mitotic recombination in one embryonic cell
Sister chromatids
y+ sn
yy+ sn sn+
y sn+
y+ sn
yy+ +sn sn
y sn+
Embryonic cell
Subsequent separation of sister chromatids
y+ sn
y sn+
Mitotic crossover
y+ sn
y sn+
Cytokinesis produces 2 adjacent cells
y+ sn
y+ sn
y sn+
y sn+
Continued normal mitotic divisions to produce adult fly with a twin spot
5.2 GENETIC MAPPING IN PLANTS AND ANIMALS 111
Mutant phenotype
0.0 1.5
Yellow body, y White eyes, w
Wild-type phenotype
Gray body Red eyes
0.0
Mutant phenotype
Aristaless, al
Dumpy wings, dp
Wild-type phenotype
Long aristae
Long wings
26.0
Mutant phenotype
Wild-type phenotype
Mutant phenotype
Wild-type phenotype
0.0 Roughoid eyes, ru
Smooth eyes
1.4 Bent wings, bt
Shaven bristles, sv
Straight wings
Long bristles
13.0
33.0
36.1
54.5
57.0 62.5
66.0
68.1
Vermilion eyes, v Miniature wings, m Rudimentary wings, r Bar eyes, B Carnation eyes, car Bobbed bristles, bb Little fly, lf
1 (X)
Red eyes
Long wings Long wings Round eyes Red eyes Long bristles Normal- sized fly
Sepia eyes, se
Red eyes
3.0
4
48.5 54.5
Black body, b Purple eyes, pr
Gray body Red eyes
58.5
67.0 Vestigial wings, vg
Curved wings, c
Brown eyes, bw
Long wings
Straight wings
Red eyes
44.0 Scarlet eyes, st
Short bristles, s
Ebony body, e
Rough eyes, ro
Claret eyes, ca
Red eyes
Long bristles
Gray body
Smooth eyes
Red eyes
70.7
75.5 91.1
100.7 104.5
2 3
F I GURE 5 .8 A simplified genetic linkage map of Drosophila melanogaster. This simplified map illustrates a few of the many thousands of genes that have been identified in this organism.
heterozygous for two or more genes. The frequency of nonparen- tal offspring due to crossing over provides a way to deduce the linear order of genes along a chromosome. As depicted in Figure 5.8, this linear arrangement of genes is known as a genetic link- age map. This approach has been useful for analyzing organisms that are easily crossed and produce a large number of offspring in a short period of time. Genetic linkage maps have been con- structed for several plant species and certain species of animals, such as Drosophila. For many organisms, however, traditional mapping approaches are difficult due to long generation times or the inability to carry out experimental crosses (as in humans). Fortunately, many alternative methods of gene mapping have been developed to replace the need to carry out crosses. As described in Chapter 20, molecular approaches are increasingly used to map genes.
The Frequency of Recombination Between Two Genes Can Be Correlated with Their Map Distance Along a Chromosome
Genetic mapping allows us to estimate the relative distances between linked genes based on the likelihood that a crossover will occur between them. If two genes are very close together on the same chromosome, a crossover is unlikely to begin in the
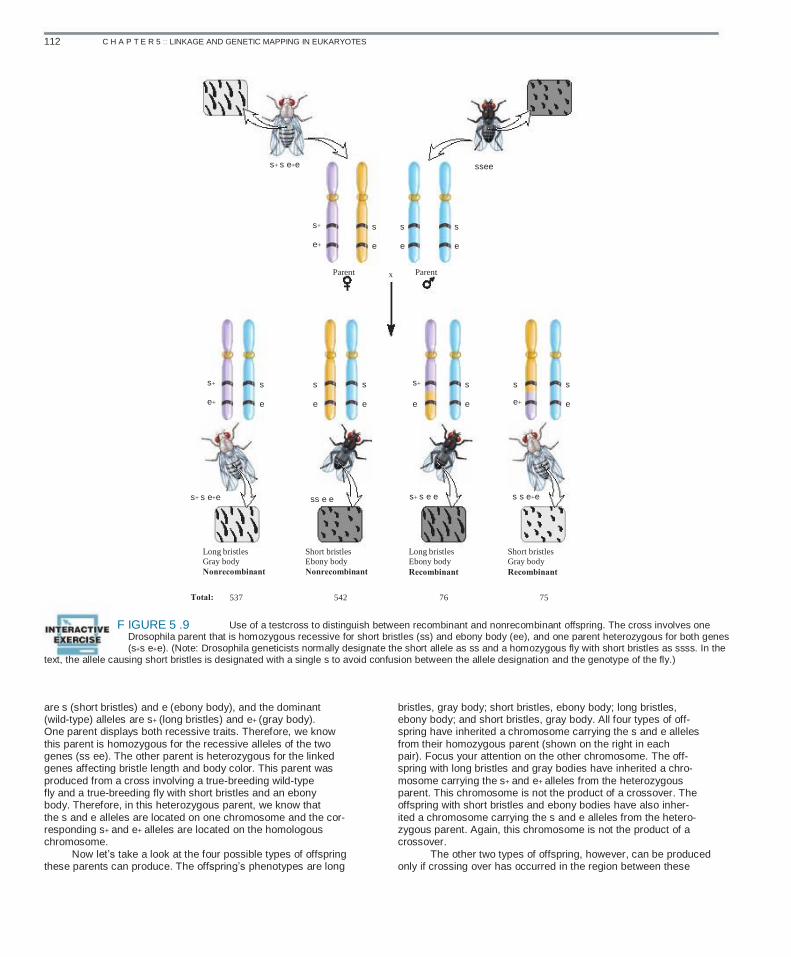
region between them. However, if two genes are very far apart, a crossover is more likely to be initiated in this region and thereby recombine the alleles of the two genes. Experimentally, the basis for genetic mapping is that the percentage of recombinant off- spring is correlated with the distance between two genes. If two genes are far apart, many recombinant offspring will be pro- duced. However, if two genes are close together, very few recom- binant offspring will be observed. To interpret a genetic mapping experiment, the experi- menter must know if the characteristics of an offspring are due to crossing over during meiosis in a parent. This is accomplished by conducting a testcross. Most testcrosses are between an individ- ual that is heterozygous for two or more genes and an individual that is recessive and homozygous for the same genes. The goal of the testcross is to determine if recombination has occurred dur- ing meiosis in the heterozygous parent. Thus, genetic mapping is based on the level of recombination that occurs in just one par- ent—the heterozygote. In a testcross, new combinations of alleles cannot occur in the gametes of the other parent, which is homo- zygous for these genes. Figure 5.9 illustrates how a testcross provides an experi- mental strategy to distinguish between recombinant and nonre- combinant offspring. This cross concerns two linked genes affect- ing bristle length and body color in fruit flies. The recessive alleles
112 C H A P T E R 5 :: LINKAGE AND GENETIC MAPPING IN EUKARYOTES
s+ s e+e ssee
s+
e+
Parent
s
e
x
s
e
Parent
s
e
s+
e+ s
e
s
e
s
e
s+
e
s
e
s e+
s
e
s+ s e+e ss e e s+ s e e s s e+e
Long bristles Gray body Nonrecombinant
Total: 537
Short bristles Ebony body Nonrecombinant
542
Long bristles Ebony body Recombinant
76
Short bristles Gray body Recombinant
75
Use of a testcross to distinguish between recombinant and nonrecombinant offspring. The cross involves one Drosophila parent that is homozygous recessive for short bristles (ss) and ebony body (ee), and one parent heterozygous for both genes (s+s e+e). (Note: Drosophila geneticists normally designate the short allele as ss and a homozygous fly with short bristles as ssss. In the text, the allele causing short bristles is designated with a single s to avoid confusion between the allele designation and the genotype of the fly.)
F IGURE 5 .9
are s (short bristles) and e (ebony body), and the dominant (wild-type) alleles are s+ (long bristles) and e+ (gray body). One parent displays both recessive traits. Therefore, we know this parent is homozygous for the recessive alleles of the two genes (ss ee). The other parent is heterozygous for the linked genes affecting bristle length and body color. This parent was produced from a cross involving a true-breeding wild-type fly and a true-breeding fly with short bristles and an ebony body. Therefore, in this heterozygous parent, we know that the s and e alleles are located on one chromosome and the cor- responding s+ and e+ alleles are located on the homologous chromosome. Now let’s take a look at the four possible types of offspring these parents can produce. The offspring’s phenotypes are long
bristles, gray body; short bristles, ebony body; long bristles, ebony body; and short bristles, gray body. All four types of off- spring have inherited a chromosome carrying the s and e alleles from their homozygous parent (shown on the right in each pair). Focus your attention on the other chromosome. The off- spring with long bristles and gray bodies have inherited a chro- mosome carrying the s+ and e+ alleles from the heterozygous parent. This chromosome is not the product of a crossover. The offspring with short bristles and ebony bodies have also inher- ited a chromosome carrying the s and e alleles from the hetero- zygous parent. Again, this chromosome is not the product of a crossover. The other two types of offspring, however, can be produced only if crossing over has occurred in the region between these
5.2 GENETIC MAPPING IN PLANTS AND ANIMALS 113
two genes. Those with long bristles and ebony bodies or short bristles and gray bodies have inherited a chromosome that is the product of a crossover during meiosis in the heterozygous par- ent. As noted in Figure 5.9, the recombinant offspring are fewer in number than are the nonrecombinant offspring. The frequency of recombination can be used as an estimate of the physical distance between two genes on the same chromo- some. The map distance is defined as the number of recombi- nant offspring divided by the total number of offspring, multi- plied by 100. We can calculate the map distance between these two genes using this formula:
Map distance =
=
Number of recombinant offspring Total number of offspring *100
76 1 75 X100 537 1 542 1 76 1 75
5 12.3 map units
The units of distance are called map units (mu) or some- times centiMorgans (cM) in honor of Thomas Hunt Morgan. One map unit is equivalent to a 1% frequency of recombination. In this example, we would conclude that the s and e alleles are 12.3 map units apart from each other along the same chromosome.
EXPERIMENT 5B
Alfred Sturtevant Used the Frequency of Crossing Over in Dihybrid Crosses to Produce the First Genetic Map
In 1911, the first individual to construct a (very small) genetic map was Alfred Sturtevant, an undergraduate who spent time in the laboratory of Thomas Hunt Morgan. Sturtevant wrote: “In conversation with Morgan . . . I suddenly realized that the varia- tions in the strength of linkage, already attributed by Morgan to differences in the spatial separation of the genes, offered the possibility of determining sequences [of different genes] in the linear dimension of a chromosome. I went home and spent most of the night (to the neglect of my undergraduate homework) in producing the first chromosome map, which included the sex- linked genes, y, w, v, m, and r, in the order and approximately the relative spacing that they still appear on the standard maps.” In the experiment of Figure 5.10, Sturtevant considered the outcome of crosses involving six different mutant alleles that altered the phenotype of flies. All of these alleles were known to
be recessive and X linked. They are y (yellow body color), w (white eye color), w-e (eosin eye color), v (vermilion eye color), m (miniature wings), and r (rudimentary wings). The w and w-e alleles are alleles of the same gene. In contrast, the v allele (vermilion eye color) is an allele of a different gene that also affects eye color. The two alleles that affect wing length, m and r, are also in different genes. Therefore, Sturtevant studied the inheritance of six recessive alleles, but since w and w-e are alleles of the same gene, his genetic map contained only five genes. The corresponding wild-type alleles are y+ (gray body), w+ (red eyes), v+ (red eyes), m+ (long wings), and r+ (long wings).
■ THE HYPOTHESIS
When genes are located on the same chromosome, the distance between the genes can be estimated from the proportion of recombinant offspring. This provides a way to map the order of genes along a chromosome.
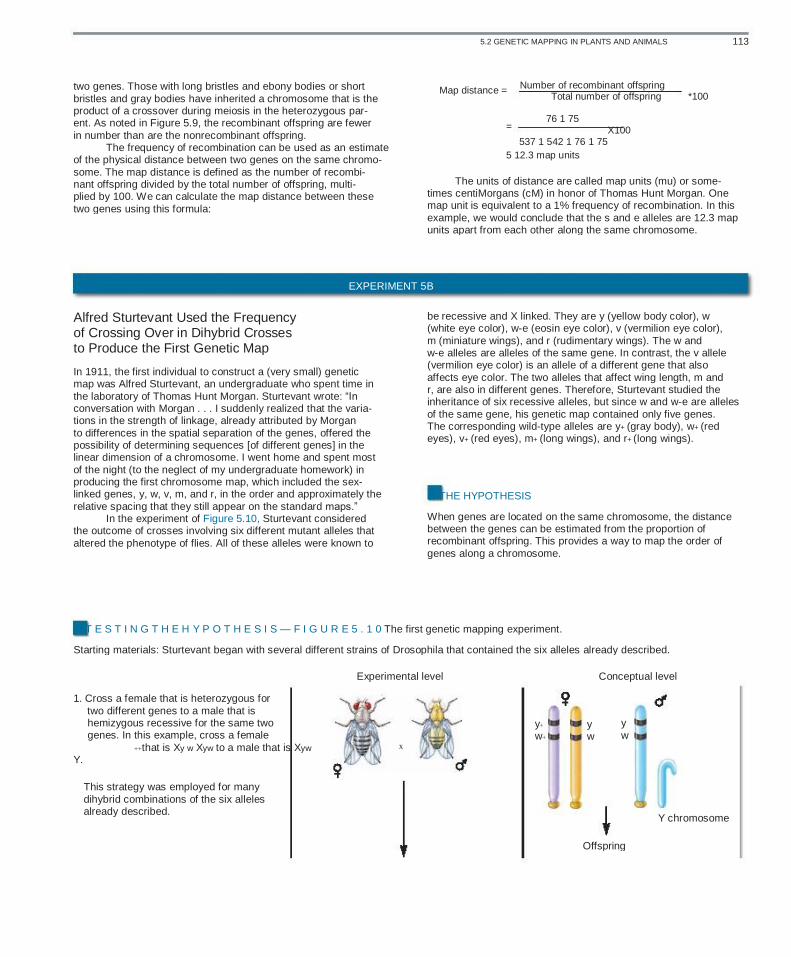
■ T E S T I N G T H E H Y P O T H E S I S — F I G U R E 5 . 1 0 The first genetic mapping experiment.
Starting materials: Sturtevant began with several different strains of Drosophila that contained the six alleles already described.
Experimental level
1. Cross a female that is heterozygous for two different genes to a male that is hemizygous recessive for the same two genes. In this example, cross a female ++that is Xy w Xyw to a male that is Xyw
Y.
This strategy was employed for many dihybrid combinations of the six alleles already described.
Offspring
Conceptual level
x
y+ w+
y w
y w
Y chromosome

114 C H A P T E R 5 :: LINKAGE AND GENETIC MAPPING IN EUKARYOTES
2. Observe the outcome of the crosses.
Parental types are more common
y+ w+
y w
y+ w+
Gray bodies Red eyes
y w
y w
y w
Yellow bodies White eyes
Recombinant types are less common
y+ w
y w
y+ w
Gray bodies White eyes
y w+
y w
y w+
Yellow bodies Red eyes
3. Calculate the percentages of offspring that are the result of crossing over (number of nonparental/total).
See The Data.
■ T H E D ATA
Alleles Concerned
y and w/w-e y and v y and m y and r w/w-e and v w/w-e and m w/w-e and r v and m v and r
Number Recombinant/Total Number
214/21,736 1,464/4,551 115/324 260/693 471/1,584 2,062/6,116 406/898 17/573 109/405
Percent Recombinant Offspring
1.0 32.2 35.5 37.5 29.7 33.7 45.2 3.0 26.9
■ I N T E R P R E T I N G T H E D ATA
As shown in Figure 5.10, Sturtevant made pairwise testcrosses and then counted the number of offspring in the four phenotypic categories. Two of the categories were nonrecombinant and two were recombinant, requiring a crossover between the X chromo- somes in the female heterozygote. Let’s begin by contrasting the results between particular pairs of genes, shown in the data. In some dihybrid crosses, the percentage of nonparental offspring was rather low. For example, dihybrid crosses involving the y allele and the w or w-e allele yielded 1% recombinant offspring. This result suggested that these two genes are very close together. By comparison, other dihybrid crosses showed a higher percent- age of nonparental offspring. For example, crosses involving the
5.2 GENETIC MAPPING IN PLANTS AND ANIMALS 115
Percentage of
recombinant offspring in a
testcross
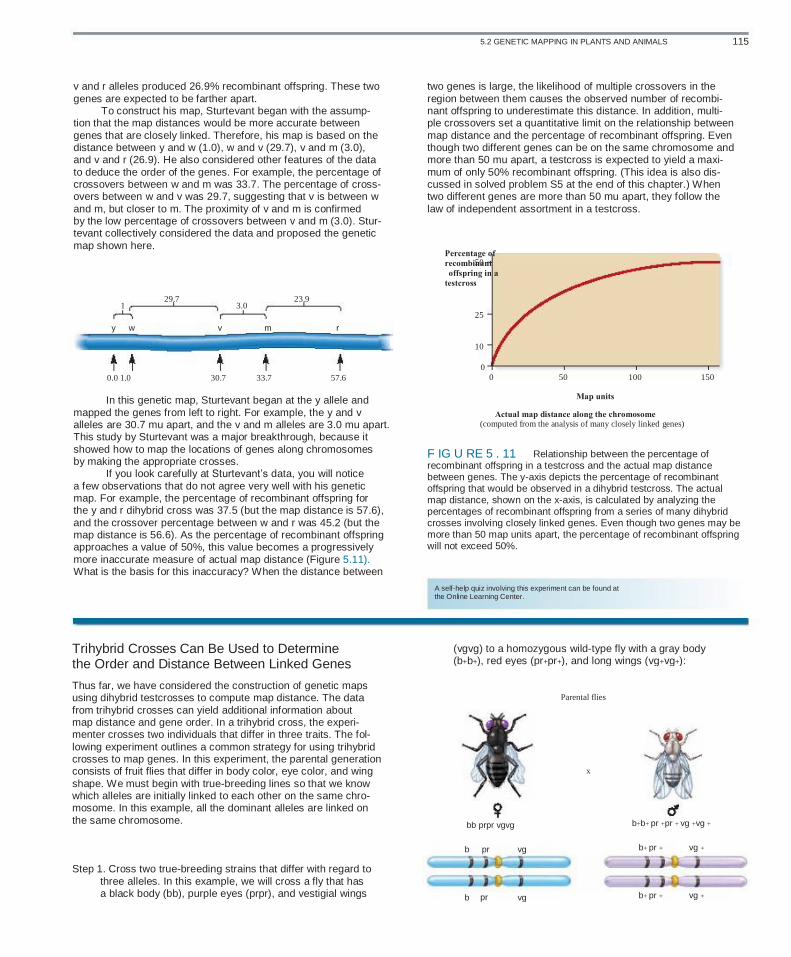
v and r alleles produced 26.9% recombinant offspring. These two genes are expected to be farther apart. To construct his map, Sturtevant began with the assump- tion that the map distances would be more accurate between genes that are closely linked. Therefore, his map is based on the distance between y and w (1.0), w and v (29.7), v and m (3.0), and v and r (26.9). He also considered other features of the data to deduce the order of the genes. For example, the percentage of crossovers between w and m was 33.7. The percentage of cross- overs between w and v was 29.7, suggesting that v is between w and m, but closer to m. The proximity of v and m is confirmed by the low percentage of crossovers between v and m (3.0). Stur- tevant collectively considered the data and proposed the genetic map shown here.
1
y w
29.7
v
3.0
m
23.9
r
two genes is large, the likelihood of multiple crossovers in the region between them causes the observed number of recombi- nant offspring to underestimate this distance. In addition, multi- ple crossovers set a quantitative limit on the relationship between map distance and the percentage of recombinant offspring. Even though two different genes can be on the same chromosome and more than 50 mu apart, a testcross is expected to yield a maxi- mum of only 50% recombinant offspring. (This idea is also dis- cussed in solved problem S5 at the end of this chapter.) When two different genes are more than 50 mu apart, they follow the law of independent assortment in a testcross.
50
25
10
0 0 50
Map units Actual map distance along the chromosome (computed from the analysis of many closely linked genes)
100 150 0.0 1.0 30.7 33.7 57.6
In this genetic map, Sturtevant began at the y allele and mapped the genes from left to right. For example, the y and v alleles are 30.7 mu apart, and the v and m alleles are 3.0 mu apart. This study by Sturtevant was a major breakthrough, because it showed how to map the locations of genes along chromosomes by making the appropriate crosses. If you look carefully at Sturtevant’s data, you will notice a few observations that do not agree very well with his genetic map. For example, the percentage of recombinant offspring for the y and r dihybrid cross was 37.5 (but the map distance is 57.6), and the crossover percentage between w and r was 45.2 (but the map distance is 56.6). As the percentage of recombinant offspring approaches a value of 50%, this value becomes a progressively more inaccurate measure of actual map distance (Figure 5.11). What is the basis for this inaccuracy? When the distance between
F IG U RE 5 . 11 Relationship between the percentage of recombinant offspring in a testcross and the actual map distance between genes. The y-axis depicts the percentage of recombinant offspring that would be observed in a dihybrid testcross. The actual map distance, shown on the x-axis, is calculated by analyzing the percentages of recombinant offspring from a series of many dihybrid crosses involving closely linked genes. Even though two genes may be more than 50 map units apart, the percentage of recombinant offspring will not exceed 50%.
A self-help quiz involving this experiment can be found at the Online Learning Center.
Trihybrid Crosses Can Be Used to Determine the Order and Distance Between Linked Genes
Thus far, we have considered the construction of genetic maps using dihybrid testcrosses to compute map distance. The data from trihybrid crosses can yield additional information about map distance and gene order. In a trihybrid cross, the experi- menter crosses two individuals that differ in three traits. The fol- lowing experiment outlines a common strategy for using trihybrid crosses to map genes. In this experiment, the parental generation consists of fruit flies that differ in body color, eye color, and wing shape. We must begin with true-breeding lines so that we know which alleles are initially linked to each other on the same chro- mosome. In this example, all the dominant alleles are linked on the same chromosome.
Step 1. Cross two true-breeding strains that differ with regard to three alleles. In this example, we will cross a fly that has a black body (bb), purple eyes (prpr), and vestigial wings
(vgvg) to a homozygous wild-type fly with a gray body (b+b+), red eyes (pr+pr+), and long wings (vg+vg+):
Parental flies
x
bb prpr vgvg
b pr vg
b+b+ pr +pr + vg +vg +
b+ pr + vg +
b pr vg b+ pr + vg +