integrative top-down system metabolic modeling in ...shm/papers/bn-metalog_jpr_08.pdf ·...
TRANSCRIPT
Integrative Top-Down System Metabolic Modeling in Experimental
Disease States via Data-Driven Bayesian Methods
Jung-Wook Bang,† Derek J. Crockford,† Elaine Holmes,† Florencio Pazos,‡
Michael J. E. Sternberg,‡ Stephen H. Muggleton,§ and Jeremy K. Nicholson*,†
Department of Biomolecular Medicine, Division of Surgery, Oncology, Reproductive Biology & Anaesthetics,Sir Alexander Fleming Building, Imperial College, London SW7 2AZ, U.K., Structural Bioinformatics Group,
Division of Molecular Bioscience, Imperial College, London SW7 2AY, U.K., and ComputationalBioinformatics Group, Department of Computing, Imperial College, London SW7 2AZ, U.K.
Received June 7, 2007
Multivariate metabolic profiles from biofluids such as urine and plasma are highly indicative of thebiological fitness of complex organisms and can be captured analytically in order to derive top-downsystems biology models. The application of currently available modeling approaches to human andanimal metabolic pathway modeling is problematic because of multicompartmental cellular and tissueexchange of metabolites operating on many time scales. Hence, novel approaches are needed to analyzemetabolic data obtained using minimally invasive sampling methods in order to reconstruct the patho-physiological modulations of metabolic interactions that are representative of whole system dynamics.Here, we show that spectroscopically derived metabolic data in experimental liver injury studies (inducedby hydrazine and R-napthylisothiocyanate treatment) can be used to derive insightful probabilisticgraphical models of metabolite dependencies, which we refer to as metabolic interactome maps. Usingthese, system level mechanistic information on homeostasis can be inferred, and the degree ofreversibility of induced lesions can be related to variations in the metabolic network patterns. Thisapproach has wider application in assessment of system level dysfunction in animal or human studiesfrom noninvasive measurements.
Keywords: Metabolic and regulatory networks • computational methods • molecular biology of disease
Introduction
The metabolic signature of intact biological systems, asexpressed in their secreted fluids, is influenced strongly bygenetic, environmental, and disease factors.1–3 Most currentsystems biology approaches involve a bottom-up paradigm inwhich the behavior of a complex system is dissected fromunderstanding interactions at the cellular level, e.g., in unicel-lular organisms.3–5 Such approaches are not applicable toproblems relating to screening for human disease or molecularepidemiological studies because it is only possible to samplereal populations from the top, that is, with readily availablebiomaterials such as plasma and urine on a large scale. Thesefluids give a useful end-point metabolic signature that isrepresentative of integrated system function or dysfunctionrelated to disease; however, at present there are no statisticalapproaches capable of delivering network interaction informa-tion for a complex multicompartmental system. Probabilisticgraphical models (Bayesian models) have been proposed as anefficient means of visualizing interactions at several levels ofbiomolecular organization influencing metabolic regulation
and control.6,7 Metabolic networks provide a potential frame-work for modeling dynamic biological events at an integratedor global systems biology level, where many different cell typesinteract to influence fluxes in extracellular metabolic pools. Themetabolic information available in databases such as KEGG(Kyoto Encyclopedia of Genes and Genomes) allows a startingpoint for the study of metabolism from a network perspective.8
The modular architecture of such networks (grouping intocohesive subnetworks) and the relationship between thesemodules and classical pathways9 have been reported. Substan-tial quantitative modeling work has been carried out onmetabolic flux analysis,10 but this is not readily applicable todata sets determined from biofluids, which represent integratedcompartment interactions.
Most metabolic pathway analysis theories have been devel-oped from in vitro studies on isolated cells where biologicalactivities can be assumed, and fluxes through pathways canbe followed using isotopic labeling. Various mathematicaltechniques have been applied to model such cellular biologicalsystems including biochemical systems theory (BST), metaboliccontrol analysis (MCA), and flux balance analysis (FBA).11–14
In previous studies, gene expression data have been modeledusing Bayesian techniques assuming complete knowledge ofthe structure of the network and measurement of cellularfluxes.15,16 However, in order to understand system level
* To whom correspondence should be addressed. Tel: +44 (0)20 75943195. Fax: +44 (0) 20 7594 3226. E-mail: [email protected].
† Division of Surgery, Oncology, Reproductive Biology & Anaesthetics.‡ Division of Molecular Bioscience.§ Department of Computing.
10.1021/pr070350l CCC: $40.75 2008 American Chemical Society The Journal of Proteome Research 2008, 7, 497–503 497Published on Web 01/08/2008
metabolic regulation in humans (or indeed animals used intoxicological, pharmacological, or functional genomic studies),a radically different measurement and modeling paradigm isrequired.3 Therefore, in marked contrast to earlier attempts,we have provided a graphical representation of the perturbedmetabolic network (an interactome map) directly from empiri-cally derived metabolic data, reflecting integrated multicellularbiochemical interactions at the whole system level.2
1H NMR spectroscopy generates complex and highly repro-ducible metabolic signatures of biofluids that have been widelydemonstrated to carry detailed information on a variety ofpathophysiological conditions.1,2,17 It has been shown thatdiverse metabolic signatures of homeostatic and pathologicalprocesses are carried in urine,1,18 which is well suited forhuman studies as collection is noninvasive. A probabilisticgraphical model permits the use of nonspatially registeredmetabolic information to describe the integrated system activi-ties of many tissue compartments. Thus, we developed a novelinteractome map approach that utilizes both probabilisticreasoning (Bayes’ theorem) and graphical modeling (visualiza-tion) for describing the metabolic relationships.19 These ap-proaches are suitable for dealing with biological data since theyprovide a framework for incorporating prior knowledge, dealingwith uncertainty, and combining competing models for ex-plaining biological phenomena.20,21 We use two model hepa-
totoxins with markedly different mechanisms of action, viz.,hydrazine, a toxic metabolite of the antitubercular drugsisoniazid and iproniazid that produces steatotic liver pathol-ogy,22–24 and R-napthylisothiocyanate (ANIT), which causes bileduct necrosis, cholangitis, and bile duct proliferation, resultingin secondary hepatic cholestasis.25 The toxins were given attwo dose levels to simulate hepatic disease states.
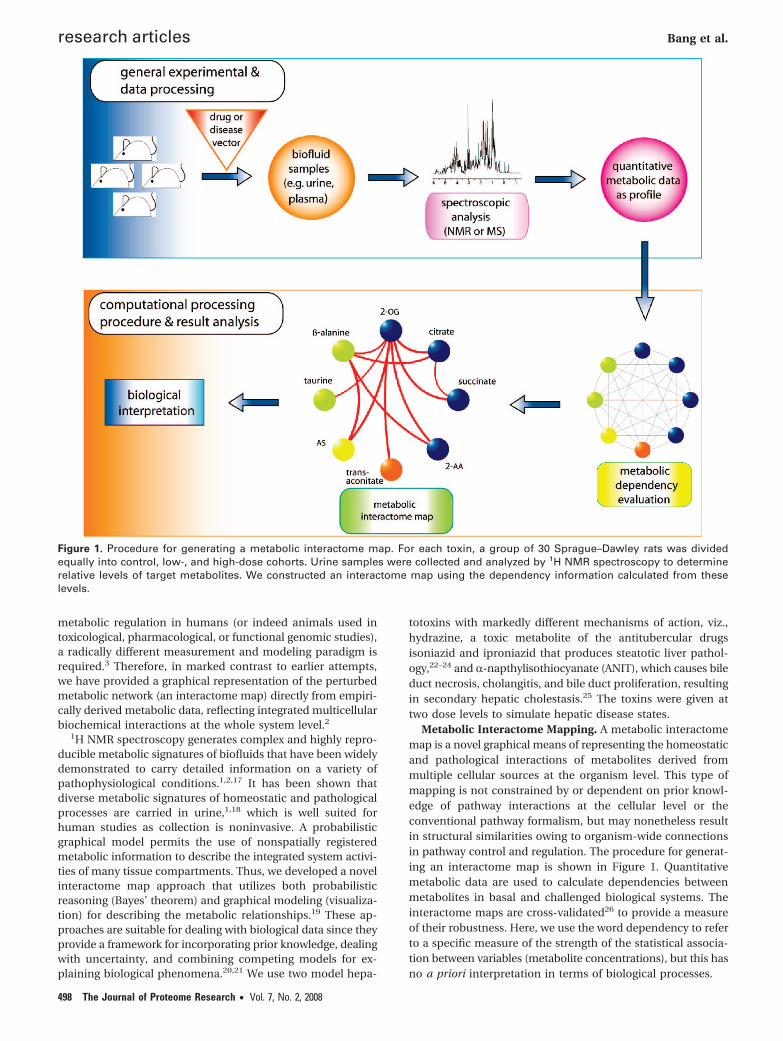
Metabolic Interactome Mapping. A metabolic interactomemap is a novel graphical means of representing the homeostaticand pathological interactions of metabolites derived frommultiple cellular sources at the organism level. This type ofmapping is not constrained by or dependent on prior knowl-edge of pathway interactions at the cellular level or theconventional pathway formalism, but may nonetheless resultin structural similarities owing to organism-wide connectionsin pathway control and regulation. The procedure for generat-ing an interactome map is shown in Figure 1. Quantitativemetabolic data are used to calculate dependencies betweenmetabolites in basal and challenged biological systems. Theinteractome maps are cross-validated26 to provide a measureof their robustness. Here, we use the word dependency to referto a specific measure of the strength of the statistical associa-tion between variables (metabolite concentrations), but this hasno a priori interpretation in terms of biological processes.
Figure 1. Procedure for generating a metabolic interactome map. For each toxin, a group of 30 Sprague–Dawley rats was dividedequally into control, low-, and high-dose cohorts. Urine samples were collected and analyzed by 1H NMR spectroscopy to determinerelative levels of target metabolites. We constructed an interactome map using the dependency information calculated from theselevels.
research articles Bang et al.
498 The Journal of Proteome Research • Vol. 7, No. 2, 2008

Experimental Procedures
Samples and Spectroscopy. Rat urine samples were analyzedby 1H NMR spectroscopy as part of the COMET project,27,28
and the resulting data were used here. Each COMET toxin studywas performed by a specific collaborating center according topre-agreed protocols, which included comparable experimentalconditions to be applied (e.g., housing and diet). In each one,male Sprague–Dawley rats were randomly allocated to threedose groups (10 per group), giving 30 rats per study. The dosegroups were control, low dose, and high dose. In one ofthe studies addressed here, hydrazine hydrochloride in 0.9%saline was administered orally at 30 mg/kg (low dose) or 90mg/kg (high dose), and in the other, ANIT in corn oil wasadministered orally at dose levels of 12.5 mg/kg (low dose) or125 mg/kg (high dose). Dose vehicles alone were administeredto the control animals. Low dose levels were designed to invokea threshold response in the animals, while high dose levels weredesigned to invoke a pathological response. All animal experi-ments were conducted according to specified U.K. nationalguidelines.
The time of dosing was defined as zero hours. Rats werehoused in individual metabolic cages under controlled tem-perature, humidity, and light cycles. Urine samples werecollected for time intervals spanning –24 to –16, –16 to 0, 0–8,8–24, 24–48, 48–72, 72–96, 96–120, 120–144, and 144–168 h, witheach sample labeled by the end time of the sampling interval.Half of each dose group was euthanized at 48 h and the rest at168 h, giving 225 samples per toxin study (ignoring smalldiscrepancies due to missing samples). The start of an experi-ment was timed so that the –24 to –16 and 0 to 8 h intervalsoccurred during daylight.
One dimensional 1H NMR spectra of phosphate-bufferedsamples were measured at 600 MHz in a conventional mannerusing a standard 1D presaturation pulse sequence for watersuppression.29 The spectra were recorded into 32K data pointsand referenced to 3-(trimethylsilyl) propionic acid-d4 (assodium salt). Further details of experimental protocols andspectral acquisition parameters have been reported.28,30
Histopathology Assessment of the Liver. This was con-ducted by a team of COMET pathologists using preagreedcriteria and vocabulary. The results obtained are consistent withpublished material.22–25 The severity scale runs from 0 to 4. Atlow dose, there was a single hydrazine-treated animal thatdisplayed a severity 1 focus of midzonal necrosis at 48 hpostdose and two ANIT-treated animals that developed aseverity 1 focal, single-cell necrosis at 48 h. The lesions at highdose, which was a dose level intended to induce overt tissuedamage, are summarized below.
Hydrazine. Hepatocellular cytoplasmic vacuolation wasfound in varying severity from 2 to 4 in all animals euthanizedat 48 h and from 1 to 3 in 3 of the 5 remaining animals at 168 h.The high dose of hydrazine induced midzonal necrosis atseverity 1 to 2 at 48 h postdose in all animals, but no necrosiswas observed at 168 h.
ANIT. At 48 h postdose, 4 of the 5 animals had bile ductnecrosis at severity 2 to 3. The same animals also had severity1 oval cell hyperplasia, a regenerative response, and periportalsingle-cell hepatocyte necrosis at severity 1 to 2. Periportalinflammation at severity 2 was observed in all animals eutha-nized at 48 h and in 4 of the 5 animals at 168 h. All ratscontinuing to the end of the 168 h study period demonstrated
periportal fibrosis at severity 1 to 2, which was multifocal in 4animals and focal in 1.
Data Analysis and Metabolic Interactome Map Con-struction. The detailed process of generating a metabolicinteractome map consists of four steps.
Step 1: Metabolite Analysis. The frequency domain dataobtained were integrated to find the intensities of the NMRsignals due to 19 endogenous metabolites of interest. The exactpositions of these signals in the spectra were identified andthe signals integrated, using an in-house computer programemploying mathematical transformations from the referencespectra of pure compounds.31 The intensities were normalizedby area to account for any variation in urine concentration.The 19 metabolites were chosen because their signals couldbe measured reliably using this method and because they areall significant in their own right.
There were 10 samples (time points) available for eachanimal euthanized at 168 h and 5 for each animal euthanizedat 48 h. For each sample (characterized by subject, 1–30, andtime point), the relative intensity for each metabolite wascalculated as the ratio to the zero hour intensity (in thatsubject). Hence, the effects of irrelevant, interanimal responsevariation were minimized, and it was reasonable to treat everyanimal in a dose group equally. This step yielded a fold changematrix, with rows labeled according to sample (i.e., subject andtime point) and columns according to metabolite. A logarithmicfold change matrix was obtained from this by taking thelogarithm of each element. This is a standard technique whenmodeling variables that may have different dynamic ranges sothat smaller ones may assume some importance in the modeland proportional increase and decrease are treated equally. Foreach metabolite, the range of the logarithmic fold change wasthen divided into five equal intervals, which were labeled onan increasing scale from 1 to 5, and finally, the label of theinterval enclosing each value was assigned as the correspondingquantized fold change value. This was done because the inputto the interactome map consists of a matrix of discrete values.
Step 2: Model Construction. Interactome maps were con-structed using a dependency measure derived from theKullback-Leibler information divergence32,33
D(X, Y))∑X,Y
[P(x, y)logP(x, y)
P(x)P(y)]g 0 (1)
where x and y are the members of data sets X and Y, and P isthe probability of the given members occurring (jointly orindependently, according to the number of arguments). Thisis a specific form of dependency measure derived frominformation theory. Given that any form of functional relation-ship exists between X and Y, this form of dependency measurewill be sensitive to it. In other words, it provides a measure ofthe statistical association between two variables, whether theassociation is linear or nonlinear, in contrast to the moreconventional Pearson correlation coefficient, which is onlysensitive to linear associations. It is important to realize thatno prior biological knowledge is required in this calculationand that a strong dependency value does not necessarily implya relationship between any associated biological processes: thisis a matter of interpretation by biological domain experts uponconsideration of the complete, validated interactome map.
Step 3: Metabolic Interactome Mapping. After obtaining thedependency measure for every metabolite pair in the data, thenetwork was constructed by connecting pairs that have strongdependencies exceeding a predefined threshold value. For each
Integrative Top-Down System Metabolic Modeling research articles
The Journal of Proteome Research • Vol. 7, No. 2, 2008 499
toxin and dose regimen, this threshold was chosen so as toobtain a number of dependency relations of the same order ofmagnitude as the number of metabolites measured and henceto avoid overfitting the model to the data.
Step 4: Robustness Validation. Here, we employed 10-foldcross-validation,26 which is a widely used test of model robust-ness. First, a data set is divided at random into 10 subsets. Thefirst nine are used to build a model using the technique undertest, which is used to predict the values in the tenth. Theprocess can then be repeated nine times: each of the first toninth subsets can take a turn as the one to be predicted, usinga model built with the others. Therefore, 10 scores can beobtained, and the mean score is defined to be the result of therobustness test.
To make a fair test, the values corresponding to each toxinand to low or high dose samples were tested separately.Therefore, our low dose hydrazine data, consisting of 19metabolite values (quantized fold changes ranging from 1 to5) for each of 75 samples, were divided by sample at randominto subgroups of approximately seven. An interactome mapwas built using the values for nine of these subsets and usedto predict the values in the tenth subset, and the whole processrepeated nine times as described above. The mean robustnessscore obtained for all metabolites was 67%; therefore, we can
say that if predicting the value (1 to 5) of a metabolite usingan interactome map, we would expect to get the right answerabout 7 times out of 10 (i.e., 3.5 times better than guessing).The corresponding scores for low dose ANIT, and high dosehydrazine and ANIT, were 70%, 49%, and 52%, respectively. Ina spirit of nonbias, data for all time points have been used inthese calculations, including the predose samples; therefore,the scores are conservative compared to what might beobtained for a larger study in which comparable dose regimesand time points could both be tested separately.
Results and Discussion
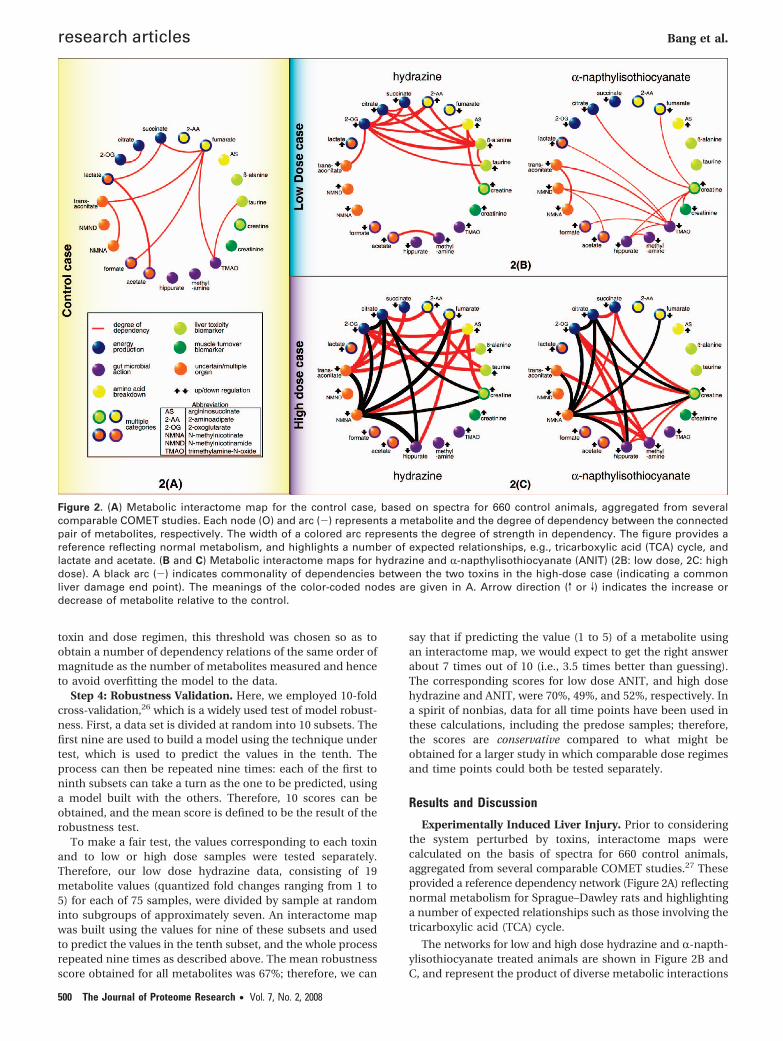
Experimentally Induced Liver Injury. Prior to consideringthe system perturbed by toxins, interactome maps werecalculated on the basis of spectra for 660 control animals,aggregated from several comparable COMET studies.27 Theseprovided a reference dependency network (Figure 2A) reflectingnormal metabolism for Sprague–Dawley rats and highlightinga number of expected relationships such as those involving thetricarboxylic acid (TCA) cycle.
The networks for low and high dose hydrazine and R-napth-ylisothiocyanate treated animals are shown in Figure 2B andC, and represent the product of diverse metabolic interactions
Figure 2. (A) Metabolic interactome map for the control case, based on spectra for 660 control animals, aggregated from severalcomparable COMET studies. Each node (O) and arc (-) represents a metabolite and the degree of dependency between the connectedpair of metabolites, respectively. The width of a colored arc represents the degree of strength in dependency. The figure provides areference reflecting normal metabolism, and highlights a number of expected relationships, e.g., tricarboxylic acid (TCA) cycle, andlactate and acetate. (B and C) Metabolic interactome maps for hydrazine and R-napthylisothiocyanate (ANIT) (2B: low dose, 2C: highdose). A black arc (-) indicates commonality of dependencies between the two toxins in the high-dose case (indicating a commonliver damage end point). The meanings of the color-coded nodes are given in A. Arrow direction (v or V) indicates the increase ordecrease of metabolite relative to the control.
research articles Bang et al.
500 The Journal of Proteome Research • Vol. 7, No. 2, 2008
in numerous tissues (Table 1). Results pertaining to the toxin-disrupted systems have been expressed as deviations from thebasal network. Many dependencies center on major metabo-lites that form hubs in the network, for example, 2-oxoglutarate(hydrazine case, Figure 2B). The characteristic increase in thenumber of significant dependencies after toxin treatment ismarked as is the variation with dose and partial convergenceat high dose for both toxins (Figure 2C). It should be notedthat the administration of a toxin may cause temporary changesin appetite in experimental animals,34 but in our studies therewas no evidence of fasting ketosis for either toxin even at highdose.
Pronounced differences in the metabolic responses at bothdoses of each compound are observed, as would be expectedfrom their mechanistic toxicological differences. However, athigh doses the interactome maps for each compound-disruptedsystem share a core pattern of perturbed metabolite depend-encies (Figure 2C). This convergence of network interaction isconsistent with the observation that during liver damage themechanism-specific metabolic features of the network arepartially replaced by features typical of a general metabolicfailure pattern indicative of overt end-point cellular damagecommon to both toxins, that is, there are overriding convergentmetabolic features that are a consequence of liver injury. Atlow doses, where the effects are readily reversible, the networksare highly toxin-specific (Figure 2B), that is, relate to pharma-cological and mechanistic changes, and share no commonpathway disruptions. Generally, the strengths of the metabolite
dependencies vary considerably according to compound typeand dose. Also, high dose hydrazine yields relationships withdependency values approaching unity, whereas ANIT at lowdose gives weaker values (∼0.25), and this is consistent withhistopathology data suggesting that the level of observeddamage is lower with ANIT. For both toxins, the specificmetabolic networks observed at low dose collapse at high dose,and new dependencies are formed (Figure 2B and C).
Short-Range Dependency Relationships. Many metabolitedependencies can be described as short-range, indicatinglinkage by a relatively small number of enzymatic steps in aspecific metabolic pathway (these are particularly evident atlow dose). These are amenable to biochemical interpretationusing conventional knowledge of metabolism and generallyoccur within a single cellular system. For example, the robustdependency (hydrazine case, Figure 2B) between 2-aminoadi-pate (2-AA) and 2-oxoglutarate (2-OG) can be explained bydisruption of the lysine catabolic pathway, where both me-tabolites are substrates of the enzyme 2-AA aminotransferase.24
This is closely associated with the secondary neurotoxic effectsof hydrazine due to pathway disruption in the hippocampus.35
Likewise, the linkage of creatine to creatinine via the creatinephosphokinase catalyzed reaction to creatine phosphate isconsistent with the strong dependency observed in the ANITnetwork (ANIT case, Figure 2B). The TCA cycle dependenciesare also short-range in terms of the number of enzymatic stepsbetween compounds and in the sense that the reactions arecolocated within the mitochondria (hydrazine case, Figure 2B).
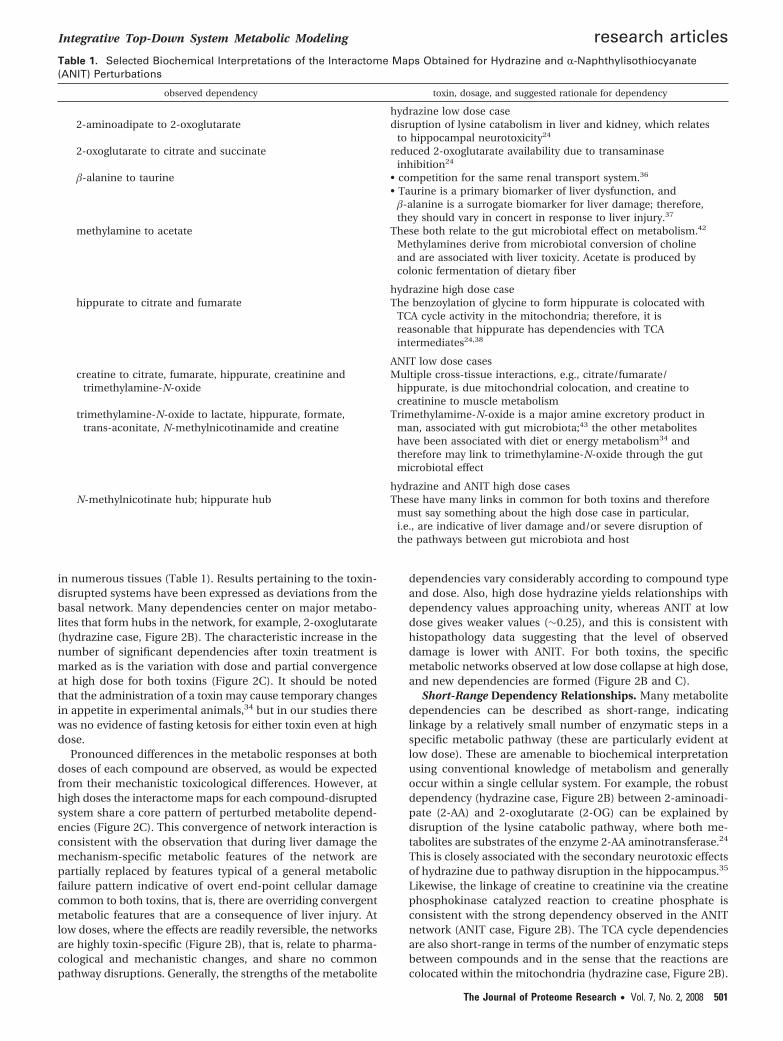
Table 1. Selected Biochemical Interpretations of the Interactome Maps Obtained for Hydrazine and R-Naphthylisothiocyanate(ANIT) Perturbations
observed dependency toxin, dosage, and suggested rationale for dependency
hydrazine low dose case2-aminoadipate to 2-oxoglutarate disruption of lysine catabolism in liver and kidney, which relates
to hippocampal neurotoxicity24
2-oxoglutarate to citrate and succinate reduced 2-oxoglutarate availability due to transaminaseinhibition24
�-alanine to taurine • competition for the same renal transport system.36
• Taurine is a primary biomarker of liver dysfunction, and�-alanine is a surrogate biomarker for liver damage; therefore,they should vary in concert in response to liver injury.37
methylamine to acetate These both relate to the gut microbiotal effect on metabolism.42
Methylamines derive from microbiotal conversion of cholineand are associated with liver toxicity. Acetate is produced bycolonic fermentation of dietary fiber
hydrazine high dose casehippurate to citrate and fumarate The benzoylation of glycine to form hippurate is colocated with
TCA cycle activity in the mitochondria; therefore, it isreasonable that hippurate has dependencies with TCAintermediates24,38
ANIT low dose casescreatine to citrate, fumarate, hippurate, creatinine and
trimethylamine-N-oxideMultiple cross-tissue interactions, e.g., citrate/fumarate/
hippurate, is due mitochondrial colocation, and creatine tocreatinine to muscle metabolism
trimethylamine-N-oxide to lactate, hippurate, formate,trans-aconitate, N-methylnicotinamide and creatine
Trimethylamime-N-oxide is a major amine excretory product inman, associated with gut microbiota;43 the other metaboliteshave been associated with diet or energy metabolism34 andtherefore may link to trimethylamine-N-oxide through the gutmicrobiotal effect
hydrazine and ANIT high dose casesN-methylnicotinate hub; hippurate hub These have many links in common for both toxins and therefore
must say something about the high dose case in particular,i.e., are indicative of liver damage and/or severe disruption ofthe pathways between gut microbiota and host
Integrative Top-Down System Metabolic Modeling research articles
The Journal of Proteome Research • Vol. 7, No. 2, 2008 501
Long-Range Dependency Relationships. We also observedwhat can be considered long-range dependencies betweenpairs of metabolites, that is, those that can only be connectedvia many intermediate enzymatic steps in a specific metabolicpathway, and hence are harder to explain in pathway terms.For example, �-alanine acts as a hub metabolite from whichlong-range dependencies to several TCA cycle intermediatesderive (hydrazine case, Figure 2B); these can be connected viaglutamate decarboxylase and L-aspartate in KEGG. Similarly,dependencies spanning multiple biochemical cycles can alsobe demonstrated; the dependency of argininosuccinate to 2-OGsuggests a long-range interaction between the TCA and ureacycles.
Wormhole Effects. Most intriguing, however, are metabolitedependencies that involve multiple subsystems, physiologicalinteractions, or transport mechanisms and that cannot beexplained by conventional metabolic pathways at all, whichcan be thought of as wormhole connections. For example, thedependency between taurine and �-alanine (hydrazine case,Figure 2B) may occur because these compounds can competefor the same renal transport system.36 This causes a physi-ological link at the renal tubule level so that taurine metabolismhas a remote effect on �-alanine reabsorption from the urine.Individual modulations in the levels of urinary taurine and�-alanine have been previously reported as biomarkers ofgeneral hepatotoxicity, although the excretion of the latter hasbeen attributed to concomitant renal failure.37 The depend-encies linking hippurate with citrate and with 2-OG (Figure 2C)also identify a shared cellular compartment (mitochondria);here, benzoic acid of gut microbiotal origin17 is conjugated withglycine via a mitochondrial acetyl-Coenzyme A activation stepto form hippuric acid,38 in colocation with the topographicalcenter for TCA cycle activity. This illustrates the ability of invivo interactome maps to transcend species boundaries andallow virtual linkage of the mammalian primary metabolome(under host genomic control) with the cometabolome, whichis partly under symbiotic gut microbial control.17 The impor-tance of transgenomic cometabolic interactions in the develop-ment of many disease states is now well documented,1,2,17 andour new modeling approach appears ideally suited to probingsuch system complexity.
Conclusions
The use of metabolic interactome maps provides automatedidentification of metabolite dependencies for the rat undergo-ing toxic challenge from model drugs, enabling the visualizationof short- and long-range metabolite dependencies, confirmingknown relationships between compounds, and identifyingrelationships that can result from interactions beyond currentlyestablished metabolic pathway maps. There is no need for priorknowledge of any underlying network of enzymes or transport-ers; therefore, the method could be used to generate hypoth-eses on undiscovered virtual pathways.
Data used here to construct these maps encompass allsampling times and hence do not directly capture the temporalprogression of the toxic lesions, which we have previouslymodeled using other methods.30,39–41,44 Nevertheless, the methodcould be extended to model the dynamics of dependencyrelationships.
Unlike mathematical models derived for single cell systemsor simple organisms such as yeast, interactome maps ofbiofluids can capture the metabolic cross-talk between spatiallydisparate tissues and organs, providing a more holistic view of
the metabolic status of complex organisms. Thus, with furtherdevelopment, a range of genetic and environmental factorsincluding nutritional states, level of oxidative stress, age,hormone levels, and so forth might be visualized in terms ofmetabolic network activity.
Abbreviations: NMR, nuclear magnetic resonance; KEGG,Kyoto Encyclopedia of Genes and Genomes; BST, biochemicalsystems theory; MCA, metabolic control analysis; FBA, fluxbalance analysis; ANIT, R-napthylisothiocyanate; TCA, tricar-boxylic acid; 2-AA, 2-aminoadipate; 2-OG, 2-oxoglutarate.
Acknowledgment. We thank C. Caulcott, N. Cooper,C. Rawlings, S.-I. Bang, T. Ebbels, and R. Chaleil fordiscussions and S. Islam for technical support. This workwas supported by a Department of Trade and Industry (DTI)Beacon project and partially supported by METAGRAD. Weare grateful to COMET researchers for histopathologyresults, in particular, Glenn Cantor, Eric Destexhe, VibekeAarup, and Zuhal Thorsteinsson, and to the COMET projectas a whole for access to raw NMR data.
References(1) Nicholson, J. K.; Wilson, I. D. Understanding ‘global’ systems
biology: metabonomics and the continuum of metabolism. Nat.Rev. Drug Discovery 2003, 2, 668–676.
(2) Nicholson, J. K.; Holmes, E.; Lindon, J. C.; Wilson, I. D. Thechallenges of modeling mammalian biocomplexity. Nat. Biotech-nol. 2004, 22, 1268–1274.
(3) Nicholson, J. K. Global systems biology, personalized medicine andmolecular epidemiology. Mol. Syst. Biol. 2006, 2, 52.
(4) Tomita, M. E-CELL: software environment for whole-cell simula-tion. Bioinformatics 1999, 15, 72–84.
(5) Hood, L. Systems biology: integrating technology, biology, andcomputation. Mech. Ageing Dev. 2003, 124 (1), 9–16.
(6) Xia, Y. Analyzing cellular biochemistry in terms of molecularnetworks. Annu. Rev. Biochem. 2004, 73, 1051–1087.
(7) Green, M. L.; Karp, P. D. A Bayesian method for identifying missingenzymes in predicted metabolic pathway databases. BMC Bioinf.2004, 5, 76.
(8) Jeong, H.; Tombor, B.; Albert, R.; Oltvai, Z. N.; Barabási, A. L. Thelarge scale organisation of metabolic networks. Nature 2000, 407,651–653.
(9) Ravasz, E.; Somera, L.; Mongru, D. A.; Oltvai, Z. N.; Barabási, A. L.Hierarchical organization of modularity in metabolic networks.Science. 2002, 297, 1551–1555.
(10) Papin, J. A.; Price, N. D.; Wiback, S. J.; Fell, D. A.; Palsson, B. O.Metabolic pathways in the post-genome era. Trends Biochem. Sci.2003, 28 (5), 250–258.
(11) Goodwin, B. C. Oscillatory Organization in Cells, a Dynamic Theoryof Cellular Control Processes; Academic Press: New York, 1963.
(12) Hess, B.; Boiteux, A. Mechanism of glycolytic oscillation in yeast.I. Aerobic and anaerobic growth conditions for obtaining glycolyticoscillation. Hoppe-Seyler’s Z. Physiol. Chem. 1968, 349 (11), 1567–1574.
(13) Tyson, J. J.; Othmer, H. G. The dynamics of feedback controlcircuits in biochemical pathways. Prog. Theor. Biol. 1978, 5, 1–62.
(14) Edwards, J. S.; Ramakrishna, R.; Schilling, C. H.; Palsson, B. O.Metabolic Flux Balance Analysis. In Metabolic Engineering, Lee,S. Y., and Papoutsakis, E. T., Eds.; Marcel Dekker: New York, 1999.
(15) Friedman, N.; Linial, M.; Nachman, I.; Pe’er, D. Using Bayesiannetworks to analyze expression data. J. Comput. Biol. 2000, 7, 601–620.
(16) Imoto, S.; Goto, T.; Miyano, S. Estimation of genetic networks andfunctional structures between genes by using Bayesian networksand nonparametric regression. Pac. Symp. Biocomput. 2002, 175–186.
(17) Nicholson, J. K.; Holmes, E.; Wilson, I. D. Gut microorganisms,mammalian metabolism and personalized health care. Nat. Rev.Microbiol. 2005, 3, 431–438.
(18) Brindle, J. T.; Antti, H; Holmes, E. Rapid and noninvasive diagnosisof the presence and severity of coronary heart disease using 1H-NMR-based metabonomics. Nature Med. 2002, 8 (12), 1439–1444.
(19) Pearl, J. Probabilistic reasoning in intelligent systems: networksof plausible inference, Morgan Kaufmann, San Mateo CA. 1988.
research articles Bang et al.
502 The Journal of Proteome Research • Vol. 7, No. 2, 2008
(20) Beaumont, M. A.; Rannala, B. The Bayesian revolution in genetics.Nat. Rev. Genet. 2004, 5 (4), 251–261.
(21) Stoyanova, R.; Nicholson, J. K.; Lindon, J. C.; Brown, T. R. Sampleclassification based on Bayesian spectral decomposition of me-tabonomic NMR data sets. Anal. Chem. 2004, 76 (13), 3666–3674.
(22) Bollard, M. E.; Keun, H; Beckonert, O.; Ebbels, T. M. D.; Antti, H.;Nicholls, A. W.; Shockcor, J. P.; Cantor, G. H.; Stevens, G.; Lindon,J. C.; Holmes, E.; Nicholson, J. K. Comparative metabonomics ofdifferential hydrazine toxicity in the rat and mouse. Toxicol. Appl.Pharmacol. 2005, 204, 135–151.
(23) Garrod, S.; Bollard, M. E.; Nicholls, A. W.; Connor, S. C.; Connelly,J.; Nicholson, J. K.; Holmes, E. Integrated metabonomic analysisof the multiorgan effects of hydrazine toxicity in the rat. Chem.Res. Toxicol. 2005, 18, 115–122.
(24) Nicholls, A. W.; Holmes, E.; Lindon, J. C.; Shockcor, J. P.; DuncanFarrant, R.; Haselden, J. N.; Damment, S. J. P.; Waterfield, C. J.;Nicholson, J. K. Metabonomic investigations into hydrazine toxicityin the rat. Chem. Res. Toxicol. 2001, 14, 975–978.
(25) Waters, N. J.; Holmes, E.; Williams, A.; Waterfield, C. J.; DuncanFarrant, R.; Nicholson, J. K. NMR and pattern recognition studieson the time-related metabolic effects of R-naphthylisothiocyanateon liver, urine and plasma in the rat: an integrative metabonomicapproach. Chem. Res. Toxicol. 2001, 14, 1401–1412.
(26) Hastie, T.; Tibshirani, R.; Friedman, J. H. The Elements of StatisticalLearning: Data Mining, Inference and Prediction; Springer: NewYork, 2001.
(27) Lindon, J. C.; Nicholson, J. K.; Holmes, E.; Antti, H.; Bollard, M. E.;Keun, H.; Beckonert, O.; Ebbels, T. M.; Reily, M. D.; Robertson,D.; Stevens, G. J.; Luke, P.; Breau, A. P.; Cantor, G. H.; Bible, R. H.;Niederhauser, U.; Senn, H.; Schlotterbeck, G.; Sidelmann, U. G.;Laursen, S. M.; Tymiak, A.; Car, B. D.; Lehman-McKeeman, L.;Colet, J.-M.; Loukaci, A.; Thomas, C. Contemporary issues intoxicology. The role of metabonomics in toxicology and itsevaluation by the COMET project. Toxicol. Appl. Pharmacol. 2003,187, 137-146.
(28) Keun, H. C.; Ebbels, T. M.; Antti, H.; Bollard, M. E.; Beckonert, O.;Schlotterbeck, G.; Senn, H.; Niederhauser, U.; Holmes, E.; Lindon,J. C.; Nicholson, J. K. Analytical reproducibility in 1H NMR-basedmetabonomic urinalysis. Chem. Res. Toxicol. 2002, 15, 1380–1386.
(29) Claridge, T. D. W. High-Resolution NMR Techniques in OrganicChemistry; Elsevier: New York, 1999.
(30) Keun, H. C.; Ebbels, T. M. D.; Antti, H.; Bollard, M. E.; Beckonert,O.; Holmes, E.; Lindon, J. C.; Nicholson, J. K. Improved analysisof multivariate data by variable stability scaling: application toNMR-based metabolic profiling. Anal. Chim. Acta 2003, 490, 265–276.
(31) Crockford, D. J.; Keun, H. C.; Smith, L. M.; Holmes, E.; Nicholson,J. K. Curve-fitting method for direct quantitation of compoundsin complex biological mixtures using1H NMR: application inmetabonomic toxicology studies. Anal. Chem. 2005, 77, 4556–4562.
(32) Steuer, R.; Kurths, J.; Daub, C. O.; Weise, J.; Selbig, J. The mutualinformation: Detecting and evaluating dependencies betweenvariables. Bioinformatics 2002, 18 (Suppl. 2), S231–S240.
(33) Bang, J.-W.; Gillies, D. Using Bayesian Networks with Hidden Nodesto Recognize Neural Cell Morphology; Springer-Verlag: Tokyo,Japan, 2002.
(34) Connor, S. C.; Wu, W.; Sweatman, B. C.; Manini, J.; Haselden, J. N.;Crowther, D. J.; Waterfield, C. J. Effects of feeding and body weightloss on the 1H-NMR-based urine metabolic profiles of male WistarHan rats: implications for biomarker discovery. Biomarkers 2004,9(2), 156–179.
(35) Wu, H. Q.; Ungerstedt, U.; Schwarcz, R. L-R-aminoadipic acid asa regulator of kynurenic acid production in the hippocampus: amicrodialysis study in freely moving rats. Eur. J. Pharmacol. 1995,281 (1), 55–61.
(36) Jessen, H.; Sheikh, M. I. Renal transport of taurine in luminalmembrane vesicles from rabbit proximal tubule. Biochim. Biophys.Acta 1991, 1064 (2), 189–198.
(37) Waterfield, C. J.; Turton, J. A.; Scales, M. D.; Timbrell, J. A.Investigations into the effects of various hepatotoxic compoundson urinary and liver taurine levels in rats. Arch. Toxicol. 1993, 67,244–254.
(38) Krähenbühl, L.; Reichen, J.; Talos, C.; Krähenbühl, S. Benzoic acidmetabolism reflects hepatic mitochondrial function in rats withlong-term extrahepatic cholestasis. Hepatology 1997, 25 (2), 278–283.
(39) Holmes, E.; Bonner, F. W.; Sweatman, B. C.; Lindon, J. C; Beddell,C. R.; Rahr, E.; Nicholson, J. K. Nuclear magnetic resonancespectroscopy and pattern recognition analysis of the biochemicalprocesses associated with the progression of and recovery fromnephrotoxic lesions in the rat induced by mercury(II) chloride and2-bromoethanamine. Mol. Pharmacol. 1992, 42 (5), 922–930.
(40) Azmi, J.; Griffin, J.; Antti, H.; Shore, R. F.; Johansson, E.; Nicholson,J. K.; Holmes, E. Metabolic trajectory characterisation of xenobi-otic-induced hepatotoxic lesions using statistical batch processingof NMR data. The Analyst 2002, 127 (2), 271–276.
(41) Ebbels, T.; Keun, H.; Beckonert, O. Toxicity classification frommetabonomic data using a density superposition approach:‘CLOUDS’. Anal. Chim. Acta 2003, 490, 109–122.
(42) Dumas, M. E.; Barton, R. H.; Toye, A.; Cloarec, O.; Blancher, C.;Rothwell, A.; Fearnside, J.; Tatout, R.; Blanc, V.; Lindon, J. C.;Mitchell, S. C.; Holmes, E.; McCarthy, M. I.; Scott, J.; Gauguier,D.; Nicholson, J. K. Metabolic profiling reveals a contribution ofgut microbiota to fatty liver phenotype in insulin-resistant mice.Proc. Natl. Acad. Sci. U.S.A. 2006, 103 (33), 12511–12516.
(43) Mitchell, S. C.; Bollard, M. E.; Zhang, A. Short-chain aliphaticamines in human urine: a mathematical examination of metabolicinterrelationships. Metab., Clin. Exp. 2007, 56, 19–23.
(44) Ebbels, T. M. D.; Keun, H. C.; Beckonert, O. P.; Bollard, M. E.;Lindon, J. C.; Holmes, E.; Nicholson, J. K. Prediction and clas-sification of drug toxicity using probabilistic modeling of temporalmetabolic data: the consortium on metabonomic toxicologyscreening approach. J. Proteome Res. 2007, 6 (11), 4407–4422.
PR070350L
Integrative Top-Down System Metabolic Modeling research articles
The Journal of Proteome Research • Vol. 7, No. 2, 2008 503