intellectual property: enhanced: intellectual property landscape of the human genome
TRANSCRIPT
www.sciencemag.org SCIENCE VOL 310 14 OCTOBER 2005 239
Gene patents are the subject of con-siderable debate and yet, like theterm “gene” itself, the definition of
what constitutes a gene patent is fuzzy (1).Nonetheless, gene patents that seem to
cause the mostcontroversy arethose claiminghuman protein-
encoding nucleotide sequences. This cate-gory is the subject of our analysis of thepatent landscape of the human genome (2).
Critics describe the growth in genesequence patents as an intellectual property(IP) “land grab” over a f inite number ofhuman genes (3, 4). They suggest thatoverly broad patents might block follow-onresearch (5). Alternatively, gene IP rightsmay become highly fragmented and causean anticommons effect, imposing highcosts on future innovators and underuse ofgenomic resources (6). Both situations,critics argue, would increase the costs ofgenetic diagnostics, slow the developmentof new medicines, stifle academic research,and discourage investment in downstreamR&D (7–11).
In contrast, the classic argument in sup-port of gene patenting is that strong IP pro-tection provides incentives crucial to down-stream investment (12, 13) and the disclo-sure of inventions. Patents are also regardedas the cornerstone of vibrant markets forideas (14) and central to the biotech boomof the 1980s and 1990s (15).
Policy-makers are hampered by the lackof empirical data on the extent of genepatenting. Most analyses have relied onanecdotal evidence (11, 16–18) and empiri-cal analyses have been hindered by (i) lim-ited (and poorly defined) coverage of DNAsequence patents (17, 19); (ii) difficultyseparating patents that claim genesequences per se from those merely disclos-ing DNA sequences (20–22); and (iii) dis-
tinguishing patents on the human genomefrom those on other species (23).
Our detailed map was developed usingbioinformatics methods to comparenucleotide sequences claimed in U.S. patentsto the human genome. Specifically, this mapis based on a BLAST (24) homology searchlinking nucleotide sequences disclosed andclaimed in granted U.S. utility patents to theset of protein-encoding messenger RNAtranscripts contained in the National Centerfor Biotechnology Information (NCBI)RefSeq (25) and Gene (26) databases. Thismethod allows us to mapgene-oriented IP rights tospecific physical loci onthe human genome (27)(see figure, right). Ourapproach is highly spe-cific in its identificationof patents that actuallyclaim human nucleotidesequences. However, bylimiting the search topatents using the canoni-cal “SEQ ID NO” claimlanguage we do not con-sider claims on genesdefined through aminoacid sequences. (Seetable S1 for a sensitivityanalysis.)
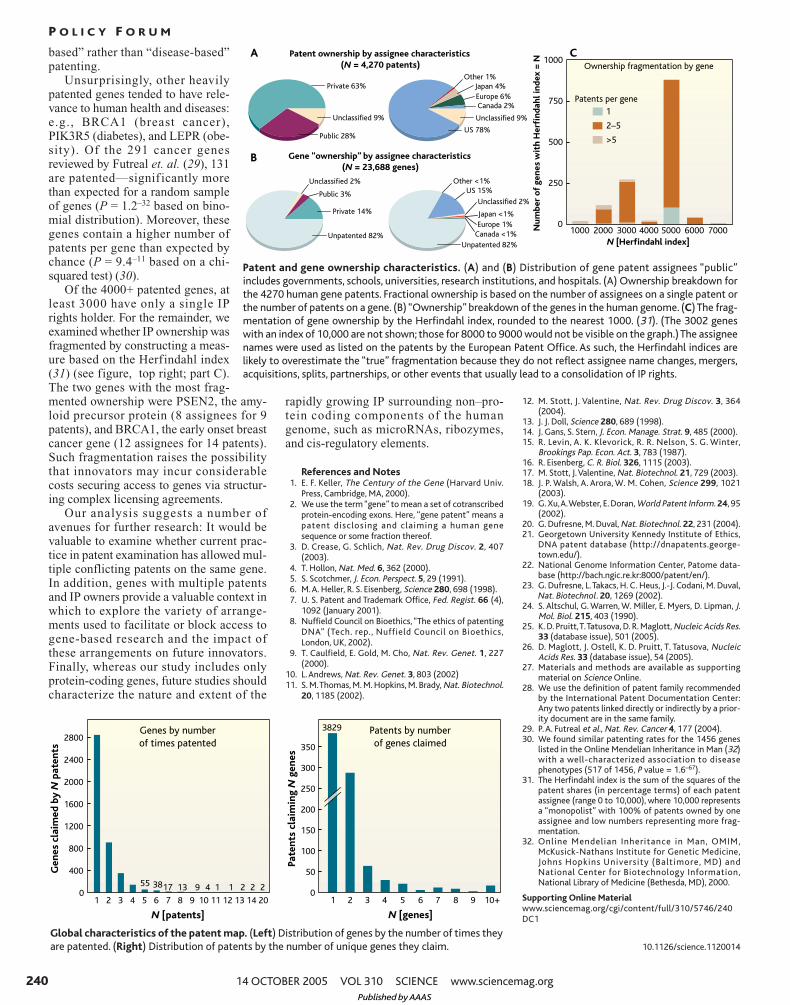
Our results reveal thatnearly 20% of humangenes are explicitlyclaimed as U.S. IP. Thisrepresents 4382 of the 23,688 of genes in theNCBI’s gene database at the time of writing(see figure, right). These genes are claimed in4270 patents within 3050 patent families (28).Although this number is low compared withprior reports, a distinction should be madebetween sequences that are explicitly claimedand those that are merely disclosed, whichoutnumber claimed sequences roughly 10:1.The 4270 patents are owned by 1156 differentassignees (with no adjustments for mergersand acquisition activity, subsidiaries, orspelling variations). Roughly 63% areassigned to private firms (see figure, above).Of the top ten gene patent assignees, nine areU.S.-based, including the University of
California, Isis Pharmaceuticals, the formerSmithKline Beecham, and Human GenomeSciences. The top patent assignee is IncytePharmaceuticals/Incyte Genomics, whose IPrights cover 2000 human genes, mainly foruse as probes on DNA microarrays.
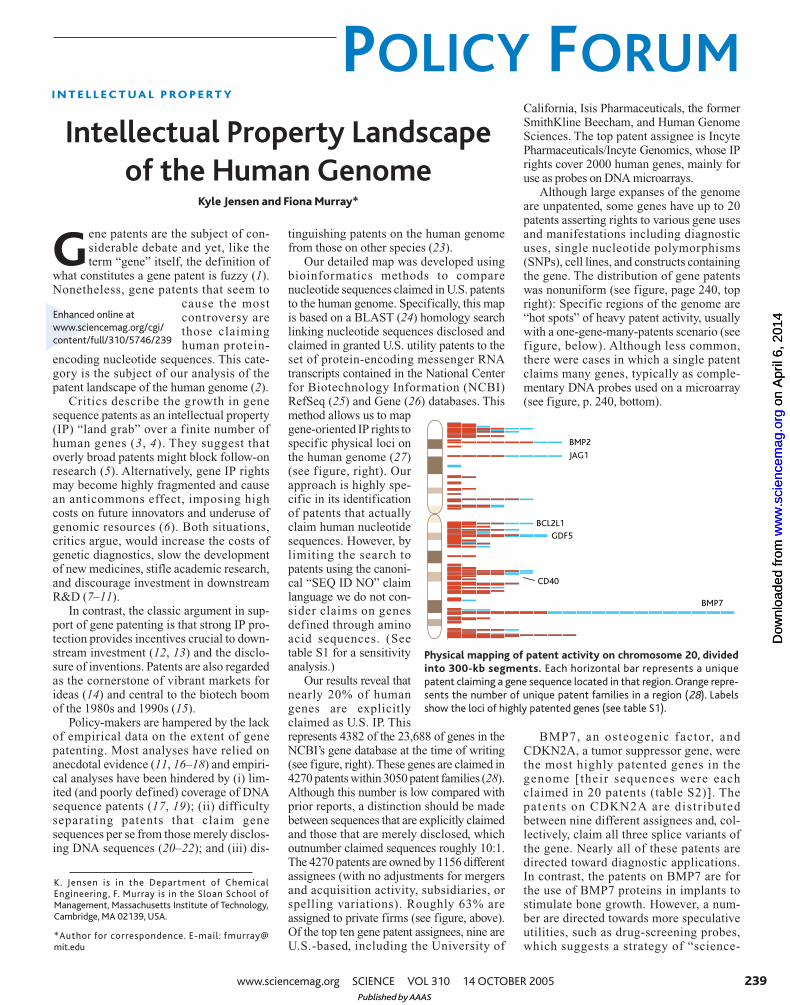
Although large expanses of the genomeare unpatented, some genes have up to 20patents asserting rights to various gene usesand manifestations including diagnosticuses, single nucleotide polymorphisms(SNPs), cell lines, and constructs containingthe gene. The distribution of gene patentswas nonuniform (see figure, page 240, topright): Specific regions of the genome are“hot spots” of heavy patent activity, usuallywith a one-gene-many-patents scenario (seef igure, below). Although less common,there were cases in which a single patentclaims many genes, typically as comple-mentary DNA probes used on a microarray(see figure, p. 240, bottom).
BMP7, an osteogenic factor, andCDKN2A, a tumor suppressor gene, werethe most highly patented genes in thegenome [their sequences were eachclaimed in 20 patents (table S2)]. Thepatents on CDKN2A are distributedbetween nine different assignees and, col-lectively, claim all three splice variants ofthe gene. Nearly all of these patents aredirected toward diagnostic applications.In contrast, the patents on BMP7 are forthe use of BMP7 proteins in implants tostimulate bone growth. However, a num-ber are directed towards more speculativeutilities, such as drug-screening probes,which suggests a strategy of “science-
I N T E L L E C T U A L P R O P E R T Y
Intellectual Property Landscape
of the Human GenomeKyle Jensen and Fiona Murray*
K. Jensen is in the Department of ChemicalEngineering, F. Murray is in the Sloan School ofManagement, Massachusetts Institute of Technology,Cambridge, MA 02139, USA.
*Author for correspondence. E-mail: [email protected]
POLICY FORUM
BMP7
BMP2
JAG1
BCL2L1
CD40
GDF5
Physical mapping of patent activity on chromosome 20, dividedinto 300-kb segments. Each horizontal bar represents a uniquepatent claiming a gene sequence located in that region. Orange repre-sents the number of unique patent families in a region (28). Labelsshow the loci of highly patented genes (see table S1).
Enhanced online atwww.sciencemag.org/cgi/content/full/310/5746/239
Published by AAAS
on
Apr
il 6,
201
4w
ww
.sci
ence
mag
.org
Dow
nloa
ded
from
o
n A
pril
6, 2
014
ww
w.s
cien
cem
ag.o
rgD
ownl
oade
d fr
om
240
based” rather than “disease-based”patenting.
Unsurprisingly, other heavilypatented genes tended to have rele-vance to human health and diseases:e.g., BRCA1 (breast cancer),PIK3R5 (diabetes), and LEPR (obe-sity). Of the 291 cancer genesreviewed by Futreal et. al. (29), 131are patented—signif icantly morethan expected for a random sampleof genes (P = 1.2–32 based on bino-mial distribution). Moreover, thesegenes contain a higher number ofpatents per gene than expected bychance (P = 9.4–11 based on a chi-squared test) (30).
Of the 4000+ patented genes, atleast 3000 have only a single IPrights holder. For the remainder, weexamined whether IP ownership wasfragmented by constructing a meas-ure based on the Herfindahl index(31) (see figure, top right; part C).The two genes with the most frag-mented ownership were PSEN2, the amy-loid precursor protein (8 assignees for 9patents), and BRCA1, the early onset breastcancer gene (12 assignees for 14 patents).Such fragmentation raises the possibilitythat innovators may incur considerablecosts securing access to genes via structur-ing complex licensing agreements.
Our analysis suggests a number ofavenues for further research: It would bevaluable to examine whether current prac-tice in patent examination has allowed mul-tiple conflicting patents on the same gene.In addition, genes with multiple patentsand IP owners provide a valuable context inwhich to explore the variety of arrange-ments used to facilitate or block access togene-based research and the impact ofthese arrangements on future innovators.Finally, whereas our study includes onlyprotein-coding genes, future studies shouldcharacterize the nature and extent of the
rapidly growing IP surrounding non–pro-tein coding components of the humangenome, such as microRNAs, ribozymes,and cis-regulatory elements.
References and Notes1. E. F. Keller, The Century of the Gene (Harvard Univ.
Press, Cambridge, MA, 2000).2. We use the term “gene” to mean a set of cotranscribed
protein-encoding exons. Here, “gene patent” means apatent disclosing and claiming a human genesequence or some fraction thereof.
3. D. Crease, G. Schlich, Nat. Rev. Drug Discov. 2, 407(2003).
4. T. Hollon, Nat. Med. 6, 362 (2000).5. S. Scotchmer, J. Econ. Perspect. 5, 29 (1991).6. M.A. Heller, R. S. Eisenberg, Science 280, 698 (1998).7. U. S. Patent and Trademark Office, Fed. Regist. 66 (4),
1092 (January 2001).8. Nuffield Council on Bioethics, “The ethics of patenting
DNA” (Tech. rep., Nuffield Council on Bioethics,London, UK, 2002).
9. T. Caulfield, E. Gold, M. Cho, Nat. Rev. Genet. 1, 227(2000).
10. L.Andrews, Nat. Rev. Genet. 3, 803 (2002)11. S. M.Thomas, M. M. Hopkins, M. Brady, Nat. Biotechnol.
20, 1185 (2002).
12. M. Stott, J. Valentine, Nat. Rev. Drug Discov. 3, 364(2004).
13. J. J. Doll, Science 280, 689 (1998).14. J. Gans, S. Stern, J. Econ. Manage. Strat. 9, 485 (2000).15. R. Levin, A. K. Klevorick, R. R. Nelson, S. G. Winter,
Brookings Pap. Econ. Act. 3, 783 (1987).16. R. Eisenberg, C. R. Biol. 326, 1115 (2003).17. M. Stott, J.Valentine, Nat. Biotechnol. 21, 729 (2003).18. J. P. Walsh, A. Arora, W. M. Cohen, Science 299, 1021
(2003).19. G. Xu,A.Webster, E. Doran, World Patent Inform. 24, 95
(2002).20. G. Dufresne, M. Duval, Nat. Biotechnol. 22, 231 (2004).21. Georgetown University Kennedy Institute of Ethics,
DNA patent database (http://dnapatents.george-town.edu/).
22. National Genome Information Center, Patome data-base (http://bach.ngic.re.kr:8000/patent/en/).
23. G. Dufresne, L.Takacs, H. C. Heus, J.-J. Codani, M. Duval,Nat. Biotechnol. 20, 1269 (2002).
24. S. Altschul, G. Warren, W. Miller, E. Myers, D. Lipman, J.Mol. Biol. 215, 403 (1990).
25. K. D. Pruitt,T.Tatusova, D. R. Maglott, Nucleic Acids Res.33 (database issue), 501 (2005).
26. D. Maglott, J. Ostell, K. D. Pruitt, T. Tatusova, NucleicAcids Res. 33 (database issue), 54 (2005).
27. Materials and methods are available as supportingmaterial on Science Online.
28. We use the definition of patent family recommendedby the International Patent Documentation Center:Any two patents linked directly or indirectly by a prior-ity document are in the same family.
29. P.A. Futreal et al., Nat. Rev. Cancer 4, 177 (2004).30. We found similar patenting rates for the 1456 genes
listed in the Online Mendelian Inheritance in Man (32)with a well-characterized association to disease phenotypes (517 of 1456, P value = 1.6–67).
31. The Herfindahl index is the sum of the squares of thepatent shares (in percentage terms) of each patentassignee (range 0 to 10,000), where 10,000 representsa “monopolist” with 100% of patents owned by oneassignee and low numbers representing more frag-mentation.
32. Online Mendelian Inheritance in Man, OMIM,McKusick-Nathans Institute for Genetic Medicine,Johns Hopkins University (Baltimore, MD) andNational Center for Biotechnology Information,National Library of Medicine (Bethesda, MD), 2000.
Supporting Online Materialwww.sciencemag.org/cgi/content/full/310/5746/240DC1
10.1126/science.1120014
Canada <1%
Europe 1%
Japan <1%
Patent ownership by assignee characteristics(N = 4,270 patents)
A C
B Gene “ownership” by assignee characteristics(N = 23,688 genes)
Canada 2%Europe 6%
Japan 4%Other 1%
US 78%
Unclassified 9%
Private 63%
Public 28%
Unclassified 9%
Private 14%
Public 3%
Unclassified 2%
Unpatented 82%
Unclassified 2%
US 15%
Other <1%
1000 2000 3000 4000 5000 6000 7000
N [Herfindahl index]
0
250
500
750
1000
Num
be
r of g
en
es
wit
h H
erf
ind
ahl
ind
ex
= N
Ownership fragmentation by gene
Patents per gene
1
2–5
>5
Unpatented 82%
Patent and gene ownership characteristics. (A) and (B) Distribution of gene patent assignees “public”includes governments, schools, universities, research institutions, and hospitals. (A) Ownership breakdown forthe 4270 human gene patents. Fractional ownership is based on the number of assignees on a single patent orthe number of patents on a gene. (B) “Ownership” breakdown of the genes in the human genome. (C) The frag-mentation of gene ownership by the Herfindahl index, rounded to the nearest 1000. (31). (The 3002 geneswith an index of 10,000 are not shown; those for 8000 to 9000 would not be visible on the graph.) The assigneenames were used as listed on the patents by the European Patent Office. As such, the Herfindahl indices arelikely to overestimate the “true” fragmentation because they do not reflect assignee name changes, mergers,acquisitions, splits, partnerships, or other events that usually lead to a consolidation of IP rights.
1 2 3 4 5 6 7 8 9 10 11 12 13 14 20
N [patents]
0
400
800
1200
1600
2000
2400
2800
Ge
ne
s cl
aim
ed
by
N p
ate
nts
Genes by number
of times patented
1 2 3 4 5 6 7 8 9 10+
N [genes]
0
50
100
150
200
250
300
350
Pa
te
nts claiming
N g
en
es
Patents by number
of genes claimed
55 3817 13 9 4 1 1 2 2 2
3829
Global characteristics of the patent map. (Left) Distribution of genes by the number of times theyare patented. (Right) Distribution of patents by the number of unique genes they claim.
14 OCTOBER 2005 VOL 310 SCIENCE www.sciencemag.org
P O L I C Y F O R U M
Published by AAAS