interchange office portfolio - dra advisors · pdf filestaggered lease expirations, a history...
TRANSCRIPT
I NTE RCHANG EOFF ICE PORTFOLIO
Investment Summary
SU B U R BAN PH I LADE LPH IA
CAPITAL MAR KETS | I NSTITUTIONAL PROPE RTI ES
1.6 MILLION SF VALUE ADD INVESTMENT OPPORTUNITY

501 Office Center Drive | Fort WashingtonB
LEHIGH VALLEY TRANCHE
FORT WASHINGTON TRANCHEHORSHAM TRANCHE
BUCKS COUNTY TRANCHE
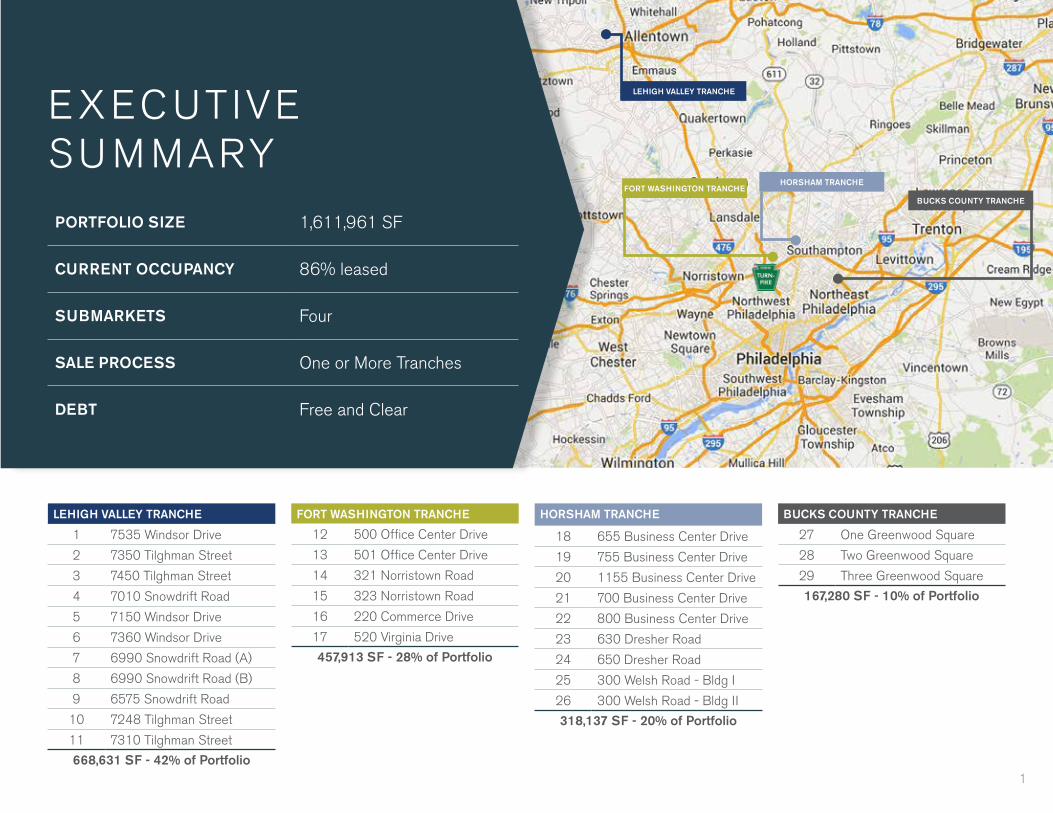
PORTFOLIO SIZE 1,611,961 SF
CURRENT OCCUPANCY 86% leased
SUBMARKETS Four
SALE PROCESS One or More Tranches
DEBT Free and Clear
LEHIGH VALLEY TRANCHE
1 7535 Windsor Drive
2 7350 Tilghman Street
3 7450 Tilghman Street
4 7010 Snowdrift Road
5 7150 Windsor Drive
6 7360 Windsor Drive
7 6990 Snowdrift Road (A)
8 6990 Snowdrift Road (B)
9 6575 Snowdrift Road
10 7248 Tilghman Street
11 7310 Tilghman Street
668,631 SF - 42% of Portfolio
FORT WASHINGTON TRANCHE
12 500 Office Center Drive
13 501 Office Center Drive
14 321 Norristown Road
15 323 Norristown Road
16 220 Commerce Drive
17 520 Virginia Drive
457,913 SF - 28% of Portfolio
HORSHAM TRANCHE
18 655 Business Center Drive
19 755 Business Center Drive
20 1155 Business Center Drive
21 700 Business Center Drive
22 800 Business Center Drive
23 630 Dresher Road
24 650 Dresher Road
25 300 Welsh Road - Bldg I
26 300 Welsh Road - Bldg II
318,137 SF - 20% of Portfolio
BUCKS COUNTY TRANCHE
27 One Greenwood Square
28 Two Greenwood Square
29 Three Greenwood Square
167,280 SF - 10% of Portfolio
EXECUTIVE SU M MARY
1
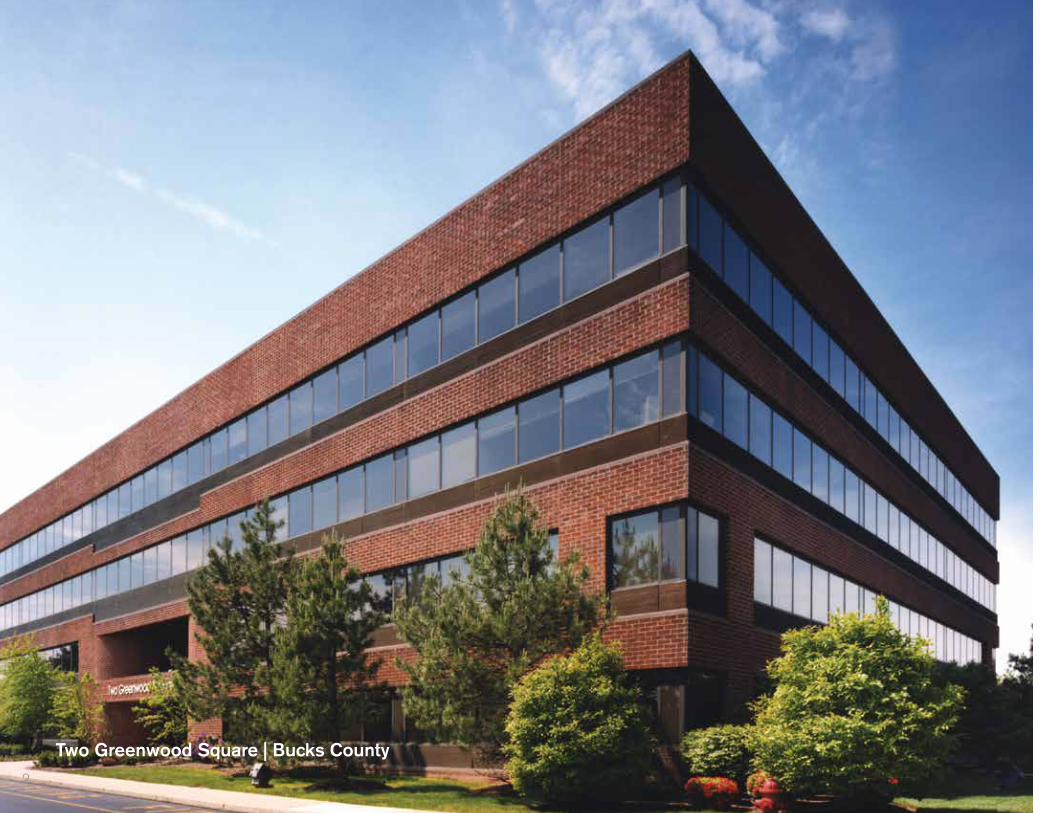
Two Greenwood Square | Bucks County2
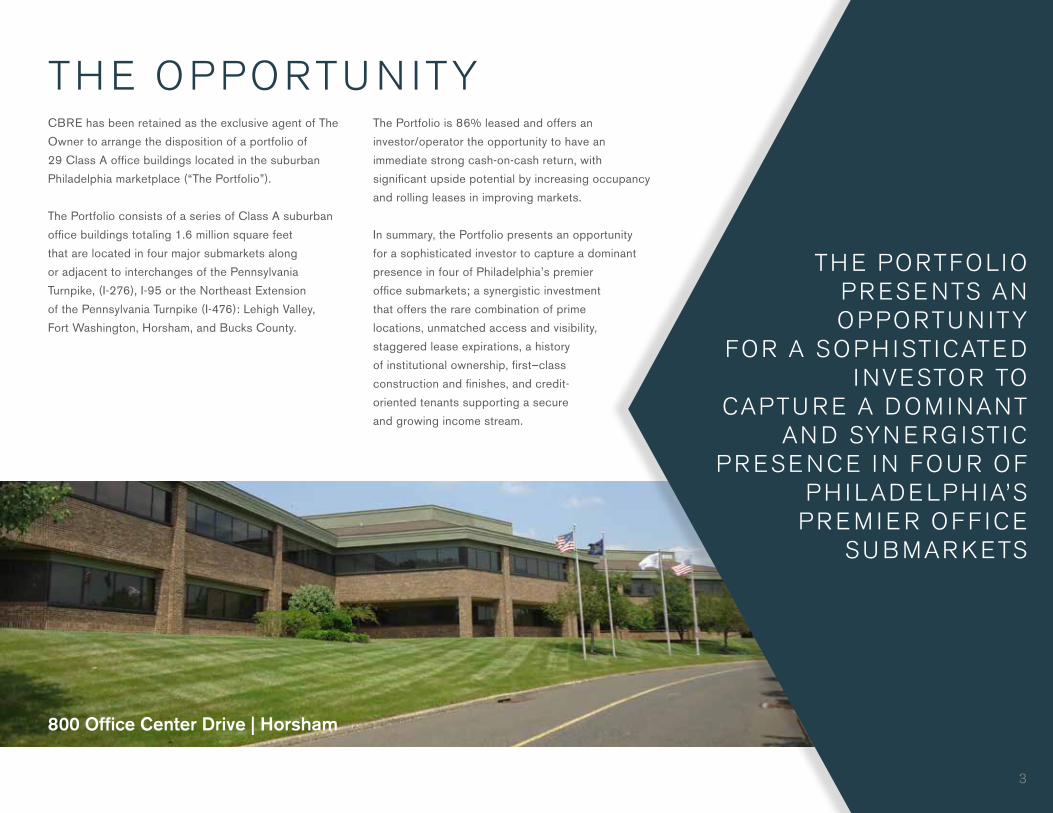
TH E OPPORTU N ITYCBRE has been retained as the exclusive agent of The
Owner to arrange the disposition of a portfolio of
29 Class A office buildings located in the suburban
Philadelphia marketplace (“The Portfolio”).
The Portfolio consists of a series of Class A suburban
office buildings totaling 1.6 million square feet
that are located in four major submarkets along
or adjacent to interchanges of the Pennsylvania
Turnpike, (I-276), I-95 or the Northeast Extension
of the Pennsylvania Turnpike (I-476): Lehigh Valley,
Fort Washington, Horsham, and Bucks County.
The Portfolio is 86% leased and offers an
investor/operator the opportunity to have an
immediate strong cash-on-cash return, with
significant upside potential by increasing occupancy
and rolling leases in improving markets.
In summary, the Portfolio presents an opportunity
for a sophisticated investor to capture a dominant
presence in four of Philadelphia’s premier
office submarkets; a synergistic investment
that offers the rare combination of prime
locations, unmatched access and visibility,
staggered lease expirations, a history
of institutional ownership, first–class
construction and finishes, and credit-
oriented tenants supporting a secure
and growing income stream.
TH E PORTFOLIO PR ESE NTS AN OPPORTU N ITY
FOR A SOPH ISTICATE D I NVESTOR TO
CAPTU R E A DOM I NANT AN D SYN E RG ISTIC
PR ESE NCE I N FOU R OF PH I LADE LPH IA’S
PR E M I E R OFF ICE SU B MAR KETS
800 Office Center Drive | Horsham
3
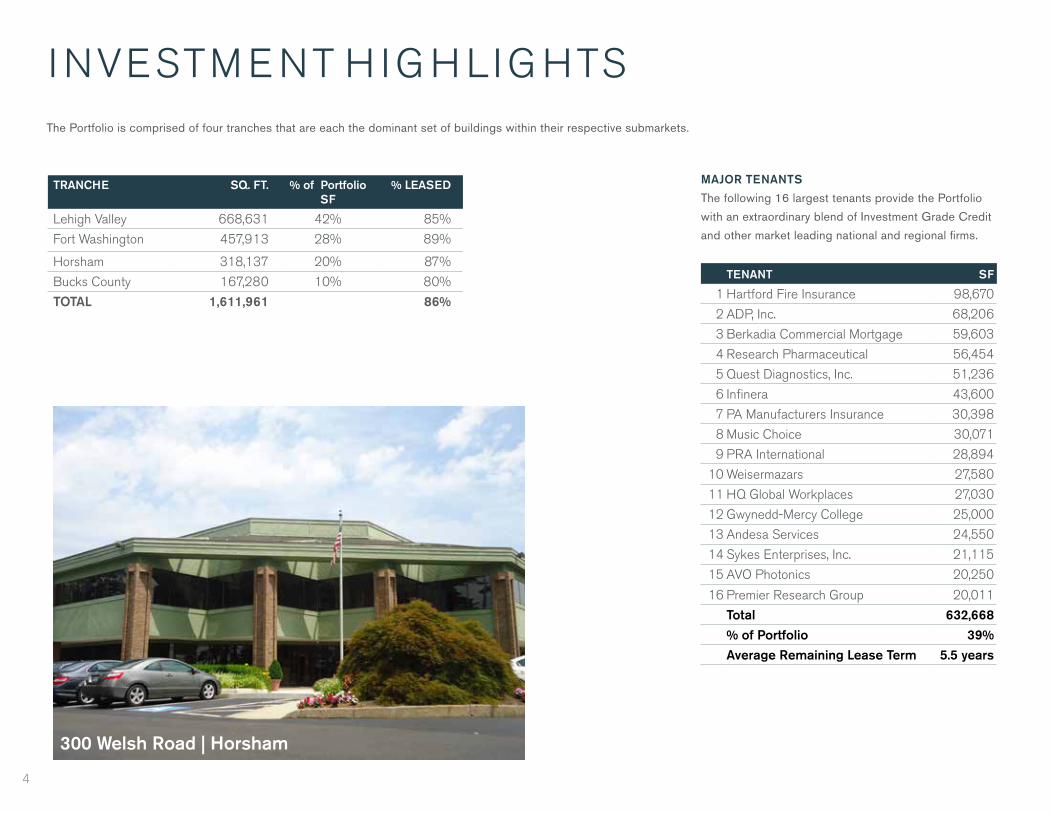
MAJOR TENANTS
The following 16 largest tenants provide the Portfolio
with an extraordinary blend of Investment Grade Credit
and other market leading national and regional firms.
TENANT SF
1 Hartford Fire Insurance 98,670
2 ADP, Inc. 68,206
3 Berkadia Commercial Mortgage 59,603
4 Research Pharmaceutical 56,454
5 Quest Diagnostics, Inc. 51,236
6 Infinera 43,600
7 PA Manufacturers Insurance 30,398
8 Music Choice 30,071
9 PRA International 28,894
10 Weisermazars 27,580
11 HQ Global Workplaces 27,030
12 Gwynedd-Mercy College 25,000
13 Andesa Services 24,550
14 Sykes Enterprises, Inc. 21,115
15 AVO Photonics 20,250
16 Premier Research Group 20,011
Total 632,668% of Portfolio 39%Average Remaining Lease Term 5.5 years
I NVESTM E NT H IG H LIG HTS
TRANCHE SQ. FT. % of Portfolio SF
% LEASED
Lehigh Valley 668,631 42% 85%
Fort Washington 457,913 28% 89%
Horsham 318,137 20% 87%
Bucks County 167,280 10% 80%
TOTAL 1,611,961 86%
The Portfolio is comprised of four tranches that are each the dominant set of buildings within their respective submarkets.
300 Welsh Road | Horsham
4
DOMINANT SUBMARKETS
The Portfolio is comprised of four tranches that are
located in separate and distinct submarkets along three
of the region’s primary highways: I-95; The Pennsylvania
Turnpike (I-276) and I-476. These submarkets, located
20-50 minutes from Center City Philadelphia, are
among the largest and strongest in the entire MSA.
DIVERSE AND HIGH QUALITY TENANT BASE
The Portfolio is 86% leased to a cross-section of
high quality, creditworthy tenants with a diverse lease
expiration schedule. None of the tenants exceed
5% of the total square footage of the Portfolio. This
diversification affords an investor the security of not
having significant exposure to any individual tenant,
industry or rollover year. Major tenants, above 20,000
square feet, are all credit worthy, account for almost
40% of the net rentable area of the Portfolio and have
an average remaining lease term of about 5.5 years.
CRITICAL MASS/OPERATING PLATFORM
The Portfolio size provides the investor with a dominant
regional operating platform, as well as premier landlord
positions in the major submarkets in which the assets
are situated. The management fees derived from the
Portfolio are estimated to exceed $1 million annually.
EXCEPTIONAL INVESTMENT VALUE
The Portfolio affords the opportunity to acquire 29 Class
A office buildings at a discount to replacement value.
OUTSTANDING INTERCHANGE LOCATIONS
The Portfolio offers highly visible multi-
directional metro-wide access along the
region’s primary interstate highways.
TENANT AMENITIES
The Portfolio is comprised of assets that benefit from
a Class A office park environment which provide
above average parking and numerous amenities,
including fitness centers, restaurants, deli and other
food services, overnight courier drop-boxes, nearby
hotels, eateries, and abundant retail shopping.
GREATER PHILADELPHIA/LEHIGH
VALLEY METROPOLITAN AREA
possesses one of the most diverse economies in the
Nation, with heavy concentration in the financial services,
healthcare, insurance, pharmaceutical, communication
and biotechnology sectors. The MSAs are home to
many Fortune 500 firms including Sunoco, Comcast,
GlaxoSmithKline, DuPont, Vanguard, Campbell Soup, Air
Products, Olympus US Headquarters and many more.
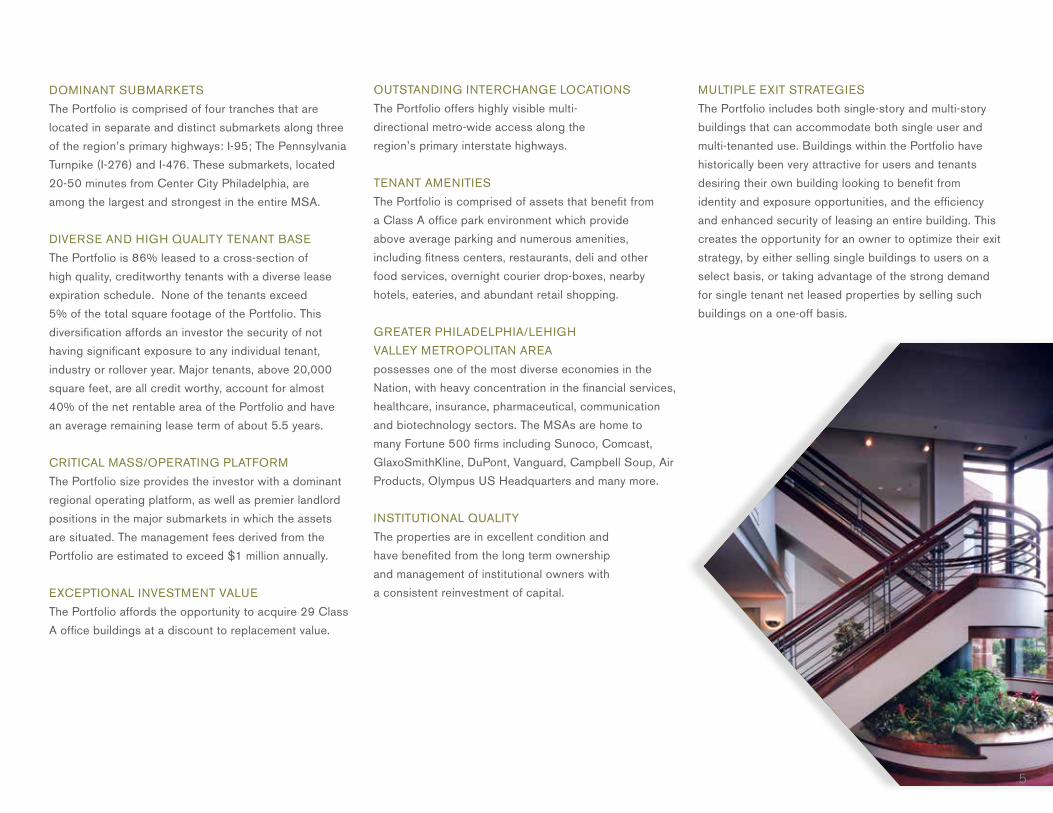
INSTITUTIONAL QUALITY
The properties are in excellent condition and
have benefited from the long term ownership
and management of institutional owners with
a consistent reinvestment of capital.
MULTIPLE EXIT STRATEGIES
The Portfolio includes both single-story and multi-story
buildings that can accommodate both single user and
multi-tenanted use. Buildings within the Portfolio have
historically been very attractive for users and tenants
desiring their own building looking to benefit from
identity and exposure opportunities, and the efficiency
and enhanced security of leasing an entire building. This
creates the opportunity for an owner to optimize their exit
strategy, by either selling single buildings to users on a
select basis, or taking advantage of the strong demand
for single tenant net leased properties by selling such
buildings on a one-off basis.
5
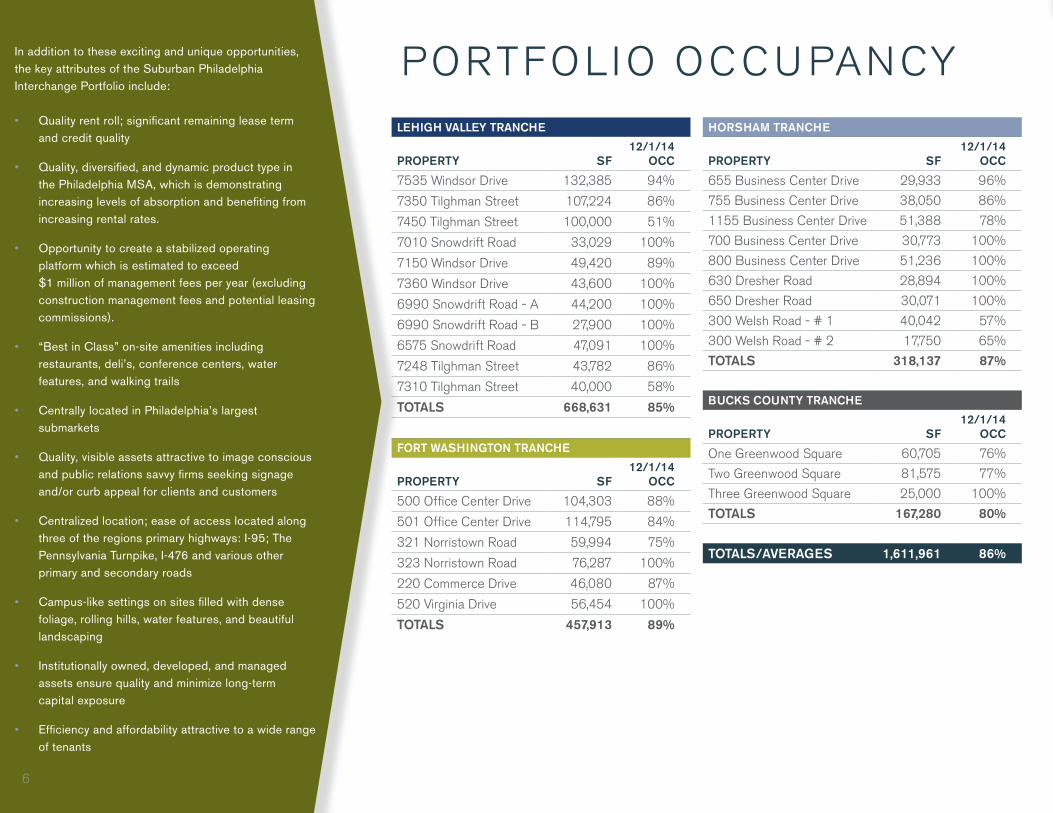
LEHIGH VALLEY TRANCHE
PROPERTY SF12/1/14
OCC
7535 Windsor Drive 132,385 94%
7350 Tilghman Street 107,224 86%
7450 Tilghman Street 100,000 51%
7010 Snowdrift Road 33,029 100%
7150 Windsor Drive 49,420 89%
7360 Windsor Drive 43,600 100%
6990 Snowdrift Road - A 44,200 100%
6990 Snowdrift Road - B 27,900 100%
6575 Snowdrift Road 47,091 100%
7248 Tilghman Street 43,782 86%
7310 Tilghman Street 40,000 58%
TOTALS 668,631 85%
FORT WASHINGTON TRANCHE
PROPERTY SF12/1/14
OCC
500 Office Center Drive 104,303 88%
501 Office Center Drive 114,795 84%
321 Norristown Road 59,994 75%
323 Norristown Road 76,287 100%
220 Commerce Drive 46,080 87%
520 Virginia Drive 56,454 100%
TOTALS 457,913 89%
HORSHAM TRANCHE
PROPERTY SF12/1/14
OCC
655 Business Center Drive 29,933 96%
755 Business Center Drive 38,050 86%
1155 Business Center Drive 51,388 78%
700 Business Center Drive 30,773 100%
800 Business Center Drive 51,236 100%
630 Dresher Road 28,894 100%
650 Dresher Road 30,071 100%
300 Welsh Road - # 1 40,042 57%
300 Welsh Road - # 2 17,750 65%
TOTALS 318,137 87%
BUCKS COUNTY TRANCHE
PROPERTY SF12/1/14
OCC
One Greenwood Square 60,705 76%
Two Greenwood Square 81,575 77%
Three Greenwood Square 25,000 100%
TOTALS 167,280 80%
TOTALS/AVERAGES 1,611,961 86%
In addition to these exciting and unique opportunities, the key attributes of the Suburban Philadelphia Interchange Portfolio include:
• Quality rent roll; significant remaining lease term and credit quality
• Quality, diversified, and dynamic product type in the Philadelphia MSA, which is demonstrating increasing levels of absorption and benefiting from increasing rental rates.
• Opportunity to create a stabilized operating platform which is estimated to exceed $1 million of management fees per year (excluding construction management fees and potential leasing commissions).
• “Best in Class” on-site amenities including restaurants, deli’s, conference centers, water features, and walking trails
• Centrally located in Philadelphia’s largest submarkets
• Quality, visible assets attractive to image conscious and public relations savvy firms seeking signage and/or curb appeal for clients and customers
• Centralized location; ease of access located along three of the regions primary highways: I-95; The Pennsylvania Turnpike, I-476 and various other primary and secondary roads
• Campus-like settings on sites filled with dense foliage, rolling hills, water features, and beautiful landscaping
• Institutionally owned, developed, and managed assets ensure quality and minimize long-term capital exposure
• Efficiency and affordability attractive to a wide range of tenants
PORTFOLIO OCCU PANCY
6
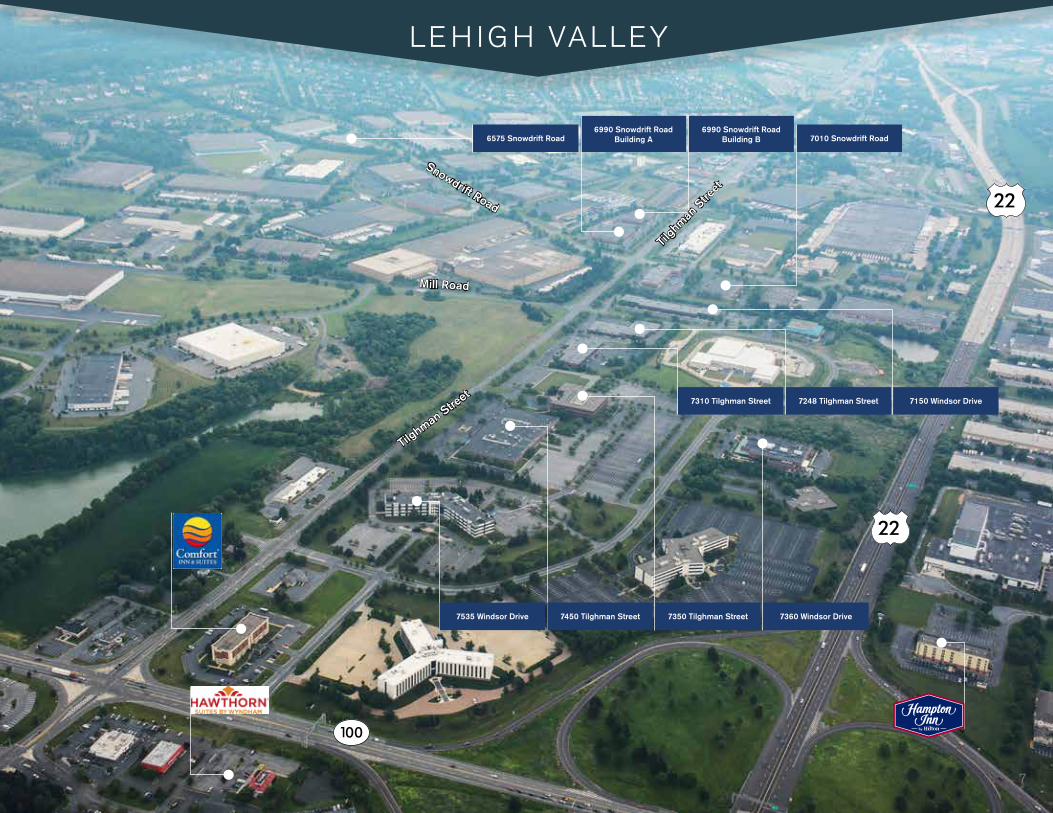
LE H IG H VALLEY
7535 Windsor Drive 7450 Tilghman Street 7350 Tilghman Street 7360 Windsor Drive
7310 Tilghman Street 7248 Tilghman Street 7150 Windsor Drive
6575 Snowdrift Road6990 Snowdrift Road
Building A6990 Snowdrift Road
Building B 7010 Snowdrift Road
Tilghm
an S
treet
Tilghman Stre
et
Mill Road
Snowdrift Road
7
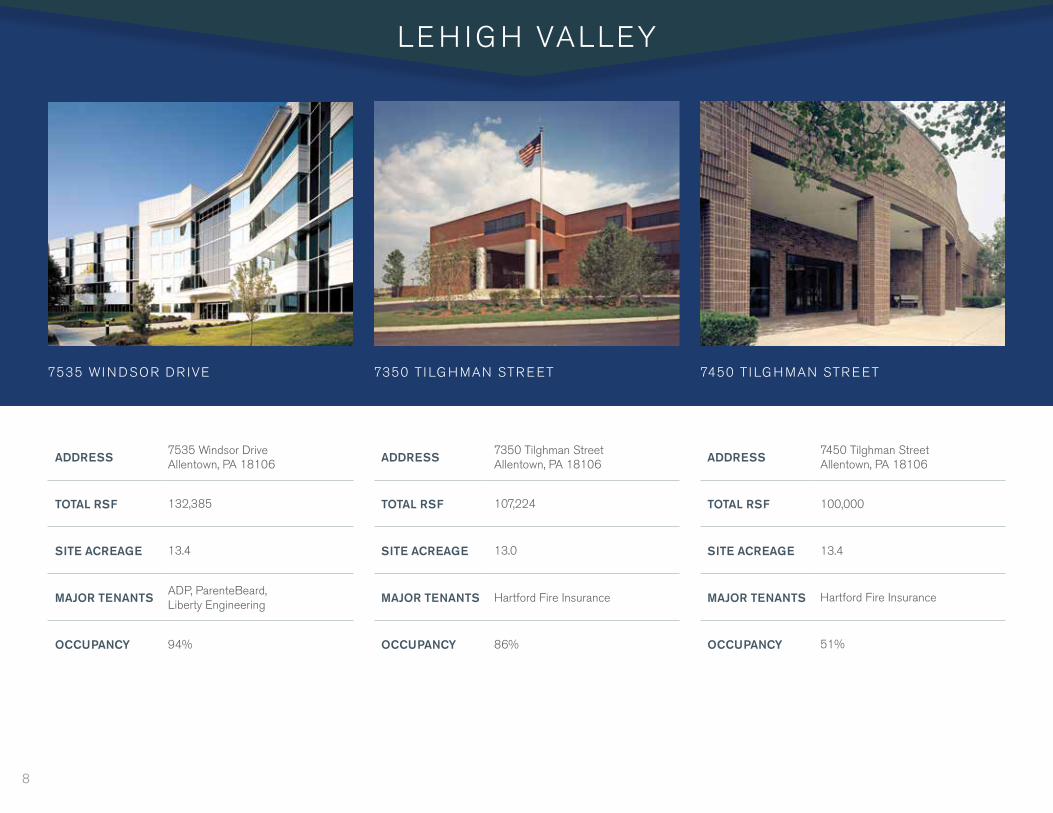
ADDRESS7535 Windsor DriveAllentown, PA 18106
TOTAL RSF 132,385
SITE ACREAGE 13.4
MAJOR TENANTSADP, ParenteBeard, Liberty Engineering
OCCUPANCY 94%
ADDRESS7350 Tilghman StreetAllentown, PA 18106
TOTAL RSF 107,224
SITE ACREAGE 13.0
MAJOR TENANTS Hartford Fire Insurance
OCCUPANCY 86%
ADDRESS7450 Tilghman StreetAllentown, PA 18106
TOTAL RSF 100,000
SITE ACREAGE 13.4
MAJOR TENANTS Hartford Fire Insurance
OCCUPANCY 51%
7535 WI N DSOR DR IVE 7350 T I LG H MAN STR E ET 7450 T I LG H MAN STR E ET
LE H IG H VALLEY
8
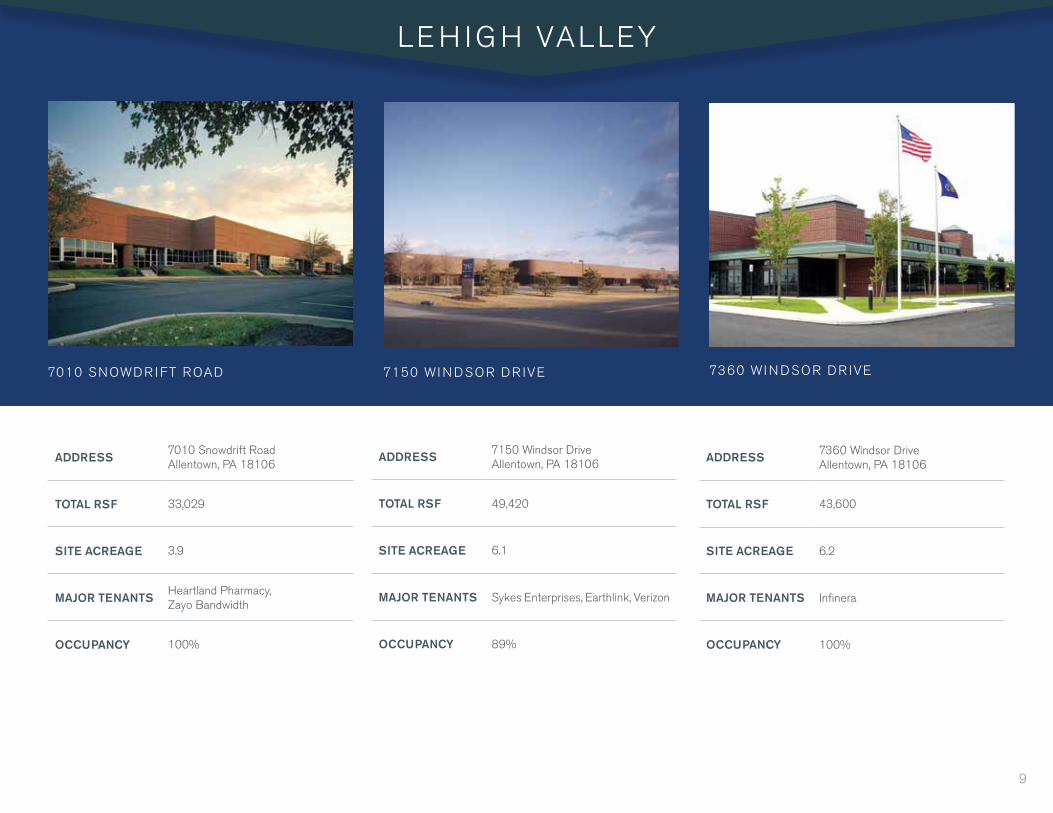
ADDRESS7010 Snowdrift RoadAllentown, PA 18106
TOTAL RSF 33,029
SITE ACREAGE 3.9
MAJOR TENANTSHeartland Pharmacy, Zayo Bandwidth
OCCUPANCY 100%
7010 SNOWDR I FT ROAD 7150 WI N DSOR DR IVE
LE H IG H VALLEY
7360 WI N DSOR DR IVE
ADDRESS 7150 Windsor DriveAllentown, PA 18106
TOTAL RSF 49,420
SITE ACREAGE 6.1
MAJOR TENANTS Sykes Enterprises, Earthlink, Verizon
OCCUPANCY 89%
ADDRESS 7360 Windsor DriveAllentown, PA 18106
TOTAL RSF 43,600
SITE ACREAGE 6.2
MAJOR TENANTS Infinera
OCCUPANCY 100%
9
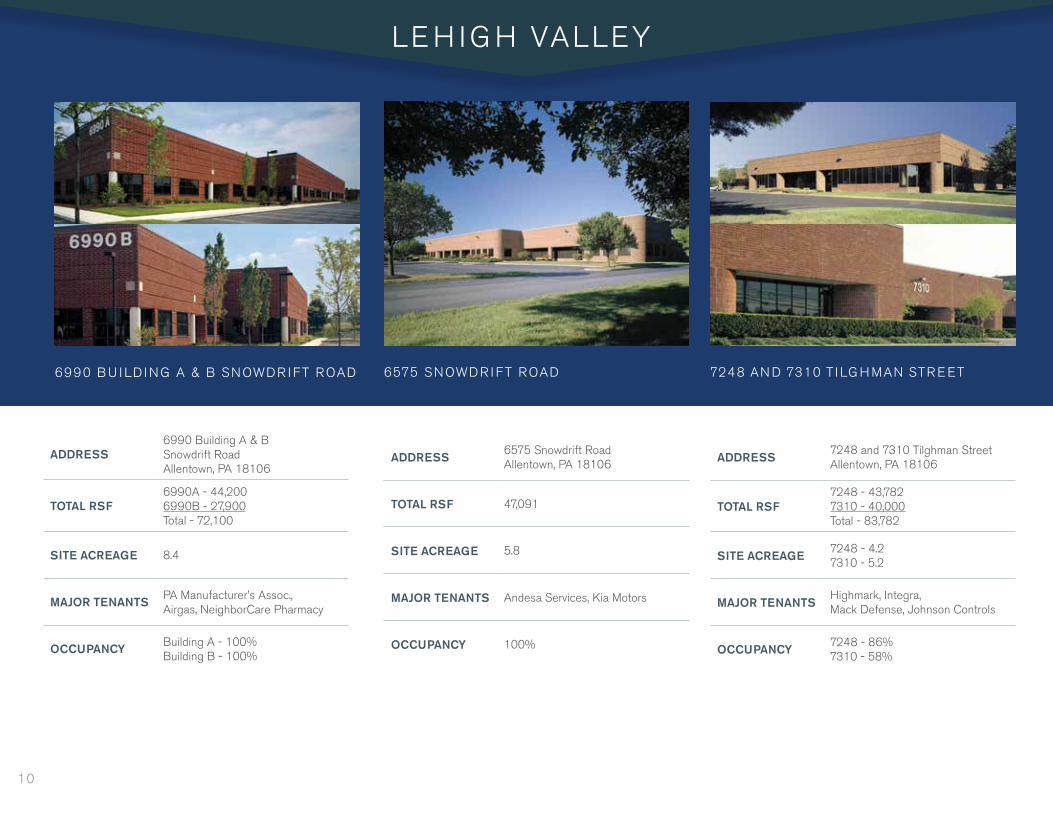
ADDRESS6575 Snowdrift Road Allentown, PA 18106
TOTAL RSF 47,091
SITE ACREAGE 5.8
MAJOR TENANTS Andesa Services, Kia Motors
OCCUPANCY 100%
ADDRESS7248 and 7310 Tilghman StreetAllentown, PA 18106
TOTAL RSF7248 - 43,7827310 - 40,000Total - 83,782
SITE ACREAGE7248 - 4.27310 - 5.2
MAJOR TENANTSHighmark, Integra,Mack Defense, Johnson Controls
OCCUPANCY7248 - 86%7310 - 58%
6575 SNOWDR I FT ROAD 7248 AN D 7310 T I LG H MAN STR E ET
LE H IG H VALLEY
ADDRESS6990 Building A & B Snowdrift Road Allentown, PA 18106
TOTAL RSF6990A - 44,2006990B - 27,900Total - 72,100
SITE ACREAGE 8.4
MAJOR TENANTS PA Manufacturer’s Assoc.,Airgas, NeighborCare Pharmacy
OCCUPANCY Building A - 100%Building B - 100%
6990 B U I LD I NG A & B SNOWDR I FT ROAD
10

323 Norristown RoadAmbler, PA
321 Norristown RoadAmbler, PA
Norristo
wn Road
Norristo
wn Road
500 Office Center Drive
PA Turnpike Interchange
501 Office Center Drive
Office Center Drive
Virginia Drive
520 Virginia Drive
220 Commerce Drive
276
FORT WASH I NGTON
11

ADDRESS500 Office Center DriveFort Washington, PA 19034
TOTAL RSF 104,303
SITE ACREAGE 6.3
MAJOR TENANTSHQ Global, Access Services, PSI Pharma, US Health
OCCUPANCY 88%
ADDRESS501 Office Center Drive Fort Washington, PA 19034
TOTAL RSF 114,795
SITE ACREAGE 6.4
MAJOR TENANTS Weisermazars, M3 USA, GSA
OCCUPANCY 84%
ADDRESSSpringhouse Corporate Center I 321 Norristown RoadAmbler, PA 19002
TOTAL RSF 59,994
SITE ACREAGE 11.1
MAJOR TENANTS L Discovery, Pentavision
OCCUPANCY 75%
500 OFF ICE CE NTE R DR IVE 501 OFF ICE CE NTE R DR IVE SPR I NG HOUSE COR PORATE CE NTE R I
FORT WASH I NGTON
12
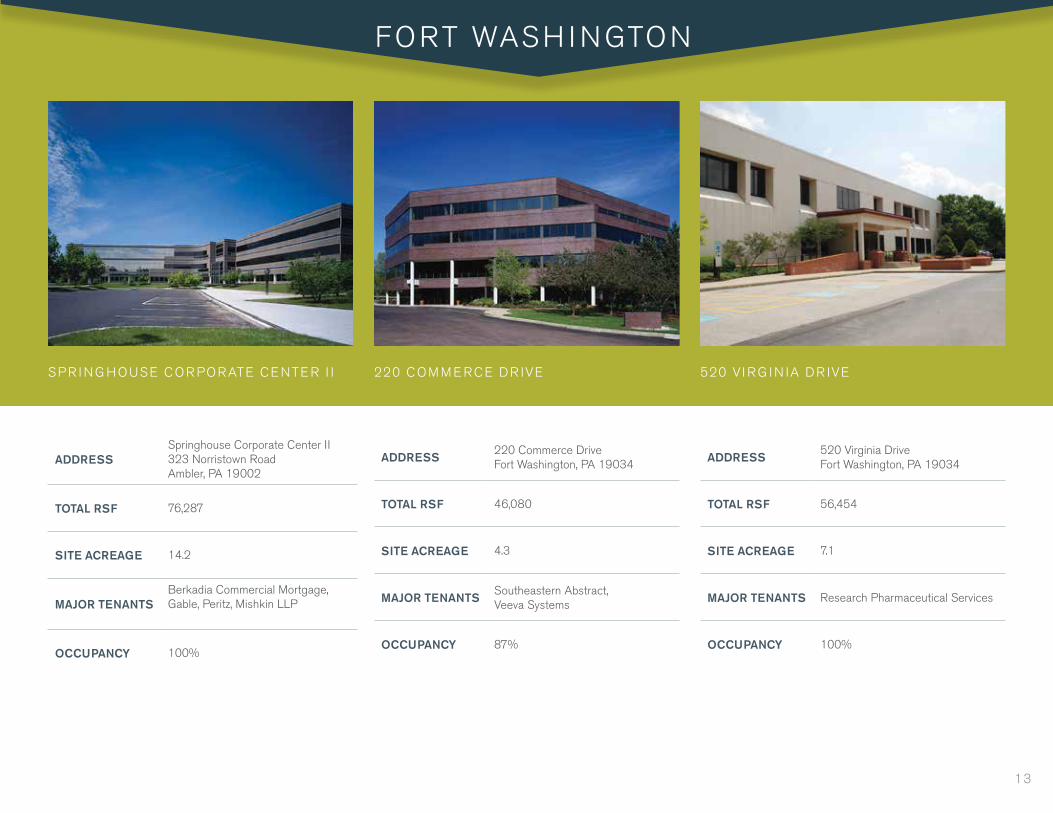
ADDRESSSpringhouse Corporate Center II 323 Norristown RoadAmbler, PA 19002
TOTAL RSF 76,287
SITE ACREAGE 14.2
MAJOR TENANTSBerkadia Commercial Mortgage, Gable, Peritz, Mishkin LLP
OCCUPANCY 100%
ADDRESS220 Commerce DriveFort Washington, PA 19034
TOTAL RSF 46,080
SITE ACREAGE 4.3
MAJOR TENANTSSoutheastern Abstract, Veeva Systems
OCCUPANCY 87%
ADDRESS520 Virginia DriveFort Washington, PA 19034
TOTAL RSF 56,454
SITE ACREAGE 7.1
MAJOR TENANTS Research Pharmaceutical Services
OCCUPANCY 100%
SPR I NG HOUSE COR PORATE CE NTE R I I 220 COM M E RCE DR IVE 520 V I RG I N IA DR IVE
FORT WASH I NGTON
13

655 Business Center Drive
755 Business Center Drive
1155 Business Center Drive
700 Business Center Drive
800 Business Center Drive
630 Dresher Road
650 Dresher Road
300 Welsh Road, Bldg I
300 Welsh Road, Bldg II
HORSHAM
Horsham Gate Shopping Center
14
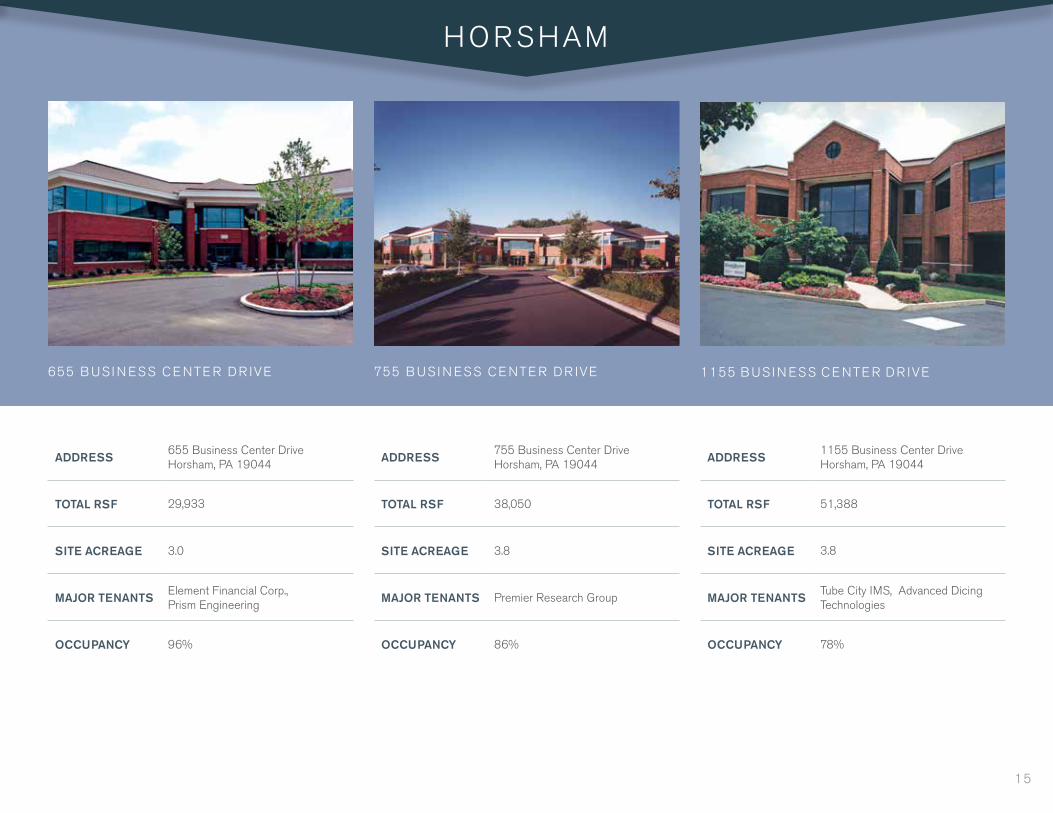
ADDRESS655 Business Center DriveHorsham, PA 19044
TOTAL RSF 29,933
SITE ACREAGE 3.0
MAJOR TENANTSElement Financial Corp., Prism Engineering
OCCUPANCY 96%
ADDRESS755 Business Center DriveHorsham, PA 19044
TOTAL RSF 38,050
SITE ACREAGE 3.8
MAJOR TENANTS Premier Research Group
OCCUPANCY 86%
ADDRESS1155 Business Center DriveHorsham, PA 19044
TOTAL RSF 51,388
SITE ACREAGE 3.8
MAJOR TENANTSTube City IMS, Advanced Dicing Technologies
OCCUPANCY 78%
655 B US I N ESS CE NTE R DR IVE 755 B US I N ESS CE NTE R DR IVE 1155 B US I N ESS CE NTE R DR IVE
HORSHAM
15
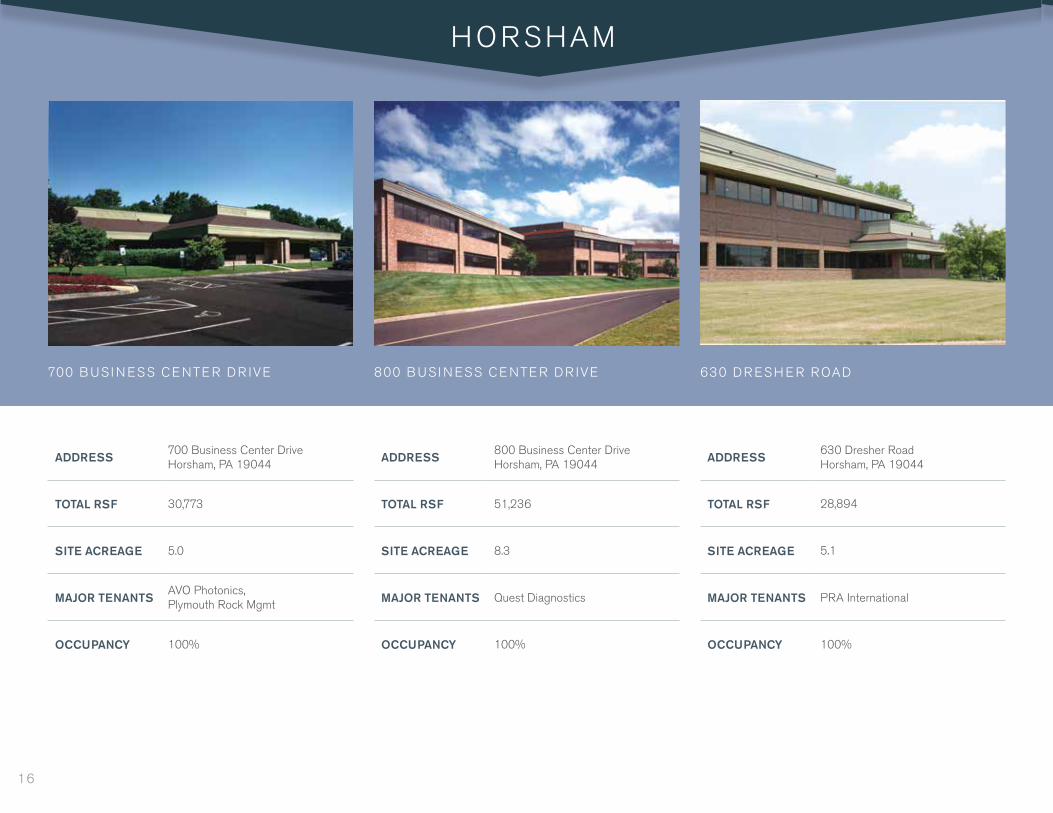
ADDRESS700 Business Center DriveHorsham, PA 19044
TOTAL RSF 30,773
SITE ACREAGE 5.0
MAJOR TENANTSAVO Photonics, Plymouth Rock Mgmt
OCCUPANCY 100%
ADDRESS800 Business Center DriveHorsham, PA 19044
TOTAL RSF 51,236
SITE ACREAGE 8.3
MAJOR TENANTS Quest Diagnostics
OCCUPANCY 100%
ADDRESS630 Dresher RoadHorsham, PA 19044
TOTAL RSF 28,894
SITE ACREAGE 5.1
MAJOR TENANTS PRA International
OCCUPANCY 100%
700 B US I N ESS CE NTE R DR IVE 800 B US I N ESS CE NTE R DR IVE 630 DR ESH E R ROAD
HORSHAM
16
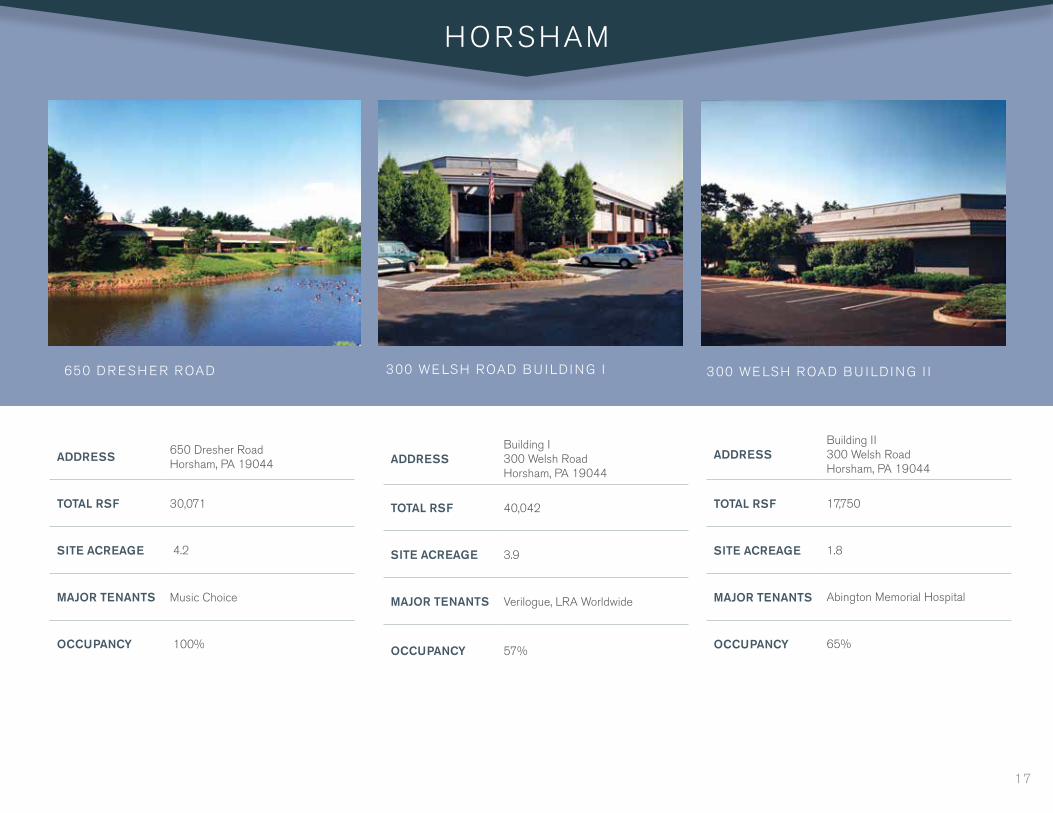
ADDRESSBuilding II300 Welsh RoadHorsham, PA 19044
TOTAL RSF 17,750
SITE ACREAGE 1.8
MAJOR TENANTS Abington Memorial Hospital
OCCUPANCY 65%
ADDRESSBuilding I 300 Welsh RoadHorsham, PA 19044
TOTAL RSF 40,042
SITE ACREAGE 3.9
MAJOR TENANTS Verilogue, LRA Worldwide
OCCUPANCY 57%
300 WE LSH ROAD B U I LD I NG I I
HORSHAM
650 DR ESH E R ROAD
ADDRESS 650 Dresher RoadHorsham, PA 19044
TOTAL RSF 30,071
SITE ACREAGE 4.2
MAJOR TENANTS Music Choice
OCCUPANCY 100%
300 WE LSH ROAD B U I LD I NG I
17
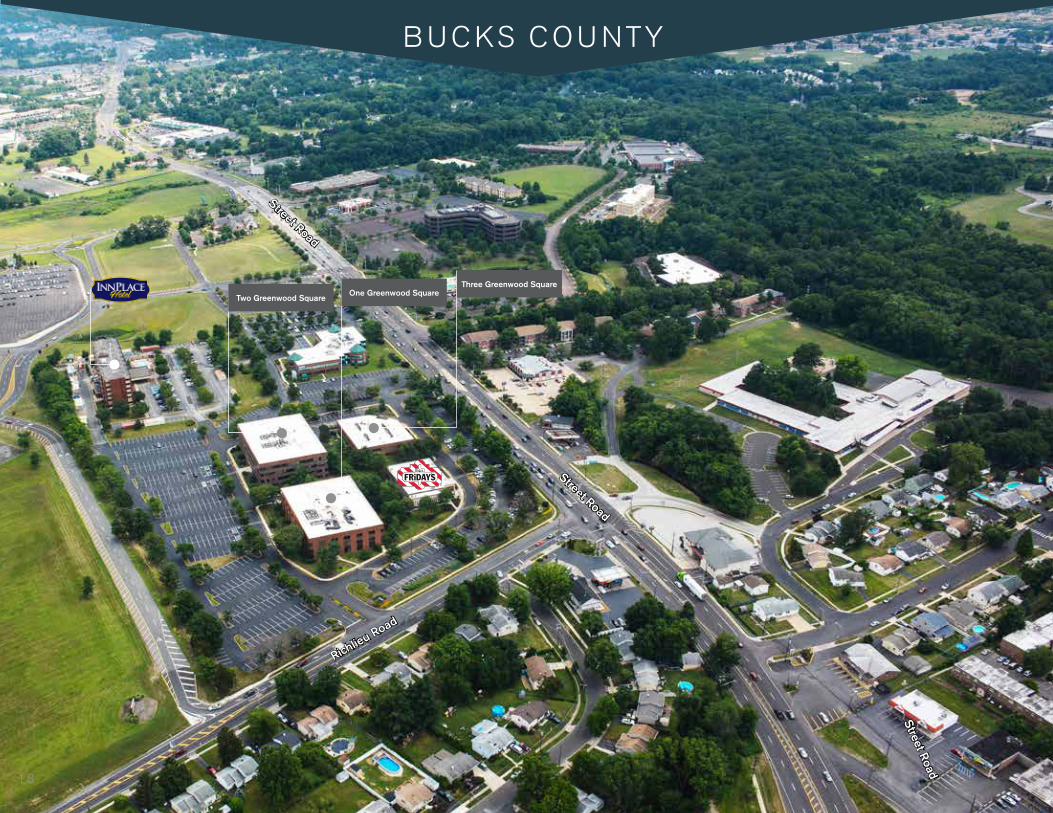
B UCKS COU NTY
Three Greenwood SquareOne Greenwood Square
Two Greenwood Square
Street Road
Richlieu Road
Street Road
Street Road
18
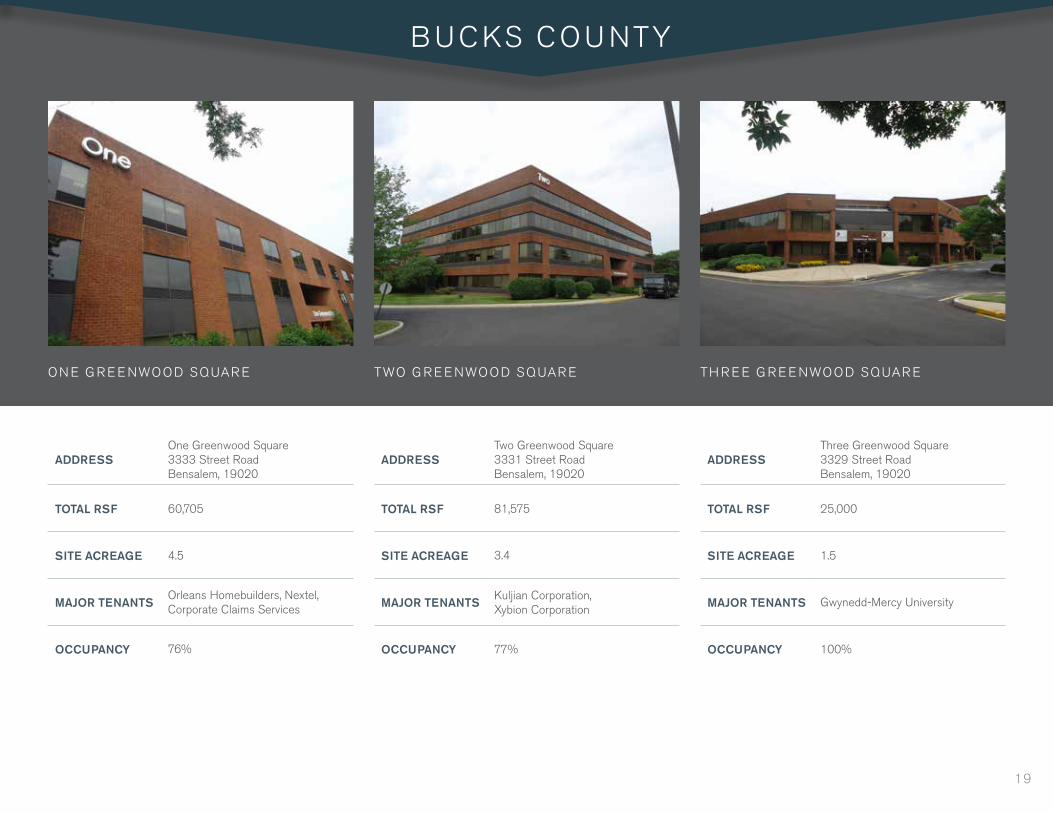
ADDRESSOne Greenwood Square 3333 Street RoadBensalem, 19020
TOTAL RSF 60,705
SITE ACREAGE 4.5
MAJOR TENANTSOrleans Homebuilders, Nextel, Corporate Claims Services
OCCUPANCY 76%
ADDRESSTwo Greenwood Square 3331 Street RoadBensalem, 19020
TOTAL RSF 81,575
SITE ACREAGE 3.4
MAJOR TENANTSKuljian Corporation, Xybion Corporation
OCCUPANCY 77%
ADDRESSThree Greenwood Square 3329 Street RoadBensalem, 19020
TOTAL RSF 25,000
SITE ACREAGE 1.5
MAJOR TENANTS Gwynedd-Mercy University
OCCUPANCY 100%
ON E G R E E NWOOD SQUAR E TWO G R E E NWOOD SQUAR E TH R E E G R E E NWOOD SQUAR E
B UCKS COU NTY
19
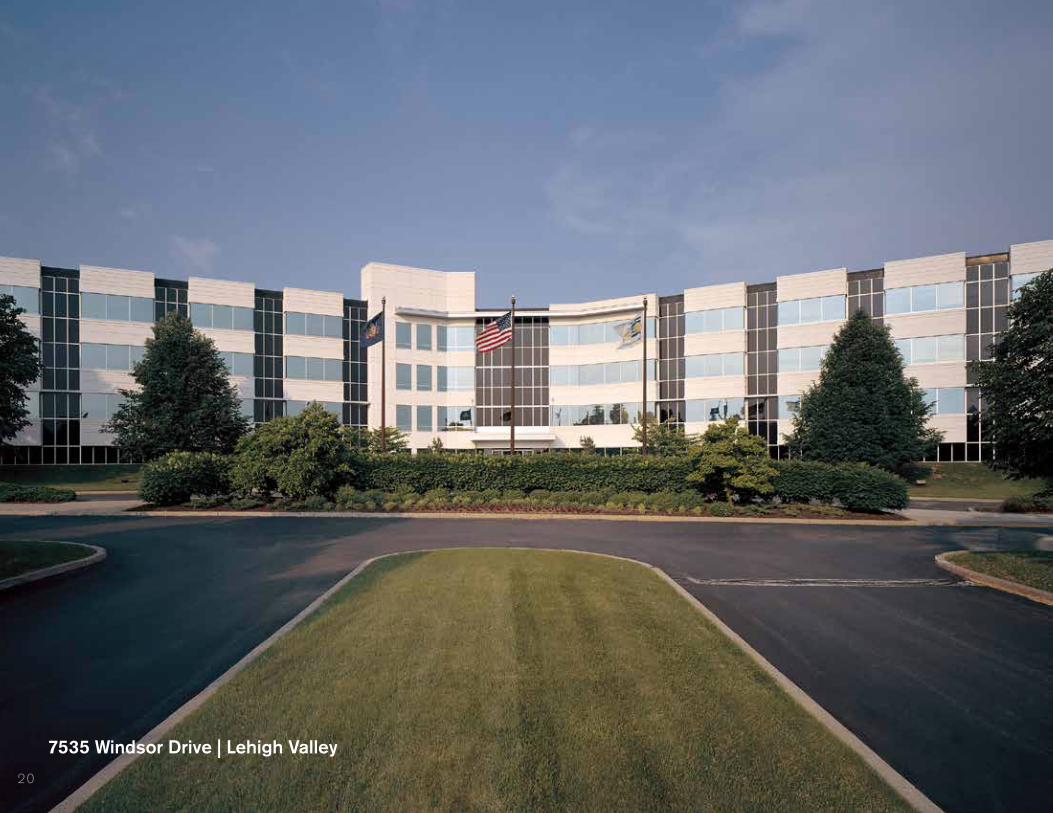
7535 Windsor Drive | Lehigh Valley
20
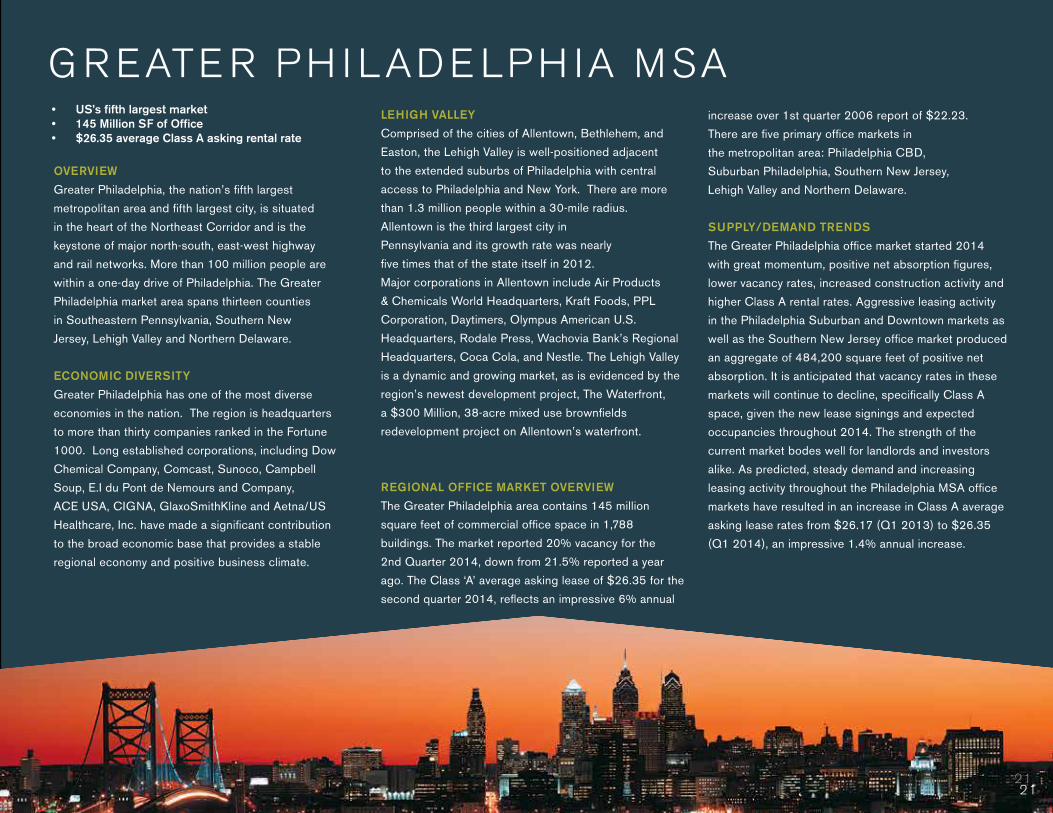
OVERVIEW
Greater Philadelphia, the nation’s fifth largest
metropolitan area and fifth largest city, is situated
in the heart of the Northeast Corridor and is the
keystone of major north-south, east-west highway
and rail networks. More than 100 million people are
within a one-day drive of Philadelphia. The Greater
Philadelphia market area spans thirteen counties
in Southeastern Pennsylvania, Southern New
Jersey, Lehigh Valley and Northern Delaware.
ECONOMIC DIVERSITY
Greater Philadelphia has one of the most diverse
economies in the nation. The region is headquarters
to more than thirty companies ranked in the Fortune
1000. Long established corporations, including Dow
Chemical Company, Comcast, Sunoco, Campbell
Soup, E.I du Pont de Nemours and Company,
ACE USA, CIGNA, GlaxoSmithKline and Aetna/US
Healthcare, Inc. have made a significant contribution
to the broad economic base that provides a stable
regional economy and positive business climate.
LEHIGH VALLEY
Comprised of the cities of Allentown, Bethlehem, and
Easton, the Lehigh Valley is well-positioned adjacent
to the extended suburbs of Philadelphia with central
access to Philadelphia and New York. There are more
than 1.3 million people within a 30-mile radius.
Allentown is the third largest city in
Pennsylvania and its growth rate was nearly
five times that of the state itself in 2012.
Major corporations in Allentown include Air Products
& Chemicals World Headquarters, Kraft Foods, PPL
Corporation, Daytimers, Olympus American U.S.
Headquarters, Rodale Press, Wachovia Bank’s Regional
Headquarters, Coca Cola, and Nestle. The Lehigh Valley
is a dynamic and growing market, as is evidenced by the
region’s newest development project, The Waterfront,
a $300 Million, 38-acre mixed use brownfields
redevelopment project on Allentown’s waterfront.
REGIONAL OFFICE MARKET OVERVIEW
The Greater Philadelphia area contains 145 million
square feet of commercial office space in 1,788
buildings. The market reported 20% vacancy for the
2nd Quarter 2014, down from 21.5% reported a year
ago. The Class ‘A’ average asking lease of $26.35 for the
second quarter 2014, reflects an impressive 6% annual
increase over 1st quarter 2006 report of $22.23.
There are five primary office markets in
the metropolitan area: Philadelphia CBD,
Suburban Philadelphia, Southern New Jersey,
Lehigh Valley and Northern Delaware.
SUPPLY/DEMAND TRENDS
The Greater Philadelphia office market started 2014
with great momentum, positive net absorption figures,
lower vacancy rates, increased construction activity and
higher Class A rental rates. Aggressive leasing activity
in the Philadelphia Suburban and Downtown markets as
well as the Southern New Jersey office market produced
an aggregate of 484,200 square feet of positive net
absorption. It is anticipated that vacancy rates in these
markets will continue to decline, specifically Class A
space, given the new lease signings and expected
occupancies throughout 2014. The strength of the
current market bodes well for landlords and investors
alike. As predicted, steady demand and increasing
leasing activity throughout the Philadelphia MSA office
markets have resulted in an increase in Class A average
asking lease rates from $26.17 (Q1 2013) to $26.35
(Q1 2014), an impressive 1.4% annual increase.
G R EATE R PH I LADE LPH IA MSA
21
• US’s fifth largest market• 145 Million SF of Office• $26.35 average Class A asking rental rate
21

EXCLUSIVE MARKETING ADVISORS
ROBERT J. FAHEY
Executive Vice President
+1 610 251 5184
FRANCIS COYNE
Associate
+1 610 251 5144
JEROME KRANZEL
Senior Vice President
+1 610 251 5889
CBRE, INC.
1200 Liberty Ridge Drive
Suite 320
Wayne, PA 19087
T +1 610 251 0820
F +1 610 251 5105
CAP ITAL MAR KETS | I NSTITUTIONAL G ROU P
© 2014 CBRE, Inc. The information contained in this document has been obtained from sources believed reliable. While CBRE, Inc. does not doubt its accuracy, CBRE, Inc. has not verified it and makes no guarantee, warranty or representation about it. It is your responsibility to independently confirm its accuracy and completeness. Any projections, opinions, assumptions or estimates used are for example only and do not represent the current or future performance of the property. The value of this transaction to you depends on tax and other factors which should be evaluated by your tax, financial and legal advisors. You and your advisors should conduct a careful, independent investigation of the property to determine to your satisfaction the suitability of the property for your needs. PMC0006048
I NTE RCHANG EOFF ICE PORTFOLIO
Investment Summary
SU B U R BAN PH I LADE LPH IA
DEBT & STRUCTURED FINANCE
JAMES GUNNING
Executive Vice President
T +1 201 712 5855
DONNA FALZARANO
Vice President
T +1 201 712 5858