interim management report at 31 march 2014 - · pdf fileinterim management report at 31st...
TRANSCRIPT
Interim Management Report
at 31st March 2014
This document has been translated into English for the
convenience of readers outside of Italy.
The original Italian version remains the definitive and
authoritative document.
Interim Management Report at 31st March 2014
Pa
ge
|
2
CONTENTS
Board of director and auditors ............................................................................................................. 3
Summary of the Group’s results and data ................................................................................................... 5
Summary schedules ................................................................................................................................... 7
Consolidated income statement ............................................................................................................... 7
Consolidated statement of comprehensive income .................................................................................... 8
Consolidated Statement of financial position ............................................................................................ 9
Consolidated Cash Flow Statement ........................................................................................................ 10
Explanatory notes .................................................................................................................................... 11
1. Foreword ...................................................................................................................................... 11
2. Information on CAD IT S.p.A. .......................................................................................................... 11
3. Activities of the Group ................................................................................................................... 12
4. Hot topics ..................................................................................................................................... 15
5. Corporate Governance ................................................................................................................... 17
6. Accounting standards and consolidation criteria .............................................................................. 17
7. Consolidation area ........................................................................................................................ 22
8. The short-term situation ............................................................................................................... 23
9. Significant events of the period....................................................................................................... 23
10. Management results and comments on the most significant components in the quarter ................. 24
11. Net financial position ................................................................................................................. 25
12. Research and development ......................................................................................................... 26
13. Investments and intangible and tangible fixed assets ................................................................... 26
14. Personnel .................................................................................................................................. 28
15. Significant events since 31st March 2014 ..................................................................................... 29
16. Other Information ...................................................................................................................... 29
17. Foreseeable management developments ..................................................................................... 29
Declaration in accordance with article 154-bis, second paragraph, of legislative decree no. 58 of 24 february 1998 ....................................................................................................................................................... 30

Interim Management Report at 31st March 2014
Pa
ge
|
3
BOARD OF DIRECTOR AND AUDITORS BOARD OF STATUTORY DIRECTORS (1) AUDITORS (1) GIUSEPPE DAL CORTIVO RICCARDO FERRARI Chairman and Managing Director Chairman LUIGI ZANELLA GIAN PAOLO RANOCCHI Vice Chairman and Managing Director Statutory Auditor GIAMPIETRO MAGNANI RENATO TENGATTINI Vice Chairman and Managing Director Statutory Auditor PAOLO DAL CORTIVO Managing Director
MAURIZIO RIZZOLI (2) Director
THOMAS BURKHART (3) Director FRANCESCO ROSSI (2) Director and lead independent director LAMBERTO LAMBERTINI (2) Independent Director
AUDITORS: BDO S.p.A.
(1) Appointed on 26 April 2012; office expires with the shareholders' meeting for the approval of the 2014 financial statements.
(2) Member of the Control and Risk Committee; member of the Nominating and Compensation Committee.
(3) Appointed on 29 April 2014; office expires with the shareholders' meeting for the approval of the 2014 financial statements.
The main powers reserved in the statute to the Board of Directors are the examination and approval of the strategic, industrial and financial plans of the company;the purchase, sale, exchange or transfer of fixed assets and real estate rights; the granting of collateral on fixed assets; the set up of new subsidiaries and the take-over, acquisition or sale of corporate investments; the acquisition, sale, exchange or transfer of the whole company or of business lines; the underwriting of obligations, commitments and responsibilities which, either singularly or jointly with other connected negotiations, come to more than €4,000,000; the nomination of managing directors; the release of warranties and real or personal guarantees of any kind to the sum of more than €2,000,000 for each individual transaction and, if in the interest of subjects other than the Company and its subsidiaries, to any sum whatsoever; the examination and preventive approval of significant transactions including those with company related parties and company subsidiaries; verification of the appropriateness of the administrative and organisational structure and the general accounting, the internal control system and any conflicts of interest. The Chairman and Managing Director of the parent company CAD IT S.p.A., Giuseppe Dal Cortivo, is authorised to perform all ordinary and extraordinary administrative duties, excluding only those which can not be delegated by law and those assigned to the Board of Directors by article 19 of the company by-laws. The Vice-Chairmen Giampietro Magnani and Luigi Zanella, pursuant to article 20 of the company by-laws, carry out vicarious functions to those of the President in case of his absence or impediment.The managing directors, Giampietro Magnani and Luigi Zanella, will have full ordinary administrative power including the faculty to prepare reports and to order banking transactions, within the limits of account availability and credit worthiness with the power to act alone for each individual transaction to the amount of Euro 2,000,000 (two million) and with the joint signature of another managing director for each individual transaction to the amount of Euro 4,000,000 (four million); furthermore, the aforementioned directors will have the power and faculty, with their single free signature, to purchase and/or sell registered assets, with the exception of boats and airplanes of any kind. The Managing Director Paolo Dal Cortivo will have full ordinary administrative power including the faculty to prepare reports and to order banking transactions, within the limits of account availability and credit worthiness, with the power to act alone for each individual transaction to the amount of Euro 2,000,000 (two million) and with the joint signature of another managing director for each individual transaction to the amount of Euro 4,000,000 (four million). The said Managing Director will have ordinary administrative power to represent the Company in terms of relations with institutional investors and shareholders as well as with Borsa Italiana S.p.A. and Consob, by sending them communications and information, including anything required by the laws in force and/or the international best practice rules in respect of the laws and rules themselves and any internal regulations.
Interim Management Report at 31st March 2014
Pa
ge
|
4
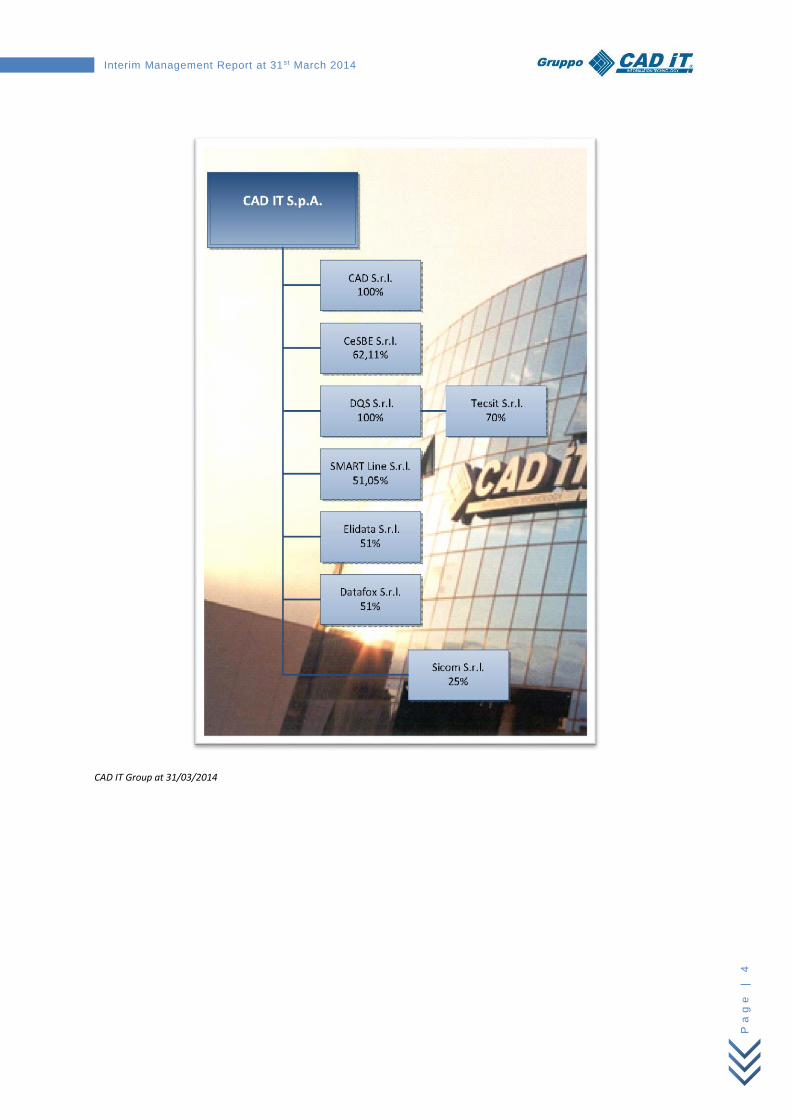
CAD IT Group at 31/03/2014
Interim Management Report at 31st March 2014
Pa
ge
|
5
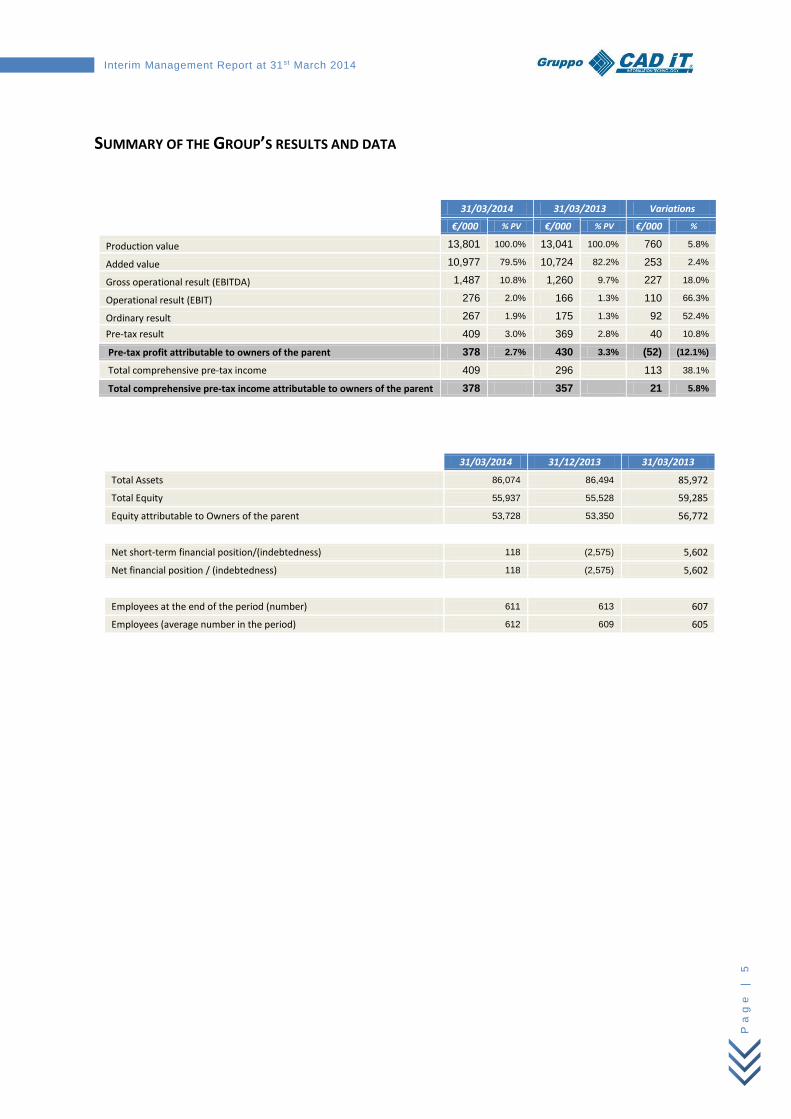
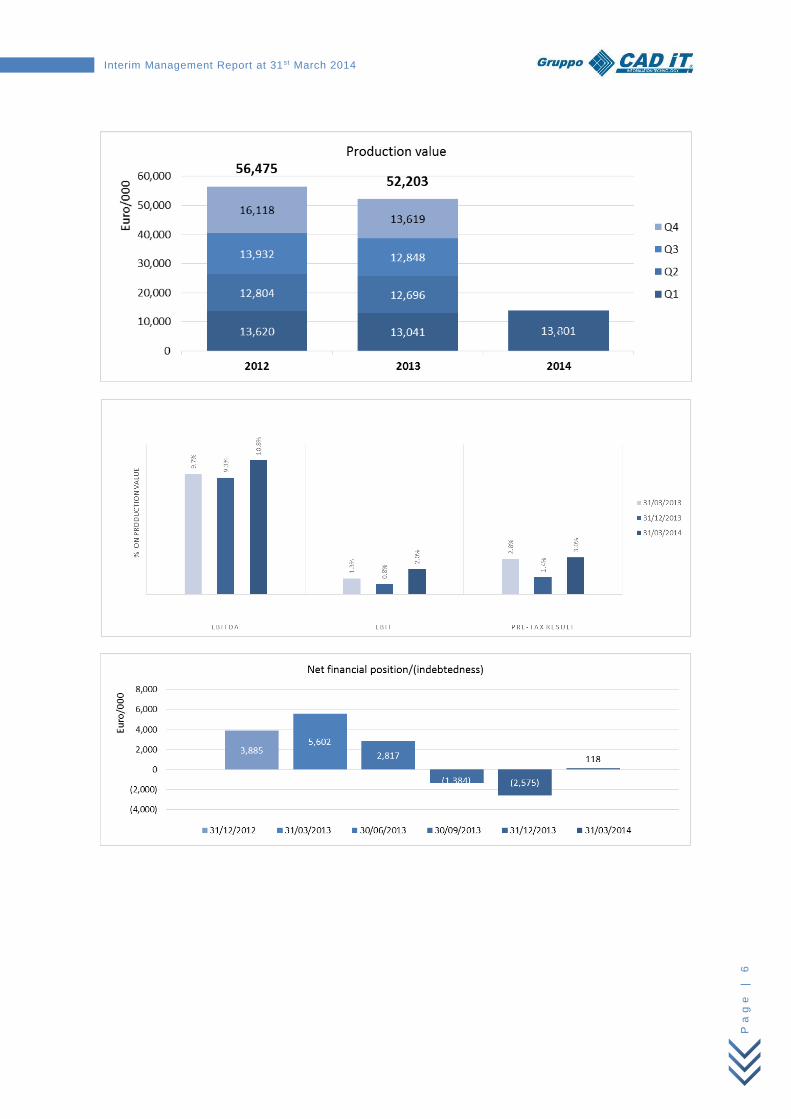
SUMMARY OF THE GROUP’S RESULTS AND DATA
31/03/2014 31/03/2013 Variations
€/000 % PV €/000 % PV €/000 %
Production value 13,801 100.0% 13,041 100.0% 760 5.8%
Added value 10,977 79.5% 10,724 82.2% 253 2.4%
Gross operational result (EBITDA) 1,487 10.8% 1,260 9.7% 227 18.0%
Operational result (EBIT) 276 2.0% 166 1.3% 110 66.3%
Ordinary result 267 1.9% 175 1.3% 92 52.4%
Pre-tax result 409 3.0% 369 2.8% 40 10.8%
Pre-tax profit attributable to owners of the parent 378 2.7% 430 3.3% (52) (12.1%)
Total comprehensive pre-tax income 409 296 113 38.1%
Total comprehensive pre-tax income attributable to owners of the parent 378 357 21 5.8%
31/03/2014 31/12/2013 31/03/2013
Total Assets 86,074 86,494 85,972
Total Equity 55,937 55,528 59,285
Equity attributable to Owners of the parent 53,728 53,350 56,772
Net short-term financial position/(indebtedness) 118 (2,575) 5,602
Net financial position / (indebtedness) 118 (2,575) 5,602
Employees at the end of the period (number) 611 613 607
Employees (average number in the period) 612 609 605
Interim Management Report at 31st March 2014
Pa
ge
|
6
Interim Management Report at 31st March 2014
Pa
ge
|
7
SUMMARY SCHEDULES
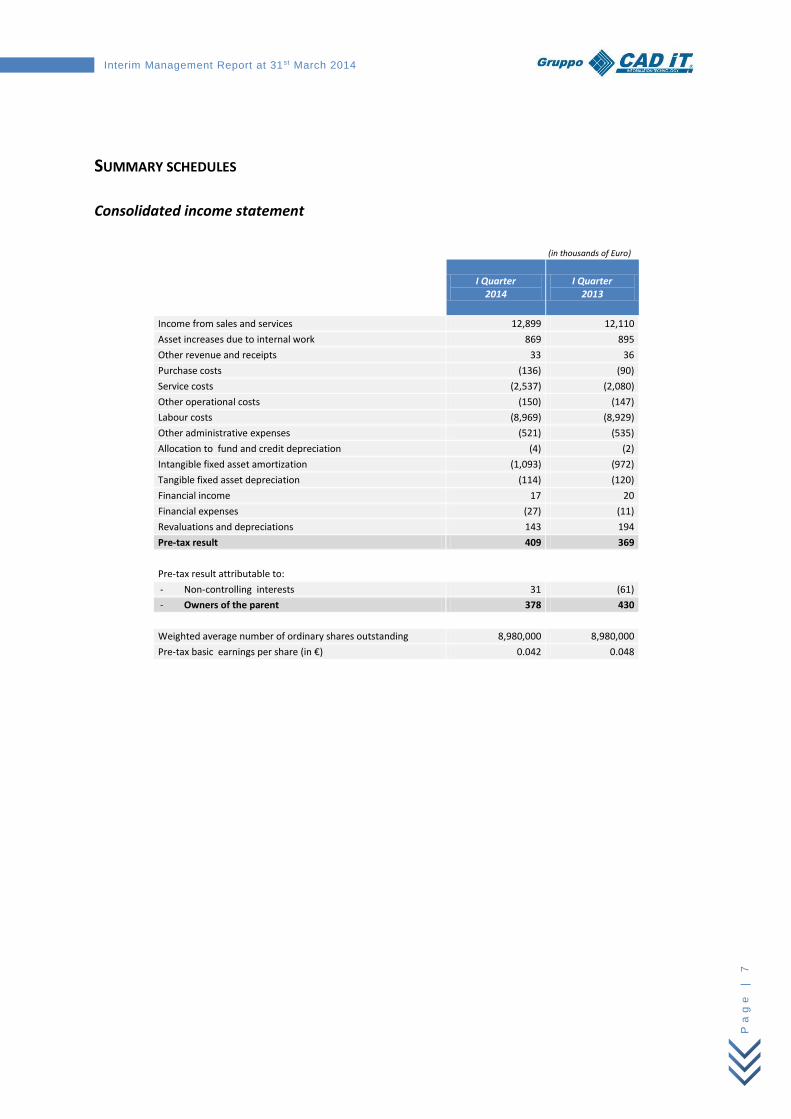
Consolidated income statement
(in thousands of Euro)
I Quarter 2014
I Quarter 2013
Income from sales and services 12,899 12,110
Asset increases due to internal work 869 895
Other revenue and receipts 33 36
Purchase costs (136) (90)
Service costs (2,537) (2,080)
Other operational costs (150) (147)
Labour costs (8,969) (8,929)
Other administrative expenses (521) (535)
Allocation to fund and credit depreciation (4) (2)
Intangible fixed asset amortization (1,093) (972)
Tangible fixed asset depreciation (114) (120)
Financial income 17 20
Financial expenses (27) (11)
Revaluations and depreciations 143 194
Pre-tax result 409 369
Pre-tax result attributable to:
- Non-controlling interests 31 (61)
- Owners of the parent 378 430
Weighted average number of ordinary shares outstanding 8,980,000 8,980,000
Pre-tax basic earnings per share (in €) 0.042 0.048
Interim Management Report at 31st March 2014
Pa
ge
|
8
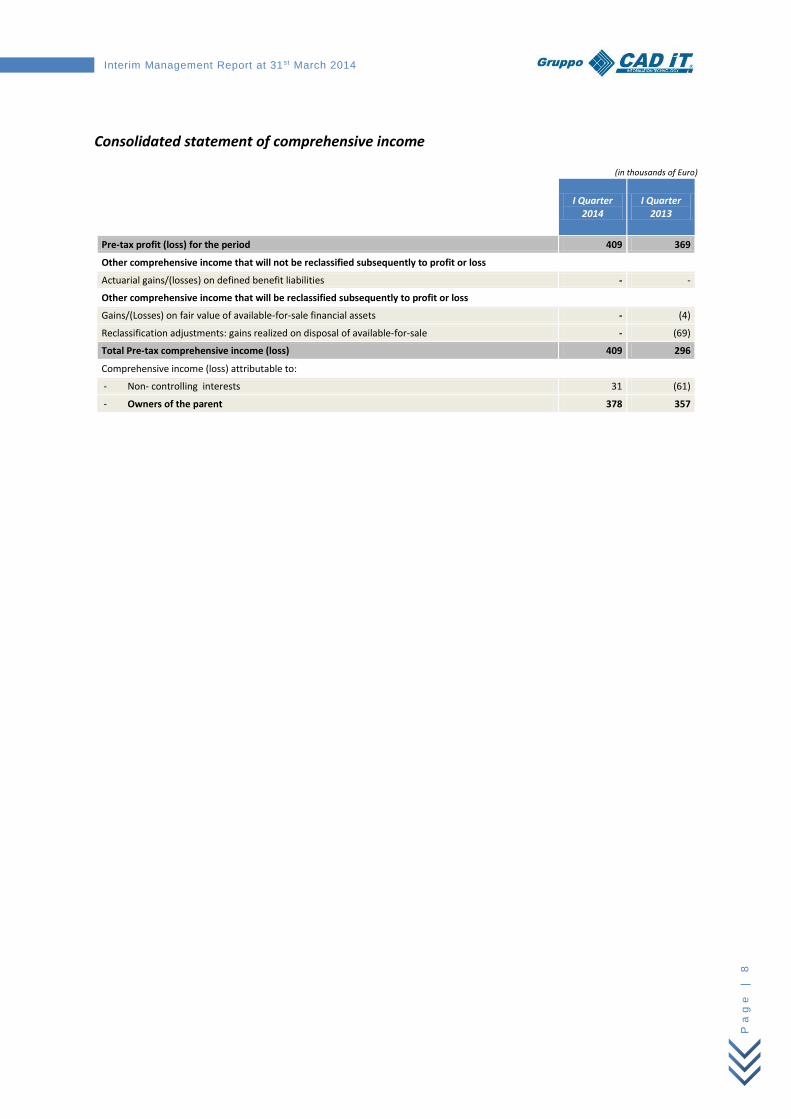
Consolidated statement of comprehensive income
(in thousands of Euro)
I Quarter 2014
I Quarter 2013
Pre-tax profit (loss) for the period 409 369
Other comprehensive income that will not be reclassified subsequently to profit or loss
Actuarial gains/(losses) on defined benefit liabilities - -
Other comprehensive income that will be reclassified subsequently to profit or loss
Gains/(Losses) on fair value of available-for-sale financial assets - (4)
Reclassification adjustments: gains realized on disposal of available-for-sale - (69)
Total Pre-tax comprehensive income (loss) 409 296
Comprehensive income (loss) attributable to:
- Non- controlling interests 31 (61)
- Owners of the parent 378 357
Interim Management Report at 31st March 2014
Pa
ge
|
9
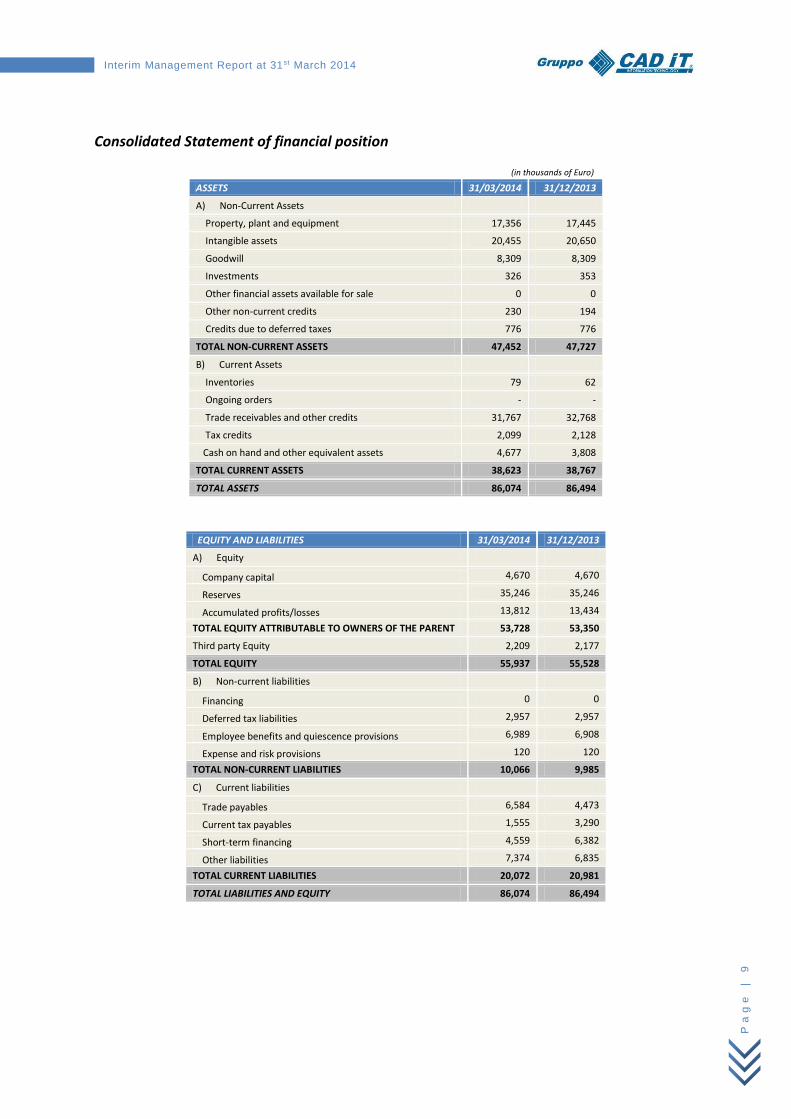
Consolidated Statement of financial position
(in thousands of Euro) ASSETS 31/03/2014 31/12/2013
A) Non-Current Assets
Property, plant and equipment 17,356 17,445
Intangible assets 20,455 20,650
Goodwill 8,309 8,309
Investments 326 353
Other financial assets available for sale 0 0
Other non-current credits 230 194
Credits due to deferred taxes 776 776
TOTAL NON-CURRENT ASSETS 47,452 47,727
B) Current Assets
Inventories 79 62
Ongoing orders - -
Trade receivables and other credits 31,767 32,768
Tax credits 2,099 2,128
Cash on hand and other equivalent assets 4,677 3,808
TOTAL CURRENT ASSETS 38,623 38,767
TOTAL ASSETS 86,074 86,494
EQUITY AND LIABILITIES 31/03/2014 31/12/2013
A) Equity
Company capital 4,670 4,670
Reserves 35,246 35,246
Accumulated profits/losses 13,812 13,434
TOTAL EQUITY ATTRIBUTABLE TO OWNERS OF THE PARENT 53,728 53,350
Third party Equity 2,209 2,177
TOTAL EQUITY 55,937 55,528
B) Non-current liabilities
Financing 0 0
Deferred tax liabilities 2,957 2,957
Employee benefits and quiescence provisions 6,989 6,908
Expense and risk provisions 120 120
TOTAL NON-CURRENT LIABILITIES 10,066 9,985
C) Current liabilities
Trade payables 6,584 4,473
Current tax payables 1,555 3,290
Short-term financing 4,559 6,382
Other liabilities 7,374 6,835
TOTAL CURRENT LIABILITIES 20,072 20,981
TOTAL LIABILITIES AND EQUITY 86,074 86,494

Interim Management Report at 31st March 2014
Pa
ge
|
1
0
Consolidated Cash Flow Statement
(in thousands of Euro)
Cash Flow Statement of CAD IT Group I Quarter
2014 I Quarter
2013
A) OPERATING ACTIVITIES
Profit (loss) for the period 409 369
Amortization, revaluation and depreciation:
- Property, plant and equipment depreciation 114 120
- Intangible fixed asset amortisation 1,093 972
- Revaluation of investments and financial assets available for sale (143) (194)
Allocations (utilization) of provisions 81 72
Financial performance:
- Net financial receipts (charges) 10 (9)
- Profit / (loss) on foreign exchange (0) (0)
Other working capital variations 1,927 1,050
Income taxes paid 0 0
Interest paid (27) (11)
(A) - Cash flows from (used in) operating activities 3,465 2,369
B) INVESTMENT ACTIVITIES
Investments in activities
- purchase of property, plant and equipment (25) (47)
- purchase/production of intangible assets (898) (919)
- increase in other fixed assets (36) (38)
Disinvestment activities
- transfers of property, plant and equipment 0 1
- transfers of assets available for sale 0 169
- decrease in other fixed assets 0 0
Cashed Interest 17 20
Cashed dividends 170 163
(B) - Cash flows from (used in) investment activities (771) (652)
C) FINANCING ACTIVITIES
Medium/long term financing repayment - -
Allocation of profits to directors of subsidiary companies - -
Distribution of profit reserves for withdrawal of a partner of a subsidiary - -
Dividends paid - -
(C) - Cash flows from (used in) financing activities - -
(A+B+C) - Total cash and other equivalent assets flows 2,693 1,717
Opening cash balances and equivalents (2,575) 3,885
Closing cash balances and equivalents 118 5,602
Interim Management Report at 31st March 2014
Pa
ge
|
1
1
EXPLANATORY NOTES
1. Foreword
This Interim Management Report has been drafted in accordance with art. 154-ter, paragraph 5, of the Testo
Unico della Finanza that was introduced by Leg. Decree 195/2007, put into effect by the 2004/109/CE Directive
(the so-called Transparency Directive); this report is not an interim management statement drafted in
accordance with IAS 34 “Interim Statements”.
In accordance with this regulation, this interim management report gives:
a) a general description of the Group’s financial standing and financial trend in the quarter;
b) an outline of the significant events and transactions that occurred in the quarter and their effect on the
Group’s financial standing.
The accounting tables shown are the same as those used for drafting the annual and six-monthly financial
reports.
The interim management report is presented without calculating the income taxes for the period.
The interim report includes balance charts in reference to the following periods:
profit and loss account for the interim period in question and trend compared to the same interim
period (period and trend) of the previous financial year;
balance sheet at the end of the interim period concerned, also in comparison to the figures for the same
period of the previous financial year;
cash flow statement at the interim period closure date compared to the figures for the same period of
the previous financial year.
The figures representing the net financial position, compared with the figures of the previous quarter and the
previous year end, and tables showing investments in intangible and tangible assets, installations and machinery
relating to the intervening period between the beginning of the financial period and the closing date of the
quarter, are also supplied.
This document shows the quarterly figures required on a consolidated basis, since CAD IT S.p.A is obliged to draft
a consolidated balance.
Unless otherwise indicated, the monetary quantities in the accounting tables and those in the notes, are shown
rounded off to the nearest thousand euro. The totals and subtotals of the statements presented are determined
by rounding the sum of the point data. The percentage figures shown are calculated using the non-rounded off
figures.
The Interim Management Report is not subject to auditing and opinion by the external auditors.
2. Information on CAD IT S.p.A.
CAD IT is the leader of a group that is one of the most dynamic organizations in the Italian information technology
sector.
CAD IT was set up as a joint stock company under Italian law. The registered office and the administrative and
operating offices are in Via Torricelli 44/a, Verona. The company is registered in the Verona Company Register
under no. 01992770238. Share capital amounts to € 4,669,600, fully subscribed and paid-in, and comprises
8,980,000 ordinary shares. There are no other action categories. These shares are nominal and cannot be divided.
Each of them entitles to one vote in the ordinary and extraordinary meetings of the company and to the
execution of all other corporate and property rights in accordance with the law and the company's by-laws.
The company is listed in the STAR segment of MTA market of the Italian stock exchange, segment conceived for
mid size companies that voluntarily comply with requirements of excellence in terms of information
transparency, communication, liquidity of free float and Corporate Governance, in line with best international
standards.
CAD IT S.p.A. is not subject to the control of any other company, as provided by article 2359 of the Italian Civil
Interim Management Report at 31st March 2014
Pa
ge
|
1
2
Code and it is fully responsible for defining it own general and operational strategic policies. CAD IT S.p.A.
manages and coordinates its own subsidiaries.
The CAD IT Group operates in Italy with its own branches and companies in Verona, Milan, Rome, Prato, Padova
and Mantua.
3. Activities of the Group
A dynamic and innovative company
The group philosophy is that every customer situation is unique and for each of them will be sought specific
solution. For this reason group’s technology solutions are established on component-based architectures that
allow for secure, phased and progressive implementation.
With over 600 highly trained professionals employed within the company, the aim of the Group is to harness
innovation and technology to help the company run better.
… with a broad and impressive customer base
CAD IT serves demanding market-leading organisations across Europe.
Its customer base includes banking groups, national authorities, local authorities, consumer goods companies,
insurance companies, outsource service providers and foundations.
Each day, its technology solutions support over 200,000 end-users in over 600 organisations with their essential
tasks in Italy, Switzerland, Germany, UK and the Czech Republic.
… operating through a dedicated company network
During the years it has widened its product range through the continual increase in new skills, a careful strategy
of acquisitions and partnerships, considerable investment in research and development and constant market
trend monitoring, that has always favored the issue of products in line with the changing needs and anticipating
needs.
The founding of new companies and other strategic purchases have enabled the Group to improve synergies and
to enter new markets, e.g. business intelligence and control and management systems for banks, insurance
companies, private and public institutions, innovative solutions to interconnect financial markets, SIM (securities
brokerage firm) and SGR (company asset management), ERP applications and solutions for local tax collection
agencies.
… with market leading products based on reliable and flexible technology
CAD IT has proven and functionally-rich technology solutions and offers its customers true expertise in
technology.
With the gained experience and consistent R&D in technology design and application development, the group
has the expertise to build reliable, user-friendly and highly scalable application architecture.
Based on an independent model platform, service oriented its architectures offer customers the flexibility of
phased implementation within a technology framework that is designed for today and can evolve around their
changing needs. The “lego” methodology, coupled with a broad range of services, facilitates the tailoring of
common technological solutions to the customer’s situation.
… combining with a comprehensive set of services
The services offered are related to developed solutions in the following areas:
project management;
system integration;
consultancy and training;
customisation and change management activities;
application monitoring & support through agreed SLA;
Interim Management Report at 31st March 2014
Pa
ge
|
1
3
multi-lingual, 24x7 Help Desk;
regulatory support;
application development;
application maintenance;
private cloud;
business processing.
… and a laser focus on customer service
Guidelines, frameworks and specific toolsets are in place to ensure every aspect of work is linked to these needs
from requirements and service planning, through solution development to deployment and support.
Software Development Centre of CAD IT supports all software releases, documentation and materials that allow
to simplify the operation activities of its customers.
The Group developed a special single-point-of-contact (SPOC) Customer Support Framework for the
management of support and maintenance activities including Service Desk, Incident and Problem Management,
Change and Release Management.
Its main purpose is:
to act as a single point of contact for the CAD IT software end-user;
to manage the life cycle of user generated issues and service requests;
to guarantee pre-agreed service levels;
to organise and prioritise requirements;
to keep end-users updated on progress.
… innovating together with a wide network
CAD IT invests heavily in R&D for its technology solutions.
Its capacity to innovate together with its clients is a compelling advantage. For many years now CAD IT adopted
a collaborative research and development approach with customers, universities, regulatory authorities,
consultancies, communities and technological and business partners.
With a growing user community of over 200,000 end-users, where customer demands and requirements
constantly evolve, Group’s strength is the ability to deliver solutions that respond to our client’s needs and adapt
to the changing market environment.
… offering constant improvement
The CAD IT Group offers solutions based on the know-how of a vast community of users and supports customers
in achieving their own specific objectives with a personalised approach based on granular software components
and tailor-made modular services.
Due to the inspiration we receive from our customers and believing firmly in creating stable and lengthy relations,
we aim to evolve constantly by making every effort to find new methods, innovate our technology and support
the professional growth of our own human resources through training and experiential courses.
The Group is convinced that its commitment to understanding the customers' needs and to providing increasingly
more efficient solutions is the true reason behind its managing to maintain customer satisfaction rate extremely
high.
We believe that innovation does not simply end with the supply of a state-of-the-art technological solution, but
is a continual process of customer support to provide solutions that evolve and adapt to changing market
conditions. This is why the Group continues to provide support for all the releases and, although invites its
customers to evolve, never obliges them to replace their software with updated versions.
By offering holistic services like system integration, training, consultancy, assistance and constant support, the
Group is continually enriching its own know-how by increasing the added value of the solutions it offers to the
customer's benefit.
Interim Management Report at 31st March 2014
Pa
ge
|
1
4
FINANCE
Area Finanza, flagship product, is viewed as the gold standard on the Italian market, with about a 90% share of
the Italian securities processing market, according to the estimate of the company.
Since 2006, with continuing product development, Area Finanza has now been implemented successfully
internationally, at leading financial institutions in Switzerland, Germany, UK and the Czech Republic.
Area Finanza offers total automation of all processes relating to derivatives and securities in the following macro
areas: Position Keeping, Custody and Administration, Corporate Actions, Order Management, Trading Rooms,
Securities Master Database, Settlement, Asset Management, Reconciliations, REPOs, Know Your Customer,
Financial Advice and Reporting.
Customers are banks, banking groups, insurance companies, global custodians, brokers, asset managers, IT and
BPO service providers, finance companies, trust companies and banking foundations.
Within Europe, our application statistics for Area Finanza include:
400 financial institutions;
25,000 bank branches;
14,000 post office branches;
150,000 users;
25,000,000 security deposit accounts.
PUBLIC ADMINISTRATION
The Group holds a leading position in providing software solutions for Tax Collection in Italy.
Our SET suite for tax collection is the National IT solution being used by the Institutions that manage public tax
collection.
Activity in this sector began in the 1980s and has been developed by constantly keeping up with the legal and
functional evolutions in the management of both "voluntary" and "compulsory" tax collection.
Since 2006, in view of the ongoing decentralisation of local tax collection, CAD IT has made considerable
investments in developing its FE suite for managing Taxation for Public Authorities, capitalising on its experience
in Tax Collection at a central level.
FE offers avant-garde tools at the service of all types of central and local Authority for managing tax collection,
from preparing "loading lists" up to payment collection and settlement. Furthermore, the FE suite includes
planning and control solutions that improve the Authority's internal management, so that Public Administration
can accompany the citizen through all the most important events of the public service lifecycle: from information
services to the various payment means.
Customers are Authorities, Licensed Companies, Tax Collection Agents and Banking Groups that carry out
Treasury and Tax collection services.
Taxation for Authorities (FE) and Tax Collection System (SET) are used throughout Italy and exclusively manage
tax collection activities for the National Public Administration Service.
INDUSTRY
In addition, the Group boasts a long-standing activity in the industrial and the financial sectors and can count on
the capacity to offer solutions for e-business, credit and industrial companies in constant evolution.
CAD IT is a reference point for companies producing the most famous "made in Italy" products: fashion and food.
In these sectors, CAD IT aims at providing specific IT and business skills through software packages and services
with high added value that ensure immediate benefits for its customers.
Customers are hundreds of companies dotted all over Italy with branches abroad and with a strong potential for
internationalization. Companies that have grown with CAD IT in terms of modernising and reviewing their
company procedures. With them were created organizational models so that decisions can be taken quickly and
within economically sustainable time periods.
CAD IT, with the support of its strategic partners, is able to provide its customers with a complete range of
services so that they can make the decisions that lead to creating advanced systems supported by the very best
specific skills available on the market.

Interim Management Report at 31st March 2014
Pa
ge
|
1
5
4. Hot topics
FINANCE DIVISION
Privacy
The provisions issued by the Guarantor of Privacy foresees the obligation to store information relating to
transactions for two years, even if only informative, like, for example, inquiries carried out on customer reports
by banking staff, i.e. the users of information systems. With this provision, banks should verify and adjust their
'logs', the archives in which they record the transactions made on their computer systems which, as is well-
known, is the most complex of all financial sectors. It is therefore necessary to set up a repository in which to
keep all the information and then have a system to identify any improper behaviour by the bank's own
employees. This provision, in fact, is the result of situations in which information on customer accounts and
transactions have been unduly divulged and used illegally.
In this context CAD IT is one of the main players in the banking sector software vendor community, promoted by
Deloitte, that can resolve this requirement by means of a highly innovative project.
EMIR: Reporting Compliance for Derivative Trades
According to the EMIR regulation, financial and non-financial counterparties must ensure that the details of any
derivative contract they may have concluded as well as any subsequent modification or termination of said
contract is reported to a trade repository, no later than one the working day following its the conclusion,
modification or termination of the contract.
The reporting obligation will take effect as of July 2013 for derivatives on interest and credit and as of January
2014 for derivatives on all other asset classes.
CAD IT’s Trade Repository Reporting allows to introduce new reporting logic into your current applications.
Trade Repository Reporting captures operations in real time from existing Front Office Systems (e.g. MUREX,
Kondor+, Bloomberg, direct market connection, etc.) and from the Area Finanza Suite, elaborates the data and
sends all necessary messages to the Trade Repository. The monitoring screen shows the status of all messages
for all contracts.
Through CAD IT’s partnership with REGIS-TR (www.regis-tr.com), the European trade repository, launched by
Iberclear (BME) and Clearstream (Deutsche Boerse Group), we are able to supply a complete service.
Fatca
The new US regulation named FATCA imposes heavy duties on Banks, Insurances Companies, Asset Managers,
and Brokers, all over the world:
identification and classification of clients and financial accounts;
application of a 30% withholding tax for recalcitration;
data reporting to the United States;
compliance and audit obligations.
CAD IT’s Tax and Compliance Area (TCA) solution for FATCA is the result of a shared analysis with a dedicated
User Community involving banks, financial institutions and their consulting companies.
TCA has been designed to be easily adaptable to the identification of customer and account, new types of
taxation and reporting, thus enabling a strategic approach to new future requirements.
T2S
Target 2 Securities (T2S) is the new centralised platform for the settlement of Euro securities, which will be
available as of June 2015 and which will have a great impact on all market subjects, such as Banks, Custodians
and CSDs.
T2S will eliminate the differences between domestic and cross-border settlements and will lead to a gradual
removal of national specifications. In this way settlement activities will be limited to pure utility and will force a
clean-cut separation from custody services.
Interim Management Report at 31st March 2014
Pa
ge
|
1
6
CAD IT proposes its own Settlement EasySet solution, which has been designed to help banks deal with the
changes that T2S will bring, both in terms of direct and indirect adhesions.
Market Abuse Sensing
Market Surveillance Authority regulations are becoming increasingly more severe and extensive. Applying them
effectively while limiting the impact in terms of cost and application complexity, is a challenge that can be faced
with automation.
CAD IT has developed a tool for Market Abuse Sensing (compliant with Italian and European laws) that is able to
identify suspect transactions of market manipulation and information abuse (insider trading). The application
also manages a register of interest conflicts.
The platform totally automates the processes for acquiring data for processing and has automatic search
functions with a high number of variables to find potentially suspect transactions. The effectiveness of
investigation into automatically identified transactions, in order to establish the soundness of the suspicion and
to notify any transactions to the market surveillance authorities, is supported by a vast information workflow
that allows the user easy and fast management of investigation activities.
Flow Management
TDOC@Web: is CAD IT’s tool which, hosted in a web-site, allows Bank, Public Body and Company users to rapidly
and safely exchange a large volume data flow, archive and printout.
Local Authority Treasuries
Local Authority Treasuries: software procedure for the total automated management of Local Authority Treasury
and Funds for which the law imposes the figure of Treasurer or Receiver (Local Authority, Balances, documental
and non-documental cash collection and payment management). The application can be integrated with
Teso@Web, a product that, through Internet and by using special consultation functions, allows Local Authorities
to swiftly access their own data. The SIOPE and UNIFIED TELEMATIC PUBLIC TREASURY procedures are available
for Banca d'Italia reporting.
PUBLIC ADMINISTRATION DIVISION
Italian Public Administration is experiencing considerable change as a result of a similar radical transformation
of the country's social network.
Immigration, globalization, computerization and integration are just some of the important topics that Public
Administration is having to deal with. While these themes may represent problems, they can also provide the
chance to improve the services offered to the citizens.
One of the key factors is the use of new technologies, which are the first steps towards a new millennium. Not
just tablet PCs and smartphones, but also self-service terminals and call centres. Not just social networks and
peer to peer, but also, and above all, company clouds and public service networks.
For this reason, CAD IT has created an integrated and multi-lingual solution to automate information services,
procedures, policies, regulations and laws within large organizations and government bodies.
The CAD IT solution is based on a repository where all the information is organized in such a way that the engine
interpreting the operation can recognize the citizen, carry out information filtering, even translate from and to
the desired language and then provide the requested service.
With the CAD IT solution, the Public Administration office is guaranteed fewer costs and less conflict and stress
for its front desk operators as well as the possibility to monitor the level of services carried out. For the citizens,
the solution means a much faster, more personalized, timely and modern service.
INDUSTRY DIVISION
In the period collaboration activities with INFOR were continued.
In January CAD IT's INDUSTRY division has passed the certification tests on the MINGLE-ION platform
which will be useful for implementing the new INFOR technological platforms. Apart from installing and
Interim Management Report at 31st March 2014
Pa
ge
|
1
7
configuring MINGLE-ION for integration and collaboration functionalities, it will also be possible to
install and configure useful INFOR suite modules for integrating the most common managerial
platforms on the market.
In February CAD IT has successfully concluded the project to implement the ISA S.p.A. business model
in ERP Infor M3 in full respect of the time schedule and budget agreed with the customer. The aim of
the project was to adapt existing IT systems to the company's business needs and to reduce software
customisation to an absolute minimum.
In March CADIT, in collaboration with the American registered offices of CIBER, has completed the
installation of a few M3 modules for an important customer with premises in the state of WASHINGTON.
The installation of these modules marks the beginning of a plan to update the entire M3 installation now
operating on the customers' systems.
In March MABI S.p.A., company operating in the leather industry, has chosen CAD IT to introduce an
integrated ERP solution aimed at better supporting its business processes and to provide its customers
with top quality service. Taking advantage of the potential of INFOR's M3 for Fashion, the project's
purpose is to implement the business model by avoiding having to personalise software. This approach,
besides lowering investment and management costs, also contributes to a reduction in start-up times
and minimises risks. Moreover, it will allow the company to reap the benefits of an integrated approach
in terms of harmonisation, standardisation (adjustment to the rules) and control, ensuring sufficient
operative flexibility thanks to a multitude of parameter options.
5. Corporate Governance
The system of corporate governance adopted by CAD IT SpA is the traditional one.
CAD IT adheres to the Code of Conduct for listed companies issued by the Italian Stock Exchange (the " Codice di
Autodisciplina "), available on the website of the Italian Stock Exchange.
In compliance to the legal obligations, the Board of Directors annually approves the Corporate governance and
property asset report, in accordance with articles 123 bis and 124 ter TUF and 89 bis Consob Issuer Regulations,
in order to provide an adequate description of the corporate governance system adopted, information on
property assets and adhesion to Corporate Governance regulations. The report is published and is available for
public viewing in the Investor Relations sector of the company’s Internet site: www.caditgroup.com. Please refer
to this document for further details on governance and the Internal Control System of CAD IT and of the Group.
6. Accounting standards and consolidation criteria
The economic, patrimonial and financial information has been drafted in accordance with the evaluation and
measurement criteria as established by the International Financial Reporting Standard (IFRS), issued by the
International Accounting Standards Board (IASB) and approved by the European Commission according to the
procedure in art. 6 of the European Parliament and Council Regulation (EC) no. 1606/2002 of 19th July 2002.
The accounting standards adopted are the same as those used for drafting the last annual balance with the
exception of the items described in the paragraph below – Accounting Standards paragraph, amendments and
interpretations applied since 1st January 2014.
The accounting standards adopted have been applied in the same manner throughout the periods shown and
for all the Group’s companies, amending the respective Financial Statement drafted in accordance with Italian
accounting standards to consolidate
Interim Management Report has been drafted using the evaluation criteria of historical cost , except for financial
instruments available for sale, which are assessed at fair value, and the holdings in subsidiaries, which are
assessed in accordance with the equity method. Moreover, where some land and buildings have been included
Interim Management Report at 31st March 2014
Pa
ge
|
1
8
in First Time Adoption, the fair value has been used instead of the cost.
Interim Management Report has been drafted in the assumption that the company will continue.
Interim Management Report is presented without calculating the income taxes for the period.
Format of financial statements
The financial statements are prepared in
accordance with IAS 1 specifications.
The Group has decided to present revenue and cost
entries referring to the period in question in two
statements. One statement shows the profit (loss)
components for the period (Consolidated Income
statement) and the other, which begins with the
profit (loss) of the period and shows the statement
entries of the other components of the overall
profit and loss account (Statement of
comprehensive income).
The Group presents its economic account by nature,
the format that is considered the most
representative in terms of function presentation. In
fact, the chosen format conforms to the internal
reporting modalities and the business management
and is in line with the way the economic account
was represented in the past.
In the Report is presented on the profit and loss
account drafted in scalar form, highlighting the
intermediary results as follows:
Production revenues: this is the value of
services and goods produced and sold by
the Group, including internal assets and
other income and earnings from the
traditional offer.
Added value: obtained by subtracting the
operative costs for service and asset
purchases from production revenues, this
measures how much of the internal
production and distribution of goods and
services is due to company productive
factors.
Gross Operational Result (EBITDA): this
figure is obtained by subtracting from the
added value all of the costs that can be put
down to staff and other administrative
expenses. It highlights the result based on
the traditional offer including
depreciations, financial management,
revaluations or devaluations and taxes.
Operational Result (EBIT): this figure is
obtained by subtracting the depreciation
and funding amounts from the gross
operational result.
Ordinary Result: this includes the financial
management result.
Pre-tax result: obtained by including
revaluations and devaluations in the
ordinary Result.
As for the patrimonial situation, a distinction has
been made between current and non-current assets
and liabilities.
The Cash Flow statement has been presented
according to the indirect method so that the profit
(or loss) for the period has been adjusted of any
non-monetary operations and by deferments and
the setting aside of future incomes or payments.
Subsidiary companies
The consolidation area includes the Parent
company and the companies it controls, that is,
where it has the power to determine financial and
managerial policies of a business in order to reap
benefits from said company’s activities.
Subsidiary companies are consolidated from the
date in which control was effectively transferred to
the Group and are no longer consolidated as from
the date that control becomes external to the
Group.
These companies are consolidated using the
integral consolidation method. In order to prepare
the consolidated data, the patrimonial, economic
and financial situations of the subsidiary and
associate companies have been used as prepared by
the Group’s individual companies at the reference
dates, opportunely reclassified and amended to
reflect the application of the homogeneous
accounting standards.
In drafting the Interim Management Report all the
balances and significant transactions between the
Group’s companies have been eliminated, as well as
all unrealised profit and loss on infra-group
transactions.
Associate companies
The share in associate companies, that is those
companies in which the Group has significant
influence, is evaluated using the equity method, as
defined in IAS 28 – Investments in Associates. The
Interim Management Report at 31st March 2014
Pa
ge
|
1
9
profits or losses relevant to the Group are included
in the Interim Management Report from the date in
which this significant influence began up to the
moment it ceases.
Property, plant and equipment
Tangible fixed assets are shown at purchase cost,
including any costs that may be directly ascribable
and necessary for activating the asset and putting it
to the use for which it was purchased. In reference
to land and buildings listed in First Time Adoption,
the fair value was used instead of the cost.
Tangible fixed assets are shown at net value of the
relative accumulated depreciations and losses due
to the reduction in value determined in accordance
with the modalities described below.
Tangible fixed assets are amortised in constant
rates during the course of their expected useful life
cycle, i.e. the estimated period of time in which the
asset will be put to company use. Whenever
significant parts of tangible fixed assets have
different estimated useful life cycles, said
components are amortised separately.
The value to be depreciated is given by the
registered value of the asset net of any loss in value
and reduced by its assumed value at the end of its
useful life cycle, if significant and reasonably
calculable. The useful life cycle and the cash value
are reassessed annually and any changes, where
necessary, are brought in with a perspective
application.
The main economic-technical depreciation rates
used are the following:
• industrial buildings: 3%
• electrical equipment: from 5 to 10%
• air conditioning equipment: from 6 to 15%
• telephone systems: 20%
• alarm systems: from 10 to 30%
• furniture and fittings: 12%
• electrical machinery: 15%
• electronic machines and computers: 20%
• vehicles: 25%
Land, both without buildings or next to civil and
industrial constructions, is accounted for separately
and not amortised as it is considered an element
with an indefinite useful life cycle.
In order to calculate any losses due to depreciation,
the accounting value of intangible fixed assets is
subject to verification.
At the time of elimination or when no future
economic benefit can be expected from the use of
an asset, it is eliminated from the balance and the
eventual profit or loss (calculated as the difference
between the assignment value and the taxation
value) is shown in the economic account of the year
in which the asset is eliminated.
Financial Leasing
Assets owned through financial leasing contracts,
through which all the risks and benefits tied to the
property are transferred to the Group, are
registered among the Group assets at their fair
value or, if this value is lower, at the present value
of the minimum payments due for the leasing and
depreciated by applying coherent criteria to the
other assets. The corresponding liability towards
the lessor is registered in the balance among the
financial debts.
Intangible fixed assets
Intangible fixed assets are shown as such when it is
likely that they will bring in future economic
benefits for the company and when the asset cost
can be feasibly determined.
Intangible fixed assets, having a defined useful life
cycle, are subsequently registered net of the
relative accumulated amortizations and any losses
due to a durable reduction in value.
The useful life cycle is reassessed annually and any
changes, where necessary, are brought in with a
perspective application.
Profits or losses deriving from the transfer of an
intangible fixed asset are determined as the
difference between the elimination value and
taxation value of said asset and are reported on the
income statement at the time of elimination.
Research costs are charged to the income
statement in the period in which they are incurred.
The development costs of projects for the
production of instrumental software, or those to be
sold, are registered on the assets when they satisfy
the following conditions: the costs can be reliably
determined, the product is technically feasible, the
expected use and/or sale of the product indicate
that the sustained costs will generate future
economic benefits. In respect of the standard that
correlates costs and returns, these costs are
amortized as from the moment in which the activity
becomes available for use, in permanent
amortisation amounts for the entire duration of the
Interim Management Report at 31st March 2014
Pa
ge
|
2
0
product’s lifecycle, estimated at five years. The
costs of internally generated intangible assets
include only expenses that can be directly
attributable to the development of the product.
Development costs that cannot be capitalised,
when sustained, are reported on the income
statement.
Goodwill
Goodwill resulting from the purchase of subsidiaries
and associates is initially registered at cost and is the
overbalance of the purchase cost in respect of the
purchaser’s share of the fair value of the assets and
liabilities and the potential liabilities at the date of
purchase.
After the initial registration, goodwill is not subject
to amortisation but is decremented of any losses in
accumulated value, calculated according to the IAS
36 Asset value reduction. Goodwill regarding shares
in associates companies is included in the taxation
value of said companies.
Goodwill is subject to an annual analysis of
retrievableness or at shorter intervals if something
happens or changes in circumstances arise, which
could cause losses in value.
Goodwill deriving from purchases made prior to 1st
January 2004 is registered at the recorded value
ascribed to it in the last balance drafted on the basis
of the previous accounting standards (31st
December 2003). In fact, during the preparation of
the opening balance in accordance with the
international accounting standards, none of the
purchase transactions made prior to 1st January
2004 have been re-considered.
Impairment loss
The Group annually verifies the accountable value
of intangible and tangible assets or more often
whenever there is an indication that assets may
have suffered a value loss.
If the charged value exceeds the recoverable value,
the assets are devalued to reflect their recoverable
value, represented by the greatest figure between
the net price and use value. In defining the use
value, expected future financial flows are
discounted back using a pre-tax discount rate that
reflects the current market estimations in reference
to the cost of money at the time and the specific
risks of the asset in question. For an asset that does
not generate widely independent financial flows,
the return value is determined in relation to the unit
generating the financial flows of which the asset is
a part. The value losses are accounted for in the
income statement among depreciation and
devaluation costs. When subsequently an asset
value loss, different from the goodwill, is less or
decreases, the accounting value is increased to a
new estimate of the recoverable value within the
limit of the previous value loss. The recovery of a
value loss is registered to the income statement.
Assets available for sale
Share in non-consolidated companies are classified
as assets financially available for sale and are valued
at fair value. For any shares quoted as fair value, this
value is taken as the market value, if active. Any
profits or losses found as a result of the effect of
evaluating the fair value on these assets at every
balance date are shown at net patrimony unless
they are sold or they have durable losses in value,
that are the moments when the total profit or loss
found in the net patrimony is registered to the profit
and loss account.
Other non-current credits
These are registered at their nominal value,
representative of their fair value.
Stock
Leftover stock is valued as the lesser value between
purchase cost and the net value of the assumed
income. The cost is determined in accordance with
the average calculated cost method.
On-going orders
When the result of an order can be reliably
estimated, the relative revenues and costs are
shown in relation to the situation of the activity's
progress at the time of financial period closure, on
the basis of the ratio between sustained costs for
the activity carried out to date and the total
estimated cost of the order, unless this calculation
is not deemed representative of the order's
progress.
Any variations to the contract, price or incentive
reviews, are included to the amount that were
agreed with the customer.
When the result of an order cannot be estimated
reliably, the relative revenues are shown only within
the limits of the order's sustained costs, which will

Interim Management Report at 31st March 2014
Pa
ge
|
2
1
probably be retrieved. Order costs are shown as
expenses in the financial period in which they were
sustained.
Should it appear likely that the total costs of a work
to order will exceed the revenues, the expected loss
is immediately shown as a cost.
Commercial credits and other credits
Commercial credits, whose expiry limits are within
normal commercial terms, are not updated and are
registered at their nominal value net of any loss of
value. Moreover, they are adjusted to their
assumed cash value by means of the registration of
an appropriate amendment fund.
Liquid asset availability and equivalent means
The availability of liquid assets and equivalent
means is registered at nominal value and has the
requirements to be immediately available or
available at very short notice, without obstacles and
with no significant expense for collection.
Employee benefits
Severance pay (TFR), governed by Civil Code article
2120, foresees that, when the work contract ends
and working relations close, an employee shall be
paid a sum calculated on the basis of the length of
time he/she was employed and the amount of
remuneration received.
Following the reform on additional welfare benefits,
amounts matured up to 31/12/2006 remain in the
company and the old governance system will be
applied on these. Instead, for amounts matured
since 01/01/2007, the employees can decide
whether to allocate them as an additional welfare
payment or to keep them in the company (if the
company employs at least 50 people) or even have
them put into a treasury fund (if the company
employs at least 50 people) set up at INPS (State
Welfare Offices).
Therefore:
Severance Pay amounts matured up until
31/12/2006 and amounts matured since
01/01/2007 and kept in the company, are
shown as definite benefit plans, while
Severance Pay amounts matured since
01/01/2007 and transferred into
additional welfare funds or treasury funds
at INPS, are shown as definite contribution
plans.
Severance Pay is calculated by independent
actuaries using the "matured benefit" method by
means of the "Projected Unit Credit" criterion as
provided for in IAS 19. The calculation method can
be outlined by the following phases:
projection for each employee according to
the assessment date of any Severance Pay
already set aside and any future Severance
Pay amounts that will mature up to the
unforeseeable end of relations and by
projecting the worker's remunerations;
determination for each employee of
probable Severance Pay payments that the
company may have to make should the
employee decide to resign, be dismissed,
be incapacitated, die or take early
retirement as well as any request for
advance payments;
the discounting back, at assessment date,
of each probable payment;
and (for companies with at least 50
employees) the re-proportioning, for each
employee, of the probable and discounted
back services based on the length of
service at assessment date compared to
the entire unpredictable amount at
liquidation date.
Risk and obligation funds
In accordance with the IAS 37, the allocations are
shown when there is an ongoing obligation (legal or
implicit) that stems from a past event, whenever an
outlay may be necessary to satisfy the obligation
and a feasible estimation may be made on the
obligation amount.
Commercial debts and other current liabilities
The commercial debts, whose deadlines are within
normal commercial terms, are not updated and are
registered at cost (identified by their nominal
value).
Financial liabilities are initially shown at cost, which
corresponds to the fair value of the liability, net of
transition costs, which are directly attributable to
the issue of the liability itself.
After the initial determination, the financial
liabilities are assessed with the criterion of
amortized cost using the effective original interest
rate method.
Interim Management Report at 31st March 2014
Pa
ge
|
2
2
Revenues and costs
The revenues and costs are determined in
accordance with the qualifying economic principle
to the amount to which the fair value can be feasibly
determined.
Depending on the type of operation, the revenues
are determined on the basis of the specific criteria
reported below:
- the revenues for services are determined with
reference to the point at which they stand on the
basis of the same criteria used for determining the
position of ongoing orders. If it is not possible to
feasibly determine the revenue values, they are
then calculated until they concur with the amount
of expenses sustained and which are deemed
recoverable.
- the profits from the sale of goods are shown when
significant risks and benefits of the ownership of the
goods are transferred to the purchaser, the sale
price is agreed or can be determined and payment
is collected.
As for sales concerning assistance and/or
maintenance services carried out with the annual
subscription formula, the accrual is calculated in
proportion with time.
The costs are ascribed in the balance according to
the same criteria as those for revenue
acknowledgment.
Use of estimates
The drafting of the Interim Management Report
requires the company management to the
formulation of evaluations, estimates and
hypotheses to apply the accounting standards
which affect the amounts of credit and debit and
the costs and revenues found. Estimates and their
relative hypotheses are based on past experience
and factors considered reasonable for the case.
Since they are estimates, the results obtained are
not necessarily the same as the results portrayed.
The estimates and hypotheses are reviewed on a
regular basis. Any variations deriving from an
accounting estimate review are shown in the period
in which the review was made if such review only
affects that period. If the review affects the current
and future periods, the variation is recorded in the
period in which the review is made and in the
relative subsequent periods.
Accounting standards, amendments and interpretations applied since 1st January 2014
There are no, or no significant, other matters and
cases governed by standards, amendments and
interpretations effective from 1st January 2014
approved by the IASB and IFRIC and published in the
European Community's Official Gazette. No
standards approved by the European Union, the
application of which will be compulsory in the
future, have been adopted in advance.
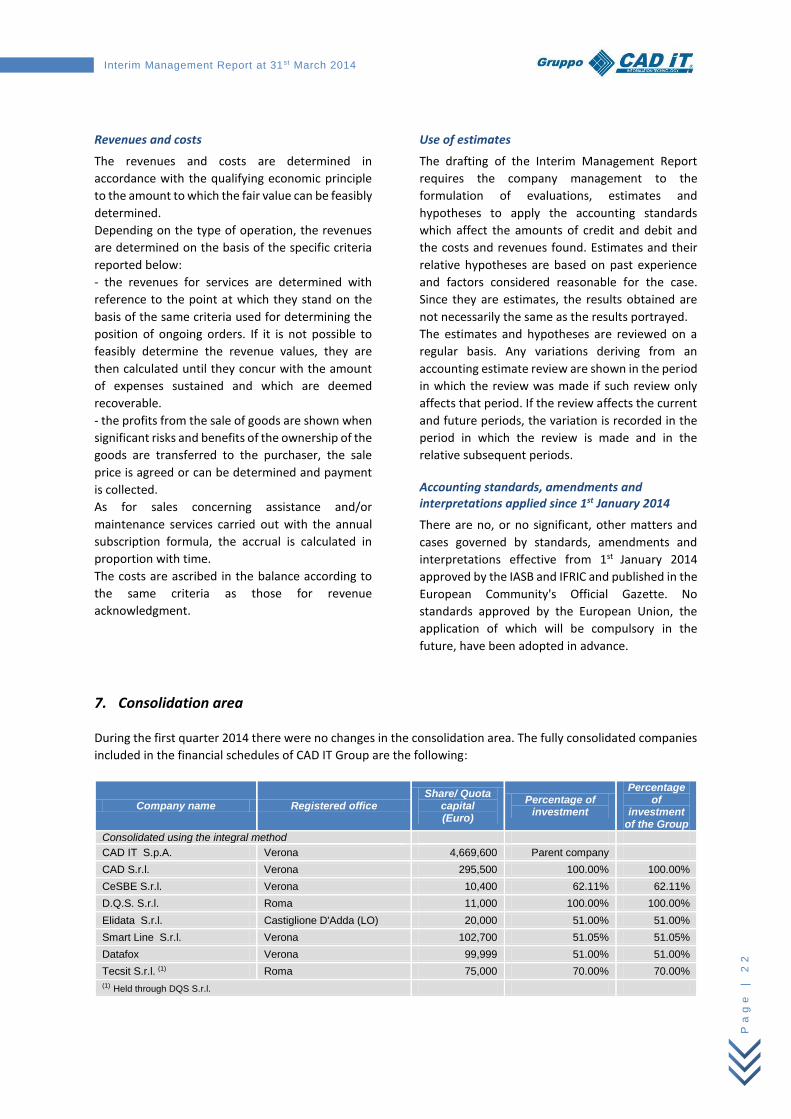
7. Consolidation area
During the first quarter 2014 there were no changes in the consolidation area. The fully consolidated companies
included in the financial schedules of CAD IT Group are the following:
Company name Registered office Share/ Quota
capital (Euro)
Percentage of investment
Percentage of
investment of the Group
Consolidated using the integral method
CAD IT S.p.A. Verona 4,669,600 Parent company
CAD S.r.l. Verona 295,500 100.00% 100.00%
CeSBE S.r.l. Verona 10,400 62.11% 62.11%
D.Q.S. S.r.l. Roma 11,000 100.00% 100.00%
Elidata S.r.l. Castiglione D'Adda (LO) 20,000 51.00% 51.00%
Smart Line S.r.l. Verona 102,700 51.05% 51.05%
Datafox Verona 99,999 51.00% 51.00%
Tecsit S.r.l. (1) Roma 75,000 70.00% 70.00%
(1) Held through DQS S.r.l.

Interim Management Report at 31st March 2014
Pa
ge
|
2
3
Shares in associates, in which the Group has significant influence, have been evaluated using the equity method
and reduced accordingly where the asset value has decreased.
Company name Registered
office Date of
reference Quotaholders'
equity Pre-tax result 01/01-31/03
Percentage of investment
Investment value of the
Group
Sicom S.r.l. Viadana (MN) 31/03/2013 1,201 481 25.00% 300
31/03/2014 1,303 571 25.00% 326
8. The short-term situation 1
Global output and trade are continuing to expand, but with signs of weakness in some emerging countries, in the
first quarter 2014.
In euro-area financial markets, the rise of bond prices and the reduction in risk premiums have gained pace. The
improvement is attributable mainly to the dissipation of fears of a break-up of the Monetary Union and to the
progress made in macroeconomic adjustment in member countries, but it also reflects the large inflow of capital
exiting the emerging countries in search of safer investments. With economic growth still moderate and uneven,
inflation in the euro area remains well below recent forecasts. The Governing Council of the ECB is resolute in its
commitment to using also unconventional instruments, such as market purchases of bonds, in order to cope
effectively with risks of a too prolonged period of low inflation.
In Italy, there are signs that the recovery is slowly spreading: the performance of industrial production and the
results of business surveys indicate that economic activity has continued to expand at a moderate pace in the
first few months of the year. The strength of the recovery differs by category of firm and geographical area, but
it appears to be spreading gradually. Surveys indicate that the improvement in the prospects of large industrial
firms and export-oriented companies is accompanied by initial positive signs for service businesses as well. The
situation remains less favourable in the South.
The profitability of Italian banking groups was affected in 2013 by a decline in the volume of lending, which was
a factor in the decline in net interest income. Despite the curbing of operating costs, profit for the year shrank.
Profitability was eroded above all by the banks’ substantial loan loss provisions, up by a third owing to the major
groups’ particularly prudent valuation of their balance-sheet assets which, however, helped to boost their share
prices. Net of one-off items such as goodwill impairments, ROE was negative by 1.3 per cent.
9. Significant events of the period
With effect as of 1st January 2014, the non‐executive director Enrique Sacau, has resigned as a member of the Company’s Board of Directors, following the taking on of new tasks that prevent him from attending the Board’s meetings. Enrique Sacau, the non‐executive and non‐independent director, did not belong to any internal committee. In February 2014 CAD IT has been granted the contract for the supply of the “MA‐Market Abuse” application platform and the relative specialist support services for monitoring of Market Abuse, Personal Transactions and Conflicts of interest for Poste Italiane S.p.A.. The platform developed by CAD IT is able to identify any market manipulation and insider trading suspicious transactions in accordance with the European and Italian Market Abuse regulations. The procedure also manages also the conflicts of interest register. Activities regarding the development and sale of new products for both traditional and new types of clients continued throughout the period. Moreover, the planning activities with Xchanging UK Ltd (a company that supplies security administration services for the German and British market and which holds a 10% share in CAD IT S.p.A.) through which the CAD IT Group aims at increasing its revenues in Italy and also to diversify its business in geographical terms, is continuing.
1 Data source: Banca D’Italia, Economic Bulletin no. 2, April 2014.
Interim Management Report at 31st March 2014
Pa
ge
|
2
4
10. Management results and comments on the most significant components in the quarter
31/03/2014 31/03/2013 Variations
€/000 % PV €/000 % PV €/000 %
Income from sales and services 12,899 93.5% 12,110 92.9% 789 6.5%
Asset increases due to internal work 869 6.3% 895 6.9% (26) (2.9%)
Other revenue and receipts 33 0.2% 36 0.3% (3) (9.3%)
Production value 13,801 100.0% 13,041 100.0% 760 5.8%
Costs for purchases (136) (1.0%) (90) (0.7%) (46) 51.3%
Costs for service (2,537) (18.4%) (2,080) (15.9%) (458) 22.0%
Other operational costs (150) (1.1%) (147) (1.1%) (3) 2.0%
Added value 10,977 79.5% 10,724 82.2% 253 2.4%
Labour costs (8,969) (65.0%) (8,929) (68.5%) (40) 0.5%
Other administrative expenses (521) (3.8%) (535) (4.1%) 14 (2.6%)
Gross operational result - EBITDA 1,487 10.8% 1,260 9.7% 227 18.0%
Allocation to fund and credit depreciation (4) (0.0%) (2) (0.0%) (2) 64.0%
Intangible fixed asset amortization (1,093) (7.9%) (972) (7.5%) (121) 12.4%
Tangible fixed asset amortization (114) (0.8%) (120) (0.9%) 6 (4.8%)
Operational result - EBIT 276 2.0% 166 1.3% 110 66.3%
Financial income 17 0.1% 20 0.2% (3) (12.9%)
Financial expenses (27) (0.2%) (11) (0.1%) (16) 146.3%
Ordinary result 267 1.9% 175 1.3% 92 52.4%
Revaluations and depreciations 143 1.0% 194 1.5% (52) (26.6%)
Pre-tax result 409 3.0% 369 2.8% 40 10.8%
Pre-tax result attributable to:
Non- controlling interests 31 0.2% (61) (0.5%) 92 (151.8%)
Owners of the parent 378 2.7% 430 3.3% (52) (12.1%)
The CAD IT Group closed the first quarter of 2014 with a value of production of Euro 13,801 thousand, showing
an increase (+5.8%) compared to the same quarter in the previous financial period (Euro 13,041 thousand), thus
achieving positive improved returns.
The value of production was mainly made up of revenues from services and sales amounting to Euro 12,899
thousand, increasing (+6.5%) compared to the same quarter in the previous year (Euro 12,110 thousand).
The increase in internal work capitalized under fixed assets came to Euro 869 thousand, showing a decrease of
Euro 26 thousand compared to the first quarter of the previous year (Euro 895 thousand).
Service costs of Euro 2,537 thousand (equal to 18.4% of the value of production) increased (+458 thousand of
Euro) compared to Euro 2,080 thousand (equal to 15.9% of the value of production) in the first quarter of 2013.
Service costs consist of external collaborations (Euro 1,112 thousand), travelling expenses and fee
reimbursement (Euro 387 thousand) and other service costs (Euro 1,038 thousand).
The Euro 10,977 thousand of added value was equal to 79.5% of the value of production, compared to Euro
10,724 thousand in the first quarter of previous year (82.2% of the value of production).
Labour costs during the quarter came to Euro 8,969 thousand, a slight increase (+40 thousand of Euro) compared
to Euro 8,929 thousand in the same period of 2013. The average number of employees during the quarter was
612 units, increasing compared to the same quarter of 2013 (605 units).
Other administrative costs came to Euro 521 thousand, a slight decrease compared to the previous year (Euro
535 thousand).
The EBITDA revenue margin stood at Euro 1,487 thousand, showing an increase compared to Euro 1,260

Interim Management Report at 31st March 2014
Pa
ge
|
2
5
thousand in the first quarter of 2013 (+18.0%).
Amortization quotas during the quarter were Euro 1,093 thousand for intangible assets and Euro 114 thousand
for tangible assets, compared to Euro 972 thousand and 120 thousand respectively of the same quarter of 2013.
Depreciation and amortization of intangible assets increased compared to the previous period due to the
beginning of the amortization schedules of software procedures, concluded in previous years, which have
become available for use and for sale.
The EBIT operational result for the quarter was in credit by Euro 276 thousand compared to Euro 166 thousand
in the same period of previous year, showing an increase of Euro 110 thousand.
The result of the financial management recorded revenue of Euro 17 thousand and financial expense for Euro 27
thousand, compared respectively to Euro 20 and 11 thousand in the first quarter of last year.
The ordinary result was in credit by Euro 267 thousand compared to Euro 175 thousand in the first quarter of
2013.
The revaluations of the period refer to the share of profit of associate company, calculated with the net
patrimony method, which generated a Euro 143 thousand revaluation. In the first quarter of 2013 the
revaluations were related for Euro 120 thousand to the share of profit of associate company, calculated with the
net patrimony method, as well as for Euro 74 thousand to the capital gain from the sale of assets available for
sale.
The pre-tax result was in credit by Euro 409 thousand (equal to 3.0% of the value of production), improving
(+10.8%) compared to the same quarter in the previous financial year when the figure registered was Euro 369
thousand (equal to 2.8% of the value of production).
The interim management report was presented without calculating the income taxes for the period.
The profit for the period ascribed to CAD IT shareholders was Euro 378 thousand compared to Euro 430 thousand
in the first quarter of the previous financial year; the third party share was positive for Euro 31 thousand,
compared to a loss of Euro 61 thousand in the first quarter of 2013.
The figures summarizing earnings from sales and services, subdivided according to the business line and
compared to the corresponding amounts of the same periods of previous year, are shown below.
Income from sales and services
1° Quarter 2014 1° Quarter 2013
€/000 % €/000 %
Finance 12,485 96.79% 11,647 96.18%
Manufacturing 414 3.21% 462 3.82%
Total 12,899 100% 12,110 100%
11. Net financial position
The net financial position of the Group as at 31st March 2014 was positive for Euro 118 thousand, a significant
improvement compared to the previous year, when the position showed an indebtedness of Euro 2,575
thousand.
In particular, cash-on-hand bank accounts and cash amounted to Euro 2,107 thousand and capitalization
insurance policies (contractually available on 20-day prior request without any significant tax expenses) to Euro
2,570 thousand. Short-term debts towards banks of Euro 4,559 thousand regard overdrawn accounts and
advances subject to final payment and decreased compared to Euro 6,382 thousand at 31/12/2013.

Interim Management Report at 31st March 2014
Pa
ge
|
2
6
(in thousands of Euro)
Net consolidated financial position 31/03/2014 31/12/2013 31/03/2013
Cash-on-hand and at bank 2,107 1,253 3,570
Capitalization insurance policies 2,570 2,555 2,508
Payables due to banks current portion (4,559) (6,382) (475)
Net short-term financial position/(indebtedness) 118 (2,575) 5,602
Long-term loans (0) (0) (0)
Net long-term financial position/(indebtedness) (0) (0) (0)
Net financial position/(indebtedness) 118 (2,575) 5,602
As shown in the financial report, operating activities, in the first quarter of 2014, generated a positive cash flow
of Euro 3,465 thousand (increasing compared to Euro 2,369 thousand in the first quarter of 2013).
Investment activity management took Euro 771 thousand, increasing compared to Euro 652 thousand used in
the same period of previous year. Specifically Euro 898 thousand were invested in intangible assets and Euro 25
thousand in tangible assets, while Euro 170 thousand were collected as dividends and Euro 17 thousand as
interest income.
Please refer to Consolidated Cash Flow Statement for more cash flow details.
12. Research and development
In relation to activities aimed at consolidating traditional business, the realization of new modules to increase
the functional and/or technological development of the considerable range of software installed is still underway
within the Group.
The creation and use of new computer systems aimed at diversifying the Group’s offer towards those sectors
bordering on the ones in which it is already present and to new markets abroad, is still underway.
As regards new projects, development are continuing on the SIBAC GS platform. Development and innovation
activities for the Finance Area Web Suite is particularly intense with the aim to improve user experience and
create new functions or modules required by the national and international markets (like, for example, Easy
Action: a new generation, comprehensive platform for the controlled end-to-end management of corporate
actions and income). Investments are still being ploughed into the innovation and extension of specialised
modules for financial insurance management whose area covers all processes relating to company investment
management from front to back office.
CAD IT, in activities aimed at developing its own range of products, is also creating solutions linked to the new
laws (for example, Solvency II, Target 2 Securities and FATCA).
Activity in the production of specialized modules for the business intelligence (Managerial Information System)
area is also continuing, especially in regard to risks, fraud and long-distance control.
Investment to enrich the offer range of solutions and services for Public Administration and authorities for the
management of local taxes is also continuing.
13. Investments and intangible and tangible fixed assets
The figures accumulated in investments in intangible and tangible assets, made during the quarter by companies
of the Group included in the consolidation area amount to Euro 923 thousand, compared to Euro 965 thousand
in the same period in 2013.

Interim Management Report at 31st March 2014
Pa
ge
|
2
7
(in thousands of Euro)
Summary of investments 1° Quarter 1° Quarter Year
2014 2013 2013
Intangible fixed assets 29 24 134
Assets under development and payments on account 869 895 3,715
Property, Plant and equipment 25 47 154
Total investments in tangible and intangible fixed assets 923 965 4,002
The voice assets under development relates to investments in development of software procedures under
construction both for sale and for in-company use. Particularly ongoing intangible asset costs mainly refer to the
use of the Group’s internal resources for the development of its own software which will either be licensed out
to clients or used for the Group’s activities.
During the period, the item "Intangible fixed assets" and “Property, Plant and equipment” varied as follows: (in thousands of Euro)
Intangible fixed assets
Industrial patents
and similar rights
Licences, trademarks
Assets under development
and payments on
account
Other intangible
fixed assets Total
Purchase or production cost 31,727 3,959 8,192 27 43,905
Previous years revaluations - - - - -
Previous years depreciation and write-downs (19,500) (3,728) - (27) (23,255)
Adjustments to previous years write-downs - - - - -
Opening value 12,227 232 8,192 0 20,650
Variations in consolidation area - - - - -
Purchases/increases - 29 869 - 898
Transfers 2,327 - (2,327) - -
Reduction in accumulated depreciation due to disposals
- - - - -
Disposals - - - - -
Revaluations for the period - - - - -
Depreciation and write-downs for the period (1,060) (33) - - (1,093)
Adjustments to write-downs for the period - - - - -
Total intangible fixed assets 13,494 227 6,734 0 20,455
During the quarter, significant software development projects for which there was ongoing investment were
ended and therefore the incurred costs were reclassified from the voice "assets under development" , to the
voice "patent rights and intellectual property", for a value of Euro 2,327 thousand.

Interim Management Report at 31st March 2014
Pa
ge
|
2
8
(in thousands of Euro)
Property, plant and equipment Land and buildings
Plant and machinery
Industrial and commercial equipment
Other tangible
fixed assets Total
Purchase or production cost 9,140 4,187 33 5,060 18,420
First time adoption revaluation 8,439 - - - 8,439
Previous years depreciation and write-downs (1,585) (3,155) (29) (4,644) (9,414)
Adjustments to previous years write-downs - - - - -
Opening value 15,993 1,032 4 416 17,445
Variations in consolidation area - - - - -
Purchases - 1 - 25 25
Transfers - - - - -
Reduction in accumulated depreciation due to disposals - - - 10 10
Disposals - - - (10) (10)
Revaluations for the period - - - - -
Depreciation and write-downs for the period (30) (39) (0) (44) (114)
Adjustments to write-downs for the period - - - - -
Total tangible fixed assets 15,963 993 3 396 17,356
14. Personnel
The number of CAD IT Group staff, at the end of the quarter decreased by 2 units compared to the end of 2013
financial period. Information on the actual number employees at the end of each period is reported below:
Category of Employees Labour force at
31/03/2014 Labour force at
31/03/2013 Labour force at
31/12/2013
Management 18 18 18
White-collars and cadres 578 575 580
Blue-collars 1 1 1
Apprentices 14 13 14
Total 611 607 613
The average number of employees in the quarter was 612 units, increasing compared to the same reference
quarter of the 2013 financial period (605 units).
Category of Employees Average number I Quarter 2014
Average number I Quarter 2013
Average number year 2013
Management 18 18 18
White-collars and cadres 579 576 578
Blue-collars 1 1 1
Apprentices 14 10 12
Total 612 605 609
The Group dedicates particular attention to professional staff training by means of internal training programmes
and updating courses.

Interim Management Report at 31st March 2014
Pa
ge
|
2
9
15. Significant events since 31st March 2014
On 29th April 2014, the Ordinary Shareholders’ Meeting approved the Annual Financial Statements at 31st
December 2013.
In order to replace the resigning director Enrique Sacau, the Shareholders’ Meeting of CAD IT S.p.A. has
confirmed the appointment of the co-opted non-executive and non-independent Director Thomas Burkhart, who
will be in charge until the expiry date for the entire Board of Directors, i.e. until the date of the Shareholders’
Meeting that will be called for the approval of the financial statements for the year ending on 31st December
2014. The Shareholders’ Meeting also approved the first section of the Remuneration Report pursuant to article
123-ter of Leg. Dec no. 58/1998 (available in the Company’s website).
No events have occurred that could noticeably effect the economic, patrimonial and financial situation of the
company.
16. Other Information
CAD IT, in accordance with art. 3 of Consob Deliberation no. 18079 of 20th January 2012, has decided to comply
with the simplification regime provided for in articles 70, paragraph 8, and 71, paragraph 1-bis of Consob
Regulation no. 11971/1999 and subsequent modifications and integrations, therefore availing itself of the right
to waiver the obligation to present the expected information documents on significant operations relating to
mergers, splits, increases in capital by means of the transfer of assets, acquisitions and sales.
17. Foreseeable management developments
In response to the current general situation the Board of Directors has placed maximum attention on market
needs in order to lead the Group’s management and development strategies in the right direction and to
maintain high levels of efficiency so that favourable economic results can be achieved in the future.
The success of the Group’s activities will therefore depend on its ability to maintain and increase the shares it
has in the markets in which it currently operates and/or to further expand into other markets and segments (like
insurance, public administration, foreign financial institutions) through new and high standard, quality products
that would guarantee adequate income levels.
The main strategic objectives of the company and the Group are to maintain and further develop its leadership
position in the Italian banking sector, increase its customer portfolio in the insurance and local tax collection
sectors, further distribute new products relating to business intelligence, promote its software for the industrial
sector at medium/large-sized companies. The Group is also continuing to pursue its efforts to expand towards
the European and international markets, which could be favoured by the optimal references it has obtained from
its existing foreign customers and by the internationalisation procedures for which the large Italian banking
groups are advocating.
The CAD IT S.p.A. managers are also constantly on the look-out for any development opportunities, whether
direct or through external lines, through technical or commercial collaboration agreements and by taking on or
acquiring holdings in order to create activities that are complimentary and synergic to existing ones.
The increase in the Group’s activities resulting from expansion in to Europe and the acquisition of a greater
market share could counterbalance the weakness of domestic demand. The short-term economic situation remains difficult and uncertain, therefore, still a national and international level, and the managerial trend would be subject to risks connected to factors outside the Group’s control. Despite this, the Board of Directors is confident that positive results can still be achieved, considering activities and actions already developed and those planned.
On behalf of the Board of Directors
The Chairman /s/ Giuseppe Dal Cortivo

Interim Management Report at 31st March 2014
Pa
ge
|
3
0
DECLARATION IN ACCORDANCE WITH ARTICLE 154-BIS, SECOND PARAGRAPH, OF LEGISLATIVE
DECREE NO. 58 OF 24 FEBRUARY 1998
The undersigned, Daniele Mozzo, manager in charge of drafting CAD IT S.p.A. accounting documents, hereby
declares, in accordance with article 154-bis, second paragraph, of the Revenue Office “Testo Unico” (Leg. Dec.
58/1998), that the accounting information in this Interim Management Report corresponds to the documentary
results, books and accounting registers.
Verona, 14 May 2014
Manager in charge of drafting
the CAD IT S.p.A. accounting documents
//s// Daniele Mozzo

Interim Management Report at 31st March 2014
Pa
ge
|
3
1
Gruppo CAD IT Via Torricelli, 44/a
37136 Verona - ITALY Tel: +39 045 82 11 111 Fax: +39 045 82 11 110
[email protected] www.caditgroup.com