interim program documentation on system ramp … · the texas a&m university system college...
TRANSCRIPT
Technical Report Documentation Page
1. Rq>on No. 2. Gowrnment Aa:eslion No.
FHW A/TX-94/1232-25 4. Tille and Subtitle
INTERIM PROGRAM DOCUMENTATION ON SYSTEM RAMP CONTROL OPTIMIZATION ALGORITHMS
7. Autbor(s)
Edmond Chin-Ping Chang, Carroll J. Messer, Su-Hua Wang, Wei Huang, and Allen Li 9. Performing Organization Name and Address
Texas Transportation Institute The Texas A&M University System College Station, Texas 77843-3135 12. Sponsoring Agency Name and Address
3. Recipient's Catalog No.
S. Rq>ort Date
May 1994 Revised: October 1994 6. Performing Organization Code
&. Performing Organization Rq>ort No.
Research Report 1232-25
10. Work Unit No.
11. Contract or Grant No.
Study no. 0-1232 13. Type of Rq>ort and Period Covered
Interim: Texas Department of Transportation Research and Technology Transfer Office P.O. Box 5080
September 1991 - August 1992
Austin, Texas 78763-5080 14. Sponsoring Agency Code
lS. Supplementary Notes
Research performed in cooperation with the Texas Department of Transportation and the U.S. Department of Transportation, Federal Highway Admimstration. Research Study Title: Urban Highway Traffic Operations Research and Implementation Program
16. Abstract
Freeway ramp metering systems have been used to improve urban freeway flow. However, control strategies must be properly adjusted to account for ramp queue overflow onto surface streets and to provide equitable on-ramp control during various operating periods. An improved. solution can be obtained by optimizing this problem simultaneously for an extended control period (a group of time slices). This study identifies and examines a microcomputer-based optimization scheme that will assist engineers in developing efficient freeway control strategies to enhance the real-time freeway surveillance and control.
This programmer's manual basically describes the software design aspects of the proposed freeway ramp metering system. The report documents the various programming issues of the component modules, including the main program, input data processor, graphics user interface, and the optional output interface program using Quattro Pro system.
17. Kqr Words
Freeway Corridor, Traffic Management, Ramp Metering, Algorithm Development, Operational Strategy
1&. Dillribution Statement
No restrictions. This document is available to the public through NTIS: National Technical Information Service 5285 Port Royal Road Springfield, Virginia 22161
19. Security Classit (of thil report) 20. Security ctassit (of thil page) 21. No. of Pages 22. Price
Unclassified Unclassified 113 Form DOT F 1700.7 (8-72) Reproduction of completed page authorized

INTERIM PROGRAM DOCUMENTATION ON SYSTEM RAMP CONTROL OPTIMIZATION ALGORITHMS
Edmond Chin-Ping Chang, Ph.D., P.E. Associate Research Engineer
Carroll J. Messer, Ph.D., P.E. Research Engineer
Su-Hua Wang Research Assistant
Wei Huang Research Assistant
and
Allen Li Research Assistant
Texas Transportation Institute
Research Report 1232-25 Research Study Number 0-1232
Research Study Title: Urban Highway Traffic Operations Research and Implementation Program
Sponsored by the Texas Department of Transportation
In Cooperation with U.S. Department of Transportation
Federal Highway Administration
May 1994 Revised: October 1994
TEXAS TRANSPORTATION INSTUTUTE The Texas A&M University System College Station, Texas 77843-3135

IMPLEMENTATION
This report was sponsored by the Texas Department of Transportation under Research Study No. 0-1232, entitled "Urban Highway Operations Research and Implementation Program." This report describes the interim development of a systemwide freeway ramp control strategy and the implementation of a microcomputer-based algorithm for effective freeway system control. A ~raphical Yser Interface (GUI) has also been designed and implemented for off-1 ine and on-line client-server applications.
v


DISCLAIMER
The contents of this report reflect only the views of the authors, who are responsible for the opinions, findings, and conclusions presented herein. The contents do not necessarily reflect the official views or policies of the Texas Department of Transportation or the Federal Highway Administration. This report does not constitute a standard, specification, or regulation.
vii

ACKNOWLEDGEMENTS
The authors would 1 i ke to express their appreciation to the Traffic Operations Division {TRF) of Texas Department of Transportation {TxDOT) for their consideration, assistance, and support throughout the study. The support and assistance from Dr. Tom Urbanik II, and Messrs. George Wier, Kwok-Yin Tam, and Jinxia Bai of the Texas Transportation Institute, Texas A&M University System is also appreciated.
viii
TABLE OF CONTENTS
Li st of Figures List of Tables Summary . . . .
xi xiii xii
1. INTRODUCTION . . . . . . . . . . . . . . . . . . . . . 1
1.1 Study Background . . . . . . . . . . . . . . . . . . . . . 1 1.1.1 Study Methodology . . . . . . 2 1.1.2 Design Considerations 2
1.2 User Interface . . . . . . . . . . . . . . . . . 2 1. 2 .1 Study Design . . . . . 4 1. 2. 2 Operational Features . . . . . . 4
1.3 Overall System . . . . . . . . . . . . . . 6 1.3.1 Possible Expansion . . . . . . . . 6
1.4 Further Development . . . . . . . . . 9
2. DATA INPUT MODULE . . . . . . . . . . . . . . . . . . . 11
2.1 Design Concept . . . . . . . . . . . . . . . . . . . . . . . 11 2.1.1 Stand-alone Screen Format . . 11 2.1.2 Key Control . . . . . . . . . . . . . . . ..... 11 2.1.3 Standard Subroutines . . . . . . . . . . . . . . . . 12 2.1.4 DOS and UNIX Compatibility . . . . . ....... 12 2.1.5 Run-time Options . . . . . . . . . . . .. 12
2.2 Design Approach . . . . . . . . . . . . . . . . ...... 12 2.2.1 Data Flow And Data File Description . . . . . 14 2.2.2 File Formats And Data Structure . . 14 2.2.3 Program Flowchart . . . . . . . . ...... 14 2.2.4 Screen Formats . . . . . . . . ...... 21 2.2.5 Program Highlights . . . . . . . . . . . . 21
2.3 Further Development . . . . . . .. 21
3. SPREADSHEET REPORT MODULE ..... . 23
3.1 Design Concept . . . . . . . . . ............. 23 3.1.1 Related Applications . . . . . . . . . . . . . . . 23 3.1.2 External Database Interface . . . . . . 23 3.1.3 Menu Driven Operation ................. 23
3.2 Design Approach . . . . . . . . . . . . . . . . . ... 24 3.2.1 Data Flow And Data File Description . . . . . . . . 27 3.2.2 Document Format . . . . . . . . . . . . . . . .. 27 3.2.3 Graphics Display Examples . . . . . . . . 27 3.2.4 Program Highlights . . . . ......... 32
3.3 Further Development ....................... 33
ix

4. GRAPHICS DISPLAY MODULE .... . . . . . 35
4.1 Design Concept . . . . . . . . . . . . . . . . . . .. 35 4.1.1 Design Background ............. 35 4.1.2 Graphic Shell (GS) . . . . . . . . . . . . . . . 36 4.1.3 Freeway Graphical User Interface (FGUI) . 36
4.2 Design Approach . . . . . . . . . . . . . . . . . .. 44 4.2.1 Graphic Shell (GS) . . . ............... 44 4.2.2 User Interface (FGUI) ............. 45 4.2.3 User-definable Features . . . . . . . . ..•... 45
4.3 Development Flowchart . . . . . . . . . . . . ..... 47 4.3.1 Prototype Development . . . . . . . . . . . . 47 4.3.2 Pictures Import . . . . . . . . . . . . . . 47 4.3.3 User Interface . . . . . . . . . . . . . . . . . 47 4.3.4 Data Flow And Data File Description . . . . . . . . 47 4.3.5 Program Flowchart ......... 50 4.3.6 Program Highlights . . ....... 50
4.4 Further Development . . . . . . . . . ...... 50
5. MAIN PROGRAM MODULE . . . . . . . 53
5.1 Design Concept . . . . . . . . . .. 53 5.1.1 Freeway Control Theory . . . . . . . . . . .. 53 5.1.2 System Optimization . . . . . . . ...... 54
5.2 Design Approach . . . . . . . . . . . . . . . . . . . . . 57 5.2.1 Problem Description . . . . . . . . . . . 57 5.2.2 Program Formulation . . . . . . . . . . . . . . . . 58 5.2.3 Program Implementation . . . . . . . . . ..... 59 5.2.4 Data Flow And Data File Description . . . .... 59 5.2.5 Program Flowchart . . . . . . . . . . 61 5.2.6 Program Highlights .................. 61
5.3 Program Analysis . . . . . . . . . .. 66 5.3.1 Test Data . . . . . . . . 66 5.3.2 Computation Efficiency ................ 67
5.4 Further Development . . . . . . . . . . . ......... 67
6. CONCLUSIONS AND RECOMMENDATIONS . . . 69
6.1 Pre-Implementation Package 6.2 Real-Time Operation .. 6.3 System Development
. . . . . . . . . . . . . . . 69 . . . . . . . . . . . . . 69
. . . . . . . . . . . 70
REFERENCES ... 71
APPENDIX A. CONTENTS OF DATA FILES . . . . . . . . . . . . . . . . . . 73 . . 85
. . . 93 APPENDIX B. VARIABLE TABLES OF DATA FILES . . . . . . . . . APPENDIX C. SPREADSHEET MACRO PROGRAM LIST APPENDIX D. SYSTEM INSTALLATION PROCEDURE
x
. . . . . 97
LIST OF FIGURES
Figure 1.1 Overall System Flowchart . Figure 1.2 Ramp Control System Concept Figure 1.3 Overall Data Flow Diagram ..
Figure 2.1 Figure 2.2 Figure 2.3 Figure 2.4
Figure 3.1 Figure 3.2 Figure 3.3 Figure 3.4 Figure 3.5 Figure 3.6
Development Flowchart ...... . Data Flow Diagram of Input Program Input Program Flowchart . . ... Screen Format Example .....
Menu Example ........ . Overall Module Design Flowchart Data Flow Diagram .. Table Flow Diagram . Spreadsheet Report Format Graphics Display Examples
FGUI Initial Screen .....
3 5 7
. . 13 . 15
. . 18 22
25 26
• • • • • • • • • • • • 28 • • • • • • 29
• • • • • • • • 30 . . . . . . . . 31
Figure 4.1 Figure 4.2 Figure 4.3 Figure 4.4 Figure 4.5 Figure 4.6 Figure 4.7 Figure 4.8 Figure 4.9
Ramp Queue and Ramp Time Chart . . . . . • • • • • • 37 . . . . . . 38
Figure 5.1 Figure 5.2 Figure 5.3 Figure 5.4 Figure 5.5
V/C Ratio Chart ..... Demand by Section Chart . Timing Plan Chart ... Demand by Ramp Chart . FGUI Configuration File . Development Flowchart .. Data Flow and Program Flow ....
Freeway Ramp Control Theory (5 Levels) Freeway Ramp Metering System (S971) . Data Flow Diagram of Main Program . STUDY971 Environment ...... . STUDY971 Program Flowchart ... .
xi
. . . 39 . . . . . . . 41
. . . . . . . . . 42 . . 43
. . . 46 . 48
. . . . . . 49
. . . . . . 55 . . . 56 . . . 60 .. 63
. . . . . . 64

LIST OF TABLES
Table 1.1 Data File Cross Reference Table ..
Table 2.1 Table 2.2
Table 5.1 Table 5.2 Table 5.3
Data File List of Input Program .. Data Structure for Input Program . . . .
Data File List of Ramp Metering Control Program Procedure List of Main Program .... Computation Efficiency of Main Program ..•.
xii
• • • • 0 • • 8
• 16 . 17
• • • • 62 . . . • . . . • 65 • • • • • • • • 68

SUMMARY
Freeway ramp metering systems have been used to improve urban freeway flow. However, control strategies must be properly adjusted to account for ramp queue overflow onto surface streets and provide equitable on-ramp control during various operating periods. An improved solution can be obtained by optimizing this problem simultaneously for an extended control period (a group of time slices). This study identifies and examines a microcomputer-based optimization scheme that will assist engineers in developing efficient freeway control strategies to enhance the real-time freeway surveillance and control. This programmer's manual basically describes the software design of the proposed freeway ramp metering system currently being developed.
xiii

1. INTRODUCTION
Many operating agencies are currently implementing freeway ~urveillance, kommunications, and kontrol (SC&C) centers to improve freeway corridor operations in Texas. Freeway ramp control systems, a part of the overall freeway Iraffic .Management ~stem (FTMS), can be used to provide effective traffic management alternatives {!). This system should be used as an off-1 i ne system evaluation or an on-line control pattern generation tool to assist freeway traffic management. Developing off-line ramp metering timing patterns and real-time system control requires the continuous monitoring and evaluation of the operating status of freeway mainlanes and ramps {~,~,§,I,17,25).
This programmer's manual describes the development of a systemwide freeway ramp metering control strategy and microcomputer-based algorithm for initial off-line and eventual on-line applications. This report describes the basic design of a freeway ramp metering system control algorithm developed by the Texas Transportation Institute (TTI) in cooperation with the Texas Department of Transportation (TxDOT). A user interface has also been devised to assist the user's understanding and related sensitivity analysis.
The following sections describe the development background, system features, and overall structure of the system.
1.1 STUDY BACKGROUND
Freeway entrance ramp metering systems have been used to regulate traffic input demand and improve traffic flow on urban freeways {~,~,.U,17). The application of a ramp control system offers an effective method of: reducing stop-and-go conditions, decreasing rear-end accidents at ramp gore areas, providing planned diversion possibilities, and assuring the best level-ofservice on the freeway mainlanes. The most popular freeway on-ramp control theory applies the "Demand-Capacity Philosophy," developed in the 1960's {~,§). It states that freeway congestion is often caused by conditions of demand exceeding capacity. Thus, congestion would result if ramp input is not controlled, or if the approaching upstream demand plus input ramp demand is greater than the downstream capacity. Congestion may be prevented if demand is kept less than or equal to facility capacity. This strategy of reducing ramp flow to control or contain recurring freeway congestion is called "metering," in demand-capacity terminology {I,2,,13).
Wattleworth and Berry initiated studies on linear programming techniques to determine the optimum steady state of ramp flow rates in Chicago and Detroit in the 1960's (24). The basic freeway control objective was to maximize system input {ll). Messer improved Wattleworth' s model for multilevel freeway control systems (13). Recently, Yuan and Kreer proposed optimal control algorithm queue-balancing capabilities (25). Chen, et al proposed an on-ramp control model to maximize traffic flow rates on freeway mainlines {~). Papageorgiou proposed a dynamic programming model for the time-of-day control operations (17). These four optimization models can be categorized as sequential solution approaches. In the sequential approach, the optimization problem is solved separately for each individual time slice. Most optimization models represented steady state conditions.
1
1.1.1 Study Methodology
Freeway entrance ramp metering systems have been used to regulate traffic demand and improve flow on the congested urban freeway sections. If ramp queues are expected on some freeway on-ramps that exceed the normal storage capacity, control strategies must be revised to prevent queue overflow back onto the surface streets. The remaining ramp queue and the ramp time must be properly considered in the overall traffic system optimization process.
)
Many ramp control optimization models developed since the I960's can be categorized as "Sequential Models" (!,20,22). An improved solution can be obtained by solving the same problem for a group of time slices, say 4 I5-minute intervals in the peak hour. The "Simultaneous Solution" or "Dynamic Model" has been developed to analyze freeway on-ramp control strategies with known time-of-day demands. The design objectives are to maximize system input flow, balance ramp queues, and fully utilize system storage capacity at each entrance ramp during different operating periods. To model the ramp queue diversion onto ramps downstream, it is assumed that the number of vehicles diverting from the specific freeway on-ramp is in proportion to the total onramp queue length, assuming no apparent changes in the overall freeway operating conditions. Such optimization can reduce potential freeway ramp queue spillovers equally over several time slices, and balance the overall freeway input and output flows.
1.1.2 Des;gn Cons;derat;ons
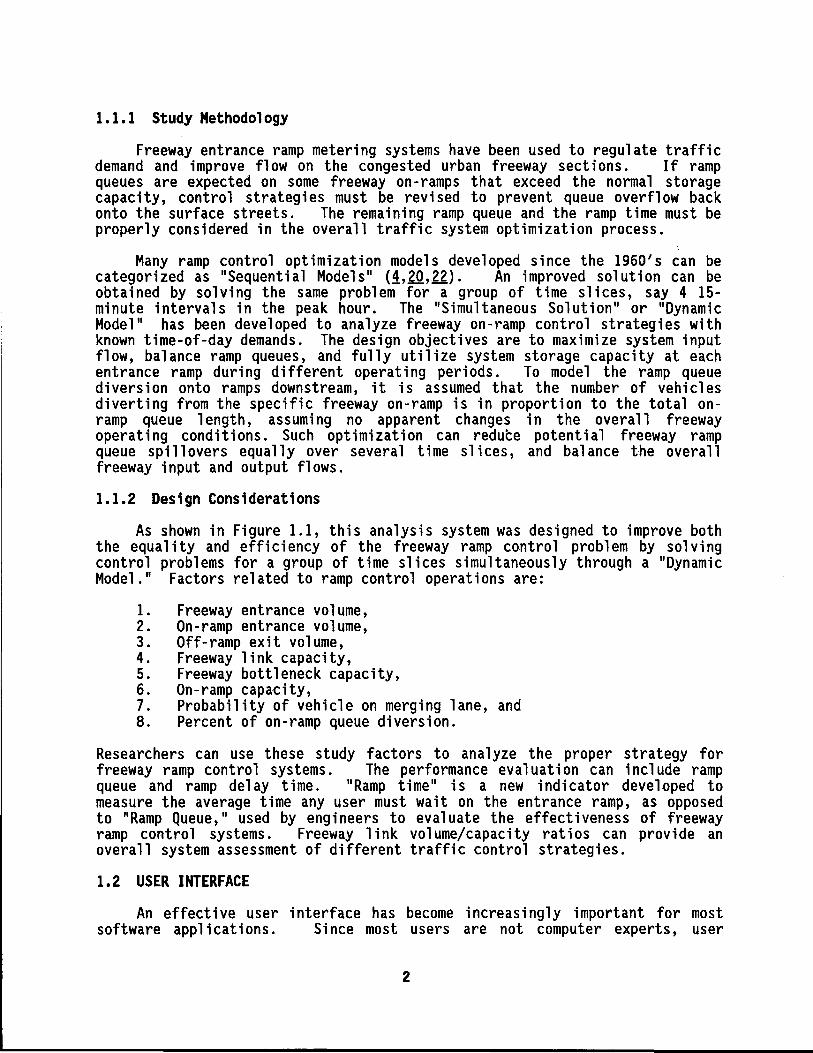
As shown in Figure I.I, this analysis system was designed to improve both the equality and efficiency of the freeway ramp control problem by solving control problems for a group of time slices simultaneously through a "Dynamic Model." Factors related to ramp control operations are:
I. Freeway entrance volume, 2. On-ramp entrance volume, 3. Off-ramp exit volume, 4. Freeway link capacity, 5. Freeway bottleneck capacity, 6. On-ramp capacity, 7. Probability of vehicle on merging lane, and 8. Percent of on-ramp queue diversion.
Researchers can use these study factors to analyze the proper strategy for freeway ramp control systems. The performance evaluation can include ramp queue and ramp delay time. "Ramp time" is a new indicator developed to measure the average time any user must wait on the entrance ramp, as opposed to "Ramp Queue," used by engineers to evaluate the effectiveness of freeway ramp control systems. Freeway link volume/capacity ratios can provide an overall system assessment of different traffic control strategies.
1.2 USER INTERFACE
An effective user interface has become i ncreas i ngl y important for most software applications. Since most users are not computer experts, user
2
,-·-·-·-·-·-' i I I
FREEWAY & RAMP
DATA ( S971.INT )
I i
SCREEN FORMATS ( x.SCR )
I , 1--·-·-·-·-·-·-·r·-·-·-·-·---·~
I
i I
•
·-·-·-·-·-·-·-·-·-·-·-· .. DATA INPUT ·-·---·-·-·-·-·-·-·-·-·-·-· S971 ~-·-·-·-·-·-·
PROGRAM
INPUT I I I
S971.PRM ) ! I I
I I I
I
I
I I I I I I I I
.j,
SCREENDUMP DATA
( S971MTR.OUT )
I S971 MAIN GRAPHICS DISPLAY +·-·-·-·-·-··!
PROGRAM
! I I I I
+ ~--·-·-·-·-·-·-·· S971
OUTPUT ( S9711.0UT )
REPORT FORMAT ( FORMAT.WQ1 r-·-·1
I j·-·-i
MACRO CODE ··-·-·J ( MACRO.WQ1 )
PROGRAM
... I
I
i I
I
CONFIGURATION FILE
( FGUl.CFG )
QUATTRO PRO SPREADSHEET
REPORT
+ METERING
PLANS ( SPREAD.WQ1 )
Figure 1.1 Overall System Flowchart.
3
I
I +·-·-·-·-·-·
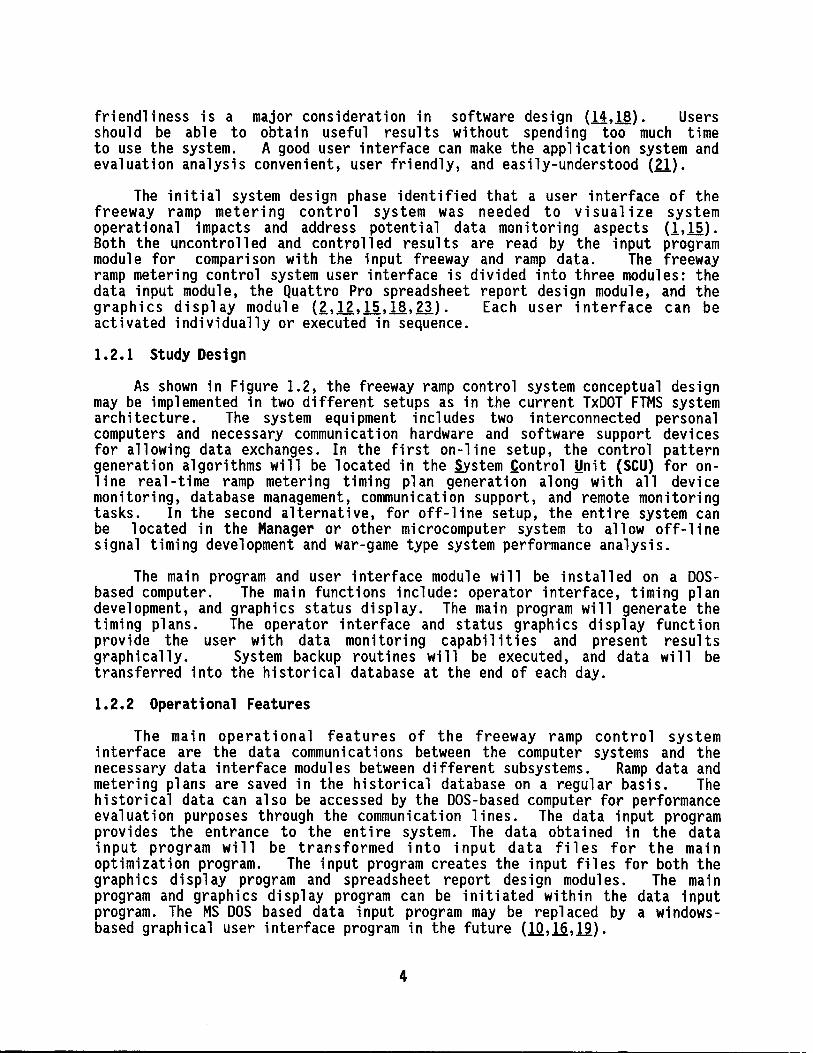
friendliness is a major consideration in software design (14,18). Users should be able to obtain useful results without spending too much time to use the system. A good user interface can make the application system and evaluation analysis convenient, user friendly, and easily-understood (l.l).
The initial system design phase identified that a user interface of the freeway ramp metering contra l system was needed to visualize system operational impacts and address potential data monitoring aspects (1,15.). Both the uncontrolled and controlled results are read by the input program module for comparison with the input freeway and ramp data. The freeway ramp metering control system user interface is divided into three modules: the data input module, the Quattro Pro spreadsheet report design module, and the graphics display module (£,_lZ,l.5_,~,23). Each user interface can be activated individually or executed in sequence.
1.2.1 Study Design
As shown in Figure 1.2, the freeway ramp control system conceptual design may be implemented in two different setups as in the current TxDOT FTMS system architecture. The system equipment includes two interconnected personal computers and necessary communication hardware and software support devices for allowing data exchanges. In the first on-line setup, the control pattern generation algorithms will be located in the ,System ~antral Ynit (SCU} for on-1 ine real-time ramp metering timing plan generation along with all device monitoring, database management, communication support, and remote monitoring tasks. In the second alternative, for off-line setup, the entire system can be located in the Manager or other microcomputer system to allow off-1 ine signal timing development and war-game type system performance analysis.
The main program and user interface module will be installed on a DOSbased computer. The main functions include: operator interface, timing plan development, and graphics status display. The main program will generate the timing pl ans. The operator interface and status graphics display function provide the user with data monitoring capabilities and present results graphically. System backup routines will be executed, and data will be transferred into the historical database at the end of each day.
1.2.2 Operational Features
The main operational features of the freeway ramp control system interface are the data communications between the computer systems and the necessary data interface modules between different subsystems. Ramp data and metering plans are saved in the historical database on a regular basis. The historical data can also be accessed by the DOS-based computer for performance evaluation purposes through the communication lines. The data input program provides the entrance to the entire system. The data obtained in the data input program will be transformed into input data files for the main optimization program. The input program creates the input files for both the graphics display program and spreadsheet report design modules. The main program and graphics display program can be initiated within the data input program. The MS DOS based data input program may be replaced by a windowsbased graphical user interface program in the future (lQ.,16,19).
4

l 110RMTEW • CHT I EDCPC. TTl.10/08191.
ENVIRONMENT (WEATHER, TRAFFIC, INCIDENT) MODEM Ethernet Card 12 PORTS 2400 BAUD> ~er"ial ca~d (2 PORTS 8800 BAUD) 8ili:!tJ 1 . Qili!OtJ
(REMOTE ACCESS) _WJ.. ' --MULTI-PORT c I= =I ii...1= =I
(SERIAL) -(TO FIELD DEVICE) V. V.
"SYSTEM CONTROL UNIT" "MANAGER" 8MB RAM 8MB RAM 200MB HD 200MB HD 5.25" FD 5.25" FD 3.50" FD 3.50" FD
TAPE BACKUP TAPE BACKUP
RAMP CONTROLLER
+ RS232C LOCAL CONTROL
UNIT (DATA)
S.C.U. "FTMS MANAGER" o MULTI-TASKING yo OPERATOR INTERF.J.CE o DEVICE MONITORING Vo TIMING PLAN DEVELOPMENT
+ S/W o DATABASE MANAGEMENT o MAINTAIN BACKUP RECORD o COMMUNICATION SUPPORT yo STATUS GRAPHICS DISPLAY o REMOTE MONITORING o SYSTEM DOCUMENTATION
Figure 1.2 Ramp Control System Concept.
5
1.3 OVERALL SYSTEM
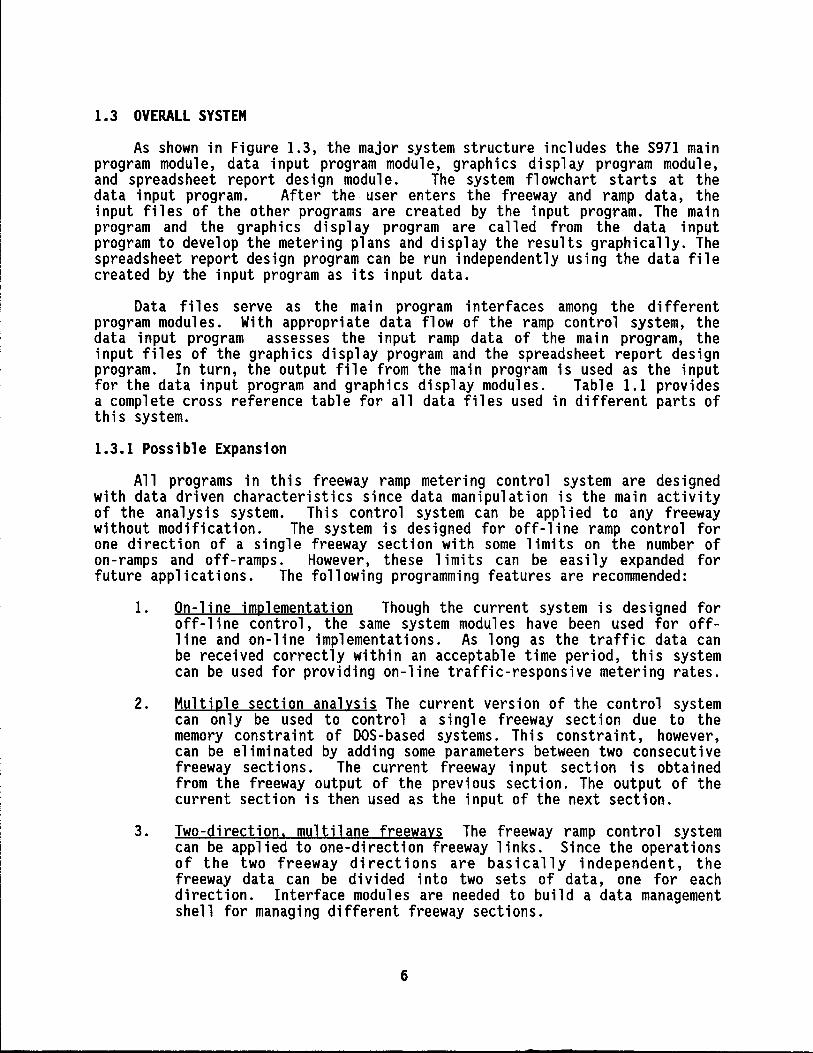
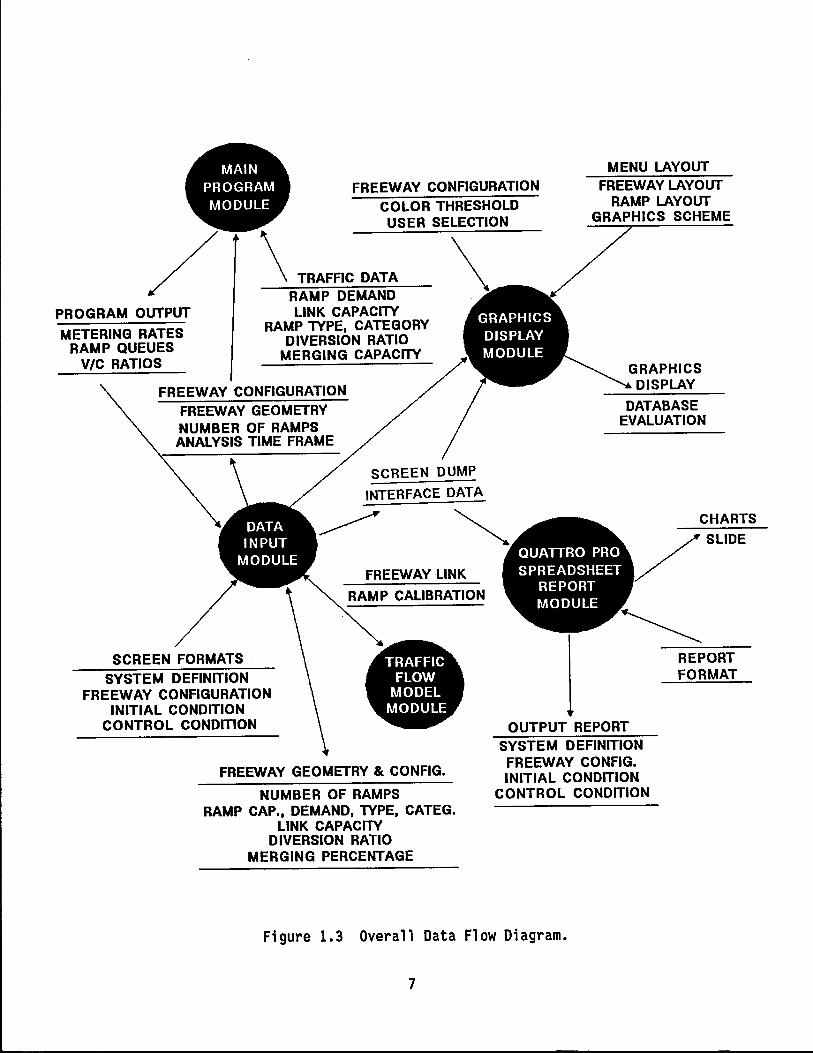
As shown in Figure 1.3, the major system structure includes the S971 main program module, data input program module, graphics display program module, and spreadsheet report design module. The system flowchart starts at the data input program. After the user enters the freeway and ramp data, the input files of the other programs are created by the input program. The main program and the graphics display program are called from the data input program to develop the metering plans and display the results graphically. The spreadsheet report design program can be run independently using the data file created by the input program as its input data.
Data files serve as the main program interfaces among the different program modules. With appropriate data flow of the ramp control system, the data input program assesses the input ramp data of the main program, the input files of the graphics display program and the spreadsheet report design program. In turn, the output file from the main program is used as the input for the data input program and graphics display modules. Table 1.1 provides a complete cross reference table for all data files used in different parts of this system.
1.3.1 Possible Expansion
All programs in this freeway ramp metering control system are designed with data driven characteristics since data manipulation is the main activity of the analysis system. This control system can be applied to any freeway without modification. The system is designed for off-line ramp control for one direction of a single freeway section with some limits on the number of on-ramps and off-ramps. However, these limits can be easily expanded for future applications. The following programming features are recommended:
1. On-line implementation Though the current system is designed for off-line control, the same system modules have been used for offline and on-line implementations. As long as the traffic data can be received correctly within an acceptable time period, this system can be used for providing on-line traffic-responsive metering rates.
2. Multiple section analysis The current version of the control system can only be used to contra l a single freeway section due to the memory constraint of DOS-based systems. This constraint, however, can be eliminated by adding some parameters between two consecutive freeway sections. The current freeway input section is obtained from the freeway output of the previous section. The output of the current section is then used as the input of the next section.
3. Two-direction, multilane freeways The freeway ramp control system can be applied to one-direction freeway links. Since the operations of the two freeway directions are basically independent, the freeway data can be divided into two sets of data, one for each direction. Interface modules are needed to build a data management shell for managing different freeway sections.
6
MENU LAYOUT
FREEWAY CONFIGURATION COLOR THRESHOLD USER SELECTION
FREEWAY LAYOUT RAMP LAYOUT
GRAPHICS SCHEME
PROGRAM OUTPUT
METERING RATES RAMP QUEUES
V/C RATIOS
\ TRAFAC DATA RAMP DEMAND LINK CAPACITY
RAMP TYPE, CATEGORY DIVERSION RATIO
MERGING CAPACITY
FREEWAY CONFIGURATION
FREEWAY GEOMETRY NUMBER OF RAMPS ANALYSIS TIME FRAME
SCREEN FORMATS SYSTEM DEFINITION
FREEWAY CONFIGURATION INITIAL CONDITION
CONTROL CONDITION
SCREEN DUMP
INTERFACE DATA
FREEWAY GEOMETRY & CONFIG.
NUMBER OF RAMPS RAMP CAP., DEMAND, TYPE, CATEG.
LINK CAPACITY DIVERSION RATIO
MERGING PERCENTAGE
GRAPHICS DISPLAY
DATABASE EVALUATION
CHARTS /SLIDE
OUTPUT REPORT SYSTEM DEFINITION FREEWAY CONFIG. INITIAL CONDITION
CONTROL CONDITION
REPORT FORMAT
Figure 1.3 Overall Data Flow Diagram.
7

FILE NAME SHORT DESCRIPTION MAIN INPUT GRAPHICS
SPREAD-
PROGRAM PROGRAM DISPLAY SHEET REPORT
S971.PRM RAMP DATA IN STUDY971 INPUT FORMAT
READ WRITE
INITIAL.DAT INITIAL RAMP DATA FOR READ
S971 MAIN PROGRAM WRITE
INITIAL. MAX FREEWAY GEOMETRY AND READ EIJ MATRIX
WRITE
S9711.0UT OUTPUT OF S971 MAIN WRITE PROGRAM
READ
LPIN.OUT INPUT OF LPNEW IN MPS WRITE FORMAT
LPNEW.OUT OUTPUT OF LPNEW PROGRAM
WRITE
S971FORM.OUT FORMULATION INPUT WRITE FOR LINDO PROGRAM
BUILD.OUT DEBUGGING FILE OF S971 MAIN PROGRAM
WRITE
CHECK.OUT DEBUGGING FILE OF S971 MAIN PROGRAM
WRITE
MATRIX.OUT DEBUGGING FILE OF S971 MAIN PROGRAM WRITE
SYSDEF.SCR SCREEN FORMAT FOR SYSTEM DEFINITION READ
INITCOND.SCR SCREEN FORMAT FOR INITIAL CONDITION
READ
EIJMATRX.SCR SCREEN FORMAT FOR EIJ MATRIX
READ
CTRLCOND.SCR SCREEN FORMAT FOR CONTROL CONDITION
READ
S971.INT INITIAL INPUT DATA FILE OF INPUT PROGRAM UPDATE
S971MTR.OUT SCREENDUMP DATA OF INPUT PROGRAM WRITE READ READ
MACRO.WQ1 MACRO CODE USED FOR REPORT DESIGN READ
FORMAT.WQ1 REPORT FORMAT FOR SPREADSHEET REPORT
READ
SPREAD.WQ1 SPREADSHEET REPORT OF METERING PLANS WRITE
IMAGE FILES IMAGE INPUT FOR GRAPHICS DISPLAY
READ
Table 1.1 Data File Cross Reference Table.
8
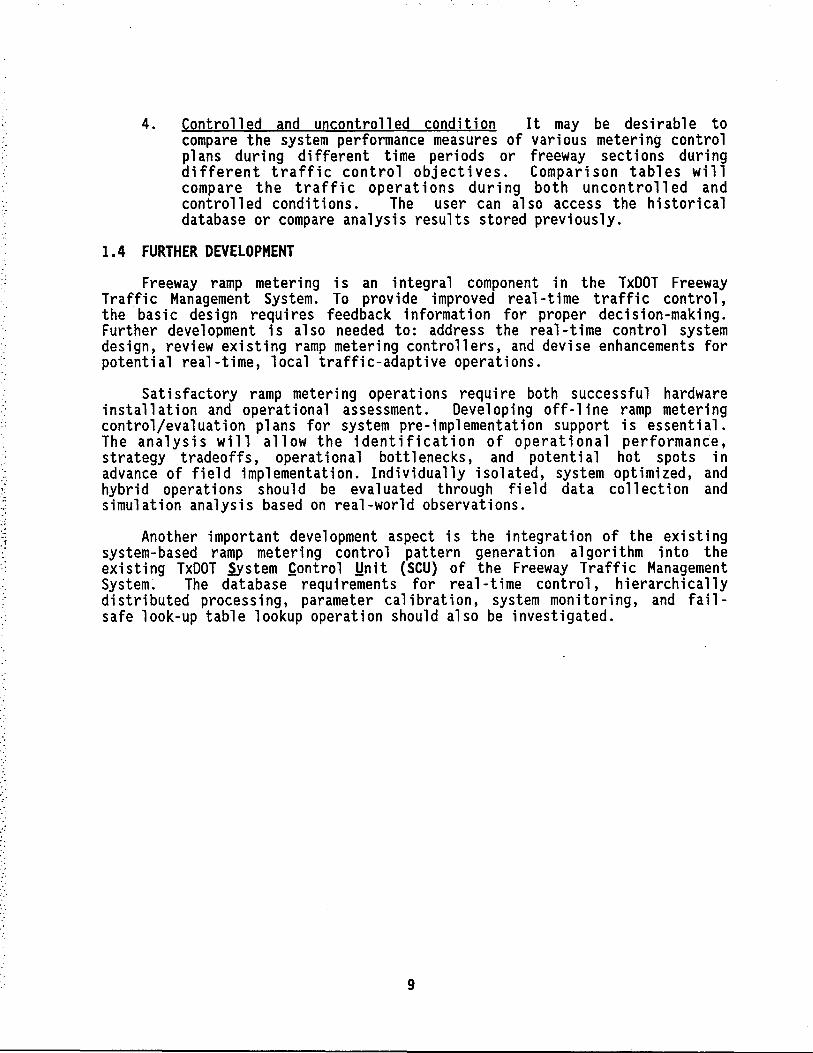
4. Controlled and uncontrolled condition It may be desirable to compare the system performance measures of various metering control plans during different time periods or freeway sections during different traffic control objectives. Comparison tables will compare the traffic op er at ions during both uncontrolled and controlled conditions. The user can also access the historical database or compare analysis results stored previously.
1.4 FURTHER DEVELOPMENT
Freeway ramp metering is an integral component in the TxDOT Freeway Traffic Management System. To provide improved real-time traffic control, the basic design requires feedback information for proper decision-making. Further development is also needed to: address the real-time control system design, review existing ramp metering controllers, and devise enhancements for potential real-time, local traffic-adaptive operations.
Satisfactory ramp metering operations require both successful hardware installation and operational assessment. Developing off-line ramp metering control/evaluation plans for system pre-implementation support is essential. The analysis will allow the identification of operational performance, strategy tradeoffs, operational bottlenecks, and potential hot spots in advance of field implementation. Individually isolated, system optimized, and hybrid operations should be evaluated through field data collection and simulation analysis based on real-world observations.
Another important development aspect is the integration of the existing system-based ramp metering control pattern generation algorithm into the existing TxDOT ~stem ~ontrol Ynit (SCU) of the Freeway Traffic Management System. The database requirements for real-time control, hierarchically distributed processing, parameter calibration, system monitoring, and failsafe look-up table lookup operation should also be investigated.
9

2. DATA INPUT MODULE
The data input module of the freeway ramp metering control system allows freeway ramp data input and result monitoring of the freeway metering control system. Users can use the data input module as an interface to input ramp data, run the metering control module, and examine numerical and graphic control output.
2.1 DESIGN CONCEPT
The data input module allows flexible display and data management access for inputting and outputting data elements to the screens at the same time. Both the main program and graphics display modules can be activated within the data input module, which will serve as the focal point of the entire freeway metering control system. All ramp metering plans can be monitored through the data input module.
This data input module not only serves as an input interface for the freeway metering control system, but will display analysis results. The screen formats, key control, and file management subroutines have been designed as independent modules, allowing a new input module be created easily to meet the user's requirement.
The data input module is designed not only as a user input interface for accessing all the data available in this system but also as a generalized data input module. The main design concept is to make the input module userfri endl y and flexible, and provide data monitoring capability with or without window displays.
2.1.1 Stand-alone Screen Format
The screen formats used in the input interface are designed to be independent from the data input module. Each format file contains the screen texts and field attributes of all data elements on the input screen. These are read from the format files into appropriate arrays at the beginning of execution. In this way, all screen formats can be designed externally without requiring any program modification or recompilation if minor screen format changes are needed. This screen format design, based on the external screen specification during run-time, makes the data input module much more flexible, also making the system design adequate for other applications.
2.1.2 Key Control
The data input module uses normal keyboard commands and function keys. The key control subroutines have been isolated from the rest of the data input module. The key control subroutines pass the parameters needed in each module. Changes in the key control subroutines will not affect the operations of the remaining module, including the main module or other subroutines. Since the key control functions are the only module portion needing replacement, the input module can be easily upgraded from DOS to UNIX by using different built-in key control subroutines.
11
2.1.3 Standard Subrout;nes
Using the standard subroutines designed for the input functions, the input module of the freeway ramp control system becomes a standard model for all input modules. Most functions needed for an input module are provided in the standard version. A new input module can be created efficiently s i nee only a few subroutines may need modification.
2.1.4 DOS and UNIX Compat;b;1;ty
The data input module is designed to be compatible with both DOS and UNIX operating systems. Though the system is currently implemented under the DOS environment, it can be easily upgraded to the UNIX environment in the future. Since there are some differences between the TURBO C in the DOS environment and ANSI C in UNIX, some TURBO C functions have been rewritten to be compatible with ANSI C. Other constants are also used for maximum compatibility between DOS and UNIX.
2.1.5 Run-t;me Opt;ons
Two input modules have been provided with different screen colors through the run-time option. One version displays the screens in the framed window format and the other version uses the default non-framed window with black background. The version can be selected by the user during run time. To run the windows version, the user need only add "-w" as the parameter in the command line. These two versions are included in one source file and decided by the parameter 11 -w" at run time. The second parameter "-q" is used for activating the Quattro Pro execution option.
2.2 DESIGN APPROACH
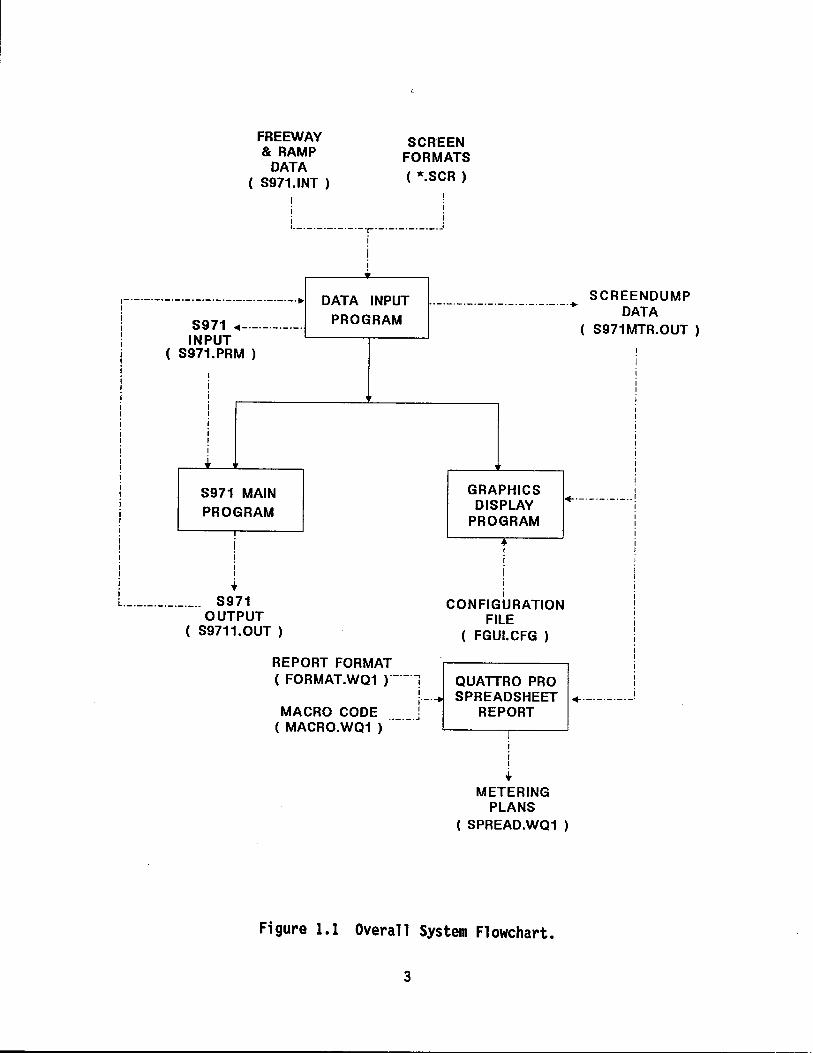
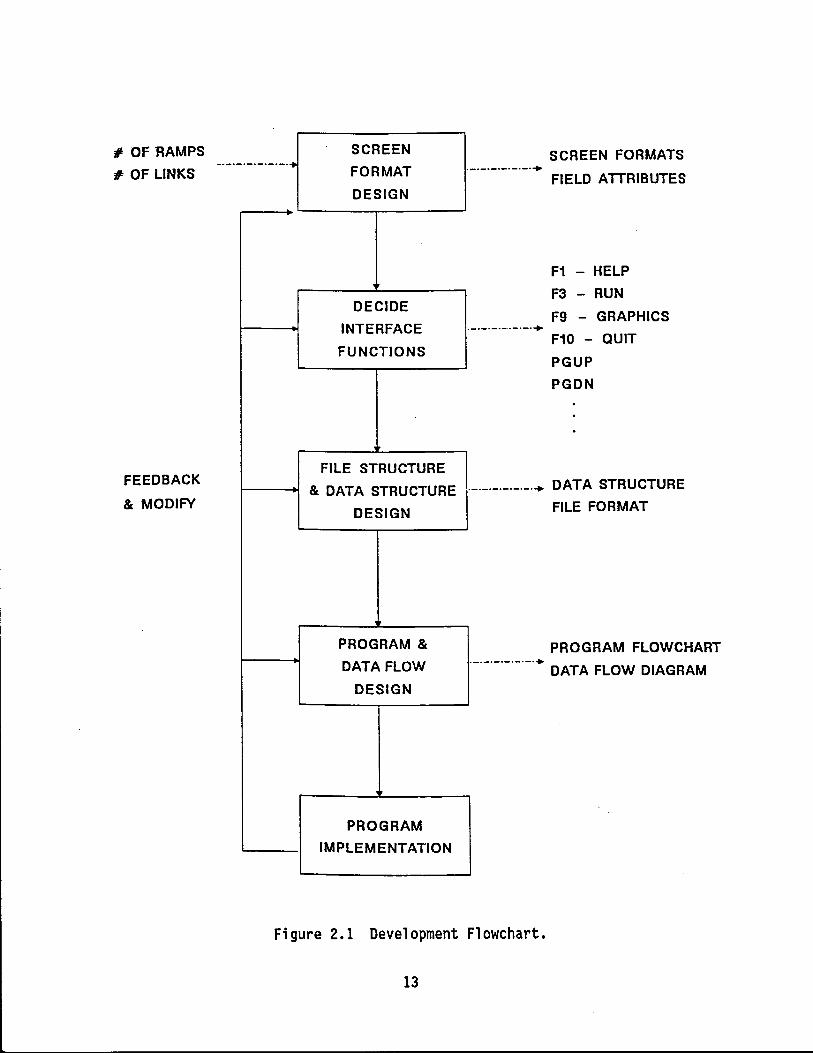
The design approach of the data input module is illustrated in the system development flowchart in Figure 2.1. The design approach is as follows:
1. Design screen format, 2. Determine interface functions, 3. Design data structure and file format, 4. Design program structure and data flow, and 5. Implement program.
The screen format includes all data needed for developing metering control and input data in as few screens as possible. Due to existing memory constraints for system optimization in the MS DOS environment, the current system is limited to 8 on-ramps and 6 off-ramps.
Data input interface functions are mostly initiated by the use of the function keys indicated at the bottom of each screen. The following function keys are used in each screen in the current version. In the following table, the terms SysDef, 1n;tcond, E1jMatrx, and CtrlCond stand for the System Definition screen, Initial Condition screen, Eij matrix screen, and Control Condition screen, respectively.
12
#OF RAMPS
II OF LINKS
FEEDBACK
& MODIFY
SCREEN ·-·-·-·-·-t FORMAT
DESIGN -
'
DECIDE
INTERFACE
FUNCTIONS
FILE STRUCTURE
& DATA STRUCTURE
DESIGN
• PROGRAM &
DATA FLOW
DESIGN
PROGRAM
IMPLEMENTATION
·-·-·-·-·-·-·+
·-·-·-·-·-·-·+
SCREEN FORMATS
FIELD ATTRIBUTES
F1 - HELP
F3 - RUN
F9 - GRAPHICS
F10 - QUIT
PGUP
PGDN
-·-·-·-·-·-·+ DATA STRUCTURE
FILE FORMAT
PROGRAM FLOWCHART -·-·-·-·-·-·+
DATA FLOW DIAGRAM
Figure 2.1 Development Flowchart.
13
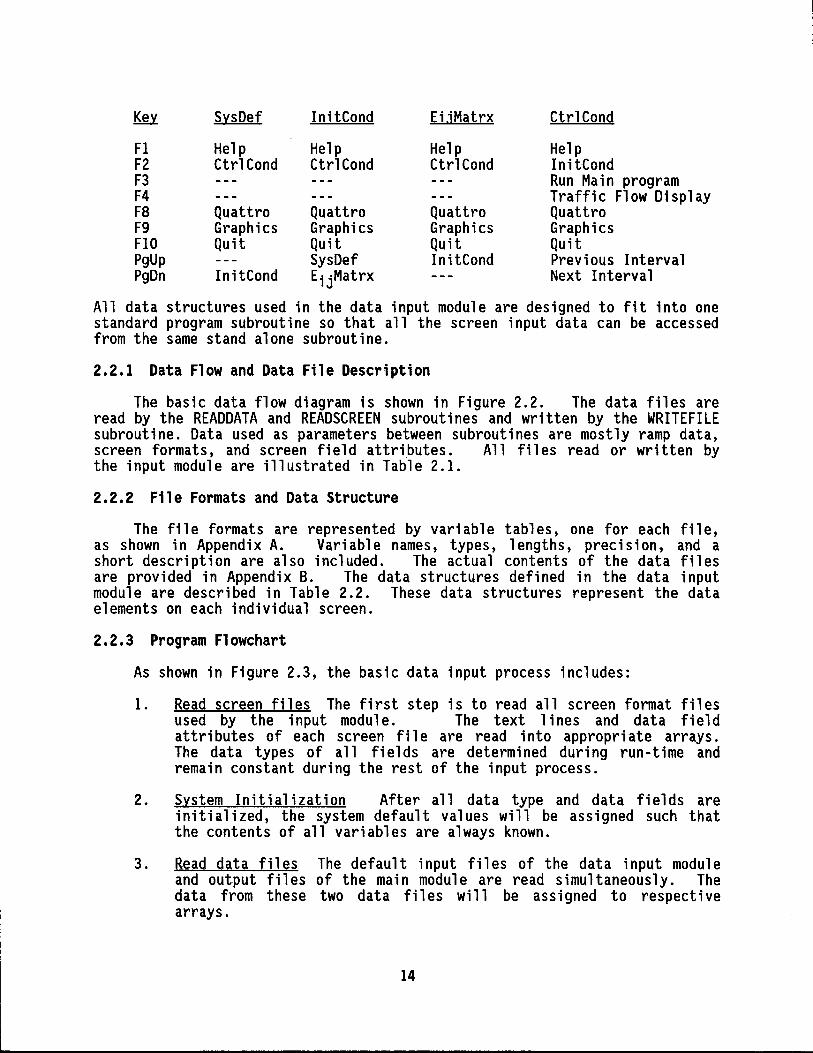
Key Sys Def InitCond EUMatrx CtrlCond
Fl Help Help Help Help F2 CtrlCond CtrlCond CtrlCond InitCond F3 Run Main program F4 Traffic Flow Display FS Quattro Quattro Quattro Quattro F9 Graphics Graphics Graphics Graphics FlO Quit Quit Quit Quit Pg Up SysDef InitCond Previous Interval PgDn InitCond E· ·Matrx lJ Next Interval
All data structures used in the data input module are designed to fit into one standard program subroutine so that all the screen input data can be accessed from the same stand alone subroutine.
2.2.1 Data Flow and Data File Description
The basic data flow diagram is shown in Figure 2.2. The data files are read by the READDATA and READSCREEN subroutines and written by the WRITEFILE subroutine. Data used as parameters between subroutines are mostly ramp data, screen formats, and screen field attributes. All files read or written by the input module are illustrated in Table 2.1.
2.2.2 File Formats and Data Structure
The file formats are represented by variable tables, one for each file, as shown in Appendix A. Variable names, types, lengths, precision, and a short description are also included. The actual contents of the data files are provided in Appendix B. The data structures defined in the data input module are described in Table 2.2. These data structures represent the data elements on each individual screen.
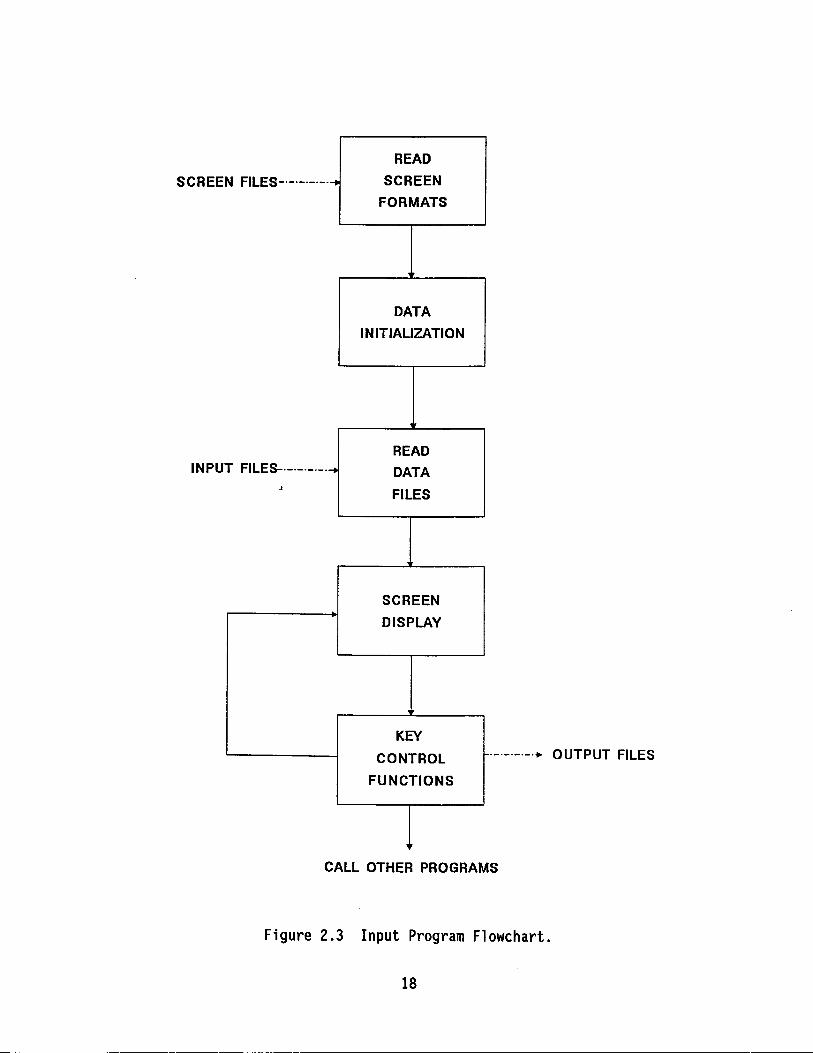
2.2.3 Program Flowchart
As shown in Figure 2.3, the basic data input process includes:
1. Read screen files The first step is to read all screen format files used by the input module. The text lines and data field attributes of each screen file are read into appropriate arrays. The data types of all fields are determined during run-time and remain constant during the rest of the input process.
2. System Initialization After all data type and data fields are initialized, the system default va 1 ues will be assigned such that the contents of all variables are always known.
3. Read data files The default input files of the data input module and output files of the main module are read simultaneously. The data from these two data files will be assigned to respective arrays.
14

SCREEN FORMAT
SCREEN FORMATS
KEY
SCREENDUMP DATA
SCREEN FORMATS
S971 INITIAL
DATA
S971 INPUT
RAMP DATA
Figure 2.2 Data Flow Diagram of Input Program.
15
S971 OUTPUT
Input Fil es:
Output Fil es:
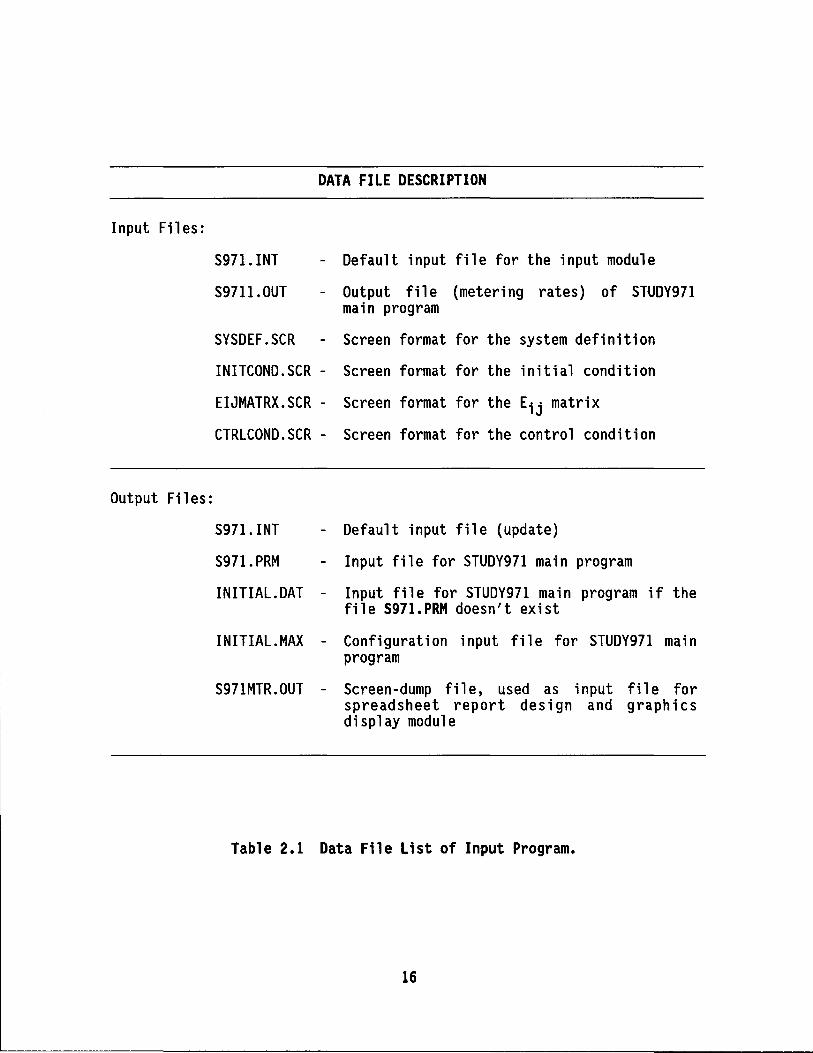
DATA FILE DESCRIPTION
S971.INT - Default input file for the input module
S9711.0UT - Output file (metering rates) of STUDY971 main program
SYSDEF.SCR - Screen format for the system definition
INITCOND.SCR - Screen format for the initial condition
EIJMATRX.SCR - Screen format for the Eij matrix
CTRLCOND.SCR - Screen format for the control condition
S971. INT
S971. PRM
- Default input file (update)
- Input file for STUDY971 main program
INITIAL.DAT - Input file for STUDY971 main program if the file 5971.PRM doesn't exist
INITIAL.MAX - Configuration input file for STUDY971 main program
S971MTR.OUT - Screen-dump file, used as input file for spreadsheet report design and graphics display module
Table 2.1 Data File List of Input Program.
16

DATA STRUCTURES DEFINED IN DATA INPUT MODULE
Attrb: data field attributes
int x - x position of the field int y - y position of the field int len - length of the field int prec - precision specifier, number of decimal points char type - data type of the field, could be d, f, or s
Field: field information of screen
int num - number of fields in the common part int col - number of columns in the entry part int row - number of rows in the entry part Attrb *attrbl - pointer to the attribute data of the first
field of the common part Attrb *attrb2 - pointer to the attribute data of the first
field of the entry part
Value: content of a field
union of: int inum - integer float fnum - floating point number char *cptr - pointer to a string
The data type of a field could be integer, floating point number, or character string.
Data: information of data of a field
Value val - data of a field int skip - flag for skip int print - flag for display
Table 2.2 Data Structure for Input Program.
17
READ
SCREE N FILES-·-·-·-·-·-i SCREEN
FORMATS
lo
DATA
INITIALIZATION
. READ
INPU T FILES-·-·-·-·-·-i DATA ,
FILES
SCREEN -;
DISPLAY
KEY CONTROL ·-·-·-·-·• OUTPUT FILES
FUNCTIONS
CALL OTHER PROGRAMS
Figure 2.3 Input Program Flowchart.
18
4. Display screens After all input data is obtained; the first screen is displayed. The screen file will be displayed along with the rest of the data fie 1 ds in the appropriate pas it i ans. Other screens will be chosen for display with key control functions.
5. Key control functions The key control functions are the most important part of the input module. Different subroutines are called according to the key pressed~ The screen display subroutine displays the right screen and the process continues after changes are made in the data field.
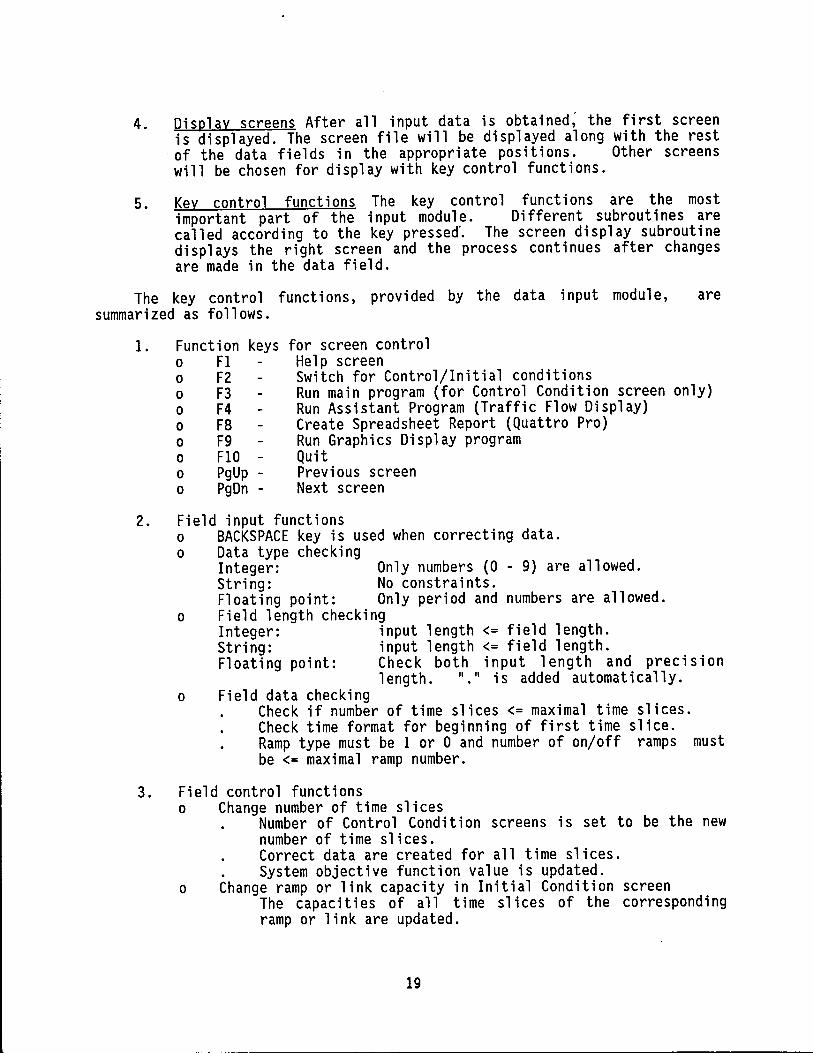
The key control functions, provided by the data input module, are summarized as follows.
1. Function keys for screen control 0 Fl Help screen 0 F2 Switch for Control/Initial conditions 0 F3 Run main program (for Control Condition screen only) 0 F4 Run Assistant Program (Traffic Flow Display) 0 FS Create Spreadsheet Report (Quattro Pro) 0 F9 Run Graphics Display program 0 FlO - Quit 0 PgUp - Previous screen 0 PgDn - Next screen
2. Field input functions o BACKSPACE key is used when correcting data. o Data type checking
Integer: Only numbers (0 - 9) are allowed. String: No constraints. Floating point: Only period and numbers are allowed.
o Field length checking Integer: input length <= field length. String: input length <= field length. Floating point: Check both input length and prec1s1on
1 ength. 11•
11 is added automatically. o Field data checking
Check if number of time slices<= maximal time slices. Check time format for beginning of first time slice. Ramp type must be 1 or 0 and number of on/off ramps must be <= maximal ramp number.
3. Field control functions o Change number of time slices
Number of Control Condition screens is set to be the new number of time slices. Correct data are created for all time slices.
. System objective function value is updated. o Change ramp or link capacity in Initial Condition screen
The capacities of all time slices of the corresponding ramp or link are updated.
19
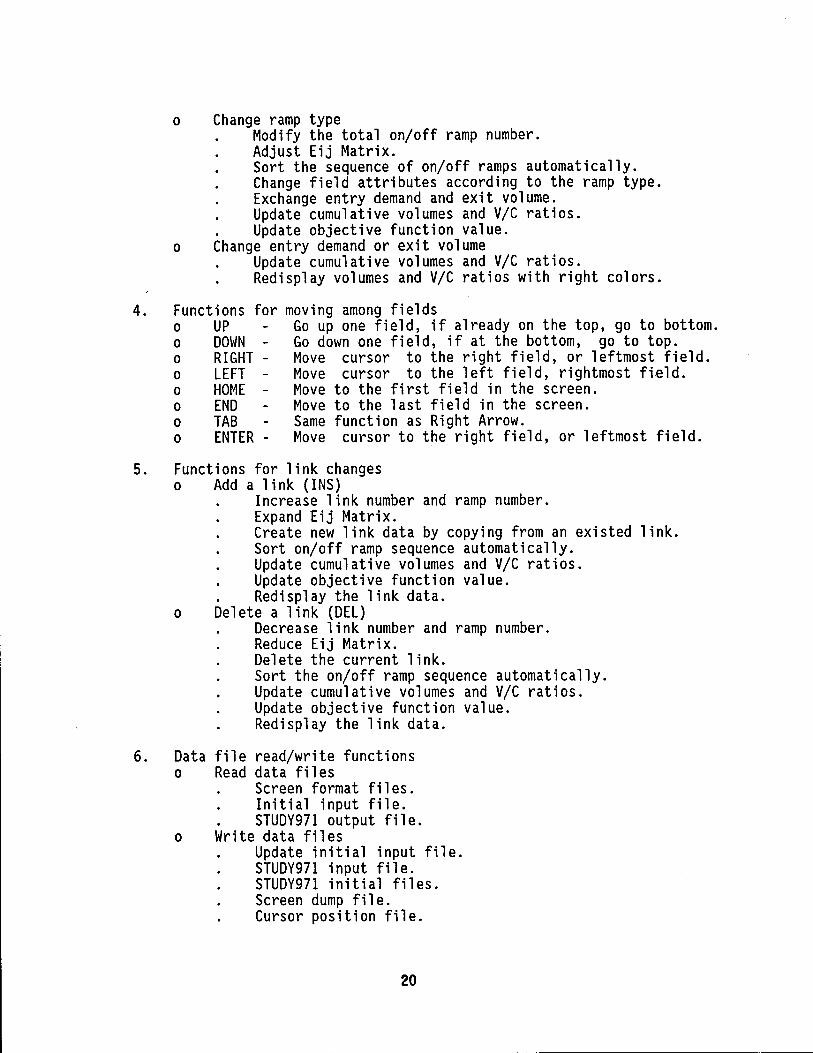
o Change ramp type Modify the total on/off ramp number. Adjust Eij Matrix. Sort the sequence of on/off ramps automatically. Change field attributes according to the ramp type. Exchange entry demand and exit volume. Update cumulative volumes and V/C ratios.
. Update objective function value. o Change entry demand or exit volume
Update cumulative volumes and V/C ratios. Redisplay volumes and V/C ratios with right colors.
4. Functions for moving among fields o UP Go up one field, if already on the top, go to bottom. o DOWN - Go down one field, if at the bottom, go to top. o RIGHT - Move cursor to the right field, or leftmost field. o LEFT - Move cursor to the left field, rightmost field. o HOME - Move to the first field in the screen. o END Move to the last field in the screen. o TAB Same function as Right Arrow. o ENTER - Move cursor to the right field, or leftmost field.
5. Functions for link changes o Add a link (INS)
Increase link number and ramp number. Expand Eij Matrix. Create new link data by copying from an existed link. Sort on/off ramp sequence automatically. Update cumulative volumes and V/C ratios. Update objective function value.
. Redisplay the link data. o Delete a link (DEL)
Decrease link number and ramp number. Reduce Eij Matrix. Delete the current link. Sort the on/off ramp sequence automatically. Update cumulative volumes and V/C ratios. Update objective function value. Redisplay the link data.
6. Data file read/write functions o Read data files
Screen format files. Initial input file.
. STUDY971 output file. o Write data files
Update initial input file. STUDY971 input file. STUDY971 initial files. Screen dump file. Cursor position file.
20
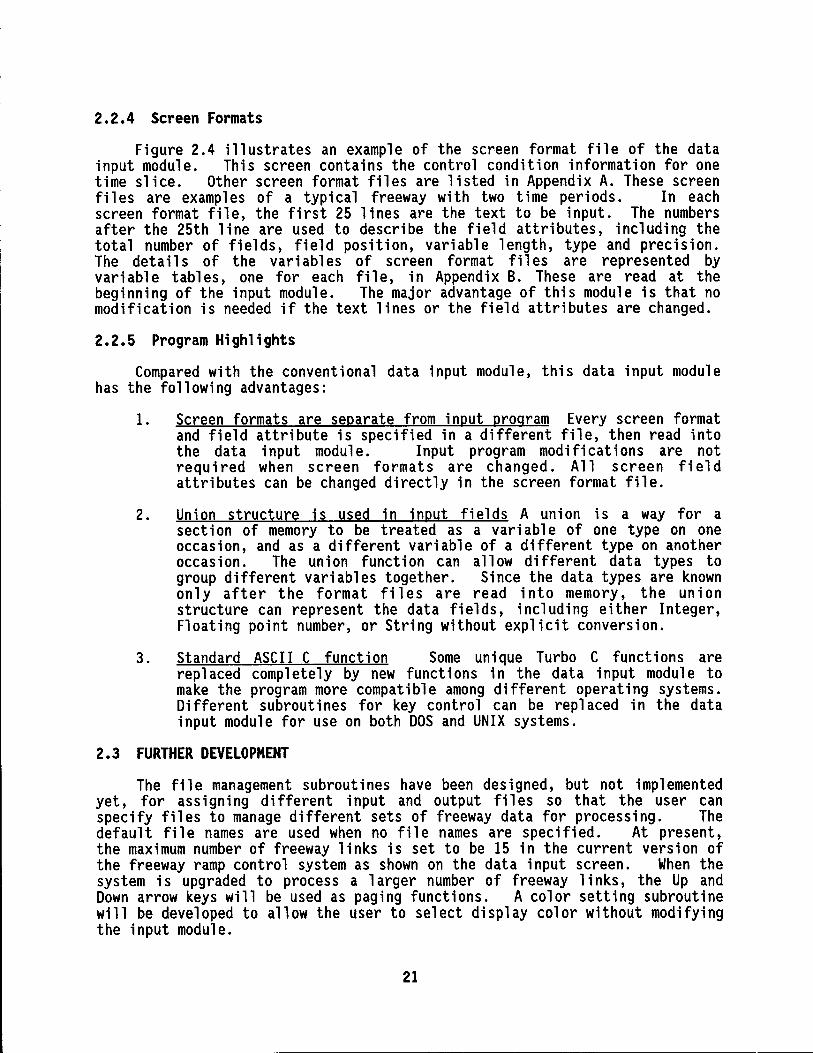
2.2.4 Screen Formats
Figure 2.4 illustrates an example of the screen format file of the data input module. This screen contains the control condition information for one time slice. Other screen format files are listed in Appendix A. These screen files are examples of a typical freeway with two time periods. In each screen format file, the first 25 lines are the text to be input. The numbers after the 25th line are used to describe the field attributes, including the total number of fields, field position, variable length, type and precision. The details of the variables of screen format files are represented by variable tables, one for each file, in Appendix B. These are read at the beginning of the input module. The major advantage of this module is that no modification is needed if the text lines or the field attributes are changed.
2.2.5 Program Highlights
Compared with the conventional data input module, this data input module has the following advantages:
1. Screen formats are separate from input program Every screen format and field attribute is specified in a different file, then read into the data input module. Input program modifications are not required when screen formats are changed. A 11 screen field attributes can be changed directly in the screen format file.
2. Union structure is used in input fields A union is a way for a section of memory to be treated as a variable of one type on one occasion, and as a different variable of a different type on another occasion. The union function can allow different data types to group different variables together. Since the data types are known only after the format files are read into memory, the uni on structure can represent the data fields, including either Integer, Floating point number, or String without explicit conversion.
3. Standard ASCII C function Some unique Turbo C functions are replaced completely by new functions in the data input module to make the program more compatible among different operating systems. Different subroutines for key contra l can be replaced in the data input module for use on both DOS and UNIX systems.
2.3 FURTHER DEVELOPMENT
The file management subroutines have been designed, but not implemented yet, for assigning different input and output files so that the user can specify files to manage different sets of freeway data for processing. The default file names are used when no file names are specified. At present, the maximum number of freeway links is set to be 15 in the current version of the freeway ramp control system as shown on the data input screen. When the system is upgraded to process a larger number of freeway links, the Up and Down arrow keys will be used as paging functions. A color setting subroutine will be developed to allow the user to select display color without modifying the input module.
21

FREEWAY RAMP METERING CONTROL SYSTEM
Control Condition: Time slice Objective : System Objective:
Link Ramp Link Ramp Entry Exit Fwy. V/C Entry Fwy. V/C Ramp No. No. Cap. Cap. Demnd Vol. Dmnd Ratio Meter Flow Ratio Queue
Fl-Help F2-lnitCond F3-Run F4-Asst F9-Graphics FIO-Quit PgDn-Next PgUp-Prev 4
30 4 2 d 44 4 2 d 47 4 5 f 0 72 4 6f0 12 9 2 2 d 6 3 s
12 4 d 18 4 d 25 4 d 31 4 d 37 4 d 44 3 d 51 4 d 58 4 d 65 3 d 71 4 d
Figure 2.4. Screen Format Example (Control Condition Screen).
22

3. SPREADSHEET REPORT MODULE
Spreadsheet programs are high-tech solutions developed for a wide variety of business applications, such as sales forecasting, budget analysis, cash flow projections, tax calculations, and engineering reports. The Quattro Pro package has been described by experienced users as the Next Generation Spreadsheet due to its superior power and overall functionality. Three factors are particularly impressive, including the superior on-screen and presentation graphics, full compatibility with Lotus 1-2-3, and the ability to adapt to a wide range of machines and configurations.
Quattro Pro has an integrated report writing capability that provides a convenient programming tool for preparing business documents such as spreadsheets, bar charts, and pie graphs. It has a built-in macro debugger to ease the development of complicated applications, such as working with external databases, and can use macros directly from Lotus 1-2-3 files.
Based on these capabi 1 it i es, a spreadsheet report interface module was developed that allows the user to tailor output reports for preparing business documents as well as graphical illustration without any programming efforts.
3.1 DESIGN CONCEPT
The module design is based on the capabilities currently available in the spreadsheet, such as the Quattro Pro, to satisfy an individual user's desire to tailor his own needs for preparing output reports and designing proper labeling. The following design considerations are focused on related applications, the external database interface, and menu driven operations.
3.1.1 Related Applications
The freeway ramp metering control system outputs data in different spreadsheet forms. The Quattro Pro macro function provides the user a convenient way to organize and process this data and convert it into documentation, report forms, or a clear graphics display.
3.1.2 External Database Interface
Quattro Pro's database capability will work with external databases, such as Paradox, Reflex, and dBase II,III,III Plus, and VI, to establish a userfriendly interface. The purpose of creating an external database interface is to provide functioning macro commands that are efficient, user-friendly, easily modified, and reusable. To satisfy these requirements, an executable macro program was designed so that output files from the ana 1 ys is can be automatically imported and converted into Quattro Pro spreadsheets and the data combined with customized tables in order to create printouts and graphic illustrations.
3.1.3 Menu Driven Operation
The use of menu bars will allow users to customize and organize spreadsheet functions with user-definable formats.
23

After the macro program processes the data, a small pull-down menu appears in the upper left-hand corner of the screen as shown in Figure 3.1. For further instructions and a description of each data element, users need only press or click the Fl or help bar. The menu provides the following options: import new files, display diagrams or charts in graphics mode, choose certain data from multiple runs, print spreadsheet, jump between time slices, produce charts according to spreadsheet data, or edit entire document.
3.2 DESIGN APPROACH
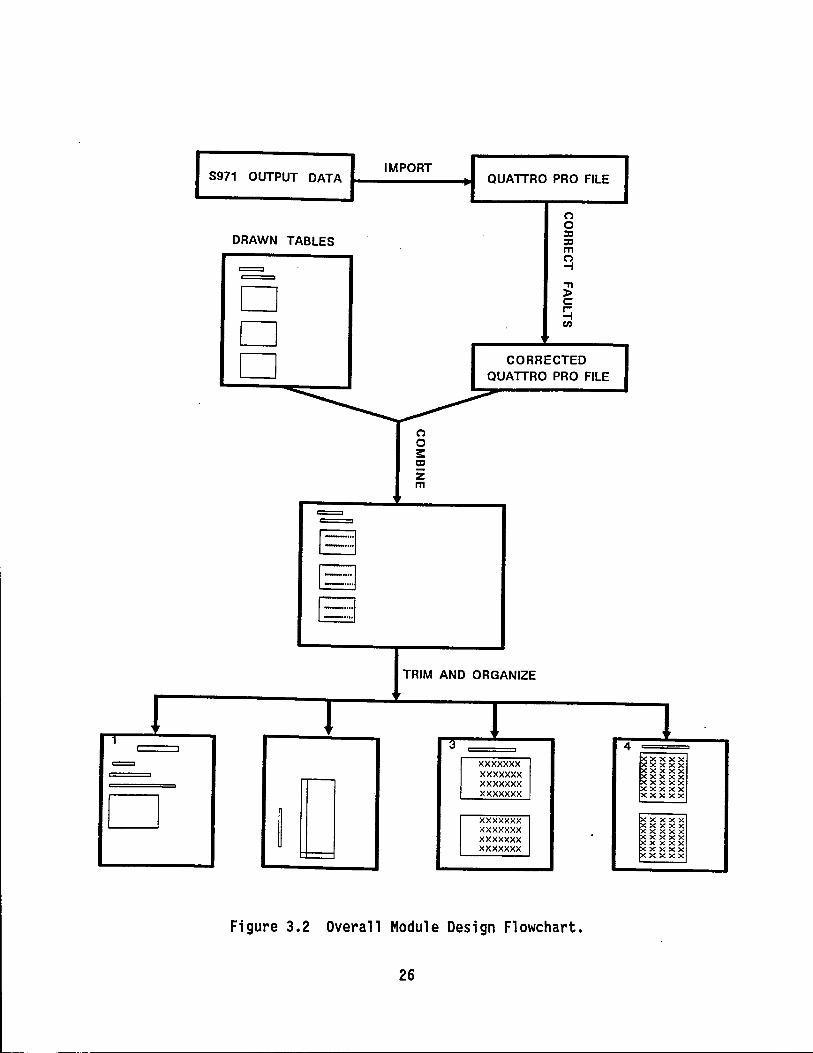
Figure 3.2 illustrates the overall module design flowchart. procedure is divided into the following 7 steps:
The entire
I. Import spreadsheet data into a Quattro Pro file Use Quattro Pro's "comma and space delimited file" to import original files. This procedure inserts orig i na 1 file data and sentences into different Quattro Pro file cells according to comma and space separation.
2. Correct any input data faults The "comma and space delimited file" import procedure allows the needed data separation according to the space between data e 1 ements, so that the import procedure imports the text file and inserts data into cells according to file format. However, the import procedure can't distinguish certain unusual mixed data formats. Macro procedures are provided to correct the imported file before inserting data into corresponding tables.
3. Combine data with oreviouslv drawn tables The output data files wi 11 be converted and combined with the corrected data into the tables drawn previously.
4. Trim tables into appropriate size Since the numbers of ramps and stations are different in different highway systems and the numbers are limited to 30 stations and 15 ramps, the largest size tables are plotted. The actual number of ramps and stations was counted previously. After files are imported, excessive table lines are deleted according to system size.
5. Oraanize the combined tables to desired format The combined data tables will be reorganized into the desired document format for further data processing.
6. Switch display mode to graphics display The program module will switch the screen di sp 1 ay mode from text to graphics mode ca 11 ed WYSIWYG (What You See Is What You Get) to facilitate quality graphic editing and graphical illustration.
7. Read data from certain tables to prepare chart Read data from certain tables to draw curve charts, bar charts, etc. Then move these charts to a designated space in spreadsheet and link spreadsheets and graphics so that changes made in spreadsheet cells are reflected automatically in the graphics. Users do not have to modify the graphics changes when table data is updated.
24

File Edit Style Grapn Print Database Tools Options Window
Nevi/File
11 Grapl1icDlsplay F."",-r-\'t/AV ... p METERING CONTROL SYSTEM .Ju'r4) sice - > 1 Time t-elp 2 Time Print ~ 3 Time Edit 4 TI me
Exit
I 1 lnA ,•,.,f"-.. 11""\. n
No. of on-ramps: 8( max:8)
No. of ott-ramps: 5 (max:6)
No. ollime slice: 4 (max: 8) No. of time slice pre nour : 4 Be91nn1ng time of lirst time slice: 080000(nms)
l..i1k Ramp No. cona Dist Soeed Cap. Type No. Cat. Bmpn [);.
1 0 1500 65 1462 1 1 A 0.15
2 0 5850 65 1452 0 2 B 0.15
3 0 1111 65 222 1 3 0.15
4 0 2222 65 1111 0 4 A 0.15
5 0 5555 65 222 1 5 A 0.15
6 0 1777 65 6666 0 6 0.15
7 0 2688 65 4889 1 7 B 0.15
Figure 3.1 Menu Example.
25
1
=
D
S971 OUTPUT DATA
!
~ D
IMPORT QUATTRO PRO FILE
n 0 ::c ::c m ~
~ c: ~ Cl)
CORRECTED QUATTRO PRO FILE
TRIM AND ORGANIZE
'
. ~ ~
xxxxxxx xxxxxxx xxxxxxx xxxxxxx
xxxxxxx xxxxxxx xxxxxxx xxxxxxx
Figure 3.2 Overall Module Design Flowchart.
26
1 4 ~xxxx xx xx xx xx xx xx xx xx txxxxx lxxxxx
lxxxxx ~~ ~~;:? ~xxxx xx xx
xx xx lxxxxx
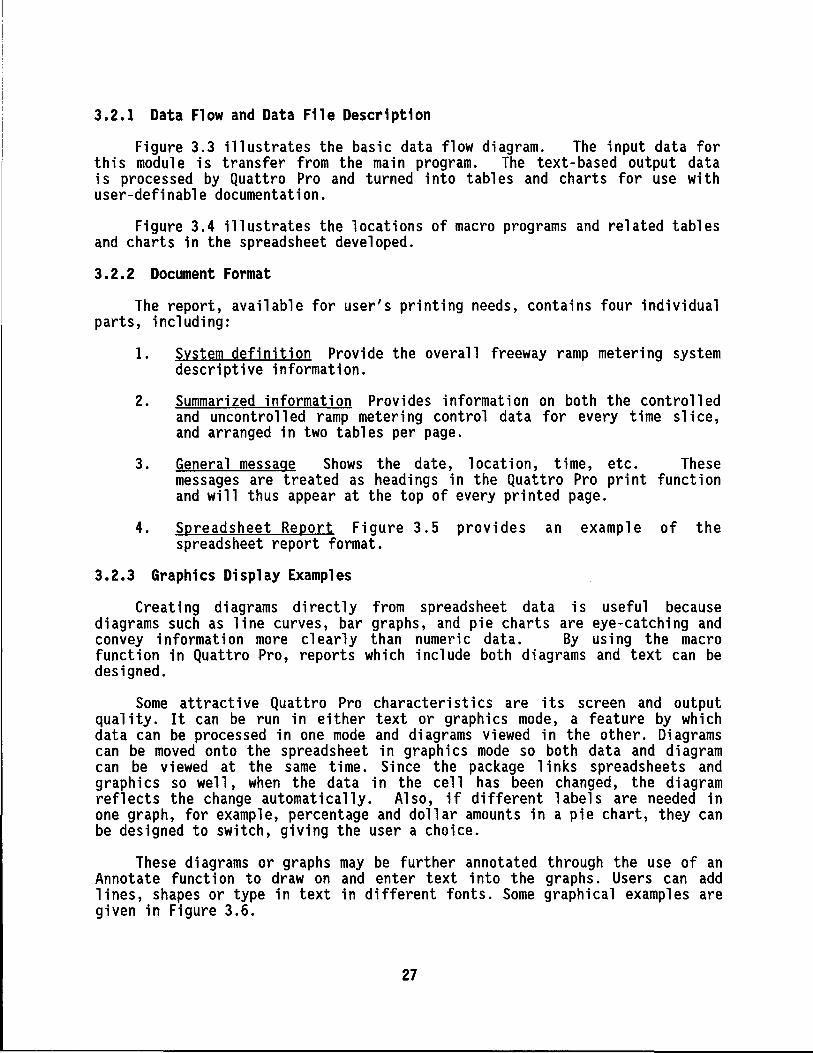
3.2.1 Data Flow and Data File Description
Figure 3.3 illustrates the basic data flow diagram. The input data for this module is transfer from the main program. The text-based output data is processed by Quattro Pro and turned into tab 1 es and charts for use with user-definable documentation.
Figure 3.4 illustrates the locations of macro programs and related tables and charts in the spreadsheet developed.
3.2.2 Document Format
The report, available for user's printing needs, contains four individual parts, including:
1. System definition Provide the overall freeway ramp metering system descriptive information.
2. Summarized information Provides information on both the controlled and uncontrolled ramp metering control data for every time slice, and arranged in two tables per page.
3. General message Shows the date, location, time, etc. These messages are treated as headings in the Quattro Pro print function and will thus appear at the top of every printed page.
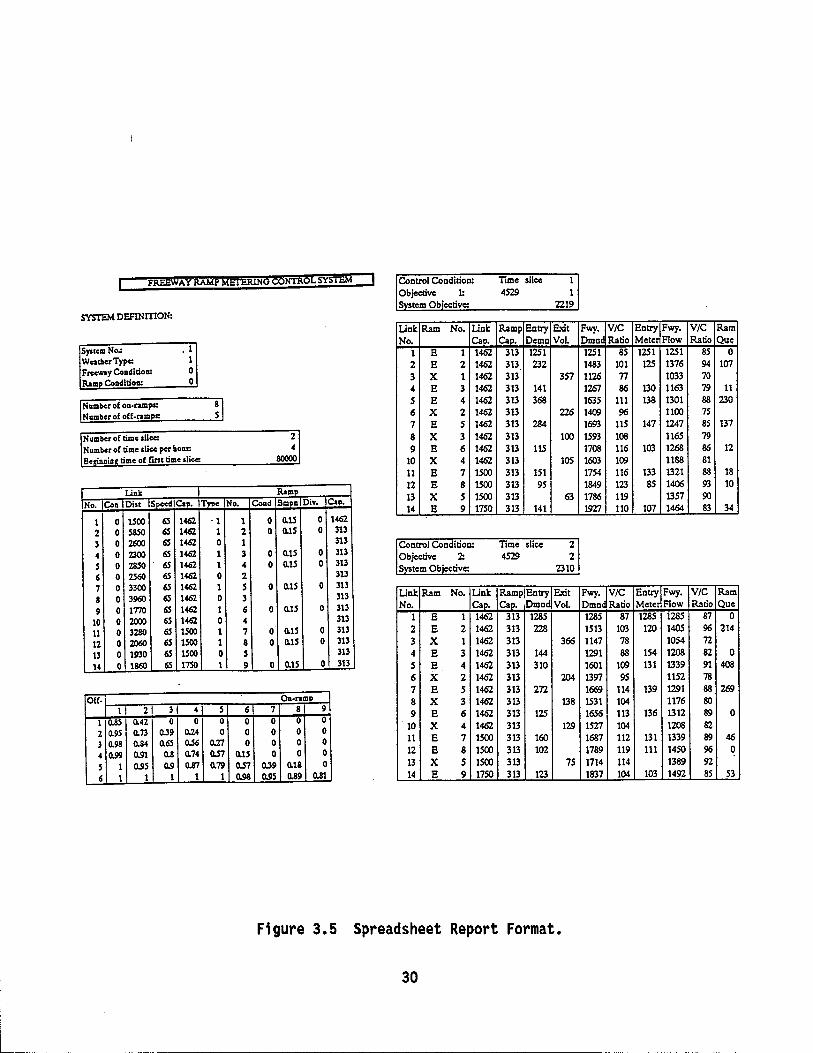
4. Spreadsheet Report Figure 3.5 provides an example of the spreadsheet report format.
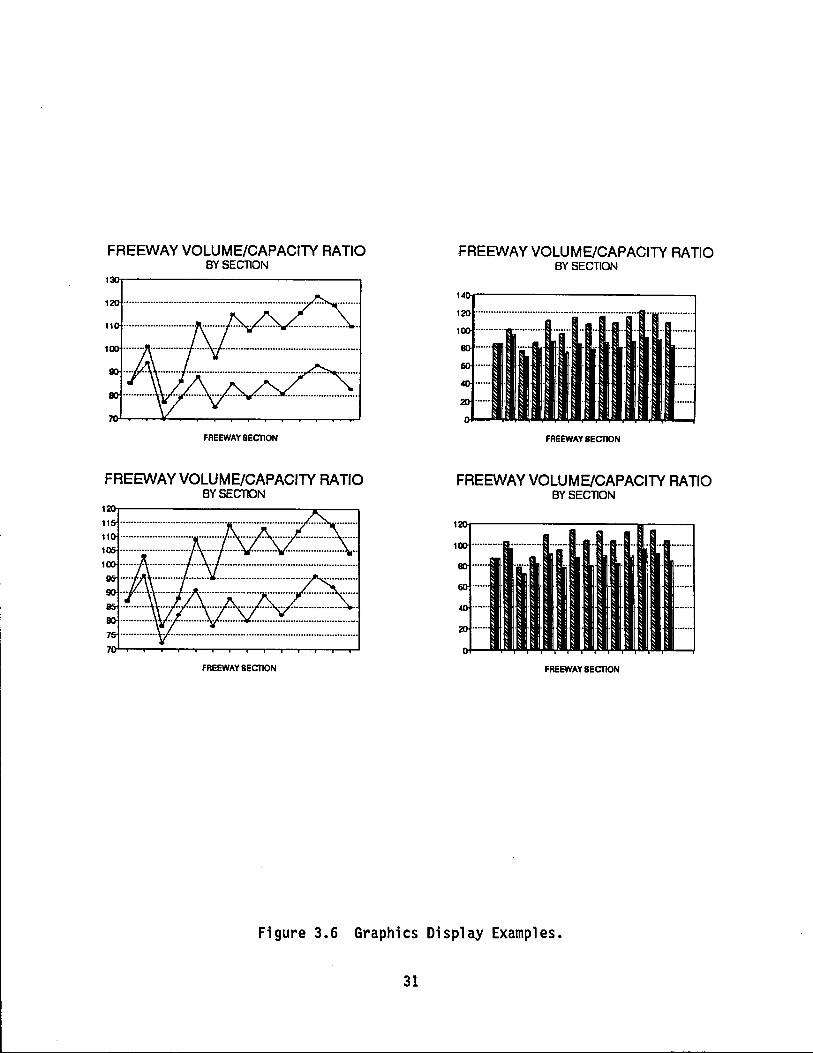
3.2.3 Graphics Display Examples
Creating diagrams directly from spreadsheet data is useful because diagrams such as line curves, bar graphs, and pie charts are eye-catching and convey information more clearly than numeric data. By using the macro function in Quattro Pro, reports which include both diagrams and text can be designed.
Some attractive Quattro Pro characteristics are its screen and output quality. It can be run in either text or graphics mode, a feature by which data can be processed in one mode and diagrams viewed in the other. Diagrams can be moved onto the spreadsheet in graphics mode so both data and diagram can be viewed at the same time. Since the package 1 inks spreadsheets and graphics so we 11 , when the data in the ce 11 has been changed, the diagram reflects the change automatically. Also, if different labels are needed in one graph, for example, percentage and dollar amounts in a pie chart, they can be designed to switch, giving the user a choice.
These diagrams or graphs may be further annotated through the use of an Annotate function to draw on and enter text into the graphs. Users can add lines, shapes or type in text in different fonts. Some graphical examples are given in Figure 3.6.
27

S971 OUTPUT DATA
'
QUATTRO PRO FILE
'
TABLES -. GRAPH ' ' '
,
xxxxxxx ~xxxx
lLLL xx xx
xxxxxxx xx xx
~ xx xx
xxxxxxx xx xx xxxxxxx ~ ~~gg~
xxxxxxx xxxxx c>e xxxxxxx xxxxx xxxxx xxxxxxx ~xxxx xxxxx xxxxxxx xx xx
xxxxx
Figure 3.3 Data Flow Diagram.
28

l
=
D
8971 OUTPUT DATA QUATTRO PRO MACRO PROGRAM
xxxxxx xx xx xx
XXXXXXX ·XXXX xx xx xx xx xx xx xx xx XX XX. XX XX XX XX XX XX
xx xx xx xx xx xx xx xx xx xx xx xx xx xx xx xx
xx xx xx xx xx xx xx xx xx xx xx xx xx xx xx xx xx xx xx xx xx xx xx xx xxxx xxxxx x
- IMPORT
DRAWN TABLES
= = D D D
~ D
xxxxxx xx xx xx xxxxxxx xxxx
xx xx xx xx xx xx xx xx xx xx xx xx xx xx xx xx
'XX XX XX XX XX XX XX XX
xx xx xx xx xx xx xx xx
COMB~ xx xx xx xx xx xx xx xx xx xx xx xx xx xx xx xx xx xx xx xx xx xx xx xx xxxx xxxxx x
= = EJ~ gL_. g t/\1.
DRAW CHART
ORGANIZE
'
3 4 xxxxxxx gxxxx xx xx
xx xx xxxxxxx xxxx xxxxxxx ~xxxx
xxxxxxx xx xx l><X XXX
xxxxxxx xxxxx xxxxx xxxxxxx xxxxx xxxxxxx xxxxx xxxxx xxxxxxx xxxxx
xxxxx
Figure 3.4 Table Flow Diagram.
29
mmmmm cc cm cm aedcd aeeerrtlpal<ad a:lsdfjj:Ksd 4eed:dddeee assdd aaaaadsd aeeee WWW
SSSddSf asdasdf aadaf
mmmmm cccmcm aedCCf aeeen1fpal<ad a:lsdtU:Ksd 4eed:dddeee assdd aaaaadsd aeeee WWW SSSddSf asaasar aadaf
~
FREEWAY RAMP METERING CONTROL SYSTEM Time slice 1
SYSTEM DE.FINmON:
SymmNo~ Weather Type: Freeway Co11ditioa: Ramo Coaditioa:
Number of 011-rampa: Number of off.nm s:
Number of time slice:
. 1 1 0 0
Number of time slice per hour. Be ·aaia time of fint time slice:
Ll11k No. Con Dist S.-.t Cai>.
1 0 lSOO 6S 1462
2 0 saso 6S 1462
3 0 2600 6S 1462
4 0 2300 6S 1462
s 0 2&SO 6S 1462
6 0 2S60 6S 1462
7 0 3300 6S 1462
8 0 3960 6S 1462
9 0 1770 6S 1462
10 0 2000 6S 1462
11 0 3280 6S lSOO 12 0 2060 6S lSOO
13 0 1930 6S lSOO
14 0 1860 6S mo
Off. 1 2 3 4
I O.SS 0.42 0 0 2 Q.9S 0.73 Q.39 Q.24
3 Q.98 Q.84 0.6S O.S6 4 Q.99 Q.91 a.a 0.74
s 1 o.9S Q.9 OST
6 1 1 1 1
8 s
T"""
. 1
1 0 1 1 0 1 0 1 0 1 1 0 1
s 0 0
o.I1 Q.S7 0.79
1
No.
1 2 1 3 4 2 s 3 6 4 7 8 s 9
6 0 0 0
O.lS Q.S7 0.98
Co11d
0 0
0 0
0
0
0 0
0
2 4
80000
Ram1> Bm1111
O.lS O.lS
O.lS O.lS
O.lS
O.lS
O.lS O.lS
O.lS
Div.
0 0
0 0
0
0
0 0
0
011-r:amn 7 8 9 0 0 0 0 0 0
0 0 0
0 0 0
Q.39 0.18 0 Q.9S Q.89 Q.81
Llak No.
1 2 3 4 s 6 7 8 9
10 11 12
Cai>. 13 14
1462 313 313 313 313 313 313 313 Llok
313 No. 313 1 313 2 313 3 313 4 313 s
6 7 8 9
10 11 12 13 14
4S29 1 2219
Ram No. Llak Ramp Ea try Exit Cao. Cao. Dem a Vol.
E 1 1462 313 12Sl E 2 1462 313 232 x 1 1462 313 357 E 3 1462 313 141 E 4 1462 313 368 x 2 1462 313 226 E s 1462 313 284 x 3 1462 313 100 E 6 1462 313 11S x 4 1462 313 lOS E 7 1500 313 151 E 8 1500 313 95 x 5 1500 313 63 E 9 17SO 313 141
Time slice 2 4529 2
2310
Ram No. Llok RamplEotry Exit Cao. Cao. Dmac Vol.
E 1 1462 313 1285 E 2 1462 313 228 x 1 1462 313 366 E 3 1462 313 144 B 4 1462 313 310 x 2 1462 313 204 B 5 1462 313 272 x 3 1462 313 138 E 6 1462 313 12S x 4 1462 313 129 E 7 1500 313 160 E 8 1500 313 102 x 5 1500 313 7S E 9 1750 313 123
Figure 3.5 Spreadsheet Report Format.
30
Fwy. V/C Ea try Fwy. VIC Ram Dmo1 Ratio Mete1 Flow Ratio Que 12Sl 8S 12Sl 12Sl 85 0 1483 101 12S 1376 94 107 1126 77 1033 70 1267 86 130 1163 79 11 163S 111 138 1301 88 230 1409 96 1100 1S 1693 ns 147 1247 85 137 1S93 108 116S 79 1708 116 103 1268 86 12 1603 109 1188 81 1754 116 133 1321 88 18 1849 123 85 1406 93 10 1786 119 1357 90 1927 110 107 1464 83 34
Fwy. VIC Entry Fwy. VIC Ram Dmoc Ratio Meter Flow Ratio Que 1285 87 1285 1285 87 0 1513 103 120 1405 96 214 1147 78 1054 72 1291 88 154 1208 82 0 1601 109 131 1339 91 408 1397 9S 1152 78 1669 114 139 1291 88 269 1531 104 1176 80 1656 113 136 1312 89 0 1527 104 1208 82 1687 112 131 1339 89 46 1789 119 111 1450 96 0 1714 114 1389 92 1837 104 103 1492 SS S3
FREEWAY VOLUME/CAPACITY RATIO BY SECTION
FREEWAY SECTlON
FREEWAY VOLUME/CAPACITY RATIO BY SECTION
FREEWAY SECTlON
FREEWAY VOLUME/CAPACITY RATIO BY SECTION
120 ···•·••·•·····•···•••···••···•·•···•••·•·••·•••·••·•···•••·••• 100 ..••.•.•••. ...•..•••.. ...••.. .. .• .• .. . ........••..
BO ••••••
60 .•••••
40 .•....
20 ..... .
FREEWAY SECTlON
FREEWAY VOLUME/CAPACITY RATIO BY SECTION
100 ............•.........•..........
BO ••••••
60 .••...
40 .•••••
20 .••..•
FREEWAY SECTlON
Figure 3.6 Graphics Display Examples.
31
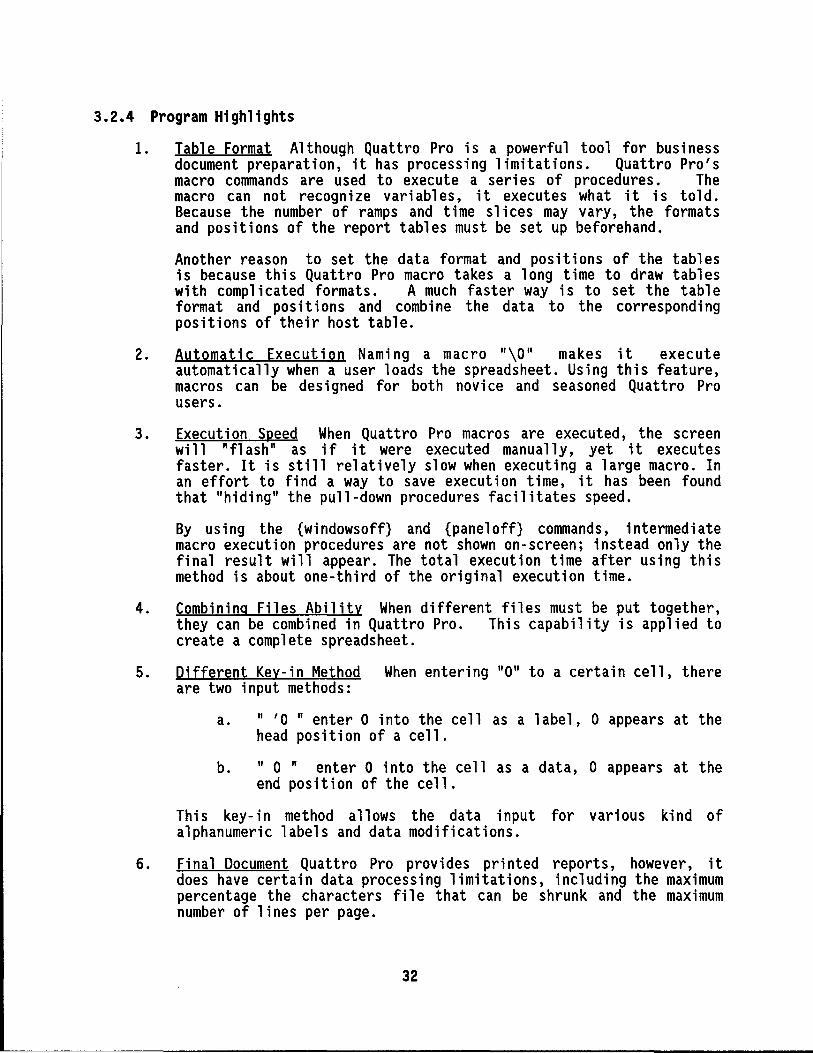
3.2.4 Program Highlights
1. Table Format Although Quattro Pro is a powerful tool for business document preparation, it has processing limitations. Quattro Pro's macro commands are used to execute a series of procedures. The macro can not recognize variables, it executes what it is told. Because the number of ramps and time slices may vary, the formats and positions of the report tables must be set up beforehand.
Another reason to set the data format and positions of the tables is because this Quattro Pro macro takes a long time to draw tables with complicated formats. A much faster way is to set the table format and positions and combine the data to the corresponding positions of their host table.
2. Automatic Execution Naming a macro "\O" makes it execute automatically when a user loads the spreadsheet. Using this feature, macros can be designed for both novice and seasoned Quattro Pro users.
3. Execution Speed When Quattro Pro macros are executed, the screen will "flash" as if it were executed manually, yet it executes faster. It is still relatively slow when executing a large macro. In an effort to find a way to save execution ti me, it has been found that "hiding" the pull-down procedures facilitates speed.
By using the {windowsoff} and {paneloff} commands, intermediate macro execution procedures are not shown on-screen; instead only the final result will appear. The total execution time after using this method is about one-third of the original execution time.
4. Combining Files Ability When different files must be put together, they can be combined in Quattro Pro. This capability is applied to create a complete spreadsheet.
5. Different Key-in Method When entering "O" to a certain cell, there are two input methods:
a. " 'O" enter O into the cell as a label, O appears at the head position of a cell.
b. " 0 " enter O into the cell as a data, O appears at the end position of the cell.
This key-in method allows the data input for various kind of alphanumeric labels and data modifications.
6. Final Document Quattro Pro provides printed reports, however, it does have certain data processing limitations, including the maximum percentage the characters file that can be shrunk and the maximum number of lines per page.
32
Due to the current table size and was divided into several pages. one page. Other pages include slice, or two tables per page.
3.3 FURTHER DEVELOPMENT
letter legibility, the output data The system definition is put in
the traffic data for each time
A data interface protocol has been designed to deal with freeway ramp and metering control data by creating a series of auto-execution macro commands. This macro program can import data directly from the Study 971 program, format the data file using the import procedure, and convert data files into the desired text or graphical format.
The input data is combined with the drawn table, and the table is then trimmed to size and moved to appropriate positions or other files. The display is finally switched to graphics mode, and graphs are created. The next step is to enhance the spreadsheet module and design a menu screen that can provide options such as Help, View, Print, Plot, Data modify, etc.
33

4. GRAPHICS DISPLAY MODULE
A user interface is the interface between an application and its user. Its primary purpose is to help program designers create effective applications. A good graphical user interface (GUI) also improves learning speed. Successful user interface designers keep the user in mind when designing an application. The two underlying principles are knowing the user and empowering the user with desirable features. Computer systems are often difficult for most people to learn and use. If human-computer dialogues are designed by people who understand and apply basic dialogue principles, they will achieve higher usability.
This section describes the deve 1 opment of a user interface designed to assist engineers with analyzing the sensitivity of freeway ramp metering control strategies. By using this system, engineers can immediately see the results of their strategy. The design concept and the design approach for this user interface system are also described.
4.1 DESIGN CONCEPT
The overall system design concept is to offer users a friendly graphical user interface (GUI) for input inquiry and output evaluation. The GUI tries to be intuitive such that the conditions shown in graphics can be easily understood. For sets of data generated from the input module, the GUI grabs fields and displays them as a pictorial freeway with ramp and mainline. The GUI also allows for future extensions and will become a main menu in the future. DOS application modules developed at TTI will be added to the GUI.
To achieve the basic design objective, the user interface is designed with a Microsoft Windows and X-Window/Motif look and feel like interface, that can:
o Adopt the user's perspective, o Give the user control, o Use real-world metaphors, o Keep interface natural, o Keep interface consistent, o Communicate application actions to the user, and o Avoid common design pitfalls.
4.1.1 Design Background
The primary design concepts of this module are expandability. The module can be divided into two (GS), and a freeway graphical user interface (FGUI).
user-friendliness and parts: a graphic shell
From the user-friendly viewpoint, it is an important concept that an application be flexible. A good user-application should allow users to configure the system to fit their needs. In spite of how well an application is designed, users will want to change some element, i.e. simple elements like colors and fonts and complicated elements like the default value. Good software designers should allow users to adjust the following elements:
35

o Application parameters, o Colors, o Fonts, o Default Values, o Key Bindings, o Messages, and o Help Information.
4.1.2 Graph;c Shell (GS)
The Graphic Shell or GS is a shell module that runs DOS application modules and a graphic menu-driven module which uses a mouse as its input device. The importance of the GS is that it can be separated as a shell program which can run DOS application programs. Thus, it can be used as a main menu for future expansion.
4.1.3 Freeway Graph;cal User Interface (FGUI)
The FGUI is a menu-driven, windows-look-alike graphical user interface environment. The basic elements of FGUI are buttons and menus, and the user can simply use a mouse to navigate through the whole system. The user can trigger an event by clicking a button, or by selecting a menu item. When an event is triggered, a new window pops up, and a picture explains the status of the event. The title bar at the top of the screen displays the module title. The "Quit" button, at the left side of the menu bar, if pressed, will terminate the module and return control to the caller program or DOS shell.
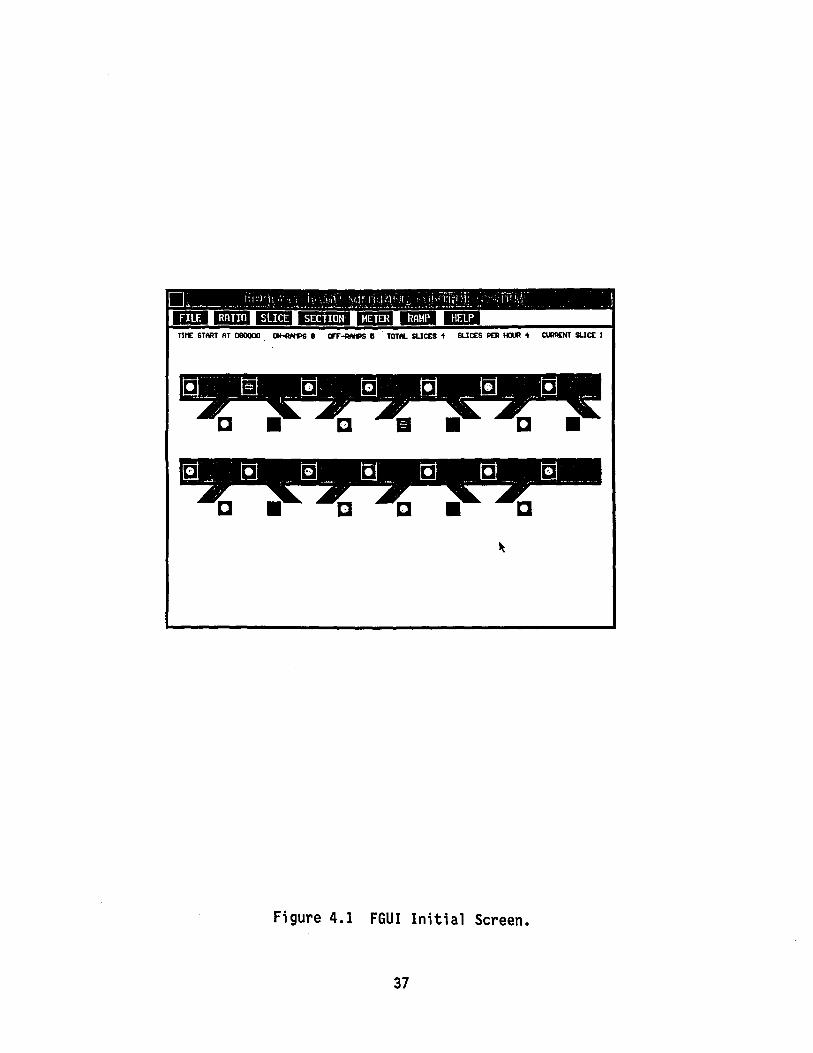
The main screen is a freeway picture with ramps and freeway stations indicated by color-coded buttons. By glancing at the color-coded buttons, users can easily know which ramps and stations are in free flow status, which are in a critical state, and which others have long queues backed up. The user can easily get detailed information on a particular ramp or section just by clicking the corresponding button as shown in Figure 4.1 and Figure 4.2. The menu bar is located just below the title bar where there are seven function buttons: File, Ratio, Slice, Section, Meter, Ramp, and Help.
The "File" button shows a list of data files with the extension name "OUT." Users can choose from the list by clicking the mouse pointer on the file name. The FGUI loads freeway data from the file and automatically updates all screens and charts. At the start, the program reads file "S971MTR.OUT" as the default data file.
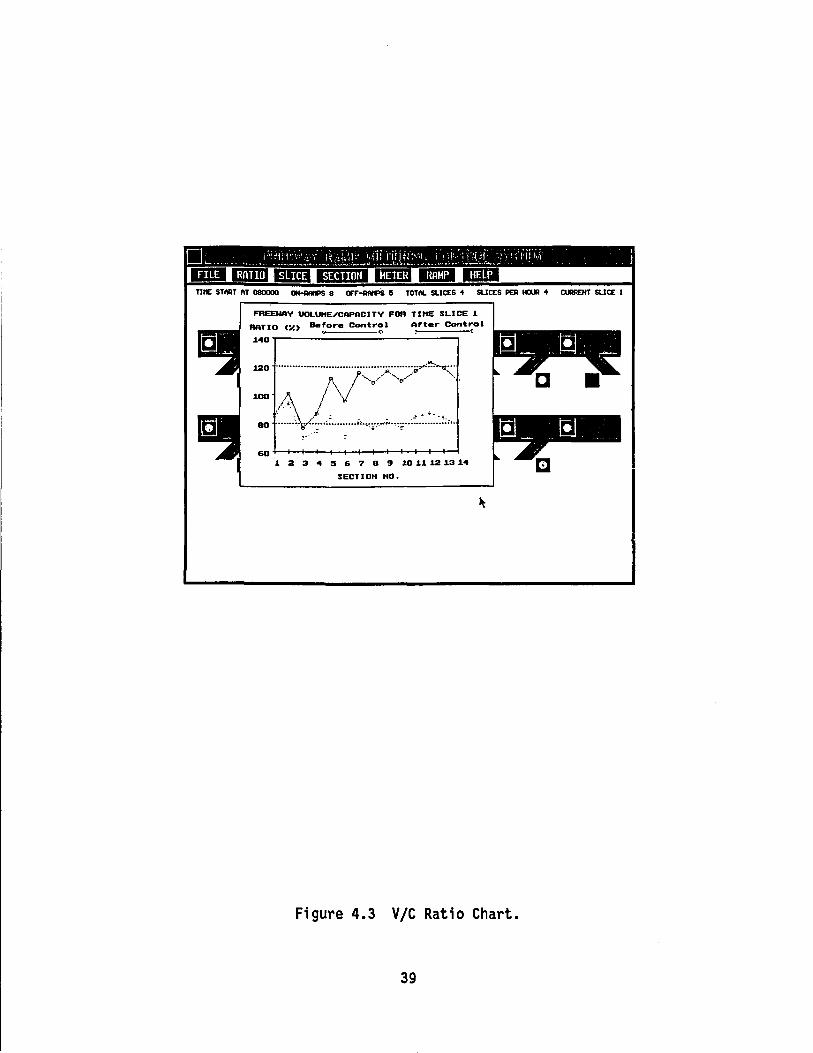
As shown in Figure 4.3, the "Ratio" button displays volume/capacity ratios for the given time slice of a freeway. The line charts show two lines, one with highway traffic control and one without. Without control, traffic volume can be over the limit. After control, all the freeway sections and ramps are in free flow status. Users can see the results of traffic control before control is imposed. The ratio chart is important for supporting decision-making.
36
TIME START AT 080000 . ON-AA11PS 8 OFT-IWl>S 11 . TOTH. SLICES 1 SLICES PER HOlJI 1 CUlllENT SLICE I
Figure 4.1 FGUI Initial Screen.
37

0 'I J.O 20 RAHP TIHE<HIH>
RA11P HU11BER RAHP TWE CAPAC ITV EHTRV DttHD COHTROU.ED QUEUE
allR£NT SLJct I
Figure 4.2 Ramp Queue and Ramp Time Chart.
38
TlllE START AT 080000 ON-1W1PS B OFT-RAMPS 15 TOTAL SLICES 1 SLICES PER HOU! 1 CURRENT SLICE I
FREEWAY UOLUHE/CAPACITV FOR TIHE SLICE 1
RATIO co Before Control
140
After Control : :
60+--+--+--+--t~t--+--+--+--+--t--<f--+--i
1 2 3 4 :5 6 7 B 9 10 11 12 13 14
SECTIOH HO.
Figure 4.3 V/C Ratio Chart.
39

The "Slice" button shows a list of available slices. Users can change the current slice by clicking the mouse. When the current slice is changed to another one, the volume/capacity chart and the information and colors of the highway display are changed accordingly.
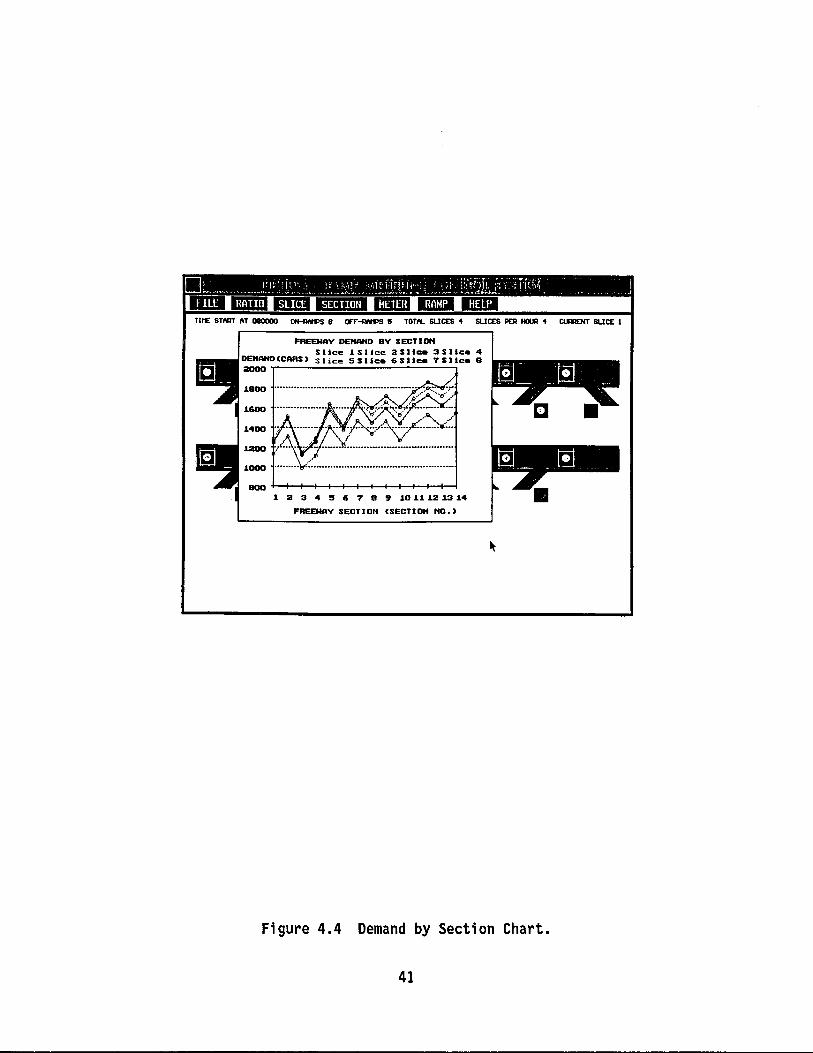
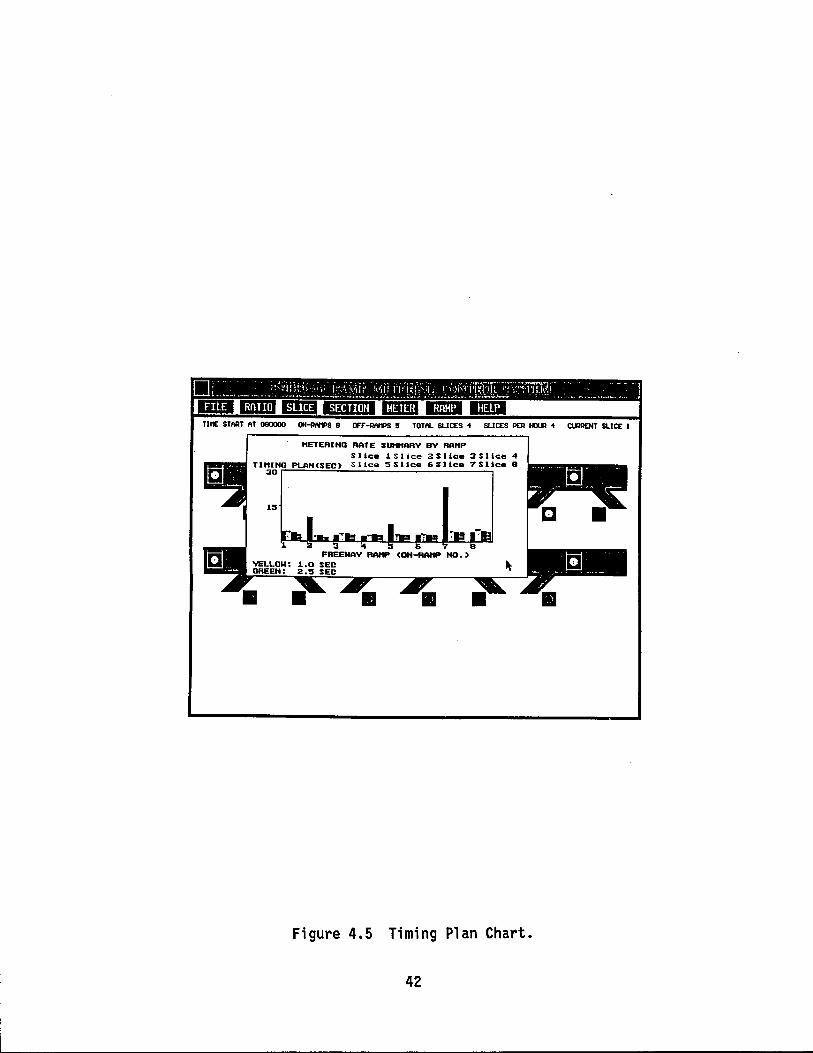
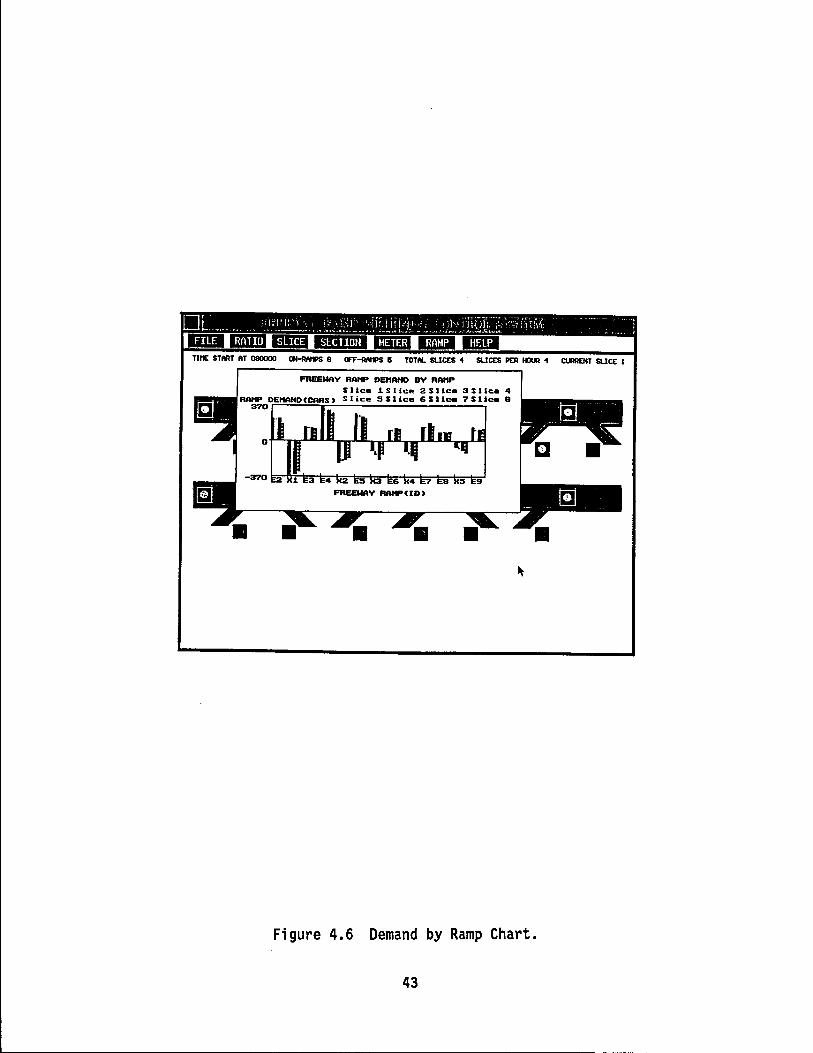
Figure 4.4 shows the "Section" button which displays a chart of freeway demand by section. Color coded lines represent freeway demand for different sections and time slices. As shown in Figure 4.5, the "Meter" button shows the metering rate summary chart by ramp. For each on-ramp, it shows the red signal durations for different time slices. Users can get the timing plan of any on-ramp by clicking this button. The "Ramp" button shows the freeway ramp demand chart by ramp. Users can see the entrance and exit ramp demands at a glance as shown in Figure 4.6. The "Help" button shows the system flowchart of program S971 .
The data bar is located below the menu bar and shows system information including: starting time, on-ramp numbers, off-ramp numbers, total time slices, slices number per hour, and the current time slice number.
Data Elements
Most data are directly passed from S971, except those listed below.
Timing Plan Computation
R = 3600 I T I C - Y - G
Where
R - Red signal time, T - Time slice per hour, C - Controlled entry volume for the current ramp and time slice, Y - Yellow signal time (1.0 second), and G - Green signal time (2.5 second).
Entrance Ramp Delay Time at Time Slice j is calculated as follows. The same value is used to specify the display color in the pop-up chart of freeway on-ramp button.
Dj = (Qj-1 + Qj) I (2 * (TS I MRj))
Where
D· is the average entrance ramp delay time. Q~ is the number of vehicles in ramp queue at time j. MRj is the metering rate in time slice j (vehicles). TS is the duration in minutes for each time slice.
40
TlnE STftRT ftT 080000 ON-1WtPS 8 OFT-RNIPS 15 TOTAL SLICES 1 SLICES PER HOUR 1 CIAIENT SLICE I
FREEWAY DEttAHD BY SECTIOH Slice J. SI ice 2 S lie• 3 Slice 4
DEtlAHOCCARS > slice 5 Slice 6 Slice 7 S lie• 8 2000
J. 2 3 4 !5 6 7 8 9 J.D J.J. 1.2 J.3 J.4
FREEWAY SECTIDH CSECTIDH HO.>
Figure 4.4 Demand by Section Chart.
41
Tit£ START AT 080000 ON-RAMPS 8 orr-RAMPS a TOTAL SLICES 1 SLICES PER HOlJl 1 CUlRENT SLICE I
11ETERINO RATE SllttttARV BV RAHP Slice J. S I ice 2 Slice 3 Slice 4
":[~~00~~·: ;::i: :J-. FREEWAY RAl1P CON-flAttP NO. >
Figure 4.5 Timing Plan Chart.
42
DME START AT 080000 ON-IWIPS 8 OFT-IWl>S 15 TOTAL SUCES 1 SUCES PEA HOU! 1 CURRENT SUCE 1
FREEWAY RA1tP DEttAHD BV RAHP S l Ice J. S 1 ice 2 S l Ice 3 Slice 4
:fii:i~~·~=;~::~~-. FREEWAY -CID>
Figure 4.6 Demand by Ramp Chart.
43
To provide better reference on the graphical display, the following color designation RI and R2 are used to display the color for the On-Ramp Buttons:
RI = (C + Q) I P
Where
R - Ratio, C - Controlled entry volume for the current ramp and time slice, Q - Ramp queue for the current ramp and time slice, P - Ramp capacity for the current ramp and time slice.
R2 is the control ratio for the current link and time slice. The color of the buttons is computed by comparing the corresponding ratio RI or R2 with the two thresholds defined in FGUI.CFG.
4.2 DESIGN APPROACH
An object-action model module is implemented in Turbo object-action model, the user first selects an object, and then action on it. Because the object-action selection model mimics is a familiar process and increases the user's sense over applications. The module can be divided into two parts: GS
4.2.1 Graphic Shell(GS)
C. In an performs an
real life, it of control
and GUI.
The Graphic Shell (GS) reads data files and provides access through the menu bar elements, paths and programs names, window sizes, positions, and the parameters used to examine the opt i mi zat ion results. Screen size is the primary constraint in graphical user interface design. To overcome this physical design limitation and achieve visual simplicity, menus are used to organize most of the application's features. Menus organize both frequently used components and components used in most application sess i ans. There are three types of menus:
o Pull-down menu. o Pop-up menu. o Option menu.
This module uses pull-down menus because they are simple and intuitive. The menu bar elements include:
o FILE - Open a new data set for FGUI, o RATIO - Show V/C ratio chart, o SLICE - Change to a different time slice, o SECTION - Show demand by section chart, o METER - Show metering plan, o RAMP - Show demand by ramp chart, and o HELP - Usage of GS.
Because the GS is a shell program, it must occupy as little memory as possible so that application programs run properly. Application programs
44

can be run full screen or within a pop-up window. Extended memory may also be used to provide each application program with more memory if needed. This feature has not yet been implemented in the current version.
4.2.2 User Interface (FGUI)
Freeway Graphical User Interface (FGUI) is a graphic display module that displays both the input and the output data from the STUDY971 freeway ramp control program. The pictures, such as the graphical buttons, have been created in the PaintBrush program, converted into TURBO C graphical format, and provide the 3-dimensional display effect.
4.2.3 User-definable Features
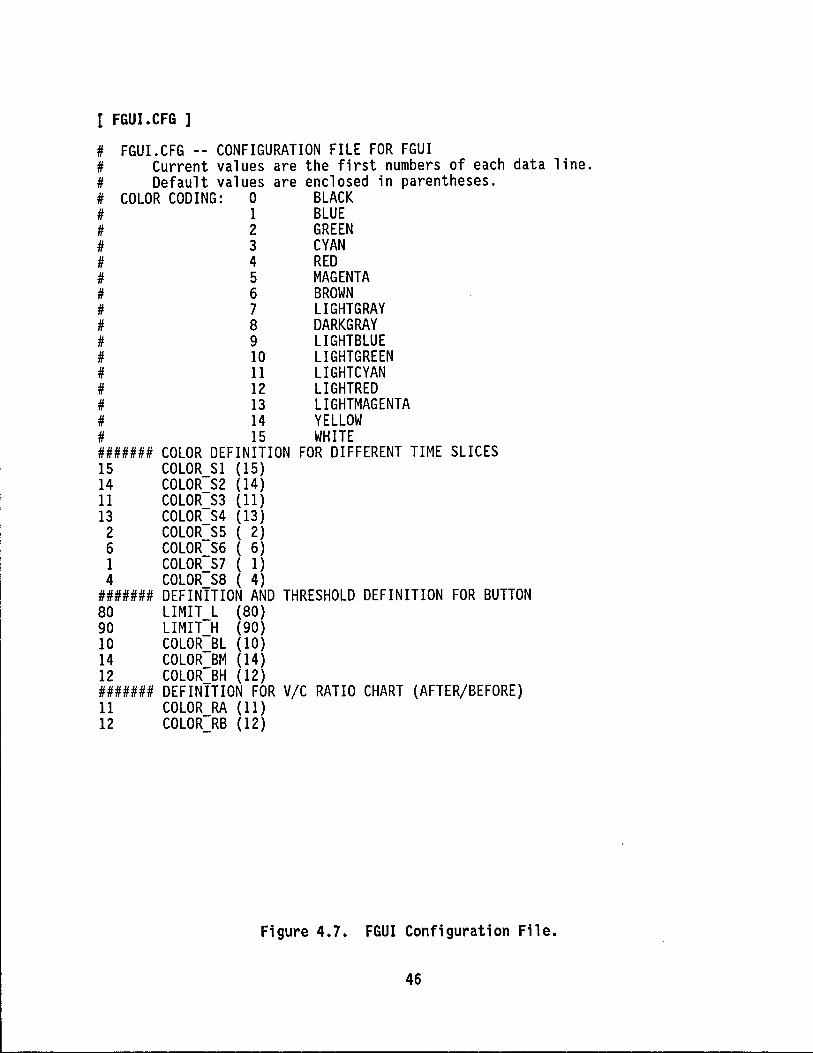
The color-coded information for each time slice, volume/ratio chart, and buttons is read from the data file "FGUI.CFG" at run-time. Users can easily change the default colors of FGUI by editing this text file using any text editor that is capable of editing ASCII files. This includes the possibility to change the thresholds for each color of sections and buttons by editing the configuration file. FGUI.CFG is listed in Figure 4.7.
Default Color
The default colors for different time slices are:
0 Time slice #1 - white, 0 Time slice #2 - yellow, 0 Time slice #3 - light cyan, 0 Time slice #4 - light magenta, 0 Time slice #5 - green, 0 Time slice #6 - brown, 0 Time slice #7 - blue, and 0 Time slice #8 - red.
The default thresholds and color selection are:
0 Lower threshold - 80%, 0 Higher threshold - 90%, 0 Low volume color - light green, 0 Medium volume color - yellow, and 0 High volume color - light red.
The default color selection for the graphical buttons are:
o After control color - light cyan, and o Before control color - light red.
FGUI uses numbers to represent colors, the color codings are:
0 black, 1 blue, 2 green,
3 cyan, 4 red,
45
[ FGUI.CFG ]
# FGUI.CFG -- CONFIGURATION FILE FOR FGUI # Current values are the first numbers of each data line. # Default values are enclosed in parentheses. # COLOR CODING: 0 BLACK # 1 BLUE # 2 GREEN # 3 CYAN # 4 RED # 5 MAGENTA # 6 BROWN # 7 LIGHTGRAY # 8 DARKGRAY # 9 LIGHTBLUE # 10 LIGHTGREEN # 11 LIGHTCYAN # 12 LIGHTRED # 13 LIGHTMAGENTA # 14 YELLOW # 15 WHITE ####### COLOR DEFINITION FOR DIFFERENT TIME SLICES 15 COLOR_Sl (15) 14 COLOR S2 (14) 11 COLOR-S3 (11) 13 COLOR-S4 (13) 2 COLOR=S5 ( 2) 6 COLOR_S6 ( 6) 1 COLOR_S7 ( 1) 4 COLOR SS ( 4)
####### DEFINITION AND THRESHOLD DEFINITION FOR BUTTON 80 LIMIT_L (80) 90 LIMIT H (90) 10 COLOR-BL (10) 14 COLOR=BM (14) 12 COLOR_BH (12) ####### DEFINITION FOR V/C RATIO CHART (AFTER/BEFORE) 11 COLOR_RA (11) 12 COLOR_RB (12)
Figure 4.7. FGUI Configuration File.
46
5 magenta, 6 brown, 7 1 i ght gray, 8 dark gray, 9 light blue, 10 light green, 11 light cyan, 12 light red, 13 light magenta, 14 yellow, and 15 white.
4.3 DEVELOPMENT FLOWCHART
The development flowchart is listed as Figure 4.8.
4.3.1 Prototype Development
To develop a reusable program and reduce the difficulty of writing it, it is necessary to bu i1 d a program prototype using Pai ntBrush and GemDraw. The optimal tools should be tools which can be directly used in programs without needing conversion.
4.3.2 Pictures Import
Some pictures and icons built in the prototype are used in the program. The Get Picture Master (GPM) can grab pictures from the screen and send them to a file. The process is outlined thus: GPM must first be loaded into memory by typing "GPM" at the DOS prompt. The second step is to load the picture which is to be captured into memory. GPM is then activated. The last step is to convert the captured picture to a format which can be used in programming. To do this, "save2" must be run at the DOS prompt. The reason for running the last step is because GPM does not save the palette of a picture. This step ensures the graphics di sp 1 ayed in the program 1 oaks as desired. Pictures converted with this procedure can be used in Basic, assembly, Turbo Pascal and Turbo C systems.
4.3.3 User Interface
GS and FGUI are described in Section 4.3.
4.3.4 Data Flow and Data File Description
The data flow diagram for the graphic display module is shown in Figure 4.9. The data inputs, passed to individual program components from the main program, are:
o System Number, o Weather Type, o Freeway Condition, o Ramp Condition, o Number of on-ramps & max. number of on-ramps,
47
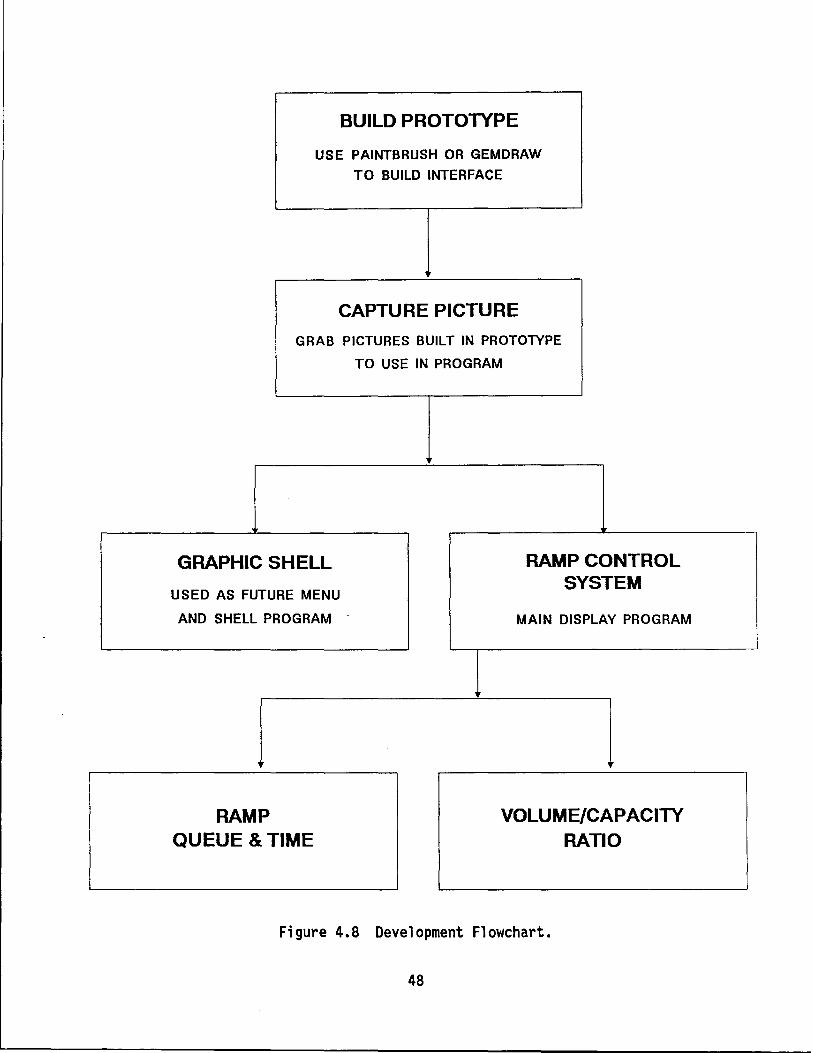
BUILD PROTOTYPE
USE PAINTBRUSH OR GEMDRAW
TO BUILD INTERFACE
CAPTURE PICTURE
GRAB PICTURES BUILT IN PROTOlYPE
TO USE IN PROGRAM
GRAPHIC SHELL RAMP CONTROL SYSTEM
USED AS FUTURE MENU
AND SHELL PROGRAM -
l RAMP
QUEUE & TIME
MAIN DISPLAY PROGRAM
l VOLUME/CAPACITY
RATIO
Figure 4.8 Development Flowchart.
48
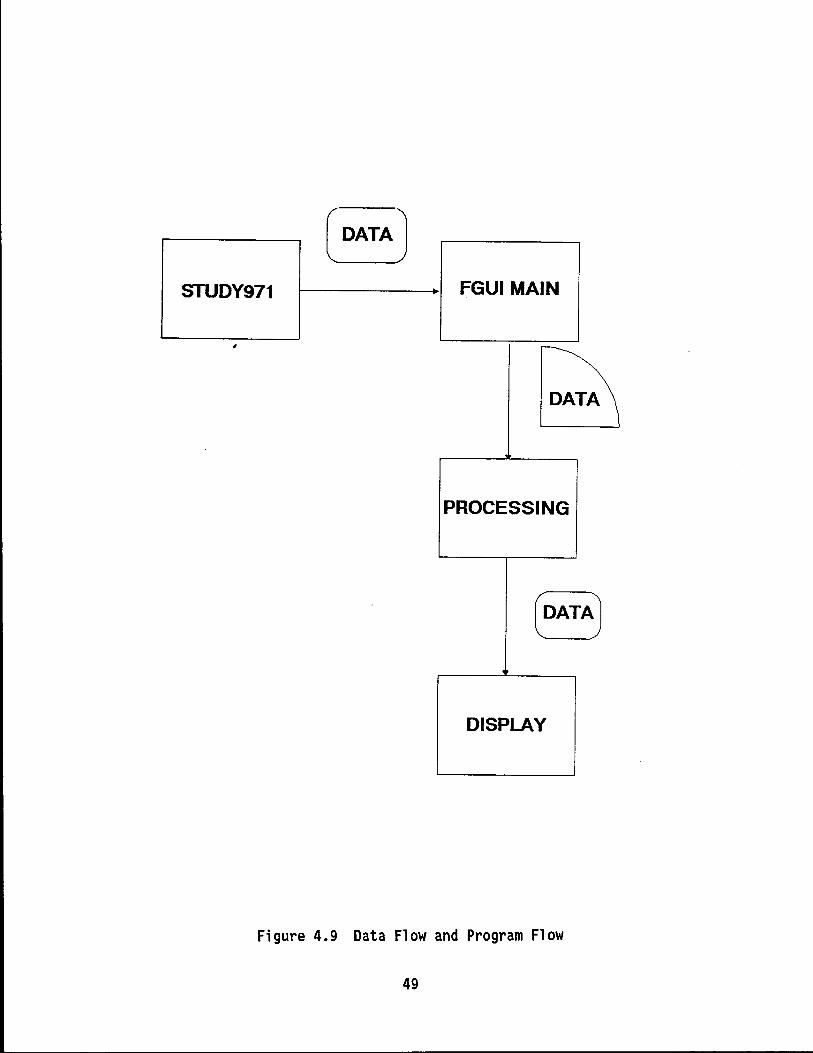
STUDY971 1-----__..~ FGUI MAIN
~
DATA
PROCESSING
DISPLAY
Figure 4.9 Data Flow and Program Flow
49

o Number of off-ramps & max. number of off-ramps, o Number of time slices & max. number of time slices, o Number of time slices per hour, o Beginning time of first time slice, and o Initial condition of freeway ramp control system.
4.3.5 Program Flowchart
The main program inputs data from STUDY971, and then picks fields. These data fields are further processed for display. The program then displays the data according to freeway variables, i.e. ramp numbers, freeway condition, etc.
Figure 4.9 shows the program flowchart.
4.3.6 Program Highlights
o Mouse interrupt handler The mouse interface routines used in this program are designed to be interrupt-driven to achieve the maximum efficiency and fastest response time. The mouse routines have their own buffer to store and process a 11 mouse events. By using this technique, even when the program is redrawing the screen or doing computations, no mouse events will be lost.
However, transferring mouse events from the event handler to the main program becomes a problem because the PC environment does not provide inter-process communications facilities. The solution is to use a common memory area. The memory location OOOO:OOCO (Interrupt number 40) is selected as the interrupt handler address because few programs use this interrupt number.
o The use of high memory Some compilers and DOS-extenders can produce code which uses memory beyond the PC's 640 kilobyte limitation. The programs compiled for OS/2 can also use all of high memory.
o Turbo C toolkit for designing GUls simplify GUI implementation. and generate source codes This design has not been thoroughly tested, but may prove to be a time saver when designing multiple graphical applications.
o The program encountered the stack overflow problem This problem was solved by recombining the program and resetting the mouse driver after returning to the text mode and again before the program terminates.
4.4 FURTHER DEVELOPMENT
This user interface program can be expanded as a shell program that can be invoked either directly under the DOS operating environment or through the existing shell program operations.
50
As a shell program, the user interface can be expanded to provide more efficient memory management and screen format.
There are two ways to enhance memory management, and these two operations can be used together. The first is to use extended memory. The second is using batch files to run shells and applications. In order not to waste memory, the she 11 is terminated when an app 1 i cation program is chosen and reloaded when the program is done. This process must be organized by a BAT ch file. It is convenient that DOS closes a batch file when it executes an external command. The batch file which started the shell is altered. After the shell program has quit, the batch file is started again.
The graphic display program can also be used as a display tool embedded in a text program. Mouse routines, menu designs, buttons designs, and road drawing tools can be reused in other programs. The use of graphic functions converts a pure text program into a friendly graphic program. Graphic display functions can also be used to improve the quality of graphics programs. For ex amp 1 e, road drawing fun ct i ans can be used to rep 1 ace LEFWY's (freeway simulation system) road drawing functions, the result being that the road originally composed of lines becomes three-dimensional.
51

5. MAIN PROGRAM MODULE
Freeway ramp control systems provide effective traffic management alternatives. Developing off-line ramp metering timing patterns and feeding these control parameters into freeway satellite computers will further enhance the freeway corridor traffic management capabilities. A queue-based freeway traffic management strategy was developed to examine the generation of optimized ramp metering rates using both sequential and dynamic system control approaches. A microcomputer program, based on TURBO C standards, has been implemented. This program can be used as an evaluation or pattern generation tool to assist with freeway system control. The optimized traffic flow and results examined the freeway ramp metering system under various possible traffic operating conditions.
The design concept, design approach, data flow, program flowchart, results analysis, and future development of the main program of the freeway ramp metering control system are described in the following sections.
5.1 DESIGN CONCEPT
To achieve urban freeway corridor traffic control, an evaluation strategy has been developed from the basic concept of a systemwide freeway optimization process. The strategy is to identify the basic freeway traffic control system, the software framework needed to respond to freeway traffic inputs, the optimized traffic flow, and the output ramp metering parameters. The off-1 ine pattern generation software was programmed to allow sensitivity analysis of the freeway control under different operating conditions. The basic study methodology can be extended to integrate with freeway ramp metering, frontage road control, HOV operations, and interrelated traffic management techniques.
5.1.1 Freeway Control Theory
The freeway traffic management system has three primary control functions: freeway data collection, control system decision making, and control output or changing of the signal state. The most frequent of these tasks is data collection. The data inputs from vehicular detectors may be handled as they occur or may be recorded into the existing databases. The second most frequent task is determining the desired ramp states. In merging control, every gap in the merging area is a potential "Acceptable Gap." Each gap must be evaluated with respect to the release or service gap to determine whether a change in the signal state is required. A less frequent task, usually performed every five minutes, determines the optimum input rates from the linear programming process. This part of the freeway control program incorporates ramp control routines with appropriate service gaps or cycle times if the ramp is under merging control.
The most popular freeway on-ramp control theory applies the DemandCapacity Philosophy. It states that freeway congestion is often caused by the operating conditions of demand exceeding capacity. Congestion would result if the ramp input is not controlled, or if the approaching upstream demand plus the input ramp demand is greater than the downstream capacity. Therefore, urban congestion may be prevented if demand is kept less than or equal to the
53
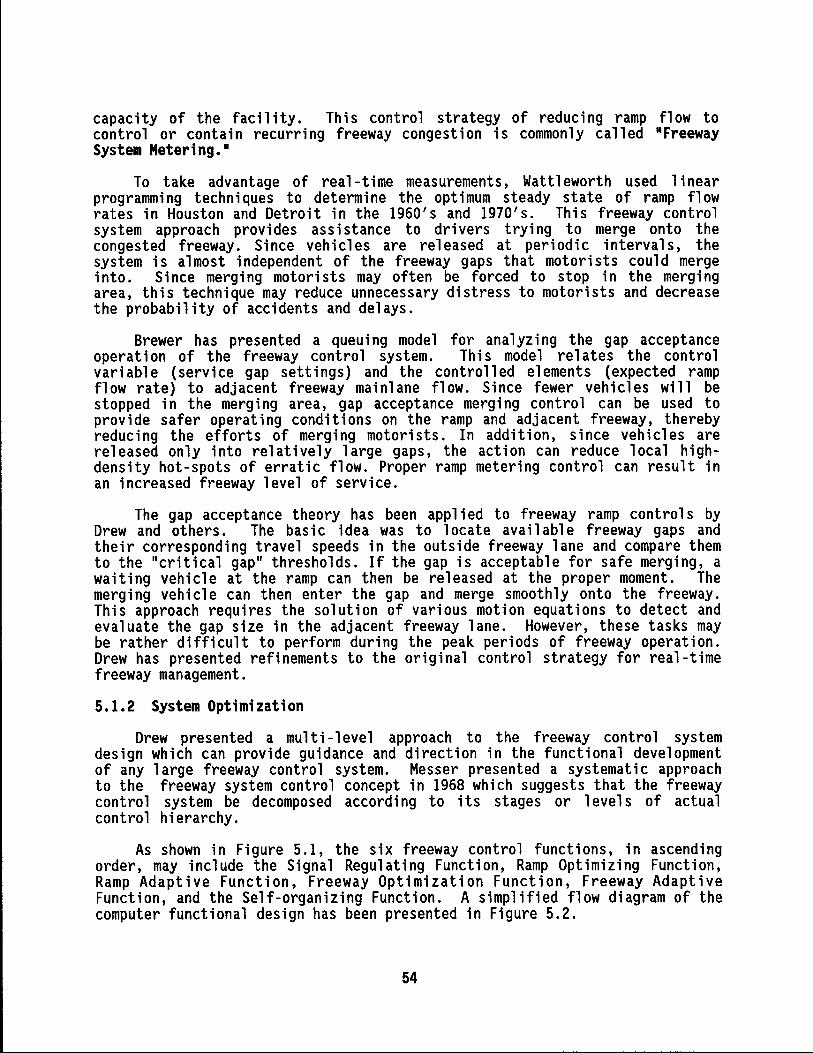
capacity of the facility. This control strategy of reducing ramp flow to control or contain recurring freeway congestion is commonly called "Freeway System Metering.•
To take advantage of real-time measurements, Wattleworth used linear programming techniques to determine the optimum steady state of ramp flow rates in Houston and Detroit in the 1960's and 1970's. This freeway control system approach provides assistance to drivers trying to merge onto the congested freeway. Since vehicles are released at periodic intervals, the system is a 1 most independent of the freeway gaps that motorists could merge into. Si nee merging motorists may often be forced to stop in the merging area, this technique may reduce unnecessary distress to motorists and decrease the probability of accidents and delays.
Brewer has presented a queuing model for analyzing the gap acceptance operation of the freeway control system. This model relates the control variable (service gap settings) and the controlled elements (expected ramp flow rate) to adjacent freeway mainlane flow. Since fewer vehicles will be stopped in the merging area, gap acceptance merging control can be used to provide safer operating conditions on the ramp and adjacent freeway, thereby reducing the efforts of merging motorists. In addition, since vehicles are released only into relatively large gaps, the action can reduce local highdensity hot-spots of erratic flow. Proper ramp metering control can result in an increased freeway level of service.
The gap acceptance theory has been applied to freeway ramp controls by Drew and others. The basic idea was to locate available freeway gaps and their corresponding travel speeds in the outside freeway lane and compare them to the "critical gap" thresholds. If the gap is acceptable for safe merging, a waiting vehicle at the ramp can then be released at the proper moment. The merging vehicle can then enter the gap and merge smoothly onto the freeway. This approach requires the solution of various motion equations to detect and evaluate the gap size in the adjacent freeway lane. However, these tasks may be rather difficult to perform during the peak periods of freeway operation. Drew has presented refinements to the original control strategy for real-time freeway management.
5.1.2 System Optimization
Drew presented a multi-level approach to the freeway control system design which can provide guidance and direction in the functional development of any large freeway control system. Messer presented a systematic approach to the freeway system control concept in 1968 which suggests that the freeway control system be decomposed according to its stages or levels of actual control hierarchy.
As shown in Figure 5.1, the six freeway control functions, in ascending order, may include the Signal Regulating Function, Ramp Optimizing Function, Ramp Adaptive Function, Freeway Optimization Function, Freeway Adaptive Function, and the Self-organizing Function. A simplified flow diagram of the computer functional design has been presented in Figure 5.2.
54
LEVELS SELF ORGANIZATION· ~
LEVEL OF SERVICE ... - DETECTORS FUNCTION
J LEVEL4
FREEWAY VOLUME - SPEED ADAPTIVE ENVIRONMENTAL .... FUNCTION DETECTORS
J LEVEL3
FREEWAY I I-OPTIMIZATION .. VOLUME DETECTORS FUNCTION
J LEVEL2
RAMP QUEUE, MERGE, AND i+-ADAPTIVE .. SPEED DETECTORS FUNCTION CLOCK
J -
LEVEL 1 RAMP VOLUME - DEMAND ... OPTIMIZATION .. DETECTORS FUNCTION
J ' I GAP, SPEED, ·AND CHECK-I~ I._ SIGNAL
LEVELO REGULATING ~ RAMP RAMP
1--1 FUNCTION . SIGNAL . VEHICLES
Figure 5.1 Freeway Ramp Control Theory (5 Levels)
55

[ S971DEC2 • GEM)
-LEVEL OF SERVICE
DETECTORS Ds
~ SELF ORGANIZING 4 m FUNCTION _,
I
3rd LEVEL
1st LEVEL &
'ZERO LEVEL
ENVIRONMENTAL DETECTORS
ma ',_ ~ ADAPTIVE
CHECK-IN, QUEUE, AND VOLUME DETECTORS
Do
w a FUNCTION ~
~ ca
mo va ya_ -----
0 _. OPTIMIZING v FUNCTION _.
co WO ____ _.
0 T
EDCPC.02/18/92.
GAP, SPEED, 1+--------~ AND MERGE DETECTORS
or
c = controUed variables (speed, volume, density, occupancy)
d = disturbance vector (unintended Inputs)
u = manipulatable vector (inputs Influenced by control)
n = signal from controUer to actuator m = lnstrumentable variables
(vehicle presence, etc.) r = reference Input v = parameter vectors
(control model parameters) w = operating specifications
(control restrictions T = sampling periods
-----ZERO LEVEL SWrTCHES--+----1..,
,\ d--t I
r REGULATING RAMP RAMP ~r ___ FUNCTION ~ SIGNALS V ~ VEHICLES~
er A yr p "-~~~~~---11......:.-...J
Figure 5.2 Freeway Ramp Metering System (5971).
56
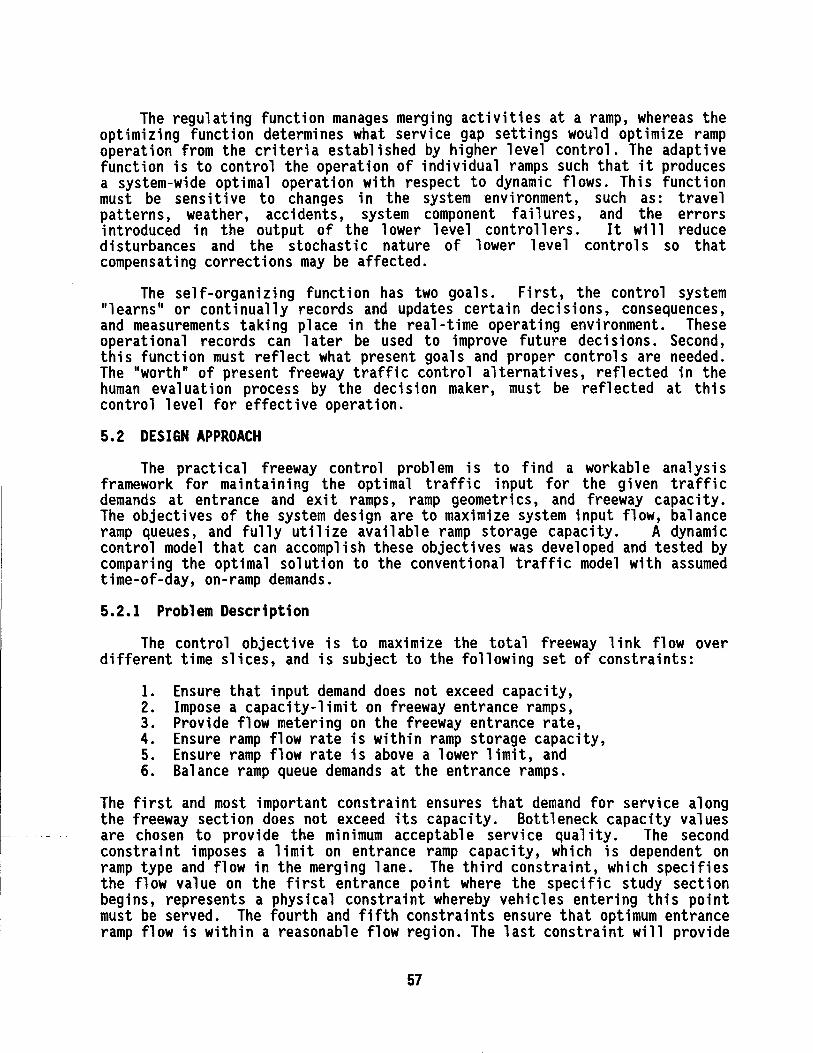
The regulating function manages merging activities at a ramp, whereas the optimizing function determines what service gap settings would optimize ramp operation from the criteria established by higher level control. The adaptive function is to control the operation of individual ramps such that it produces a system-wide optimal operation with respect to dynamic flows. This function must be sensitive to changes in the system environment, such as: travel patterns, weather, accidents, system component failures, and the errors introduced in the output of the lower level cont ro 11 ers. It will reduce disturbances and the stochastic nature of lower level controls so that compensating corrections may be affected.
The self-organizing function has two goals. First, the control system "learns" or continually records and updates certain decisions, consequences, and measurements taking place in the real-time operating environment. These operational records can later be used to improve future decisions. Second, this function must reflect what present goals and proper controls are needed. The "worth" of present freeway traffic control alternatives, reflected in the human evaluation process by the decision maker, must be reflected at this control level for effective operation.
5.2 DESIGN APPROACH
The practical freeway control problem is to find a workable analysis framework for maintaining the optimal traffic input for the given traffic demands at entrance and exit ramps, ramp geometrics, and freeway capacity. The objectives of the system design are to maximize system input flow, balance ramp queues, and fully utilize available ramp storage capacity. A dynamic control model that can accomplish these objectives was developed and tested by comparing the optimal solution to the conventional traffic model with assumed time-of-day, on-ramp demands.
5.2.1 Problem Description
The control objective is to maximize the total freeway link flow over different time slices, and is subject to the following set of constraints:
I. Ensure that input demand does not exceed capacity, 2. Impose a capacity-limit on freeway entrance ramps, 3. Provide flow metering on the freeway entrance rate, 4. Ensure ramp flow rate is within ramp storage capacity, 5. Ensure ramp flow rate is above a lower limit, and 6. Balance ramp queue demands at the entrance ramps.
The first and most important constraint ensures that demand for service along the freeway section does not exceed its capacity. Bottleneck capacity values are chosen to provide the minimum acceptable service quality. The second constraint imposes a limit on entrance ramp capacity, which is dependent on ramp type and flow in the merging lane. The third constraint, which specifies the flow value on the first entrance point where the specific study section begins, represents a physical constraint whereby vehicles entering this point must be served. The fourth and fifth constraints ensure that optimum entrance ramp flow is within a reasonable flow region. The last constraint will provide
57

needed access equity and queue balance considerations among the different entrance ramps over the entire analysis period.
5.2.2 Program Formulation
To investigate the various freeway system control funct i ans, two different model formulations have been examined:
1. Basic Model, and 2. Dynamic Model.
Basic Model
The Basic Mode 1 uses the sequent i a 1 so 1 ut ion approach as deve 1 oped by Messer of the Texas Transportation Institute, and solves the optimization problem for individual time slices sequentially. The objective of the model is to maximize freeway system input subject to freeway mainline capacity or level of service constraints, and to make sure that minimum and maximum flow boundary limits are satisfied subject to the upper limits of the ramp metering and merging capacity specified by the users.
On-ramp demand is updated using the demand carry-over from prior time slices. Ramp queues remaining at this time slice simply become demands in the next time slice. This basic model cannot optimize queue carry-over between time slices, which would fully balance the available ramp entrance capacity.
Dynamic Model
The "Dynamic Model" solves freeway ramp metering optimization problems by reducing the potential sum of all freeway ramp spillovers over several time slices. The Dynamic Model will dynamically balance the overall freeway input and output flows and provide the optimization mechanism of queues at different time slices. Using the basic problem formulation shown as follows, the effects of different model formulations were examined.
Maximize:
Subject to
N
W N P = c £ X· (k)
1<=1 i=l 1
E. A;j (k)X; (k) ~ Bj (k) i=l
N-1
for all freeway sections j=l ... L
Pm E A; m ( k) Xi ( k) + EmXm ( k) ~Cm for a 11 m, k i=l
Rm(k) = Tm(k) - Xm(k) for a 11 m, k
Qm(k) = (1-d)Rm(k) for al 1 m, k
58
(1)
(2)
(3)
(4)
(5)

Tm(k+l) = Dm(k+l) + Qm(k)
Qm(k) ~ Um,max
Xm,min ~ Xm(k) ~ Tm(k) and Xm,max
Where
for all m, k
for some m
for all m, k
(6)
(7)
(8)
i ,m j k
input i; metered ramps (m) start at i =2 (i = 1, 2, ... , N) freeway section (j = 1, 2, ... , L)
Xi (k) Aij (k)
- time slice (k = 1,2, ... , W) - input flow at input i in time slice k - proportion of vehicles entering at input i which
pass through freeway section j in time slice k - capacity of section j in time slice k - base demand at input i in time slice k - total ramp demand Dm(k) + Qm(k-1) at ramp m in time
slice k - minimum metering rate for metered ramp m - queue storage capacity at ramp m - equivalency, capacity, based on the type of on-ramp m - proportion of mainline vehicles in merge lane at ramp m - queue length at on-ramp mat the end of time slice k
the number of vehicles transferred to time slice k+l - fraction of potentially delayed vehicles diverting from
metered ramp m
5.2.3 Program Implementat;on
The dynamic model described above is used in the main program. The LP formulations are generated by the program from the input data which includes: freeway geometry, freeway and ramp capacities, ramp demands, and other freeway configurations. A 11 constraints are active in the linear program except the ramp queue constraints (Li(k) ~ Ut>· The queue capacity of each ramp is set to be maximum of 1000 as the default value in the current version.
Due to existing memory constraints, the current version of the ramp metering control program only analyzes freeway systems with at most eight entrance ramps, six exit ramps, and eight time periods.
The maximum number of entrance ramps and time slices, however, can be changed easily with slight program changes.
5.2.4 Data Flow And Data f;le Descr;pt;on
The data flow diagram is shown in Figure 5.3. The input data files are read by the main control subroutine. The coefficient table of the LP formulation is generated from the input data and passed to the LP subroutine. The solution of the LP formulation is then converted to the proper format and written to the output files.
59
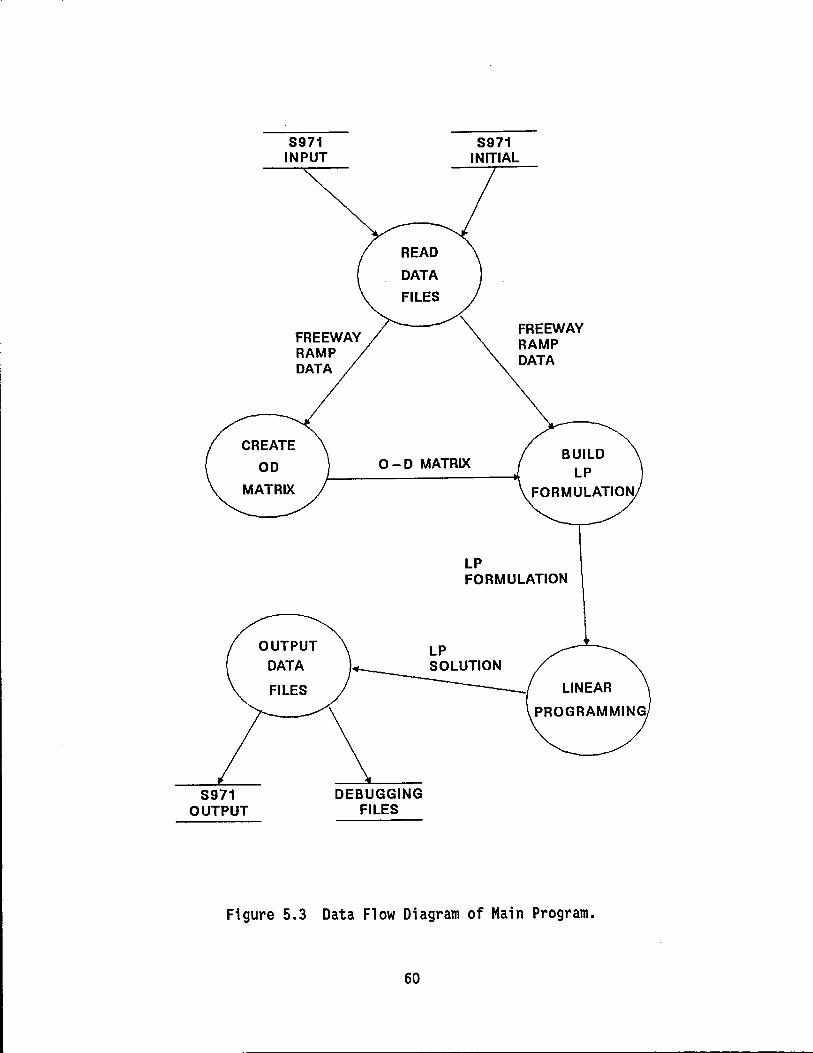
S971 INPUT
CREATE
OD
MATRIX
FREEWAY RAMP DATA
OUTPUT DATA
READ
DATA
FILES
S971 INITIAL
FREEWAY RAMP DATA
0-D MATRIX BUILD
LP FORMULATION
LP FORMULATION
FILES LINEAR
S971 DEBUGGING OUTPUT FILES
Figure 5.3 Data Flow Diagram of Main Program.
60
The descriptions of a 11 data files read or written by the system are listed in Table 5.1. The output files of the program include the main output file and some debugging files. These debugging files are generated only when the debug function is enabled. Examples of the data files are included in Appendix A. Appendix B presents the file formats and variables.
5.2.5 Program Flowchart
Figure 5.4 shows the execution environment of the main metering control program. The program flow chart is shown in Figure 5.5. The major steps in program execution are:
1. Read input data files The main input file and the configuration input file are read at the beginning of the program. The size of the LP coefficient table is decided at this point. The data read from the files are assigned to the appropriate arrays.
2. Create OD matrix The ramp 0-D matrices are created by the procedure OD from the Eij matrix and ramp demands. One 0-D matrix is created for each time period.
3. Generate LP formulation The coefficient table of the LP formulation is generated from the ramp 0-D matrices, freeway and ramp capacities, the probability of a vehicle on the merging lane (BmPn), and ramp diversion ratios. These coefficients are computed by the procedure BUILD.
4. Linear Programming Linear programming is performed by the procedure LPNEW. This linear programming procedure was written in FORTRAN, then converted to a TURBO C program.
5. Compute VIC ratios After the ramp metering rates are converted from the solution of the linear programming, the controlled Volume/Capacity ratios are computed by the procedure VCLINK.
6. Write output files The ramp control results of the freeway system are then written to the output file. Some debugging files might be created in the previous steps if the debug function is enabled.
A complete list of the procedures of the program is shown in Table 5.2. Some developed procedures are inactive in the current version. However, these procedures will be included in the extended versions.
5.2.6 Program Highlights
1. The debugging files, created by the main program provide all intermediate data that can be used to diagnose the LP processing. However, more computing time and disk space will be required in order to build these files. To provide these extended features, flexibility was enhanced by allowing the user to specify debugging operations at run time. To specify the debugging function, users simply add "-d" in the command line, e.g., type "DRAW9711 -d."
61

DATA FILE DESCRIPTION
Input Fil es:
S971.PRM
INITIAL.DAT
INITIAL.MAX
Output File:
S9711.0UT
Debugging Files: (optional)
S971 FORM. OUT
MATRIX.OUT
LPIN.OUT
LPNEW.OUT
Main input file Includes freeway and ramp capacities, ramp demands, BmPn, and diversion ratios
Default input file Read by the program if the file 5971.PRM does not exist
Configuration input file Includes freeway geometry and Eij matrix
Main output file Including objective function value, ramp metering rates and Volume/Capacity ratios
LP formulation used as the input file of the LINDO program (optiqnal)
Coefficient table of the LP formulation
Input of the LP procedure in MPS format
Special output format of the LP procedure
Table 5.1 Data f;le L;st of Ramp Meter;ng Control Program
62

I
SUBROUTINES SUB2 - SUBS
+ STUDV971.C
I SUB2.C I
I SUB3.C I
I SUB4.C I JsuBs.cj
JsuBs.cj
JsuB1.cj
JsuBs.cj
isuB9.cj
STUDY 971 ENVIRONMENT I
GLOBALH
MAIN PR GRAM
INITIAUZA TION
DEFAULT
WHILE (NOT EOF) { PROCESS SUBSYSTEM
l
STUDY971.C
GLOBAL.EXT
SUPPORTING SUBROUTINES
DUMMY01.C - DUMMYOS.C CREATE.C CONVERT1.C CONVERT2.C VCLINK.C
INPUT DATA FILES
INITIAL.MAX
INITIAL.DAT
S971.PRM
····················· ................... .
OUTPUTS
S9710.0UT OUTPUT FOR DEFAULT DATA
S9711.0UT OUTPUT FOR SUBSECTION I
S9712.0UT OUTPUT FOR SUBSECTION II
9713.0UT OUTPUT FOR SUBSECTION 111
DEBUGGING FILES
LPNEW.OUT OUTPUT FOR LPNEW FORMA
LPIN.OUT INPUT FOR LP NEW
S971FORM. OUT INPUT FOR UNDO
OTHER DEBUGGING
FILES
Figure 5.4 STUDY971 Environment.
63
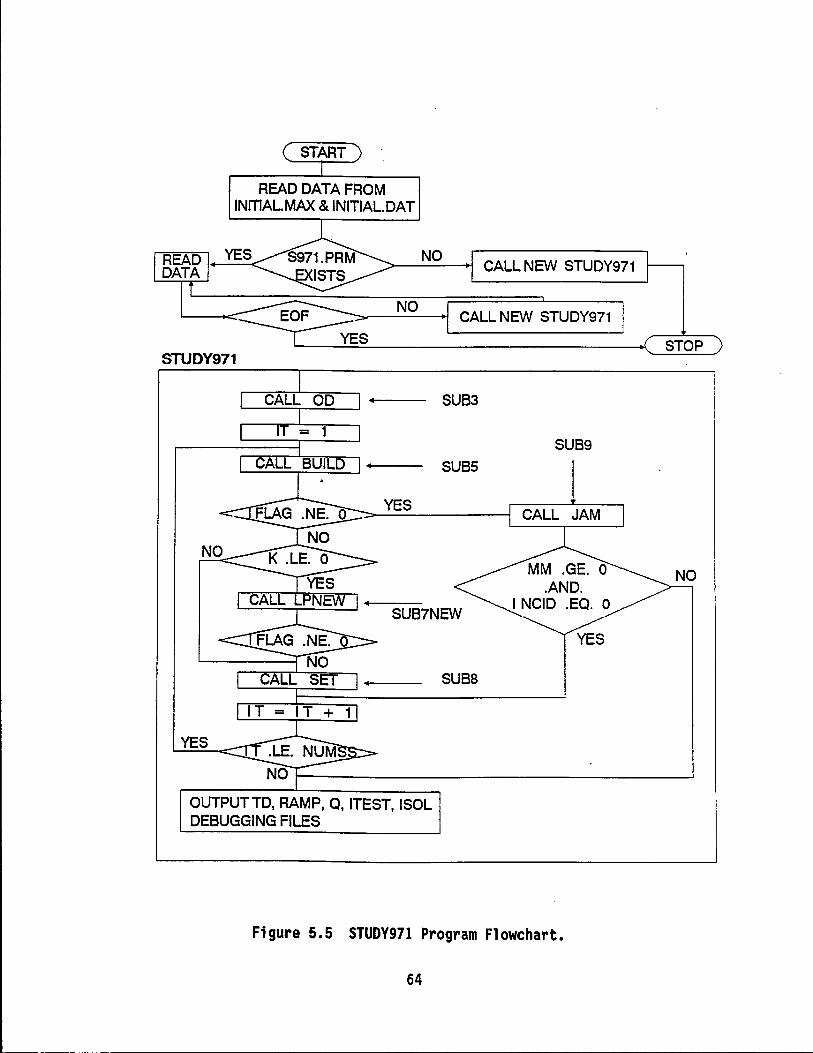
START
READ DATA FROM INmALMAX & INITIAL.DAT
NO
STUDY971
CALL OD
= 1
YES
NO CALL NEW STUDY971
CALL NEW STUDY971
SUB3
SUB9
SUBS
CALL JAM
SUB7NEW
SUBS
IT = IT + 1
YES
STOP
NO~~~~~~~~~~~~~~~~~--'
OUTPUTTD, RAMP, Q, ITEST, ISOL DEBUGGING FILES
Figure 5.5 STUDY971 Program Flowchart.
64

PROCEDURE LIST OF MAIN PROGRAM
PROCEDURE FUNCTION
DRAW971 read in data with multiple time slice call STUDY971
STUOY971 main control procedure
INC incident detection procedure not included in current version
OD create 0-D matrix for multiple time slices
CHOO modify travel patterns not included in current version
BUILD generate LP formulation from 0-0 matrix
CHECK check lower and upper bounds of ramp volumes
LP NEW linear programming procedure (SIMPLEX)
SET justify LP solutions (not inc1uded in current version)
JAM congestion management (not included in current version)
xx assign LP matrix values to appropriate arrays
AMAT get LP matrix values from the right array
CREATE create input file for LPNEW(stand alone)
VCLINK compute the controlled volume/capacity ratios
OUMMY01 dummy subroutines for declaring subarrays of LP coefficient table I
DUMMY08
Table 5.2 Procedure List of Main Program.
65
1-- -
2. One of the debugging files provided by the main program is the generation of the input file for opt i ona 1 LINDO execution. Using this file transfer utility, the LP solution can be obtained by running the LINDO program separately.
3. In the original version of the LP procedure, the coefficients of the LP formulation are declared as floating point variables which require four bytes of memory each. To minimize the size of the coefficient table and the memory space needed during multiple time slice operations, all coefficients are converted to integer operation by multi p 1 yi nq by I. 000 and dee 1 ared as integers. Each coefficient is further divided by 1,000 before being computed in the LP procedure and then multi p 1 i ed by 1, 000 in order to obtain the final result.
4. Since there is a physical limitation of 64K bytes of data area for each subroutine in TURBO C, the coefficient tab 1 e has to be sp 1 it into several sub-arrays, and these sub-arrays have to be declared in different procedures. Subroutines DUMMYOl, DUMMY02, ... , and DUMMY08 are dummy subroutines used for declaring the sub-arrays. The procedure XX is the subroutine that assigns the LP matrix values to the appropriate sub-arrays. The procedure AMAT is used to get the right data from a sub-arrays to be computed in the LP procedure.
5. The execution of the LP procedure is the most time consuming part of the whole program. Since the coefficient table has the characteristics of sparse matrices, i . e. , most entries are zeros, the performance of the LP procedure was s i qn if i cant 1 y imp roved by skipping the computations of the entries not changed in each iteration. During each iteration of the LP tab 1 e, the computation will not be performed if one of the coefficients used to update this coefficient has a zero value.
5.3 PROGRAM ANALYSIS
The dynamic model formulation for freeway on-ramp control was tested using hi stori ca 1 data from US59 Southwest Freeway 1 ocated in Houston. The optimal solutions of the dynamic models were compared to solutions obtained from FREQlO for the analysis of freeway control strategies. The selected data with 8 on-ramps and 5 off-ramps was analyzed. A 1-hour control period or four 15-minute time slices was used even though the program will use data with any interval length during the analysis.
5.3.1 Test Data
When comparing the optimal solution to conventional ramp metering timing plan development models, the simultaneous solution approach consistently outperformed the sequential solution on balancing freeway volumes and queue lengths. Using the Linear Programming procedure with the dynamic model formulation generated by the BUILD procedure, the program provided results similar to the solution of the LINDO code. The solutions are different only after the 4th digit following the decimal point.
66
5.3.2 Computation Efficiency
Two major concerns in the performance of the main program are the memory space of the LP coefficient table and the computation time of the program. The size of the coefficient table is dee i ded by the number of on-ramps and the number of time slices. Let #row and #col represent the numbers of rows and columns of the table, respectively. Let #ramp be the number of on-ramps and #time be the number of time slices. The size of the LP table is described as follows.
#row = ( #ramp * 6 + 2 ) * #time
#col = ( #ramp * 3 + 1 ) * #time + #row
Table 5.3 is the comparison table which includes the program execution time of input data files with different numbers of time slices and on-ramps in different models of microcomputers. The sizes of LP coefficient tables are also listed.
5.4 FURTHER DEVELOPMENT
The numbers of time slices and on-ramps are both limited to eight due to the memory constraints in the current version. This limitation can be changed to 16 on-ramps and 4 time slices by modifying the table-array conversion subroutine in future versions. The maximum size of the coefficient table, however, will remain the same.
In the current version, the memory space of the maximum size of the LP table is declared no matter how small the input size is. To fully utilize the memory capacity, a dynamic memory allocation method could be used to allocate memory space depending on the sizes of inputs. The dynamic memory allocation method will replace the current static memory allocation in the next version.
Some procedures listed previously in Table 5.2 have not been included in the current version. Each procedure was developed to solve different freeway ramp control problems. These procedures will be activated in future versions.
67
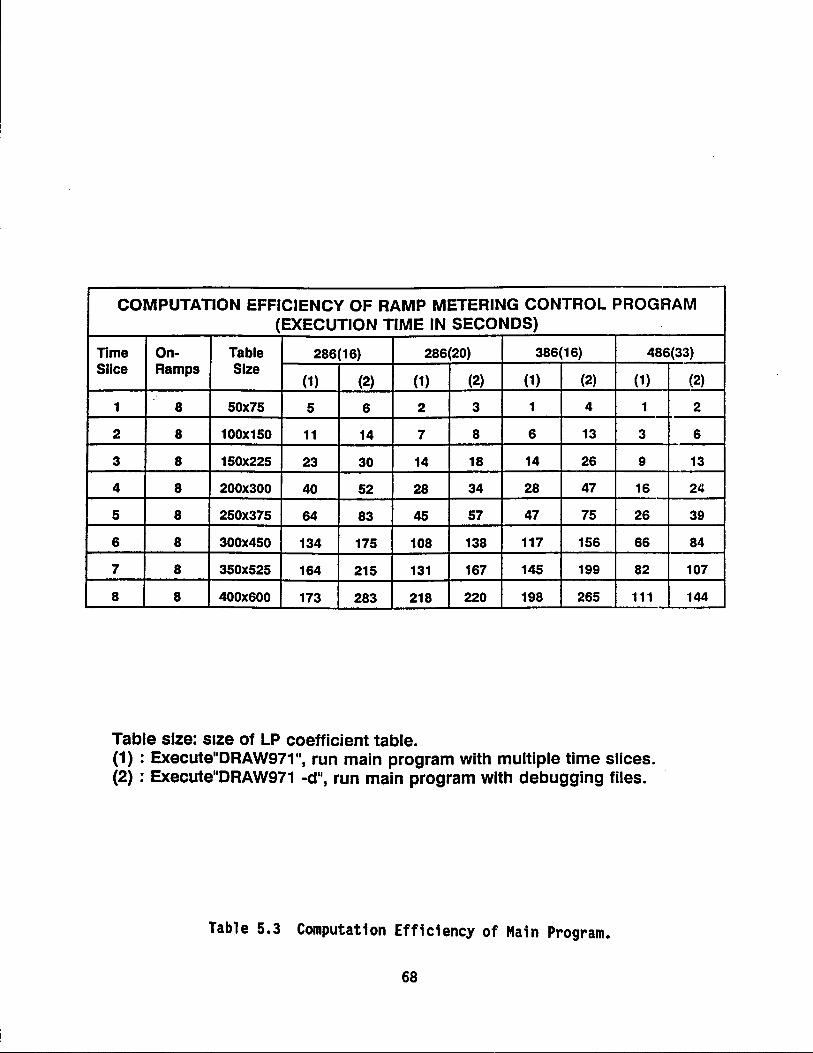
COMPUTATION EFFICIENCY OF RAMP METERING CONTROL PROGRAM (EXECUTION TIME IN SECONDS}
Time On- Table 286(16) 286(20) 386(16) 486(33) Slice Ramps Size
(1) (2) (1) (2) (1) (2) (1)
1 8 50x75 5 6 2 3 1 4 1
2 8 100x150 11 14 7 8 6 13 3
3 8 150x225 23 30 14 18 14 26 9
4 8 200x300 40 52 28 34 28 47 16
5 8 250x375 64 83 45 57 47 75 26
6 8 300x450 134 175 108 138 117 156 66
7 8 350x525 164 215 131 167 145 199 82
8 8 400X600 173 283 218 220 198 265 111
Table size: size of LP coefficient table. (1) : Execute11DRAW971", run main program with multiple time slices. (2) : Execute11DRAW971 -d", run main program with debugging files.
Table 5.3 Computat;on Eff;c;ency of Ma;n Program.
68
{2)
2
6
13
24
39
84
107
144

6. CONCLUSIONS AND RECOMMENDATIONS
TxDOT has begun the implementation of surveillance, communication, and control (SC&C) centers to provide effective traffic management alternatives. Developing pre-implementation ramp metering timing patterns and feeding control patterns into satellite computers can further enhance urban freeway corridor management. The D-1232 study will continue the development of the off-line freeway system ramp metering control strategies and assist the implementation of the microcomputer-based algorithms for on-1 ine applications. Model formulation, linear programming schemes, run-time characteristics, and user interface designs have been examined.
This task has developed a user-friendly, graphics-based, input/output, database management, decision assistance, and graphics-based evaluation system for initial pre-implementation ramp metering development. The system will permit control operators and traffic engineers to optimize freeway flow, ramp queues, and identify available freeway capacity. Data management software is being developed on MS DOS based microcomputer systems to allow users to examine graphical information, evaluate results, and assist the operator at traffic management centers. A real-time freeway trip origin-destination prediction model is includeed in the model to calibrate the proposed model for better representation of Texas freeway operating conditions.
6.1 PRE-IMPLEMENTATION PACKAGE
The enhanced freeway control formulation, based on the queue management concept, has been implemented and tested successfully in TURBO C. The current system can analyze a freeway system with a maximum of eight entrance ramps, and eight time periods. The system software will eventually be expanded to analyze a freeway system with a maximum of three subsections, twenty entrance ramps, and eight time periods. The detailed system design and preliminary assessment are being documented.
6.2 REAL-TIME OPERATION
Basically, the computer system has two primary functions, including the freeway control process and other non-processes in real-time control systems. The freeway control system provides engineering analyses on freeway demand and supply relationships. Other "time-shared" processes include data analysis programs that provide performance evaluation information on how the system has been operating. These include programmable control parameters, such as the weather related adjustment, control operation, or other components completely unrelated to the freeway control process.
To accommodate both the initial pre-implementation and ultimate on-line __ implementation, the study team has designed a functional module approach to
implement the systemwide freeway ramp metering algorithm. The system design uses a formatted input data file to access separate data input modifications, the main program, the output evaluation, and assistance function modules. These modules can be selectively activated individually or sequentially executed through batch files. The main program is designed for on-line, task-dependent, fail-safe, pattern generation applications.
69

6.3 SYSTEM DEVELOPMENT
The basic study approach begins by identifying the input variables and determining the input data, output report level, and system requirements needed for successful freeway ramp control operation. The review also helped develop pre-implementation ramp control pattern generation software. The model representation, pro bl em formulation, 1 i near programming opt imi zat ion scheme, run-time characteristics, and functional design requirements of the existing model were proposed. Program software and a generalized, user-friendly input/output interface was developed for designing pre-implementation freeway ramp metering and control strategies, and to provide pattern generation for MS DOS based IBM PC/XT/AT or compatible systems.
The model performance was tested under varying free-flow, recurring congestion, and non-recurring congestion conditions. This test identified the effectiveness and sensitivities of the model's traffic control strategy. A control strategy was developed to generate optimized ramp metering rates under either isolated or system control. Specifically, optimized traffic flow and evaluation results from the software being developed were examined with different flow patterns and various freeway and traffic volume levels. The study prepared the necessary program and user manual revisions, and completed the program documentation for microcomputer operations.
70
,--------- -
REFERENCES
1. "Indelec's Multi-View: Spreadsheet-Based Control." Control Engineering, May 1990.
2. "Quattro Pro User's Guide." Borland, 1992.
3. Brewer, K.A. "Description and Evaluation of Controlled Freeway Merging." Doctoral Dissertation, Texas A&M University, 1968.
4. Chang, E., C. J. Messer, and B. R. Derr. "Off-1 ine Freeway Traffic Control Strategies." Conference Proceedings, 1989 Annual ITE Meeting in San Diego, California, September 1989.
5. Chen, C., J. B. Cruz, Jr., and J. G. Paquet. "Entrance Ramp Control for Travel-Rate Maximization in Expressways." Transportation Research 8, 1974, pp. 503-508.
6. Drew, D.R. "Traffic Flow Theory." McGraw-Hill, 1976.
7. Drew, D.R., K.A. Brewer, J.H. Buhr, and R.H. Whitson. "Multilevel Approach Applied to the Design of a Freeway Control System." Research Report 504-1, Texas Transportation Institute, 1968.
8. Foote, R.S. "Development of An Automatic Traffic Flow Monitor and Control System." Highway Research Board, Bulletin 291, 1961, pp. 79-103.
9. Imada T. and A. D. May. "FREQ8PE: A Freeway Corridor Si mul at ion and Ramp Metering Optimization Model." Report UCB-ITS-RR-85-10, Institute of Transportation Studies, University of California, Berkeley, CA, 1985.
10. Kacmar, C. J. "An Experimental Comparison of Text and Icon Menu Item Format." Ablex Publishing Corporation, 1991, pp. 27-41.
11. Keese, C.J., C. Pinnell, and W.R. Mccasland. "A Study of Freeway Traffic Operation." Highway Research Board Bulletin 235, 1960, pp. 73-132.
12. McAlister, James. "Easy-to-use Spreadsheet Makes Figures More Fetching." Machine Design, January 1990.
13. Messer, C.J. "A Design and Synthesis of a Multilevel Freeway Control System and a Study of its Associated Operational Control Plan." Ph.D Dissertation, Texas A&M University, 1969.
14. Malich, R., and J. Nielsen. "Improving a Human Computer Dialogue." Communications of the ACM, Vol 33, No 3, March 1990.
15. Nevison, John M. and Richard Matesian. "The Elements of Spreadsheet Style" (Book Review). IEEE Micro, December 1990.
71
16. Open Software Foundation, "OSF/Motif Style Guide." Prentice-Hall, 1990, pp. 1.1-13, pp. 4.52-53.
17. Papageorgiou, M. "A New Approach to Time-of-Day Control Based On a Dynamic Freeway Traffic Model." Transportation Research 14B, 1980, pp. 349-360.
18. Peck, Gregory S. and E. Lucia. "Quattro Pro: The Best Spreadsheet Value." Management Accounting, New York, November 1990.
19. Petzold, C. "Programming Windows." Microsoft Press, 1990, pp 45-55.
20. Schrage, L. "Users Manual for Linear, Integer and Quadratic Programming." John Wiley & Sons, Ltd., London, England, 1973.
21. Sommerville, I. "Software Engineering." Addison-Wesley Publishing, 1989, pp. 23-50.
22. Taha, H.A. "Operations Research: An Introduction." 2nd ed., MacMillan Publishing Co., New York, 1976.
23. Tepordei, Valentin V. "Top Spreadsheet Programs Picked." 1990.
24. Wattleworth J. A. and D. S. Berry. "Peak-Period Control of a Freeway System - Some Theoretical Investigations." Highway Research Record 89, 1965, pp. 1-25.
25. Yuan, L. S. and J. B. Kreer. "Adjustment of Freeway Ramp Metering Rates to Balance Entrance Ramp Queues." Transportation Research 5, 1971, pp. 127-133.
72

APPENDIX A. CONTENTS OF DATA FILES
73


[FILE NAME: S971.PRM]
2 4 1 8 5 313 313 313 313 313 313 313 313
1462 1462 1462 1462 1462 1462 1462 1462 1462 1462 1500 1500 1500 1750 0.15 0.15 0.15 0.15 0.15 0.15 0.15 0.15 0.15 0.00 0.00 0.00 0.00 0.00 0.00 0.00 0.00 1251 232 141 368 284 115 151 95 141 1251 1927 357 226 100 105 63 1927
1285 228 144 310 272 125 160 102 123 1285 1837 366 204 138 129 75 1837
[FILE NAME: INITIAL.DAT]
2 4 1 8 5 313 313 313 313 313 313 313 313
1462 1462 1462 1462 1462 1462 1462 1462 1462 1462 1500 1500 1500 1750 0.15 0.15 0.15 0.15 0.15 0.15 0.15 0.15 0.15 0.00 0.00 0.00 0.00 0.00 0.-00 0.00 0.00 1251 232 141 368 284 115 151 95 141 1251 1927 357 226 100 105 63 1927
1285 228 144 310 272 125 160 102 123 1285 1837 366 204 138 129 75 1837
[NAME: INITIAL.MAX]
1 1 1 2 1 1 2 2 3 4 5 5 6 1 2 2 3 4 4 5 5 6 6 7 8 8 9 0 0 1 1 1 2 2 3 3 4 4 4 5 5 0.85 0.42 0.00 0.00 0.00 0.00 0.00 0.00 0.00 0.95 0.73 0.39 0.24 0.00 0.00 0.00 0.00 0.00 0.98 0.84 0.65 0.56 0.27 0.00 0.00 0.00 0.00 0.99 0.91 0.80 0.74 0.57 0.15 0.00 0.00 0.00 1.00 0.95 0.90 0.87 0.79 0.57 0.39 0.18 0.00 1.00 1.00 1.00 1.00 1.00 0.98 0.95 0.89 0.81
75
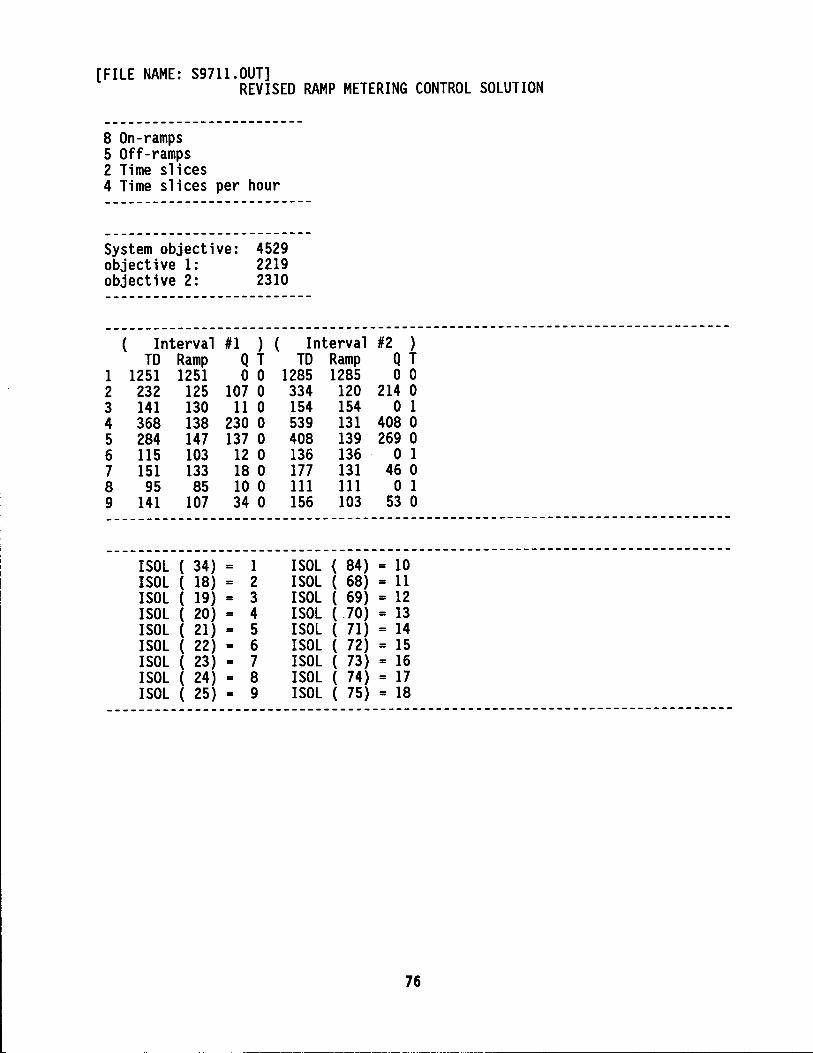
[FILE NAME: S97II.OUT] REVISED RAMP METERING CONTROL SOLUTION
8 On-ramps 5 Off-ramps 2 Time slices 4 Time slices per hour
System objective: 4529 objective I: 22I9 objective 2: 23IO
------------------------------------------------------------------------------( Interval
TD Ramp I I25I I25I 2 232 I25 3 I4I I30 4 368 I38 5 284 I47 6 ll5 I03 7 I5I I33 8 95 85 9 I4I I07
#I ) ( Q T 0 0
I07 0 ll 0
230 0 I37 0 I2 0 I8 0 IO 0 34 0
Interval TD Ramp
I285 I285 334 I20 I54 I54 539 I3I 408 I39 I36 I36 177 I3I Ill Ill I56 I03
#2 ) Q T 0 0
2I4 0 0 I
408 0 269 0
0 I 46 0 0 I
53 0 ------------------------------------------------------------------------------------------------------------------------------------------------------------
ISOL ( 34) = I ISOL ( I8) = 2 ISOL ( I9) = 3 ISOL ( 20) = 4 ISOL ( 2I) = 5 ISOL ( 22) = 6 ISOL ( 23) = 7 ISOL ( 24) = 8 ISOL ( 25) = 9
ISOL ( 84) = IO ISOL ( 68) = ll ISOL ( 69) = I2 ISOL ( 70) = I3 ISOL ( 71) = I4 ISOL ( 72) = I5 ISOL ( 73) = I6 ISOL ( 74) = 17 ISOL ( 75) = I8
------------------------------------------------------------------------------
76

LINK El E2 XI E3 E4 X2 ES X3 E6 X4 E7 EB XS E9
VOLUME/CAPACITY RATIOS OF FREEWAY LINKS
( Interval #1 ) VOL CAP V/C
12Sl 1462 8S% 1376 1462 94% 1033 1462 70% 1163 1462 79% 1301 1462 88% 1100 1462 7S% 1247 1462 8S% 116S 1462 79% 1268 1462 86% 1188 1462 81% 1321 ISOO 88% 1406 ISOO 93% 13S7 ISOO 90% 1464 17 so 83%
( Interval #2 ) VOL CAP V/C
128S 1462 87% 140S 1462 96% 10S4 1462 72% 1208 1462 82% 1339 1462 91% 11S2 1462 78% 1291 1462 88% 1176 1462 80% 1312 1462 89% 1208 1462 82% 1339 ISOO 89% 14SO ISOO 96% 1389 ISOO 92% 1492 17SO 8S%
77
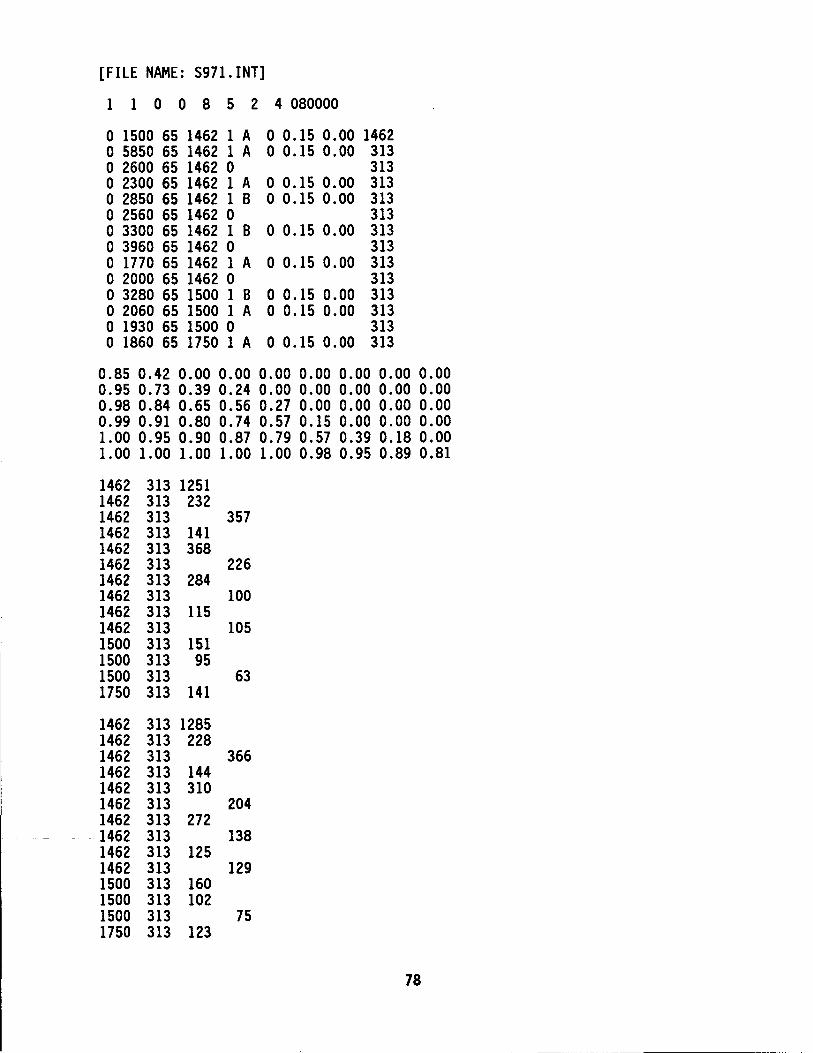
[FILE NAME: 5971.INT]
1 1 0 0 8 5 2 4 080000
0 1500 65 1462 1 A 0 5850 65 1462 1 A 0 2600 65 1462 0 0 2300 65 1462 1 A 0 2850 65 1462 1 B 0 2560 65 1462 0 0 3300 65 1462 1 B 0 3960 65 1462 0 0 1770 65 1462 1 A 0 2000 65 1462 0 0 3280 65 1500 1 B 0 2060 65 1500 1 A 0 1930 65 1500 0 0 1860 65 1750 1 A
0 0.15 0.00 1462 0 0.15 0.00 313
313 0 0.15 0.00 313 0 0.15 0.00 313
313 0 0.15 0.00 313
313 0 0.15 0.00 313
313 0 0.15 0.00 313 0 0.15 0.00 313
313 0 0.15 0.00 313
0.85 0.42 0.00 0.00 0.00 0.00 0.00 0.00 0.00 0.95 0.73 0.39 0.24 0.00 0.00 0.00 0.00 0.00 0.98 0.84 0.65 0.56 0.27 0.00 0.00 0.00 0.00 0.99 0.91 0.80 0.74 0.57 0.15 0.00 0.00 0.00 1.00 0.95 0.90 0.87 0.79 0.57 0.39 0.18 0.00 1.00 1.00 1.00 1.00 1.00 0.98 0.95 0.89 0.81
1462 313 1251 1462 313 232 1462 313 357 1462 313 141 1462 313 368 1462 313 226 1462 313 284 1462 313 100 1462 313 115 1462 313 105 1500 313 151 1500 313 95 1500 313 63 1750 313 141
1462 313 1285 1462 313 228 1462 313 366 1462 313 144 1462 313 310 1462 313 204 1462 313 272
- 1462 313 138 1462 313 125 1462 313 129 1500 313 160 1500 313 102 1500 313 75 1750 313 123
78
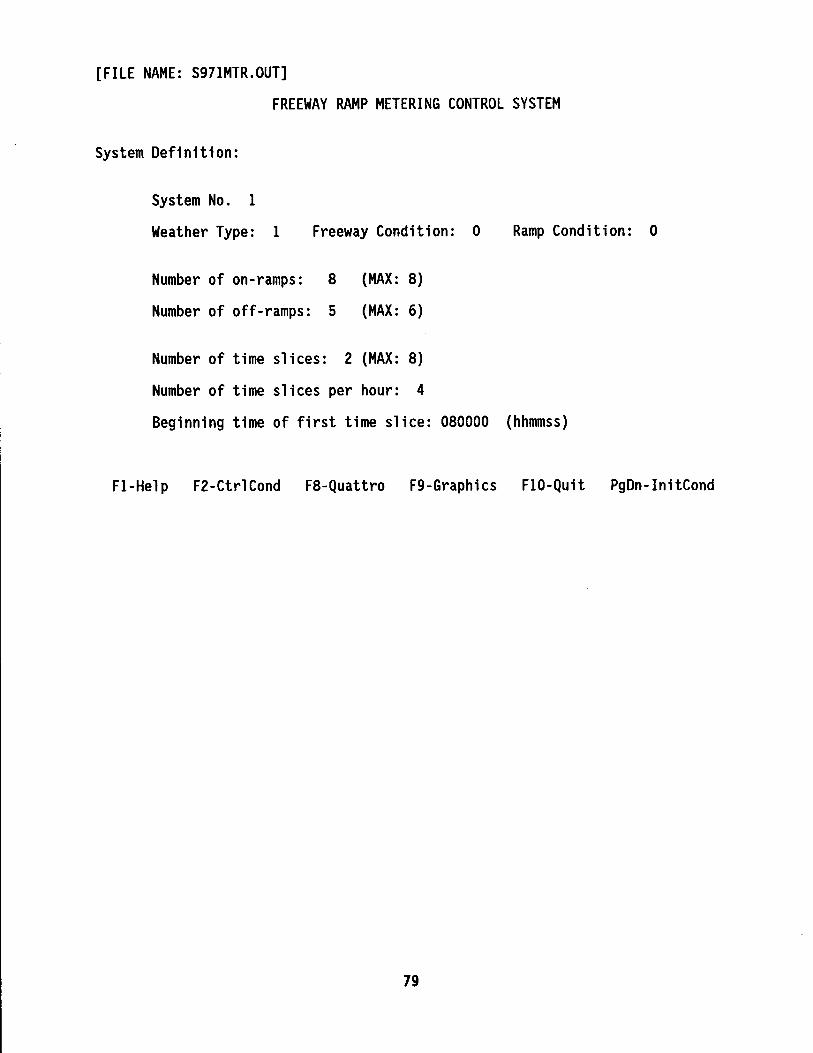
[FILE NAME: S971MTR.OUT]
FREEWAY RAMP METERING CONTROL SYSTEM
System Definition:
System No. 1
Weather Type: 1 Freeway Condition: O
Number of on-ramps: 8 (MAX: 8)
Number of off-ramps: 5 (MAX: 6)
Number of time slices: 2 (MAX: 8)
Number of time slices per hour: 4
Ramp Condition: 0
Beginning time of first time slice: 080000 (hhmmss)
Fl-Help F2-Ctr1Cond F8-Quattro F9-Graphics FIO-Quit PgDn-lnitCond
79

FREEWAY RAMP METERING CONTROL SYSTEM Initial Condition:
Links Ramps ---------------------------- ---------------------------------------No. Cond Dist Speed Cap. Type No. Cat. Cond Pm Div. Cap.
1 0 1500 65 1462 1 1 2 0 5850 65 1462 1 2 A 0 0.15 0.00 313 3 0 2600 65 1462 0 1 313 4 0 2300 65 1462 1 3 A 0 0.15 0.00 313 5 0 2850 65 1462 1 4 B 0 0.15 0.00 313 6 0 2560 65 1462 0 2 313 7 0 3300 65 1462 1 5 B 0 0.15 0.00 313 8 0 3960 65 1462 0 3 313 9 0 1770 65 1462 1 6 A 0 0.15 0.00 313
10 0 2000 65 1462 0 4 313 11 0 3280 65 1500 1 7 B 0 0.15 0.00 313 12 0 2060 65 1500 1 8 A 0 0.15 0.00 313 13 0 1930 65 1500 0 5 313 14 0 1860 65 1750 1 9 A 0 0.15 0.00 313
Fl-Help F2-Ctr1Cond F8-Quattro F9-Graphics FIO-Quit PgDn-EijMatrx PgUp-SysDef
80
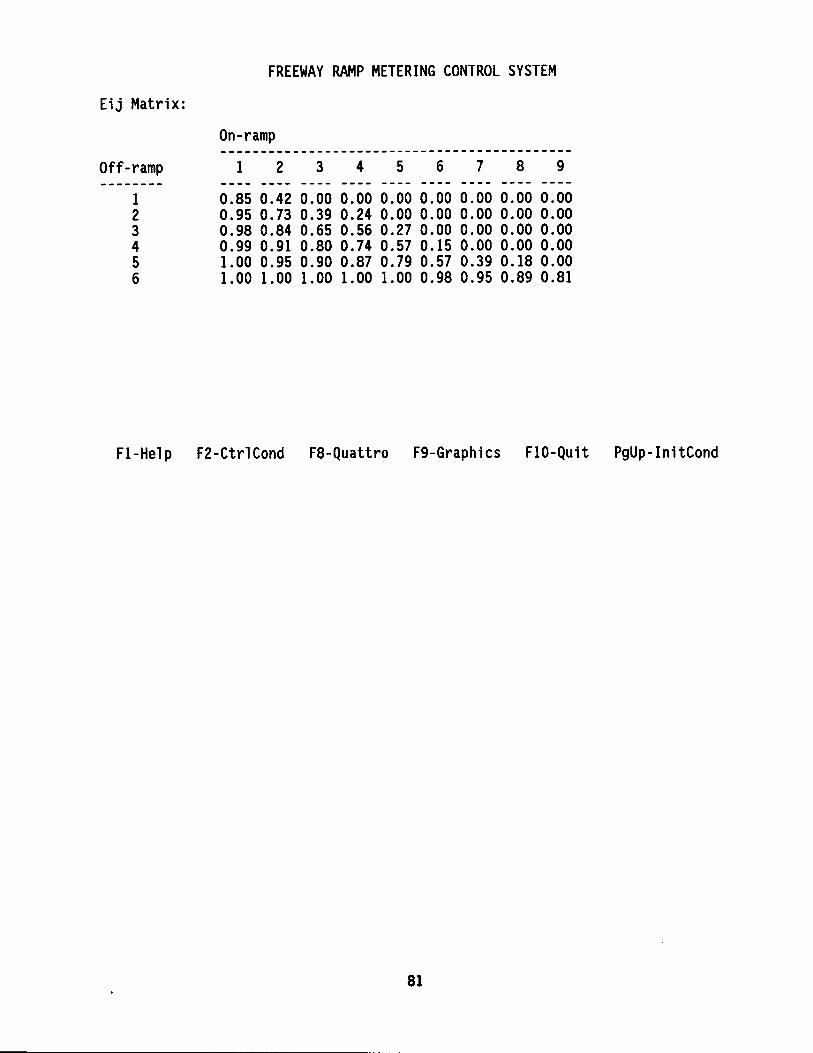
Eij Matrix:
Off-ramp
I 2 3 4 5 6
FREEWAY RAMP METERING CONTROL SYSTEM
On-ramp
I 2 3 4 5 6 7 8 9
0.85 0.42 0.00 0.00 0.00 0.00 0.00 0.00 0.00 0.95 0.73 0.39 0.24 0.00 0.00 0.00 0.00 0.00 0.98 0.84 0.65 0.56 0.27 0.00 0.00 0.00 0.00 0.99 0.91 0.80 0.74 0.57 0.15 0.00 0.00 0.00 1.00 0.95 0.90 0.87 0.79 0.57 0.39 0.18 0.00 1.00 1.00 1.00 1.00 1.00 0.98 0.95 0.89 0.81
Fl-Help F2-Ctr1Cond F8-Quattro F9-Graphics FIO-Quit PgUp-InitCond
81

FREEWAY RAMP METERING CONTROL SYSTEM
Control Condition: Time slice 1 Objective 1: 2219 System Objective: 4S29
Link Ramp Link Ramp Entry Exit Fwy. V/C Entry Fwy. V/C Ramp No. No. Cap. Cap. Demnd Vol. Dmnd Ratio Meter Flow Ratio Queue
1 El 1462 313 12Sl 12Sl 8S% 12Sl 12Sl 8S% 0 2 E2 1462 313 232 1483 101% 12S 1376 94% 107 3 XI 1462 313 3S7 1126 77% 1033 70% 4 E3 1462 313 141 1267 86% 130 1163 79% 11 s E4 1462 313 368 163S 111% 138 1301 88% 230 6 X2 1462 313 226 1409 96% 1100 7S% 7 ES 1462 313 284 1693 11S% 147 1247 8S% 137 8 X3 1462 313 100 IS93 108% 116S 79% 9 E6 1462 313 llS 1708 116% 103 1268 86% 12
10 X4 1462 313 IOS . 1603 109% 1188 81% 11 E7 ISOO 313 ISi 17S4 116% 133 1321 88% 18 12 ES ISOO 313 9S 1849 123% 8S 1406 93% 10 13 XS ISOO 313 63 1786 119% 13S7 90% 14 E9 17SO 313 141 1927 110% 107 1464 83% 34
Fl-Help F2-Init F3-Run F4-Asst F8-Quattro F9-Graph FIO-Quit PgDn-Next PgUp-Prev
82

FREEWAY RAMP METERING CONTROL SYSTEM
Control Condition: Time slice 2 Objective 2: 2310 System Objective: 4S29
Link Ramp Link Ramp Entry Exit Fwy. V/C Entry Fwy. V/C Ramp No. No. Cap. Cap. Demnd Vol. Dmnd Ratio Meter Flow Ratio Queue
1 El 1462 313 128S 128S 873 128S 128S 87% 0 2 E2 1462 313 228 1S13 1033 120 140S 96% 214 3 XI 1462 313 366 1147 783 10S4 72% 4 E3 1462 313 144 1291 883 1S4 1208 82% 0 s E4 1462 313 310 1601 1093 131 1339 91% 408 6 X2 1462 313 204 1397 9S3 11S2 78% 7 ES 1462 313 272 1669 1143 139 1291 88% 269 8 X3 1462 313 138 IS31 1043 1176 803 9 E6 1462 313 12S 16S6 1133 136 1312 893 0
10 X4 1462 313 129 IS27 1043 1208 82% 11 E7 ISOO 313 160 1687 1123 131 1339 893 46 12 ES ISOO 313 102 1789 1193 111 14SO 963 0 13 XS ISOO 313 7S 1714 1143 1389 923 14 E9 17SO 313 123 1837 1043 103 1492 SS% S3
Fl-Help F2-Init F3-Run F4-Asst FS-Quattro F9-Graph FIO-Quit PgDn-Next PgUp-Prev
83


APPENDIX B. VARIABLE TABLES OF DATA FILES
85

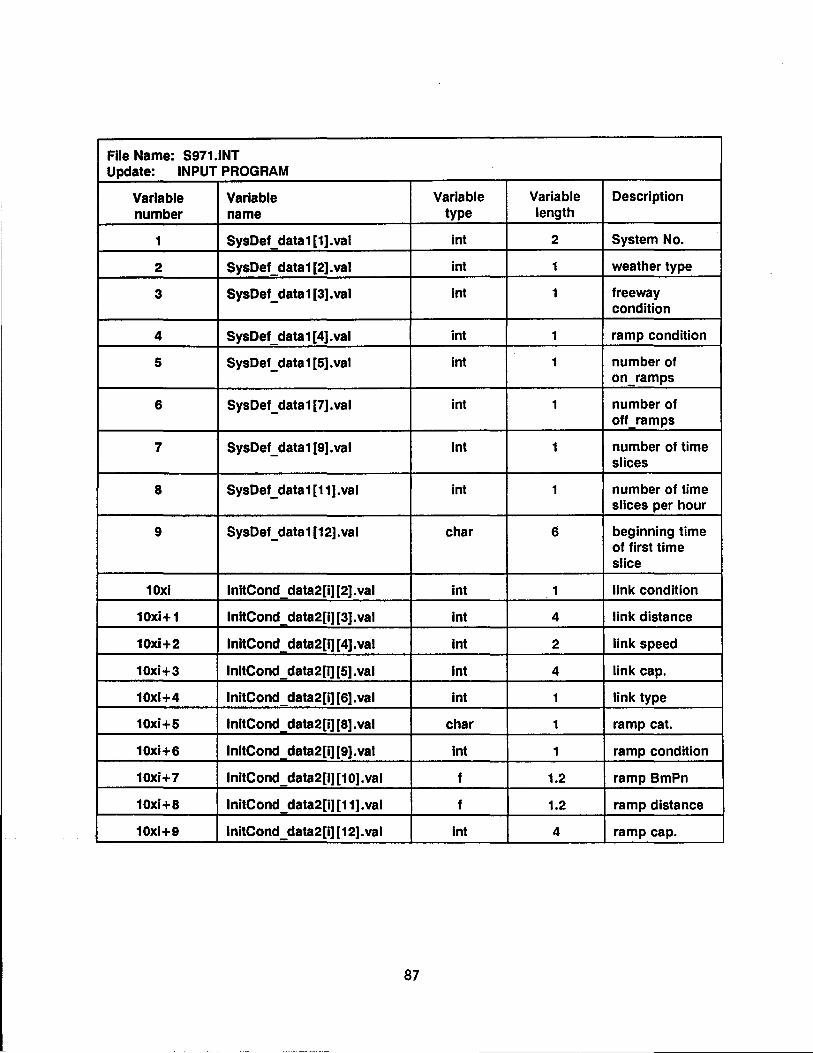
File Name: 8971.INT Update: INPUT PROGRAM
Variable Variable Variable Variable Description number name type length
1 SysDef data1[1].val int 2 System No.
2 SysDef data1 (2].val int 1 weather type
3 SysDef _data 1 [3]. val int 1 freeway condition
4 SysDef data1 (4].val int 1 ramp condition
5 SysDef_ data 1 [5].val int 1 number of on ramps
6 SysDef _data 1 (7]. val int 1 number of off ramps
7 SysDef_ data 1 [9]. val int 1 number of time slices
8 SysDef_ data1 (11].val int 1 number of time slices per hour
9 SysDef_ data1 (12].val char 6 beginning time of first time slice
10xi lnitCond data2[i][2].val int 1 link condition
10xi+1 lnitCond data2[i] (3]. val int 4 link distance
10xi+2 lnitCond _ data2[i] (4].val int 2 link speed
10xi+3 lnitCond data2[i](5].val int 4 link cap.
10xi+4 lnitCond data2[i](6].val int 1 link type
10xi+5 lnitCond data2[i](8].val char 1 ramp cat.
10xi+6 lnitCond data2[i][9].val int 1 ramp condition
10xi+7 lnitCond data2[i](10].val f 1.2 ramp BmPn
10xi+8 lnitCond data2[i](11].val f 1.2 ramp distance
10xi+9 lnitCond data2[i](12].val int 4 ramp cap.
87

10xl+9 ••••• EijMatrx _data [k] UJ f 2.2 Initial values by 10xi+9+kxj column. The
k=1 .. configurations EljMatrx.row factor of the
j=1 •• system EijMatrx.col
CtrlCond data2[1][m][3]. val int 4 link cap. I= 1 •• CtrlCond ti me CtrlCond data2[1][m][4).val int 4 ramp cap.
m=1 •• CtrlCond data2[1][m][5]. val int 4 entry demnd CtrlCond.row n=3,4,5,6 CtrlCond data2[1][m][6]. val int 4 exit vol.
i : integer 1 •• number of links; value (10xi+5) to {10xi+9) exist when lnitCond _ data2[i][6) = 1; n = 5 when lnitCond data2[m] [6]. val.in um= 1; n=6 when lnitCond-data2[m][6].val.inum=O; int : integer; -f : float;
88

File Name: 5971.PRM (INITIAL.DAT) Read by: STUDY971 MAIN PROGRAM Written by: INPUT PROGRAM
Variable number
1
2
3
4
5 .. s+nent+1
+1 •• 1+nent+nexit+1
+ 1 •. 1 +nent
+ 1 •• 1 +nent
t= 1 •. numtime i=1 •• nent+1
t = 1 •• numtime j=1,2
t = 1 •• numtime i= 1 •• nexit+ 1
int: integer; f : float;
Variable name
numtime
sysNum
nent
nexit
capran
ca pf a
bmpn[]
diver a ~
envol[t] [i]
evol[t][j]
exvol [t] (i]
Variable Typical Description type length
int 2 Number of time slices
int 2 System number
int 2 Number of on-ramps
int 2 Number of off-ramps
int 4 The ramp capacity under the 9 different weather conditions
int 4 The freeway capacity of each link under the 9 different weather conditions.
f 1.2 Probability of a vehicle on the merging lane
f 1.2 Diversion factors of on-ramps.
int 4 The first entry is freeway input volume. The rest are the input volumes of each ramp.
int 4 Freeway output volume of each subsystem
int 4 The output volume of each exit ramp. The last one is the freeway output volume.
89

File Name: INITIALMAX Read by: STUDY971 MAIN PROGRAM Written by: INPUT PROGRAM
Variable number
1
2
3
4
5 .• S+nent+nexit+ 1
•. nent + nexit + 1
•• nent+nexit+1
i=1 .• nent+1 j=1 •• nexlt+1
int: integer; f: float;
Variable name
iwthr
numss
row
col
nextxn
lnupn
lxup[]
eij[i] [j]
Variable Typical Description type length
int 2 The type of weather
int 2 Number of subsystems
int 2
int 2
int 2 Next exit downstream from each input
int 2 Last entrance upstream from each link
int 2 Last exit upstream from each link
f 2.2 Initial values by column The configuration factor of the system
90
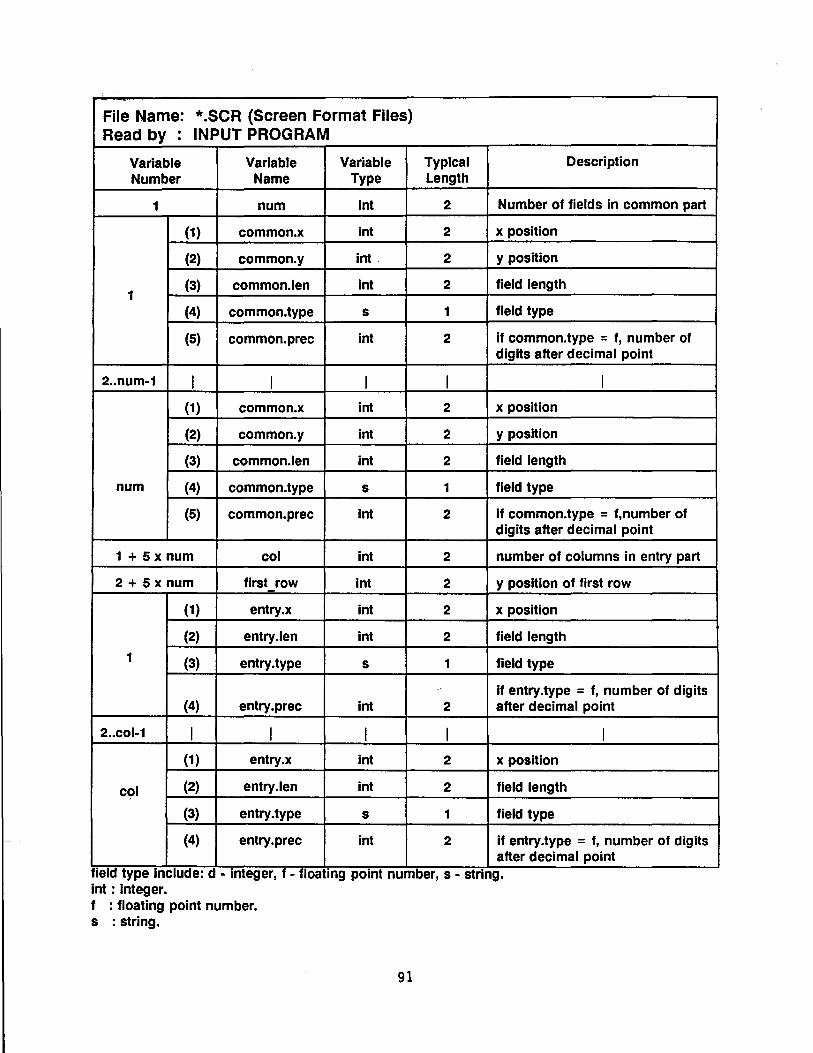
File Name: *.SCR (Screen Format Files) Read by . INPUT PROGRAM .
Variable Variable Variable Typical Description Number Name Type Length
1 num int 2 Number of fields in common part
(1) common.x int 2 x position
(2) common.y int. 2 y position
(3) common.len Int 2 field length 1
(4) common.type s 1 field type
(5) common.prec int 2 if common.type = f, number of digits after decimal point
2 .. num-1 I I I I I (1) common.x int 2 x position
(2) common.y int 2 y position
(3) common.len int 2 field length
num (4) common.type s 1 field type
(5) common.prec int 2 if common.type = f,number of digits after decimal point
1 + 5 x num col int 2 number of columns in entry part
2 + 5 x num first row int 2 y position of first row
(1) entry.x int 2 x position
(2) entry.len int 2 field length
1 (3) entry.type s 1 field type
- If entry.type = f, number of digits (4) entry.prec int 2 after decimal point
2 .. col-1 I I I I I (1) entry.x int 2 x position
col (2) entry.len int 2 field length
(3) entry.type s 1 field type
(4) entry.prec int 2 if entry.type = f, number of digits after decimal point .
field type include: d - integer, f - floating point number, s - string . int : integer. f : floating point number. s : string.
91


APPENDIX C. SPREADSHEET MACRO PROGRAM LIST
93

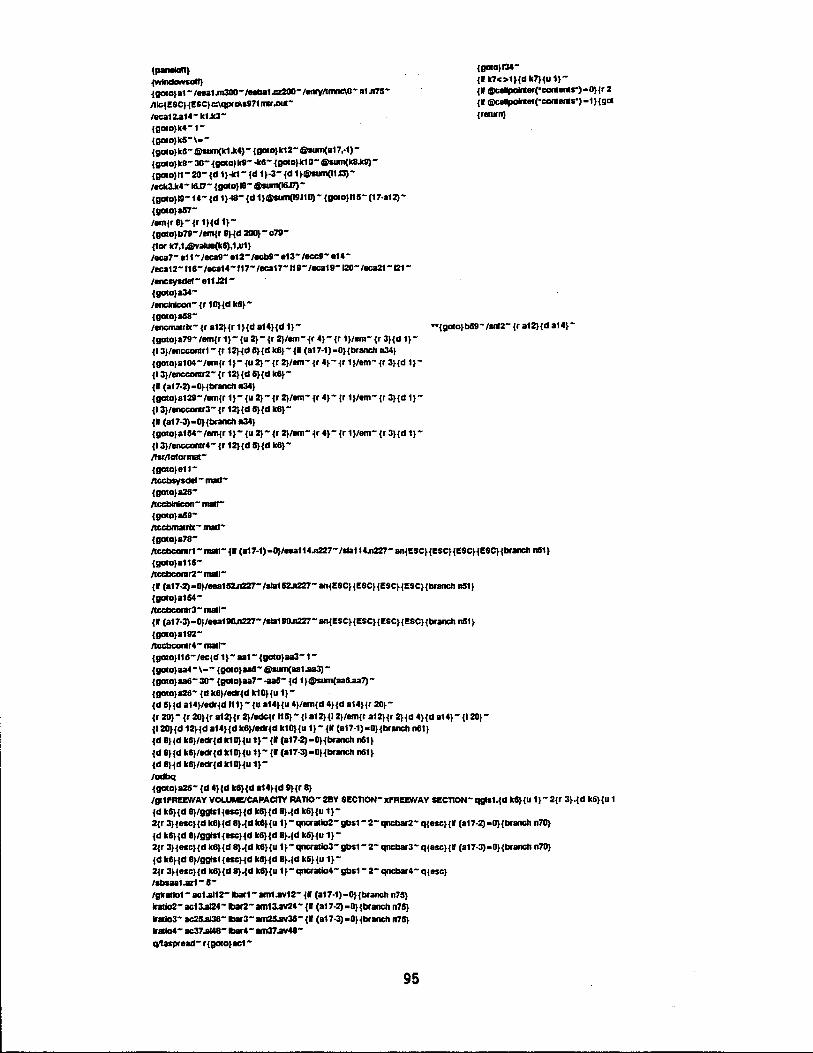
{panalall}
{Windaw•sall} {galo}a1-1aea1.m300-/tltlba1.IZ200- /llfllY/lmnc\O- n1.n7S-
lllcil!SC}{l!SC}c:\qpr0\1971nlr.ld-/eca12.a14- k1.lc3-{g01o}k4-1-{golO}k5-\•-{gOIO}kS-@sum(k1.k4)- {galO}k12-@sum(a17,·1>{gotO}k8- 30-{galO}kS- .U-{galO}k10- @sum(k8.k9){golO}H -20- {d 1}-111-{d 1}-3- {d 1}@sum(l1.13)/eck3.k4-16.17- {galO}IS-@sum(16.17)-{gato}l9-1r {d 1}-18- {d 1}@sum(l9J10)-{gOIO}HS-(17·a12)
{galO}a57-/em{r 8}-{r 1}{d 1}{gato}b7S-/em{r 9}{d 200}- c79-{111f k7,1.@valll8(k6),1,111} /eca7- e11-1eca9- e12-1emr e13-1ecd- e14-1eca12-11s-1eca14-r11-1eca11-nr1eca1r 120-1eca21-121-
/encsysdel- e11.121-{g01o}a34-/encink:On- {r 1 O}{d k6}{galo}a58-
{galOlf34-{I k7<>1}{d k7}{U tl-{I @C:ellpolnler("conletH") •O}{r 2 { 1 @cellp0ider(•con1 ... r) -t }{gac
{rBlurnl
1encma1r0c- {r a12}{r 1Hd a14Hd 1}- ••{goio}b59- /snl2- {r a12Hd a14}-
{goto}a7S- /em{r 11-{u 2}- {r 2}/em-{r 4}- {r 111em- {r 3}{d 11-{l 3}/encconlr1- {r 12}{d 8}{d k&I- {I (a1M)•O}{branch n34} {go!O}a104-/em{r 11- {U 2}-{r 2}/em- {r •1- {r 11/em- {r 3}{d 11-{l 3}/encconlr2- {r 12}{d 8}{d k&l-
{I (a17·2)•0}{branch n341 {goto1a129-/em{r 11- {U 2}-{r 2}/em- {r 41- {r 1}/em- {r 3}{d 11-{l 3}/encconlr3- {r 12}{d 8}{d 116}-
{I (a17·3)•0}{branclt n341 {goto1a154-/em{r 11- {U 2}- {r 2}/em- {r •1- {r 111em-{r 3}{d 11-
{l 31/encc:onlr4- {r 12}{d 8}{d k6}-1Tsr1Tolorma1-{goto}e11-/lccbsySdel- ... -{go!Ola26-/lccblnicon- ... -{goto}a59-/lccbmalr0c- _.-
{gOIO}a7S-/lccbconlr1- ... - {I (a17-1)•0}/eea114.n227- /Sla114.n227- lln{l!'.SC}{l!SC}{l!SC}{ESC}{branch 111511 {gal0}811S-/lcebCOnlr2- ma11-
{I (a17·2)•0}/aeat52.n227- /sla152.n227- an{l!SC}{l!SC}{l!SC}{l!SC}{branclt 11511 {goto}a154-/lccbconlr3-mMI-{I (at 7·3)•01/eea11lO.n227- /sla1 llO.n227- lln{l!SC}{l!SC}{l!SC}{l!SC}{branch 1151 I
{galO}a192-/lccbconlr4- 111811-{goto} f18- /ec{ d 11-aa1-{ga101aa3-1-
{ga101aa4-\·- {galO}aa5-@sum(aa1.aa3){galO}aa6- 30- {ga101aa1- -aa11- {d 1 }@sUm(aa6.aa7)
{gOlo}a28- {d k6}/edr{d k10}{U 11-{d S}{d a14}/edr{d n11-{u at4}{u 41/em{d 4}{d a14}{r 20}-{r 20}- {r 20}{r at2}{r 2}/adc{r n8}- {I a12}{121/em{r at2}{r 2}{d 4}{d a141- {I 20}{l 20}{d 12}{d a14}{d 116}/edr{d ktO}{u 11-{I (at7-1)•0}{branch 11611 {d B}{d k61/edr{d k10}{U 11-{I (at7-2)•0}{branch 11611
{d B}{d k61/edr{d k10}{U ti- {I (a17-3)•0}{branch 116t} {d B}{d k61/edr{d k10}{U 11-
/odbq {ga101a26- {d 4Hd k6}{d at4Hd 9}{r 8} /g11l'Rl!l!WAYVOLUME/CAPACITY RATI0-2f!IY Sl!CTION-xPRl!l!WAY Sl!CTION-qgts1.{d kl}{U t1-2{r 3}.{d k6}{U t {d k6}{d 8}/gglst{HC}{d k6}{d 8}.{d k&}{U 11-2{r 3}{nc}{d k8}{d 8}.{d k8}{u 11- qncrm1o2- gbs1 - 2- qnc1>ar2- q{esc}{I (at 7·2) •0}{branch n70} {d k6}{d 81/ggls1{8SC}{d k8}{d 8}.{d k6}{U 11-2{r 3}{esc}{d k6}{d Bl.{d k8}{u 1}- qncra11o3- g1>s1-2- qncbar3- q{esc}{I (a17·3)•0}{branch n70}
{d k6}{d 81/ggls1{HC}{d k8}{d 8}.{d k6}{U 11-2{r 3}{esc}{d k8}{d 8}.{d k8}{u 11-qncrm1o4-gbs1-2-qnc:barc- q{esc1 111bsaat.az1 - r /gtrm1ot-ac1.a112-lbar1-11111.avt2-{I (a17·1)•0}{branch n78} 1ra11o2-act3.al24-11>ar2-111113.aY24-{I (at7·2)•D}{branc:h n75}
lrmio3-ac:25.al38-.,..3-am25.av38- {I (a17·3)•0Hbranch n78} lrmlo4- ac37.al48- .,...- 811137.av48-
~aspread- r{ga101act-
95


APPENDIX D. SYSTEM INSTALLATION PROCEDURE.
97

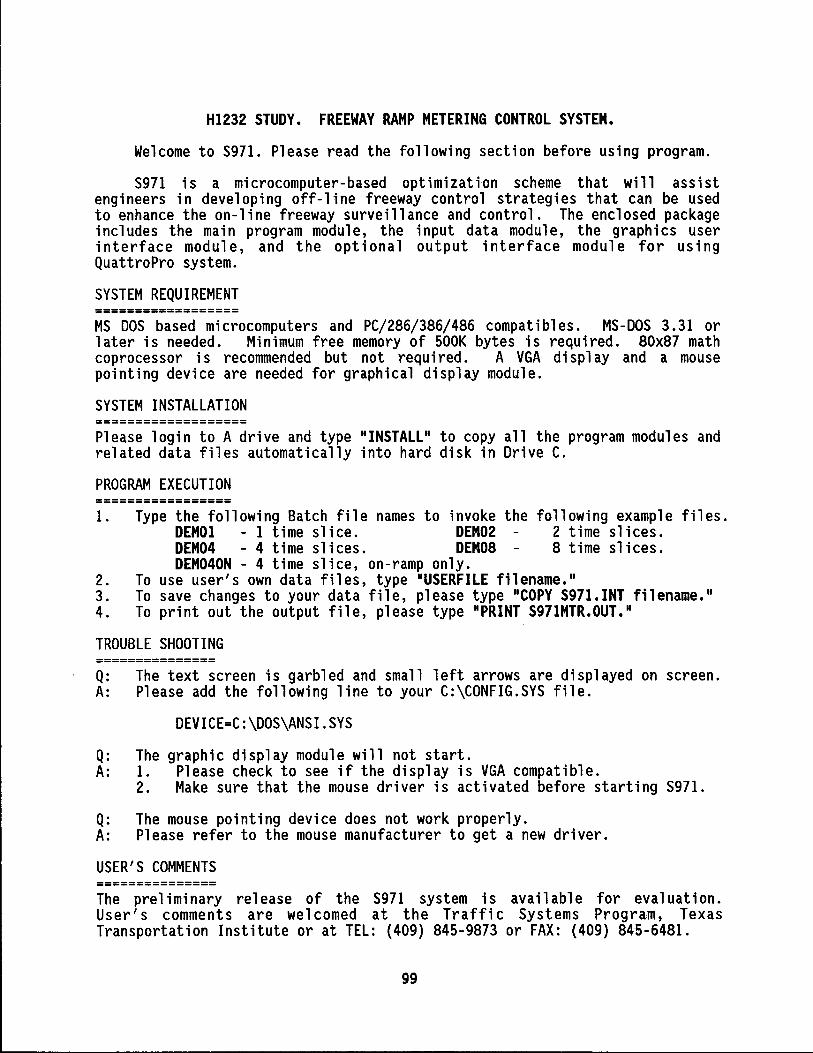
H1232 STUDY. FREEWAY RAMP METERING CONTROL SYSTEM.
Welcome to S971. Please read the following section before using program.
S971 is a microcomputer-based optimization scheme that will assist engineers in developing off-line freeway control strategies that can be used to enhance the on-line freeway surveillance and control. The enclosed package includes the main program module, the input data module, the graphics user interface module, and the optional output interface module for using QuattroPro system.
SYSTEM REQUIREMENT ================== MS DOS based microcomputers and PC/286/386/486 compatibles. MS-DOS 3.31 or later is needed. Minimum free memory of SOOK bytes is required. 80x87 math coprocessor is recommended but not required. A VGA display and a mouse pointing device are needed for graphical display module.
SYSTEM INSTALLATION =================== Please login to A drive and type "INSTALL" to copy all the program modules and related data files automatically into hard disk in Drive C.
PROGRAM EXECUTION ================= 1. Type the following Batch file names to invoke the following example files.
DEMOl - 1 time slice. DEM02 - 2 time slices. DEM04 - 4 time slices. DEMOS - 8 time slices. DEM040N - 4 time slice, on-ramp only.
2. To use user's own data files, type "USERFILE filename." 3. To save changes to your data file, please type "COPY 5971.INT filename." 4. To print out the output file, please type "PRINT S971MTR.OUT."
TROUBLE SHOOTING =============== Q: The text screen is garbled and small left arrows are displayed on screen. A: Please add the following line to your C:\CONFIG.SYS file.
DEVICE=C:\DOS\ANSI.SYS
Q: The graphic display module will not start. A: 1. Please check to see if the display is VGA compatible.
2. Make sure that the mouse driver is activated before starting 5971.
Q: The mouse pointing device does not work properly. _A: Please refer to the mouse manufacturer to get a new driver.
USER'S COMMENTS =============== The preliminary release of the S971 system is available for evaluation. User's comments are welcomed at the Traffic Systems Program, Texas Transportation Institute or at TEL: (409) 845-9873 or FAX: (409) 845-6481.
99
