interim report january – june 2015 - hoist...
TRANSCRIPT

April–June, year-on-year Gross cash collections increased 36 per cent to SEK 834m (615)
Total revenue increased 34 per cent to SEK 537m (401)
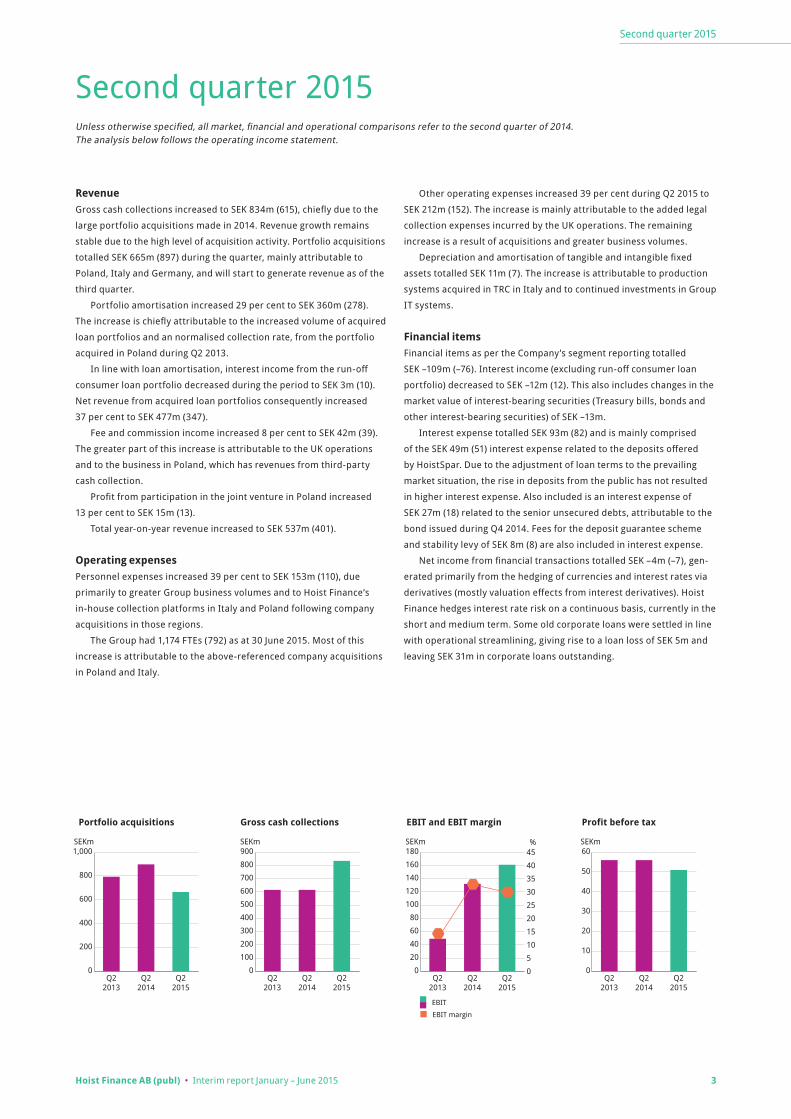
EBIT totalled SEK 161m (132)
The EBIT margin was 30 per cent (33)
Profit before tax totalled SEK 52m (56)
Portfolio acquisitions totalled SEK 665m (897)
Basic earnings per share totalled SEK 0.53 (0.79) Diluted earnings per share totalled SEK 0.51 (0.66)1)
Financial net amounted to an expense of SEK 109m (expense: 76) and was charged with an expense of SEK 4m (expense: 7) related to currency and interest hedges
30 June, year-on-year The carrying value of acquired loans2) increased 22 per cent to SEK 9,040m (7,386)
Gross 120-month ERC (Estimated Remaining Collections) increased 26 per cent to SEK 15,316m (12,182)
The total capital ratio improved to 15.28 per cent (12.74)
The CET1 ratio was 12.58 per cent (9.24)
Subsequent events Hoist Finance acquired an extensive and diversified loan portfolio on 1 July 2015
for a total investment of SEK 1,256m
SEKmQuarter 2
2015Quarter 2
2014Change
%Jan–Jun
2015Jan–Jun
2014Change
%
Gross cash collections 834 615 36 1,625 1,151 41Net revenue from acquired loan portfolios 477 347 37 912 653 40Total revenue 537 401 34 1,036 759 37EBIT* 161 132 22 276 253 9EBIT margin, % 30 33 –3 pp 27 33 –7 pp Profit before tax 52 56 –6 59 106 –44Net profit 44 44 0 48 82 –41Basic earnings per share, SEK1) 0.53 0.79 N/A 0.58 – N/A Diluted earnings per share, SEK1) 0.51 0.66 N/A 0.57 – N/A Acquisition of loan portfolios 665 897 –24 938 1,330 –29
* The Jan-Jun 2015 period includes IPO costs of SEK 46m that have a negative impact on EBIT.
30 Jun 2015
30 Jun 2014
Change%
31 Dec 2014
Carrying value of acquired loans, SEKm2) 9,040 7,386 22 8,921Gross 120-month ERC, SEKm3) 15,316 12,182 26 15,576Return on equity, % 11 16 –5 pp 16Total capital ratio, % 15.28 12.74 3 pp 12.17CET1 ratio, % 12.58 9.24 3 pp 9.35Liquidity ratio, % 59 41 18 pp 50Number of employees (FTEs) 1,174 792 48 1,077
Hoist Finance AB (publ) (the “Company” or the “Parent”) is the parent company of the Hoist Finance group of companies (“Hoist Finance”). The Company’s wholly owned subsidiary, Hoist Kredit AB (publ) (“Hoist Kredit”) is a regulated credit market company. Hence, Hoist Finance produces financial statements in accordance with the guidance and format set forth in the Swedish Annual Accounts Act for Credit Institutions and Securities Companies. In order to assess the operational performance of the debt purchasing and collection operations and to facilitate comparison with our competitors, Hoist Finance supplements its statutory financial statements with an operating income statement. The operating income statement is prepared based on the accounting and valuation principles used in the statutory financial statements, with no amendments or adjustments thereto.
The information in this interim report has been published pursuant to the Swedish Securities Market Act and/or Swedish Financial Instruments Trading Act. This information was submitted for publication on 31 July 2015 at 8.00 A.M. (CET).
Interim report January – June 2015
Gross cash collections
SEK 834m
Acquisition of loan portfolios
SEK 665m
EBIT margin
30%CET1 ratio
12.58%
1) Includes effect of 983,913 outstanding warrants.
2) Including run-off consumer loan portfolio and portfolios held in joint venture.
3) Excluding run-off consumer loan portfolio and portfolios held in joint venture.
Second quarter

Hoist Finance AB (publ) • Interim report January – June 2015 2
Statement by the CEO
Continued stable earnings trend and high market activity
Hoist Finance continued its stable growth with a good earnings trend
during the second quarter of 2015. Gross as well as net revenue from
acquired loan portfolios was the highest ever, as was total revenue.
EBIT was up 22 per cent year-on-year.
The EBIT margin was impacted by the rise in legal collections during
the quarter, particularly in the UK. This has increased costs in the short
term according to plan.
High market activity and the single largest acquisition to dateThe second quarter was primarily distinguished by high market activity
with negotiations and acquisitions in multiple markets, including the
acquisitions of loan portfolios in Poland, Italy and Germany. Major
efforts were also focused on preparing for the significant Compello
acquisition in the UK. All of these portfolios will generate revenue as of
the third quarter.
We are very pleased to have completed its single largest transaction
to date on July 1st with the acquisition of debt management company
Compello Holdings. The acquisition includes a diversified banking port-
folio, comprised of over one million overdue loans from 19 financial
institutions and an established collection platform with 178 employ-
ees. At 30 June 2015 the portfolio had estimated collections (ERC) of
approximately SEK 2,823m over 120 months.
This acquisition is highly consistent with our strategy to develop
and strengthen our position in key markets. It also enables us to
increase our operational capacity and thereby consolidate our market
position among core banking customers in the UK.
The acquisition will not give rise to any acquisition goodwill, as the
entire purchase price is related to the debt portfolios. The total invest-
ment is SEK 1,256 million.
Overall, Hoist Finance has thus far this year acquired portfolios
valued at SEK 2.5 billion, including Compello, which is well in line with
our target for 2015.
A growing marketThe supply of non-performing consumer loans is expected to remain
strong due to the growing need of many European banks to divest loan
portfolios. Although the market remains competitive, we have not seen
any discernible changes in pricing during the year. We have, however,
seen greater pricing harmonisation between countries.
Strategy for continued profitable growthIn line with our successful strategy, we will continue to ensure long-
term profitable growth. Our strategy is based on wide geographical
presence, a focused acquisition model based on well-structured pro-
cesses, and long-term instalment plans founded on fair and amicable
settlements.
As always, we focus on deepening our relationships with partners
in existing markets and following them into new markets, while also
working to strengthen our position as a permanent work-out unit
for the largest international banks. We also actively evaluate various
opportunities to enter new European markets.
Another important component of Hoist Finance’s strategy is to have
well-diversified financing through deposits from the public as well as
the bond market. Hoist Finance’s capital adequacy was considerably
strengthened through the new share issues conducted in 2014 and in
conjunction with the IPO in 2015.
As a credit market company Hoist Finance is well versed in what it
means to operate in a regulated environment with internal governance,
risk management and control, and is thus able to meet its partners’
high standards.
OutlookWith a strong financial position and over 20 years’ experience, and as
leading partner to many international banks, Hoist Finance is well po-
sitioned to capitalise on the growing market. We also see good acqui-
sition opportunities during the remainder of the year. Accordingly, our
assessment is that we will achieve or exceed our indicated acquisition
volumes for 2015 – ie, volumes in line with or higher than recent years.
Jörgen Olsson
CEO
Hoist Finance AB (publ)
Hoist Finance AB (publ) • Interim report January – June 2015 3
Second quarter 2015
Second quarter 2015
RevenueGross cash collections increased to SEK 834m (615), chiefly due to the
large portfolio acquisitions made in 2014. Revenue growth remains
stable due to the high level of acquisition activity. Portfolio acquisitions
totalled SEK 665m (897) during the quarter, mainly attributable to
Poland, Italy and Germany, and will start to generate revenue as of the
third quarter.
Portfolio amortisation increased 29 per cent to SEK 360m (278).
The increase is chiefly attributable to the increased volume of acquired
loan portfolios and an normalised collection rate, from the portfolio
acquired in Poland during Q2 2013.
In line with loan amortisation, interest income from the run-off
consumer loan portfolio decreased during the period to SEK 3m (10).
Net revenue from acquired loan portfolios consequently increased
37 per cent to SEK 477m (347).
Fee and commission income increased 8 per cent to SEK 42m (39).
The greater part of this increase is attributable to the UK operations
and to the business in Poland, which has revenues from third-party
cash collection.
Profit from participation in the joint venture in Poland increased
13 per cent to SEK 15m (13).
Total year-on-year revenue increased to SEK 537m (401).
Operating expensesPersonnel expenses increased 39 per cent to SEK 153m (110), due
primarily to greater Group business volumes and to Hoist Finance’s
in-house collection platforms in Italy and Poland following company
acquisitions in those regions.
The Group had 1,174 FTEs (792) as at 30 June 2015. Most of this
increase is attributable to the above-referenced company acquisitions
in Poland and Italy.
Other operating expenses increased 39 per cent during Q2 2015 to
SEK 212m (152). The increase is mainly attributable to the added legal
collection expenses incurred by the UK operations. The remaining
increase is a result of acquisitions and greater business volumes.
Depreciation and amortisation of tangible and intangible fixed
assets totalled SEK 11m (7). The increase is attributable to production
systems acquired in TRC in Italy and to continued investments in Group
IT systems.
Financial itemsFinancial items as per the Company’s segment reporting totalled
SEK –109m (–76). Interest income (excluding run-off consumer loan
portfolio) decreased to SEK –12m (12). This also includes changes in the
market value of interest-bearing securities (Treasury bills, bonds and
other interest-bearing securities) of SEK –13m.
Interest expense totalled SEK 93m (82) and is mainly comprised
of the SEK 49m (51) interest expense related to the deposits offered
by HoistSpar. Due to the adjustment of loan terms to the prevailing
market situation, the rise in deposits from the public has not resulted
in higher interest expense. Also included is an interest expense of
SEK 27m (18) related to the senior unsecured debts, attributable to the
bond issued during Q4 2014. Fees for the deposit guarantee scheme
and stability levy of SEK 8m (8) are also included in interest expense.
Net income from financial transactions totalled SEK –4m (–7), gen-
erated primarily from the hedging of currencies and interest rates via
derivatives (mostly valuation effects from interest derivatives). Hoist
Finance hedges interest rate risk on a continuous basis, currently in the
short and medium term. Some old corporate loans were settled in line
with operational streamlining, giving rise to a loan loss of SEK 5m and
leaving SEK 31m in corporate loans outstanding.
Unless otherwise specified, all market, financial and operational comparisons refer to the second quarter of 2014.The analysis below follows the operating income statement.
0
20
40
60
80
100
120
140
160
180
Q22015
Q22014
Q22013
Gross cash collections
SEKm SEKm SEKm
EBIT and EBIT marginPortfolio acquisitions
SEKm
Profit before tax
0
200
400
600
800
1 000
Kv22015
Kv22014
Kv22013
0
100
200
300
400
500
600
700
800
900
Kv22015
Kv22014
Kv22013
0
20
40
60
80
100
120
140
160
180
Kv22015
Kv22014
Kv22013
0
5
10
15
20
25
30
35
40
45
0
10
20
30
40
50
60
Kv22015
Kv22014
Kv22013
0
200
400
600
800
1,000
Q22015
Q22014
Q22013
0
100
200
300
400
500
600
700
800
900
Q22015
Q22014
Q22013
0
10
20
30
40
50
60
Q22015
Q22014
Q22013
Portföljförvärv
MSEK MSEK MSEK % MSEK
EBIT och EBIT-marginalInkasserade belopp på förvärvade fordringsportföljer Resultat före skatt
EBIT
0
5
10
15
20
25
30
35
40
45%
EBIT margin
EBIT
EBIT-marginal

Hoist Finance AB (publ) • Interim report January – June 2015 4
Second quarter 2015
Cash flow
SEKmQuarter 2
2015Quarter 2
2014Jan–Jun
2015Jan–Jun
2014
Cash flow from operating activities 284 –1,009 1 428 –1,793Cash flow from investing activities –661 –360 –1 447 –162Cash flow from financing activities –11 300 739 374Cash flow for the period –387 –1,069 720 –1,581
Cash flow from operating activities improved to SEK 284m (–1,009)
due to higher deposit volumes in HoistSpar and improved cash flow
of payments from acquired loan portfolios. HoistSpar is a competitive
product on the deposit market and Hoist Finance sees stable growth in
increased volumes as well as new customers. The SEK 412m increase in
deposit volumes during the second quarter was entirely attributable
to deposits on fixed terms of 12, 24 and 36 months. The cash flow of
payments from acquired loan portfolios increased to SEK 834m (615)
and portfolio acquisitions totalled SEK 604m (1,093).
Cash flow from investing activities, including translation differences,
totals SEK –661m (–360). The change is due to increased investments
in bonds and other securities as a result of improved cash flow from
operating activities.
Cash flow from financing activities totals SEK –11m (300) and is
comprised of a warrant buy-back and interest paid on convertible debt
instruments.
Total cash flow for the quarter totals SEK –387m (–1,069).
Balance SheetTotal assets increased 50 per cent to SEK 17,403m (11,615). The increase
is primarily attributable to an SEK 1,868m (128%) increase in bonds
and other securities, an SEK 1,724m (25%) increase in loan portfolio
carrying value, and an SEK 465m (37%) increase in Treasury bills and
Treasury bonds.
Total liabilities amount to SEK 15,255m (10,410). The increase is
mainly due to an SEK 3,855m (43%) increase in deposit volumes and an
additional bond issue of SEK 718m (97%).
Funding and capital structure
SEKm30 Jun
201530 Jun
2014Change
%31 Dec
2014
Deposits from the public 12,768 8,913 43 10,987Subordinated liabilities 335 331 1 333Senior unsecured debt 1,459 740 97 1,493
Total interest-bearing liabilities 14,562 9,984 46 12,813
Other liabilities 693 426 61 852Shareholders' equity 2,148 1,205 79 1,397Total liabilities and shareholders' equity 17,403 11,615 50 15,062
Cash and interest- bearing securities 7,654 3,803 101 5,560Other assets 9,749 7,812 25 9,501Total assets 17,403 11,615 50 15,062
Liquidity ratio, % 59 41 18 pp 50
CET1 ratio, % 12.58 9.24 3 pp 9.35Total capital ratio, % 15.28 12.74 2 pp 12.17
Acquired loansPortfolio acquisitions 938 1,330 –29 3,227Carrying value of acquired loans1 9,040 7,386 22 8,921Gross 120-month ERC2) 15,316 12,186 26 15,576
1) Including run-off consumer loan portfolio and portfolios held in joint venture.2) Excluding run-off consumer loan portfolio and portfolios held in joint venture.
Hoist Finance funds its operations through deposits from the public
and through the bond market. Deposits from the public total SEK
12,768m (8,913). Of this amount, SEK 5,334m is attributable to fixed
term deposits of 12-, 24- and 36-month durations. In line with its
funding structure diversification strategy, Hoist Finance issued a bond
denominated in EUR in 2014. As at 30 June 2015, outstanding bond
debt totalled SEK 1,459m.
Group equity totals SEK 2,148m (1,205). The capital base was
strengthened substantially through the new share issues in 2014 and
the new share issue in connection with the listing.
The total capital ratio improved to 15.28 (12.74) per cent and the
CET1 (Common Equity Tier 1) ratio to 12.58 (9.24) per cent. The Com-
pany is thus well capitalised for further expansion in the acquisition of
non-performing consumer loans.
Cash and interest-bearing securities total SEK 7,654m (3,809). The
liquidity ratio is 59 (41) per cent of deposits from the public.
Basic earnings per share total SEK 0.53 (0.79). Interest on the subor-
dinated liabilities is included in the calculation.

Hoist Finance AB (publ) • Interim report January – June 2015 5
Second quarter 2015
Risk developmentHoist Finance had a year-on-year volume increase in loan portfolios of
approximately SEK 1,724m at the close of Q2 2015, attributable mainly
to portfolio acquisitions in Poland, Italy and Germany.
Loan portfolio credit risk is deemed to have increased during Q2
2015 proportionally with the volume of acquired loans. Portfolio credit
quality is still deemed good.
Operational risks increased (although at a lower rate than growth)
as a result of acquisitions and greater business volumes. The main
reasons for the increase are deemed to stem from increased risks (in
the form of systems integrations and differences in corporate cultures)
associated with the integration of acquired companies, and legal and
tax risks associated with the Group operating in several European
countries. Hoist Finance has limited these risks through increased fo-
cus on the quality of internal processes and will continue working this
year on quality improvements in various areas.
Hoist Finance’s capital position in terms of the CET1 and total cap-
ital ratios increased significantly year-on-year, due in part to business
growth during Q2 2015. Also, due to the reallocation of liquid assets re-
sulting from the Compello Holdings Ltd acquisition, the Company holds
capital as of the close of June to cover around half of its acquisition
volume. The capital ratio improved significantly year-on-year, mainly
due to new share issues conducted in 2014 and at listing in March 2015
and the fact that the company decided to reinvest the profits generated
by the business.
The liquidity ratio increased from 41 per cent to 59 per cent year-
on-year, due primarily to the issuance of a EUR bond, higher deposit
volumes, and the new share issue conducted in connection with listing
during the spring of 2015.
Other informationEmployeesThe Group had 1,174 (792) FTEs during Q2 2015. The year-on-year
increase of 382 FTEs is mainly attributable to the acquisitions in Poland
(182) and Italy (146).
Parent CompanyThe Parent Company reported a small pre-tax loss of SEK –2m (–2).
The share and shareholdersHoist Finance was listed on the NASDAQ Stockholm Mid Cap List on 25
March 2015. The price per share was set at SEK 58, corresponding to a
market capitalisation of SEK 4,555m. As at 30 June 2015 the share price
closed at SEK 62.50.
Ownership structure
Name Capital and votes, %
Swedbank Robur fonder AB 9.1Toscafund Asset Management LLP 9.1Carve Capital AB 9.0Olympus Investment S,àr,l, 7.5Beagle Investments S,A, 7.0Deciso AB 6.1Thoupos Costas 4.2Norges Bank Investment Management 4.1Zenit funds 3.8SHB funds 3.1Carnegie funds 2.5The Confederation of Swedish Enterprise 1.9Echiquier funds 1.9Per Josefsson Invest AB 1.7Skandia Liv 1.3Other shareholders 27.7Total 100.0
Source: SIS Ownership Service, 30 June 2015
Subsequent eventsAfter the close of the period Hoist Finance acquired an extensive and
diversified loan portfolio in the UK through the shares in Compello
Holdings Limited. The acquisition includes a diversified portfolio of
claims on banks, comprised of over one million overdue loans from 19
financial institutions and an established call centre with 178 employees.
At 30 June 2015 the portfolio has estimated collections of approxi-
mately SEK 2,823m over 120 months (ERC). The total investment is SEK
1,256m. Following the acquisition the CET1 capital adequacy ratio for
the second quarter changed from 12.58 to 11.67 pro forma.
ReviewThis interim report has not been reviewed by the Company’s auditor.

Hoist Finance AB (publ) • Interim report January – June 2015 6
Quarterly overview
Quarterly overview
Segment reporting
SEK thousandQuarter 2
2015Quarter 1
2015Quarter 4
2014Quarter 3
2014Quarter 2
2014
Gross cash collections 834,098 790,735 750,218 640,091 615,479Portfolio amortisation and revaluation –360,477 –358,925 –339,425 –284,861 –278,348Interest income from run-off consumer loan portfolio 2,994 3,118 5,641 11,907 9,566
Net revenue from acquired loan portfolios 476,615 434,928 416,434 367,137 346,697Fee and commission income 41,747 47,616 39,467 36,881 39,111Earnings from participations in joint ventures 14,946 15,350 17,918 15,671 13,203Other income 3,439 1,546 5,904 2,226 2,205
Total revenue 536,747 499,440 479,723 421,915 401,216 Personnel expenses –153,016 –145,666 –132,299 –122,225 –110,255Other operating expenses –211,764 –227,741 –188,040 –166,043 –151,843Depreciation and amortisation of tangible and intangible assets –10,859 –10,753 –9,623 –6,880 –7,267
Total operating expenses –375,639 –384,160 –329,962 –295,148 –269,365 EBIT 161,108 115,280 149,761 126,767 131,851 Interest income excl. run-off consumer loan portfolio –12,111 4,745 7,525 21,462 12,284Interest expense –92,876 –92,621 –93,437 –85,498 –81,653Net income from financial transactions –3,779 –20,259 –16,321 2,507 –6,518
Total financial items –108,766 –108,135 –102,233 –61,529 –75,887 Profit before tax 52,342 7,145 47,528 65,238 55,964
Key ratios, segment reporting
SEKmQuarter 2
2015Quarter 1
2015Quarter 4
2014Quarter 3
2014Quarter 2
2014
EBIT margin, % 30 23 31 30 33Portfolio acquisitions 665 273 1 544 353 897Carrying value of acquired loans 9,040 8,827 8,921 7,504 7,386CET1 ratio, % 12.58 14.33 9.35 8.99 9.24Gross 120-month ERC1) 15,316 15,238 15,576 12,657 12,182
1) Excluding run-off consumer loan portfolio and portfolios held in joint venture.
Hoist Finance AB (publ) • Interim report January – June 2015 7
Segment overview
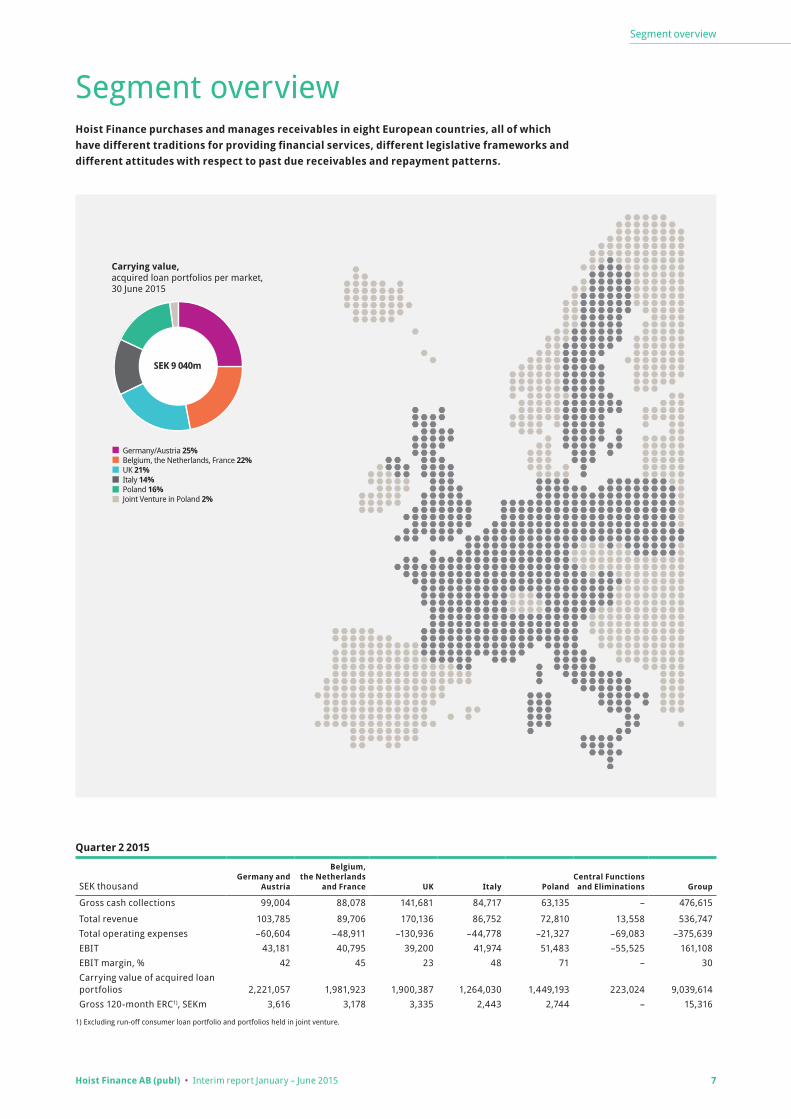
Segment overviewHoist Finance purchases and manages receivables in eight European countries, all of which have different traditions for providing financial services, different legislative frameworks and different attitudes with respect to past due receivables and repayment patterns.
Quarter 2 2015
SEK thousandGermany and
Austria
Belgium, the Netherlands
and France UK Italy PolandCentral Functions and Eliminations Group
Gross cash collections 99,004 88,078 141,681 84,717 63,135 – 476,615
Total revenue 103,785 89,706 170,136 86,752 72,810 13,558 536,747Total operating expenses –60,604 –48,911 –130,936 –44,778 –21,327 –69,083 –375,639EBIT 43,181 40,795 39,200 41,974 51,483 –55,525 161,108EBIT margin, % 42 45 23 48 71 – 30Carrying value of acquired loan portfolios 2,221,057 1,981,923 1,900,387 1,264,030 1,449,193 223,024 9,039,614Gross 120-month ERC1), SEKm 3,616 3,178 3,335 2,443 2,744 – 15,316
1) Excluding run-off consumer loan portfolio and portfolios held in joint venture.
Carrying value, acquired loan portfolios per market, 30 June 2015
Germany/Austria 25%Belgium, the Netherlands, France 22%UK 21%
Poland 16%Joint Venture in Poland 2%
Italy 14%
SEK 9 040m

Hoist Finance AB (publ) • Interim report January – June 2015 8
Segment overview
Germany and Austria
SEK thousandQuarter 2
2015Quarter 2
2014Change
%Jan–Jun
2015Jan–Jun
2014Change
%Full year
2014
Gross cash collections 210,312 155,454 35 461,906 309,572 49 724,044Portfolio amortisation and revaluation –114,302 –84,250 36 –264,923 –154,423 72 –348,873Interest income from run-off consumer loan portfolio 2,994 9,566 –69 6,112 20,633 –70 38,180
Net revenue from acquired loan portfolios 99,004 80,770 23 203,095 175,782 16 413,351Fee and commission income 1,416 4,469 –68 4,095 9,061 –55 17,889Other income 3,365 2,979 13 4,527 4,143 9 14,294
Total revenue 103,785 88,218 18 211,717 188,986 12 445,534
Personnel expenses –35,781 –32,687 9 –71,676 –64,492 11 –133,245Other operating expenses –23,954 –20,040 20 –46,151 –35,357 31 –85,272Depreciation and amortisation of tangible and intangible assets –869 –708 23 –1,744 –1,416 23 –2,940
Total operating expenses –60,604 –53,435 13 –119,571 –101,265 18 –221,457
EBIT 43,181 34,783 24 92,146 87,721 5 224,077
EBIT margin, % 42 39 3 pe 44 46 –2 pe 50Expenses/Gross cash collections, % 26 28 –2 pe 24 27 –3 pe 25Carrying value of acquired loan portfolios1) 2,221,057 2,010,265 10 N/A N/A – 2,350,392Gross 120-month ERC, SEKm2) 3,616 3,235 12 N/A N/A – 3,817
1) Including run-off consumer loan portfolio. 2) Excluding run-off consumer loan portfolio.
Operating incomeGross cash collections increased 35 per cent during the second quarter
to SEK 210m (155). This increase is largely attributable to two large
acquisitions. Portfolio amortisation totalled SEK 114m (84) during the
quarter, with the increase due to a higher collection rate. Revenues
from the run-off consumer loan portfolio decreased to SEK 3m (10)
in pace with gradual amortisation of the portfolio. Fee and commis-
sion income was lower year-on-year, due primarily to Hoist Finance’s
acquisition of a significant portfolio it had previously serviced for a
third party.
Operating expensesSecond quarter operating expenses increased to SEK 61m (53). Most
of the increase is attributable to collection expenses, including fees
payable to partners and initiation of legal proceedings. Some internal
functions located in Germany were reclassified as Group functions
during Q2 2015 and, as a result, costs associated with these functions
are now included in the Central Functions operating segment. The
carrying costs for the current and previous years have been reclassi-
fied accordingly.
EBITThe segment’s EBIT totalled SEK 43m (35) for the quarter with a cor-
responding EBIT margin of 42 per cent (39). The profitability improve-
ment is attributable to increased collections, with operating expenses
increasing to a lesser extent.
AcquisitionsSecond quarter acquisition activity was higher year-on-year. The carry-
ing value of acquired loan portfolios was SEK 2,221m (2,010) at 30 June
2015. Gross ERC for the same period totalled SEK 3,616m (3,235).
OtherAlthough Austria currently represents a small portion of the segment,
Hoist Finance continues to consider it an attractive market. Due to the
acquisitions made during the second half of 2014, revenue contribution
was higher than last year despite the fact that no acquisitions were
made during the second quarter.
The earnings trend for each operating segment, excluding Central Functions and Eliminations, is set forth below.

Hoist Finance AB (publ) • Interim report January – June 2015 9
Segment overview
Belgium, the Netherlands and France
SEK thousandQuarter 2
2015Quarter 2
2014Change
%Jan–Jun
2015Jan–Jun
2014Change
%Full year
2014
Gross cash collections 234,349 192,280 22 412,037 350,168 18 733,474Portfolio amortisation and revaluation –146,271 –115,263 27 –251,499 –220,230 14 –484,991
Net revenue from acquired loan portfolios 88,078 77,017 14 160,538 129,938 24 248,483Fee and commission income 1,636 1,755 –7 3,451 3,373 2 6,989Other income –8 0 N/A –8 0 N/A 218
Total revenue 89,706 78,772 14 163,981 133,311 23 255,690
Personnel expenses –21,389 –21,530 –1 –45,831 –40,382 13 –86,886Other operating expenses –27,011 –23,264 16 –50,931 –44,158 15 –102,656Depreciation and amortisation of tangible and intangible assets –511 –998 –49 –1,320 –1,866 –29 –4,679
Total operating expenses –48,911 –45,792 7 –98,082 –86,406 14 –194,221
EBIT 40,795 32,980 24 65,899 46,905 40 61,469
EBIT margin, % 45 42 3 pe 40 35 5 pe 24Expenses/Gross cash collections, % 20 23 –3 pe 23 24 –1 pe 251)
Carrying value of acquired loan portfolios 1,981,923 2,084,060 –5 N/A N/A – 2,194,000
Gross 120-month ERC, SEKm 3,178 3,423 –7 N/A N/A – 3,512
1) Excluding non-recurring expenses.
Operating incomeSecond quarter gross cash collections increased 22 per cent to SEK
234m (192) and portfolio amortisation increased to SEK 146m (115).
Belgium is responsible for a large part of the increase in both gross
cash collections and portfolio amortisation, with unusually large VAT
recoveries contributing to high collection levels. The Netherlands also
had good second quarter revenues, buoyed somewhat by seasonal
fluctuations. Fee and commission income originated from third-party
services offered via the French operations.
Operating expensesOperating expenses for the second quarter total SEK 49m (46). The
increase is primarily attributable to the Netherlands, which saw an
increase in both the number of employees and the collection activity
level. Restructuring efforts have continued in France, and support
functions were migrated from the Guyancourt office to the Lille office
established by Hoist Finance in 2014. As of the close of Q2 Hoist
Finance has no employees in Guyancourt and has closed its office
there, which is seen in the lower personnel expenses in France.
EBITThe segment’s EBIT totalled SEK 41m (33) for the quarter with a corre-
sponding EBIT margin of 45 per cent (42).
AcquisitionsThe segment’s acquisitions during Q2 2015 were conducted predomi-
nantly in the Netherlands, with only an insignificant portion conducted
in France and Belgium. Overall, the segment’s acquired volumes are
lower year-on-year. This does not apply to the French market, however,
where acquired volumes (including acquisitions concluded during early
Q3) already exceed full-year 2014. The carrying value of acquired loan
portfolios totalled SEK 1,982m (2,084) at 30 June 2015. Gross ERC for
the same period decreased to SEK 3,178M (3,423).

Hoist Finance AB (publ) • Interim report January – June 2015 10
Segment overview
Great Britain
SEK thousandQuarter 2
2015Quarter 2
2014Change
%Jan–Jun
2015Jan–Jun
2014Change
%Full year
2014
Gross cash collections 162,516 125,220 30 314,144 257,898 22 527,346Portfolio amortisation and revaluation –20,835 –52,380 –60 –59,253 –106,867 –45 –200,802
Net revenue from acquired loan portfolios 141,681 72,840 95 254,891 151,031 69 326,544Fee and commission income 27,379 32,887 –17 60,548 64,440 –6 128,344Other income 1,076 141 663 1,082 558 94 2,686
Total revenue 170,136 105,868 61 316,521 216,029 47 457,574
Personnel expenses –41,383 –30,490 36 –78,649 –63,392 24 –134,502Other operating expenses –88,682 –33,288 166 –150,911 –71,244 112 –137,601Depreciation and amortisation of tangible and intangible assets –871 –1,750 –50 –1,726 –3,081 –44 –4,588
Total operating expenses –130,936 –65,528 100 –231,286 –137,717 68 –276,691
EBIT 39,200 40,340 –3 85,235 78,312 9 180,883
EBIT margin, % 23 38 –15 pe 27 36 –9 pe 40Expenses/Gross cash collections, % 63 26 37 pe 54 28 26 pe 281)
Carrying value of acquired loan portfolios 1,900,387 1,438,361 32 N/A N/A – 1,797,520Gross 120-month ERC, SEKm 3,335 2,496 34 N/A N/A – 3,391
1) ) Excluding non-recurring expenses.
Operating incomeGross cash collections during the second quarter totalled SEK 163m
(125). The change is chiefly attributable to loan portfolios acquired dur-
ing the second half of 2014 and to a favourable currency trend. Port-
folio amortisation totalled SEK 21m (52). Due to an initially high cost
burden for a large portfolio acquired during Q4 2014, the amortisation
rate remained relatively low during the quarter. The portfolio also has
an impact on Other operating expenses. Fee and commission income,
derived from services offered to third parties, has declined as the UK
operations have been adapted to Hoist Finance’s strategy focused on
loan portfolio acquisitions.
Operating expensesOperating expenses increased 100 per cent on a quarterly basis to
SEK 131m (66). Increased personnel expenses are a consequence of
Hoist Finance adjusting its workforce to acquired business volumes.
The increase in Other operating expenses is mostly attributable to a
rise in legal collection expenses and the negative (from a cost perspec-
tive) currency trend.
EBITThe segment’s EBIT totalled SEK 39m (40) for the quarter with a corre-
sponding EBIT margin of 23 per cent (38).
AcquisitionsExtensive work was carried out during the second quarter in prepara-
tion for the acquisition of Compello Holdings, completed during the
first days of Q3. The year-on-year acquisition level was lower but, in
terms of future collections, the strong start to Q3 will more than com-
pensate for this. The carrying value of acquired loan portfolios totalled
SEK 1,900m (1,438) at 30 June 2015. Gross ERC for the same period
increased to SEK 3,335m (2,496).
OtherThe acquired debt purchase company, Compello Holdings Limited,
adds a diversified portfolio of claims on banks, comprised of over one
million overdue loans from 19 financial institutions and an established
call centre with 178 employees. At 30 June 2015 the portfolio has esti-
mated collections (ERC) of approximately SEK 2,823m over 120 months.

Hoist Finance AB (publ) • Interim report January – June 2015 11
Segment overview
Italy
SEK thousandQuarter 2
2015Quarter 2
2014Change
%Jan–Jun
2015Jan–Jun
2014Change
%Full year
2014
Gross cash collections 127,465 60,769 110 250,952 110,920 126 260,828Portfolio amortisation and revaluation –42,748 –22,522 90 –87,726 –46,438 89 –91,324
Net revenue from acquired loan portfolios 84,717 38,247 121 163,226 64,482 153 169,504Fee and commission income 1,705 – N/A 2,912 – N/A 0Other income 330 – N/A 675 – N/A 311
Total revenue 86,752 38,247 127 166,813 64,482 159 169,815
Personnel expenses –14,642 – N/A –27,339 – N/A –17,854Other operating expenses –28,526 –14,249 100 –54,061 –23,468 130 –86,028Depreciation and amortisation of tangible and intangible assets –1,610 – N/A –3,184 – N/A –2,340
Total operating expenses –44,778 –14,249 214 –84,584 –23,468 260 –106,222
EBIT 41,974 23,998 75 82,229 41,014 100 63,593
EBIT margin, % 48 63 –15 pe 49 64 –15 pe 37Expenses/Gross cash collections, % 34 23 11 pe 32 21 11 pe 41Carrying value of acquired loan portfolios 1,264,030 518,847 144 N/A N/A – 1,181,210Gross 120-month ERC, SEKm 2,443 839 191 N/A N/A – 2,407
Operating incomeGross cash collections in the second quarter increased 110 per cent to
SEK 127m (61). The increase is attributable to the acquisition from TRC
in April 2014 and the large acquisition made in December 2014. Port-
folio amortisation during Q2 totalled SEK 43m (23), with the increase
chiefly due to the above-named December 2014 acquisition. Fees and
commission income and Other income, totalling SEK 2m, relate to
services rendered by the business integrated during Q3 2014.
Operating expensesThe substantial change in operating expenses, which increased 214 per
cent to SEK 45m (14), reflects the fact that Hoist Finance now operates
its own collection platform in Italy, with 146 employees. Integration
of the business and associated IT systems acquired in 2014 resulted in
Hoist Finance’s depreciation of tangible and intangible assets in Italy.
Additionally, Hoist Finance is now implementing extensive collection
activities, both in-house and via external partners, for the substantial
loan portfolios acquired in 2014.
EBITThe segment’s EBIT totalled SEK 42m (24) for the quarter with a corre-
sponding EBIT margin of 48 per cent (63).
AcquisitionsYear-on-year acquisition activity was somewhat lower during the quar-
ter. The carrying value of acquired loan portfolios totalled SEK 1,264m
(519) at 30 June 2015. Gross ERC for the same period increased to SEK
2,443m (839).

Hoist Finance AB (publ) • Interim report January – June 2015 12
Segment overview
Poland
SEK thousandQuarter 2
2015Quarter 2
2014Change
%Jan–Jun
2015Jan–Jun
2014Change
%Full year
2014
Gross cash collections 99,456 81,756 22 185,794 122,444 52 295,619Portfolio amortisation and revaluation –36,321 –3,933 823 –56,001 9,224 N/A –17,030
Net revenue from acquired loan portfolios 63,135 77,823 –19 129,793 131,668 –1 278,589Fee and commission income 9,611 – N/A 18,357 – N/A –Other income 64 – N/A 97 0 N/A 0
Total revenue 72,810 77,823 –6 148,247 131,668 13 278,589
Personnel expenses –5,208 –475 996 –10,404 –878 N/A –2,035Other operating expenses –15,155 –16,750 –10 –29,570 –28,139 5 –74,812Depreciation and amortisation of tangible and intangible assets –964 –27 N/A –1,745 –27 N/A 0
Total operating expenses –21,327 –17,252 24 –41,719 –29,044 44 –76,847
EBIT 51,483 60,571 –15 106,528 102,624 4 201,742
EBIT margin, % 71 78 –7 pe 72 78 –6 pe 72Expenses/Gross cash collections, % 12 21 –9 pe 13 24 –11 pe 26Carrying value of acquired loan portfolios 1,449,193 1,114,723 30 N/A N/A – 1,182,459Gross 120-month ERC, SEKm 2,744 2,189 25 N/A N/A – –2,449
Operating incomeSecond quarter gross cash collections increased 22 per cent to SEK 99m
(82). The rate of increase in portfolio amortisation (considerably higher
than the increase in gross cash collections) is chiefly attributable to a
large portfolio acquired during Q2 2013. The amortisation rate has nor-
malised with the increase in this portfolio’s cash flow. The increase in
fee and commission income is due entirely to services offered to third
parties by Navi Lex, acquired by Hoist Finance during Q4 2014.
Operating expensesFor the past year Hoist Finance has managed the Polish operations in
accordance with a business model that involves many more in-house
activities. In contrast to Q2 2014 when the workforce was comprised of
a small Warsaw sales office, Hoist Finance employed 186 FTEs in Poland
as at 30 June 2015. Because there were 152 FTEs at the beginning of the
quarter, personnel expenses for the quarter do not fully correspond to
the cost of 186 FTEs.
Employees in Poland also perform services for third parties, al-
though the emphasis has shifted as the management of Hoist Finance’s
portfolios has been gathered in the internal platform. Accordingly,
expenses that were previously Other external operating expenses
are shifting to Internal personnel expenses. Total operating expenses
increased 24 per cent to SEK 21m (17).
EBITThe segment’s EBIT totalled SEK 51m (61) for the quarter with a corre-
sponding EBIT margin of 71 per cent (78). The relatively low operating
expenses as compared with gross cash collections reflect a profitable
market in which we have historically acquired portfolios with relatively
good returns.
AcquisitionsAcquisition activity picked up significantly during the second quarter
following a cautious start to the year. The total acquisition volume for
the first half of 2015 exceeds the corresponding period for 2014. The
carrying value of acquired loan portfolios totalled SEK 1,449m (1,115).
Gross ERC for the same period increased to SEK 2,744m (2,189).
OtherThe activity plan for an additional portfolio was reviewed and expense
and gross cash collection forecasts were updated during the second
quarter as part of the continued integration of Navi Lex. One effect of
this is an increase of SEK 6m in the portfolio’s amortisation. This reval-
uation is included in the second quarter figures for Portfolio amortisa-
tion and revaluation.

Hoist Finance AB (publ) • Interim report January – June 2015 13
Financial statements
Consolidated income statement
SEK thousand NoteQuarter 2
2015Quarter 2
2014Jan–Jun
2015Jan–Jun
2014Full year
2014
Net revenues from acquired loan portfolios 1 473,621 337,131 905,431 632,268 1,398,291
Interest income –9,117 21,850 –1,254 43,196 89,731
Interest expense –92,876 –81,653 –185,497 –166,034 –344,969
Net interest income 371,628 277,328 718,680 509,430 1,143,053
Fee and commission income 41,747 39,111 89,363 76,874 153,222
Net income from financial transactions 1,519 –6,518 –18,740 –3,905 –17,719
Other income 3,439 2,205 4,985 4,089 12,219
Total operating income 418,333 312,126 794,288 586,488 1,290,775
General administrative expenses
Personnel expenses –153,016 –110,255 –298,682 –218,676 –473,200
Other operating expenses –211,764 –151,843 –439,505 –273,383 –627,467
Depreciation and amortisation of tangible and intangible assets –10,859 –7,267 –21,612 –13,778 –30,281
Total operating expenses –375,639 –269,365 –759,799 –505,837 –1,130,948
Profit before credit losses 42,694 42,761 34,489 80,651 159,827Net credit losses –5,298 – –5,298 – –
Earnings from participations in joint ventures 14,946 13,203 30,296 25,073 58,662
Profit before tax 52,342 55,964 59,487 105,724 218,489
Income tax expense –8,178 –12,266 –11,683 –23,522 –38,386
Profit for the period 44,164 43,698 47,804 82,202 180,103
Profit attributable to:Owners of Hoist Finance AB (publ) 44,164 43,698 47,804 82,202 180,103
Basic earnings per share1) 0.53 0.79 0.58 – 9.21
Diluted earnings per share1) 2) 0.51 0.66 0.57 – 8.16
1) A 1:3 split was conducted in February 2015.2) Includes effect of 983,913 outstanding warrants.
Financial statements
Hoist Finance AB (publ) • Interim report January – June 2015 14
Financial statements
Consolidated statement of comprehensive income
SEK thousandQuarter 2
2015Quarter 2
2014Jan–Jun
2015Jan–Jun
2014Full year
2014
Profit for the period 44,164 43,698 47,804 82,202 180,103
Other comprehensive incomeItems that will not be reclassified to profit or lossRevaluation of defined benefit pension plan – – – – –1,710
Revaluation of remuneration after terminated employment – – – – –1,120
Tax – – – – 872
Total items that will not be reclassified to profit or loss – – – – –1,958
Items that may be reclassified subsequently to profit or lossCurrency translation differences on foreign operations –16,712 39,829 –10,308 36,485 –23,154
Hedging of currency risk in foreign operations 4,307 –29,133 –1,851 –31,593 32,584
Total items that may be reclassified subsequently to profit or loss –12,405 10,696 –12,159 4,892 9,430
Other comprehensive income for the period –12,405 10,696 –12,159 4,892 7,472
Total comprehensive income for the period 31,759 54,394 35,645 87,094 187,575
Profit attributable to:Owners of Hoist Finance AB (publ) 31,759 54,394 35,645 87,094 187,575
Hoist Finance AB (publ) • Interim report January – June 2015 15
Financial statements
Consolidated balance sheet
SEK thousand Note30 Jun
201531 Dec
201430 Jun
2014
ASSETSCash 201 340 239
Treasury bills and Treasury bonds 1,723,545 2,316,110 1,258,740
Lending to credit institutions 2,605,891 1,292,711 1,086,763
Lending to the public 102,844 157,232 210,659
Acquired loan portfolios 2 8,734,711 8,586,782 7,010,871
Bonds and other securities 3,324,691 1,951,241 1,457,021
Participations in joint ventures 223,024 215,347 219,302
Intangible fixed assets 244,380 171,048 66,829
Tangible fixed assets 29,999 32,000 29,110
Other assets 270,505 209,941 175,602
Deferred tax assets 63,430 70,885 63,665
Prepaid expenses and accrued income 80,142 58,192 35,895
Total assets 17,403,363 15,061,829 11,614,696
LIABILITIES AND SHAREHOLDERS' EQUITYLiabilitiesDeposits and borrowing from the public 12,768,384 10,987,289 8,913,034
Tax liabilities 25,345 52,326 32,523
Other liabilities 402,733 555,186 178,863
Deferred tax liabilities 62,242 50,419 57,606
Accrued expenses and prepaid income 144,667 124,797 108,900
Provisions 58,247 68,704 47,349
Senior unsecured debt 1,458,626 1,493,122 740,355
Subordinated liabilities 334,773 332,796 330,952
Total liabilities and provisions 15,255,017 13,664,639 10,409,582
Shareholders' equityShare capital 26,178 21,662 17,207
Other contributed equity 1,756,424 1,003,818 904,579
Reserves –14,971 –2,812 –7,350
Retained earnings including profit for the period 380,715 374,522 290,678
Total shareholders' equity 2,148,346 1,397,190 1,205,114
Total liabilities and shareholders' equity 17,403,363 15,061,829 11,614,696
Pledged assets 1,106 1,903 5,886
Commitments 436,309 229,944 259,151
Hoist Finance AB (publ) • Interim report January – June 2015 16
Financial statements
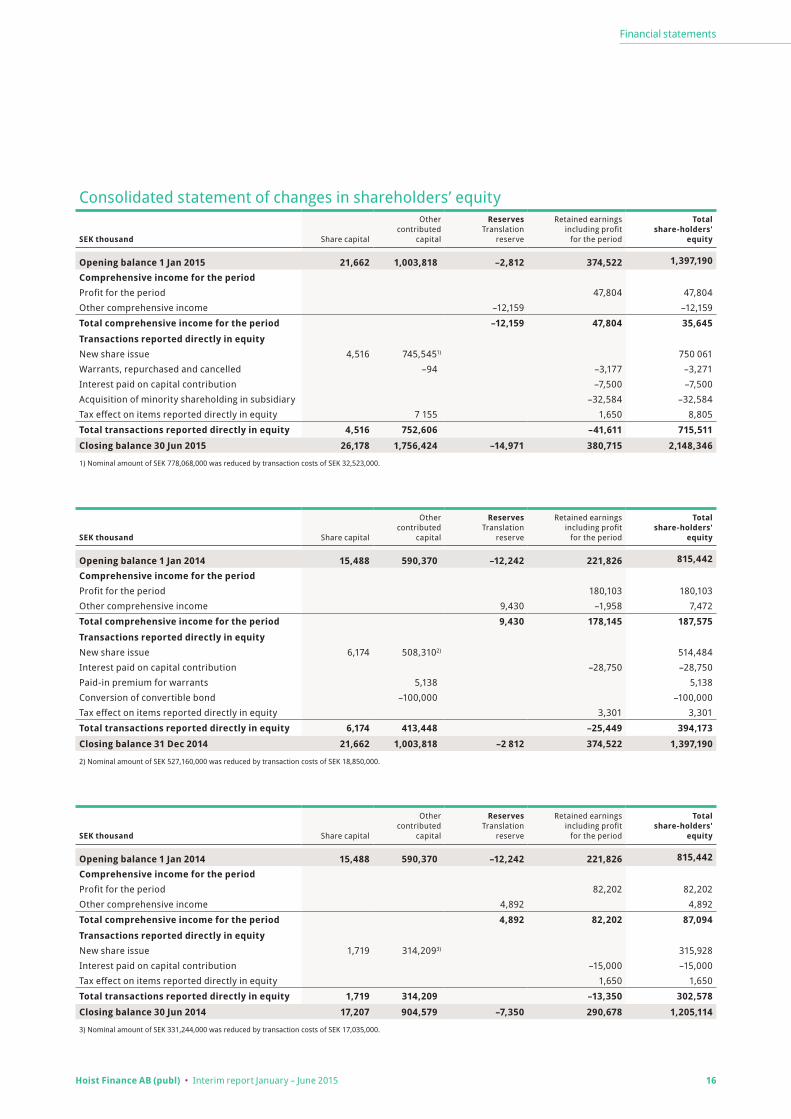
Consolidated statement of changes in shareholders’ equity
SEK thousand Share capital
Other contributed
capital
Reserves Translation
reserve
Retained earnings including profit
for the period
Total share-holders'
equity
Opening balance 1 Jan 2015 21,662 1,003,818 –2,812 374,522 1,397,190
Comprehensive income for the period Profit for the period 47,804 47,804Other comprehensive income –12,159 –12,159
Total comprehensive income for the period –12,159 47,804 35,645Transactions reported directly in equity New share issue 4,516 745,5451) 750 061Warrants, repurchased and cancelled –94 –3,177 –3,271Interest paid on capital contribution –7,500 –7,500Acquisition of minority shareholding in subsidiary –32,584 –32,584Tax effect on items reported directly in equity 7 155 1,650 8,805
Total transactions reported directly in equity 4,516 752,606 –41,611 715,511Closing balance 30 Jun 2015 26,178 1,756,424 –14,971 380,715 2,148,346
1) Nominal amount of SEK 778,068,000 was reduced by transaction costs of SEK 32,523,000.
SEK thousand Share capital
Other contributed
capital
Reserves Translation
reserve
Retained earnings including profit
for the period
Total share-holders'
equity
Opening balance 1 Jan 2014 15,488 590,370 –12,242 221,826 815,442
Comprehensive income for the period Profit for the period 180,103 180,103Other comprehensive income 9,430 –1,958 7,472
Total comprehensive income for the period 9,430 178,145 187,575Transactions reported directly in equity New share issue 6,174 508,3102) 514,484Interest paid on capital contribution –28,750 –28,750Paid-in premium for warrants 5,138 5,138Conversion of convertible bond –100,000 –100,000Tax effect on items reported directly in equity 3,301 3,301
Total transactions reported directly in equity 6,174 413,448 –25,449 394,173Closing balance 31 Dec 2014 21,662 1,003,818 –2 812 374,522 1,397,190
2) Nominal amount of SEK 527,160,000 was reduced by transaction costs of SEK 18,850,000.
SEK thousand Share capital
Other contributed
capital
Reserves Translation
reserve
Retained earnings including profit
for the period
Total share-holders'
equity
Opening balance 1 Jan 2014 15,488 590,370 –12,242 221,826 815,442
Comprehensive income for the period Profit for the period 82,202 82,202Other comprehensive income 4,892 4,892
Total comprehensive income for the period 4,892 82,202 87,094Transactions reported directly in equity New share issue 1,719 314,2093) 315,928Interest paid on capital contribution –15,000 –15,000Tax effect on items reported directly in equity 1,650 1,650
Total transactions reported directly in equity 1,719 314,209 –13,350 302,578Closing balance 30 Jun 2014 17,207 904,579 –7,350 290,678 1,205,114
3) Nominal amount of SEK 331,244,000 was reduced by transaction costs of SEK 17,035,000.

Hoist Finance AB (publ) • Interim report January – June 2015 17
Financial statements
Consolidated cash flow statement
SEK thousandQuarter 2
2015Quarter 2
2014Jan–Jun
2015Jan–Jun
2014Full year
2014
OPERATING ACTIVITIESGross cash collections 834,098 615,480 1,624,833 1,151,002 2,541,310
Paid-in interest –9,117 14,778 –1,254 31,883 89,731
Provisions received 41,747 39,111 89,363 76,874 153,222
Other operating income 3,439 2,206 4,985 4,089 12,220
Interest paid –53,916 –32,096 –117,760 –74,318 –274,982
Operating expenses –385,516 –293,199 –740,775 –499,558 –1,093,078
Net cash flow from financial transactions 1,518 –6,518 –18,741 –3,905 –17,719
Capital gain on redemption of joint venture certificates 15,673 2,464 15,673 2,464 27,941
Income tax paid –10,188 –10,867 –19,862 –40,443 –52,292
Total 437,738 331,359 836,462 648,088 1,386,353
Increase/decrease in acquired loans incl. translation differences –603,520 –1,092,526 –867,331 –1,531,670 –3,731,866
Increase/decrease in joint venture certificates 5,691 1,329 5,691 1,329 13,544
Increase/decrease in lending to the public 28,620 86,476 49,090 118,292 171,719
Increase/decrease in deposits and borrowing from the public 412,170 –226,411 1,713,358 –859,184 1,215,800
Increase/decrease in other assets –83,785 –87,414 –51,283 –67,208 –94,502
Increase/decrease in other liabilities 99,274 –8,628 –243,419 –53,774 307,124
Increase/decrease in provisions –5,753 –17,780 –10,457 –47,288 –25,933
Change in other balance sheet items –6,440 4,262 –3,893 –1,925 –310
Total –153,743 –1,340,692 591,756 –2,441,428 –2,144,424
Net Cash from operating activities 283,995 –1,009,333 1,428,218 –1,793,340 –758,071
INVESTING ACTIVITIESInvestments in intangible fixed assets –6,780 –7,972 –18,713 –10,552 –64,286
Investments in tangible fixed assets –2,815 – –4,300 –3,268 –14,247
Acquisition of business(es) – – –50,569 – –49,434
Investments in bonds and other securities –650,978 –351,702 –1,373,450 –148,031 –653,564
Net Cash from investing activities –660,573 –359,674 –1,447,032 –161,851 –781,531
FINANCING ACTIVITIESNew share issue – 315,050 750,061 315,050 414,484
Paid-in premium for warrants – – – – 5,139
Warrants, repurchased and cancelled –3,217 – –3,271 – –
Issued bonds – – – 74,000 831,007
Interest paid on capital contribution –7,500 –15,000 –7,500 –15,000 –28,750
Net Cash from financing activities –10,717 300,050 739,290 374,050 1,221,880
Net Cash flow for the period –387,295 –1,068,957 720,476 –1,581,141 –317,722
Cash and cash equivalents at the beginning of the period 4,716,932 3,414,699 3,609,161 3,926,883 3,926,883
Cash and cash equivalents at the end of the period1) 4,329,637 2,345,742 4,329,637 2,345,742 3,609,1611) Consists of cash, Treasury bills/bonds and lending to credit institutions.
Hoist Finance AB (publ) • Interim report January – June 2015 18
Financial statements
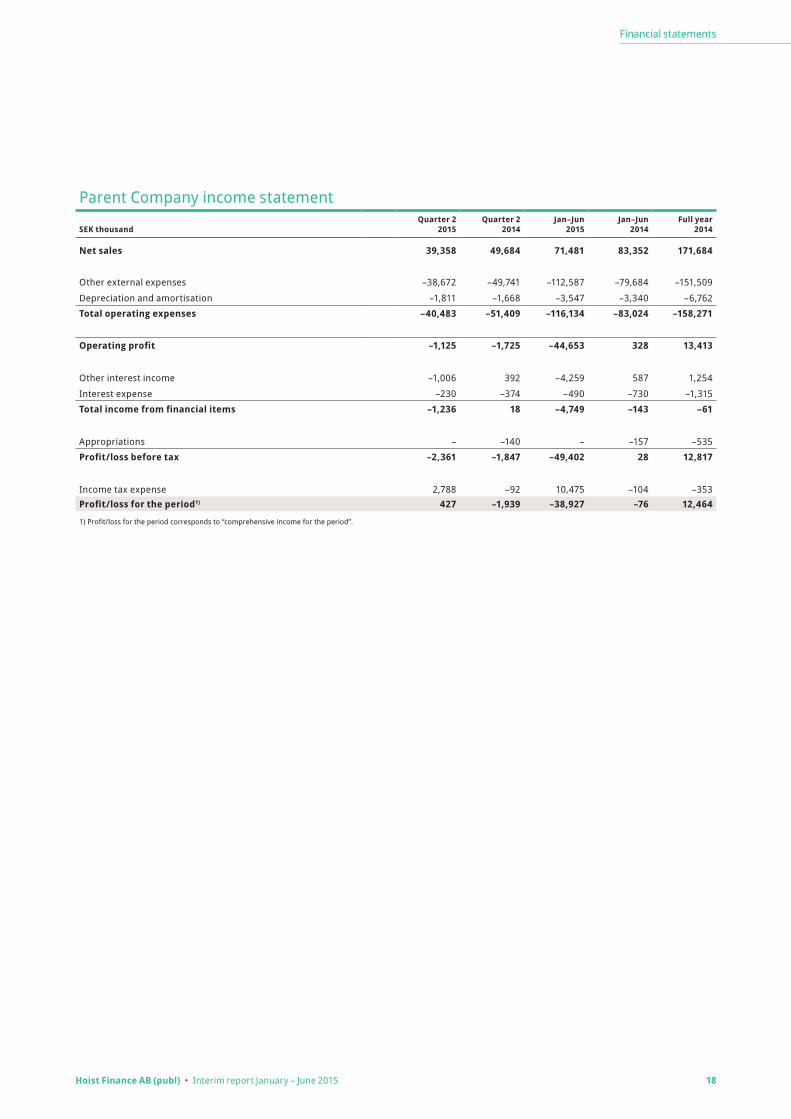
Parent Company income statement
SEK thousandQuarter 2
2015Quarter 2
2014Jan–Jun
2015Jan–Jun
2014Full year
2014
Net sales 39,358 49,684 71,481 83,352 171,684
Other external expenses –38,672 –49,741 –112,587 –79,684 –151,509
Depreciation and amortisation –1,811 –1,668 –3,547 –3,340 –6,762
Total operating expenses –40,483 –51,409 –116,134 –83,024 –158,271
Operating profit –1,125 –1,725 –44,653 328 13,413
Other interest income –1,006 392 –4,259 587 1,254
Interest expense –230 –374 –490 –730 –1,315
Total income from financial items –1,236 18 –4,749 –143 –61
Appropriations – –140 – –157 –535
Profit/loss before tax –2,361 –1,847 –49,402 28 12,817
Income tax expense 2,788 –92 10,475 –104 –353Profit/loss for the period1) 427 –1,939 –38,927 –76 12,464
1) Profit/loss for the period corresponds to “comprehensive income for the period”.
Hoist Finance AB (publ) • Interim report January – June 2015 19
Financial statements
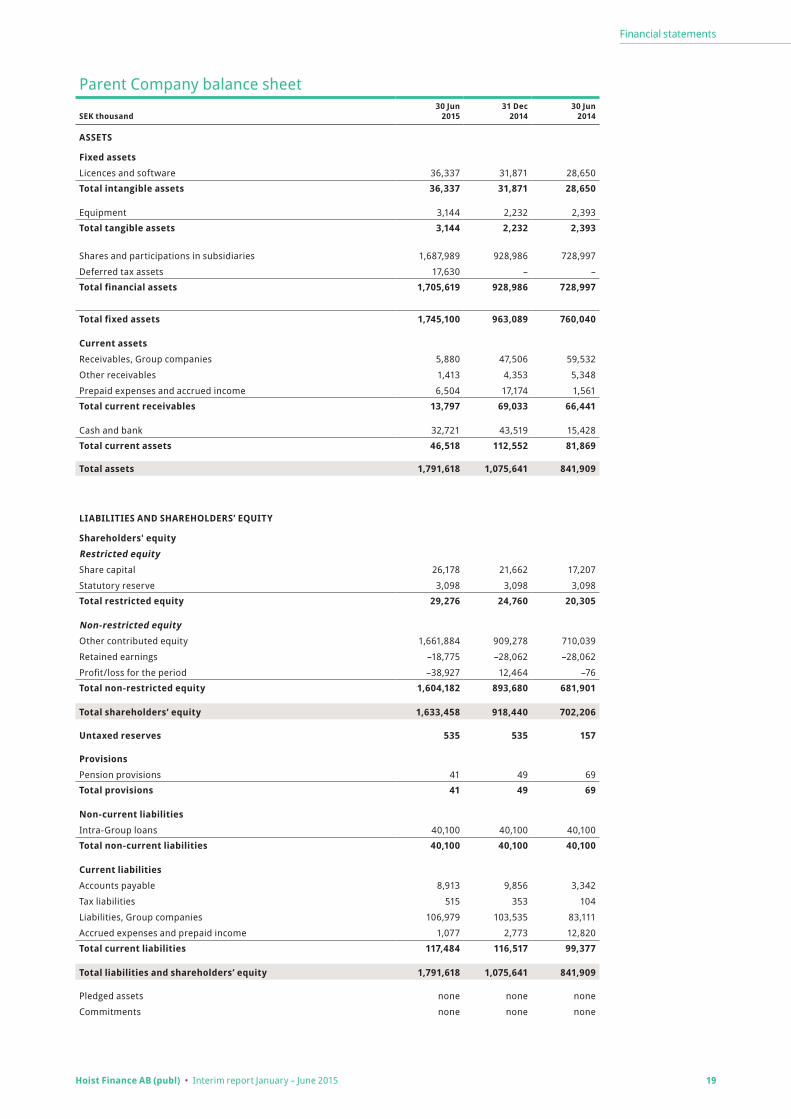
Parent Company balance sheet
SEK thousand30 Jun
201531 Dec
201430 Jun
2014
ASSETS
Fixed assetsLicences and software 36,337 31,871 28,650
Total intangible assets 36,337 31,871 28,650
Equipment 3,144 2,232 2,393
Total tangible assets 3,144 2,232 2,393
Shares and participations in subsidiaries 1,687,989 928,986 728,997
Deferred tax assets 17,630 – –
Total financial assets 1,705,619 928,986 728,997
Total fixed assets 1,745,100 963,089 760,040
Current assetsReceivables, Group companies 5,880 47,506 59,532
Other receivables 1,413 4,353 5,348
Prepaid expenses and accrued income 6,504 17,174 1,561
Total current receivables 13,797 69,033 66,441
Cash and bank 32,721 43,519 15,428
Total current assets 46,518 112,552 81,869
Total assets 1,791,618 1,075,641 841,909
LIABILITIES AND SHAREHOLDERS’ EQUITY
Shareholders' equityRestricted equityShare capital 26,178 21,662 17,207
Statutory reserve 3,098 3,098 3,098
Total restricted equity 29,276 24,760 20,305
Non-restricted equityOther contributed equity 1,661,884 909,278 710,039
Retained earnings –18,775 –28,062 –28,062
Profit/loss for the period –38,927 12,464 –76
Total non-restricted equity 1,604,182 893,680 681,901 Total shareholders’ equity 1,633,458 918,440 702,206
Untaxed reserves 535 535 157
ProvisionsPension provisions 41 49 69
Total provisions 41 49 69
Non-current liabilitiesIntra-Group loans 40,100 40,100 40,100
Total non-current liabilities 40,100 40,100 40,100
Current liabilitiesAccounts payable 8,913 9,856 3,342
Tax liabilities 515 353 104
Liabilities, Group companies 106,979 103,535 83,111
Accrued expenses and prepaid income 1,077 2,773 12,820
Total current liabilities 117,484 116,517 99,377
Total liabilities and shareholders’ equity 1,791,618 1,075,641 841,909
Pledged assets none none none
Commitments none none none

Hoist Finance AB (publ) • Interim report January – June 2015 20
Financial statements
Parent Company statement of changes in shareholders’ equityRestricted equity Non-restricted equity
SEK thousand Share capitalStatutory
reserve
Other contributed
equityRetained earnings
Profit for the period
Total shareholders'
equity
Opening balance 1 Jan 2015 21,662 3,098 909,278 –28,062 12,464 918,440
Transfer of previous year's net profit/loss 12,464 –12,464 0 Comprehensive income for the period
Profit for the period –38,927 –38,927
Total comprehensive income for the period –38,927 –38,927
Transactions reported directly in equity
New share issue 4,516 745,5451) 750,061
Warrants, repurchased and cancelled –94 –3,177 –3,271
Tax effect on items reported directly in equity 7,155 7,155
Total transactions reported directly in equity 4,516 752,606 –3,177 753,945
Closing balance 30 Jun 2015 26,178 3,098 1,661,884 –18,775 –38,927 1,633,458
1) Nominal amount of SEK 778,068,000 was reduced by transaction costs of SEK 32,523,000.
Restricted equity Non-restricted equity
SEK thousand Share capitalStatutory
reserve
Other contributed
equityRetained earnings
Profit for the period
Total shareholders'
equity
Opening balance 1 Jan 2014 15,488 3,098 395,830 –23,111 –4,951 386,354
Transfer of previous year's net profit/loss –4,951 4,951 0 Comprehensive income for the period
Profit for the period 12,464 12,464
Total comprehensive income for the period 12,464 12,464
Transactions reported directly in equity
New share issue 6,174 508,3102) 514,484
Paid-in premium for warrants 5,138 5,138
Total transactions reported directly in equity 6,174 513,448 519,622
Closing balance 31 Dec 2014 21,662 3,098 909,278 –28,062 12,464 918,440
2) Nominal amount of SEK 527,160,000 was reduced by transaction costs of SEK 18,850,000.
Restricted equity Non-restricted equity
SEK thousand Share capitalStatutory
reserve
Other contributed
equityRetained earnings
Profit for the period
Total shareholders'
equity
Opening balance 1 Jan 2014 15,488 3,098 395,830 –23,111 –4,951 386,354
Transfer of previous year's net profit/loss –4,951 4,951 0
Comprehensive income for the period
Profit for the period –76 –76
Total comprehensive income for the period –76 –76
Transactions reported directly in equity
New share issue 1,719 314,2093) 315,928
Total transactions reported directly in equity 1,719 314,209 315,928
Closing balance 30 Jun 2014 17,207 3,098 710,039 –28,062 –76 702,206
3) Nominal amount of SEK 331,244,000 was reduced by transaction costs of SEK 17,035,000.
Hoist Finance AB (publ) • Interim report January – June 2015 21
Financial statements
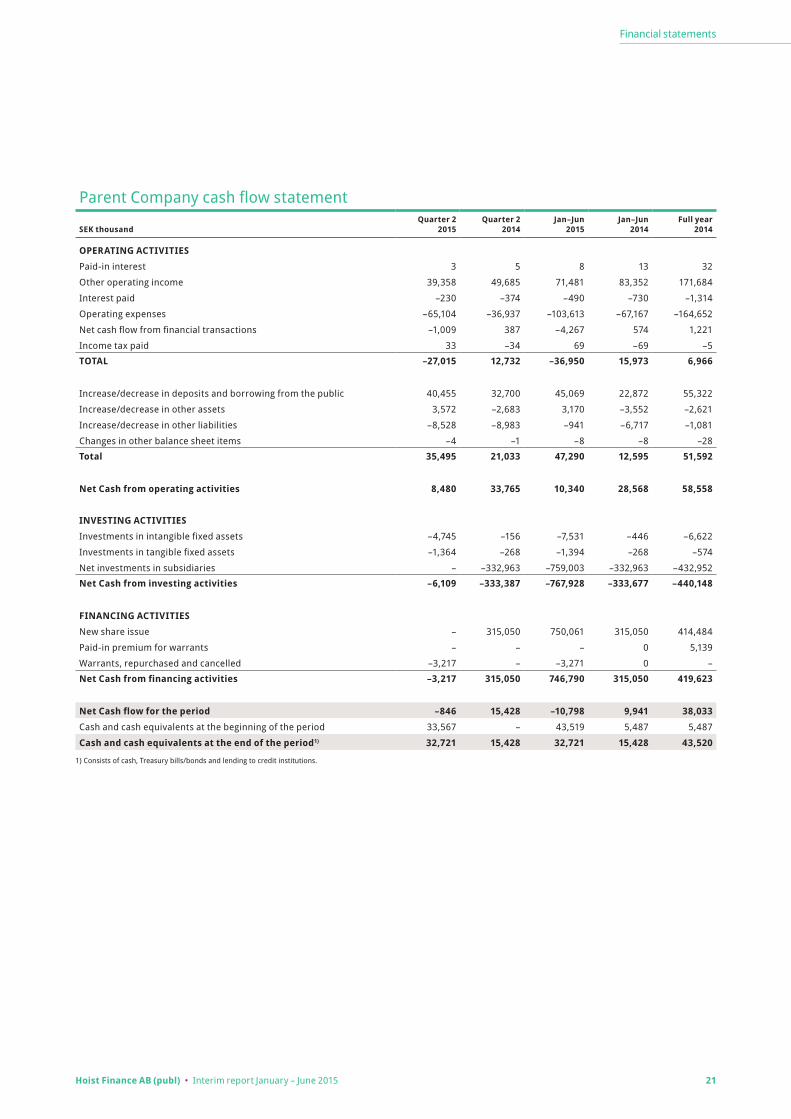
Parent Company cash flow statement
SEK thousandQuarter 2
2015Quarter 2
2014Jan–Jun
2015Jan–Jun
2014Full year
2014
OPERATING ACTIVITIESPaid-in interest 3 5 8 13 32
Other operating income 39,358 49,685 71,481 83,352 171,684
Interest paid –230 –374 –490 –730 –1,314
Operating expenses –65,104 –36,937 –103,613 –67,167 –164,652
Net cash flow from financial transactions –1,009 387 –4,267 574 1,221
Income tax paid 33 –34 69 –69 –5
TOTAL –27,015 12,732 –36,950 15,973 6,966
Increase/decrease in deposits and borrowing from the public 40,455 32,700 45,069 22,872 55,322
Increase/decrease in other assets 3,572 –2,683 3,170 –3,552 –2,621
Increase/decrease in other liabilities –8,528 –8,983 –941 –6,717 –1,081
Changes in other balance sheet items –4 –1 –8 –8 –28
Total 35,495 21,033 47,290 12,595 51,592
Net Cash from operating activities 8,480 33,765 10,340 28,568 58,558
INVESTING ACTIVITIESInvestments in intangible fixed assets –4,745 –156 –7,531 –446 –6,622
Investments in tangible fixed assets –1,364 –268 –1,394 –268 –574
Net investments in subsidiaries – –332,963 –759,003 –332,963 –432,952
Net Cash from investing activities –6,109 –333,387 –767,928 –333,677 –440,148
FINANCING ACTIVITIESNew share issue – 315,050 750,061 315,050 414,484
Paid-in premium for warrants – – – 0 5,139
Warrants, repurchased and cancelled –3,217 – –3,271 0 –
Net Cash from financing activities –3,217 315,050 746,790 315,050 419,623
Net Cash flow for the period –846 15,428 –10,798 9,941 38,033Cash and cash equivalents at the beginning of the period 33,567 – 43,519 5,487 5,487
Cash and cash equivalents at the end of the period1) 32,721 15,428 32,721 15,428 43,520
1) Consists of cash, Treasury bills/bonds and lending to credit institutions.
Hoist Finance AB (publ) • Interim report January – June 2015 22
Accounting principles
Accounting principlesHoist Finance AB (publ) 556012-8489
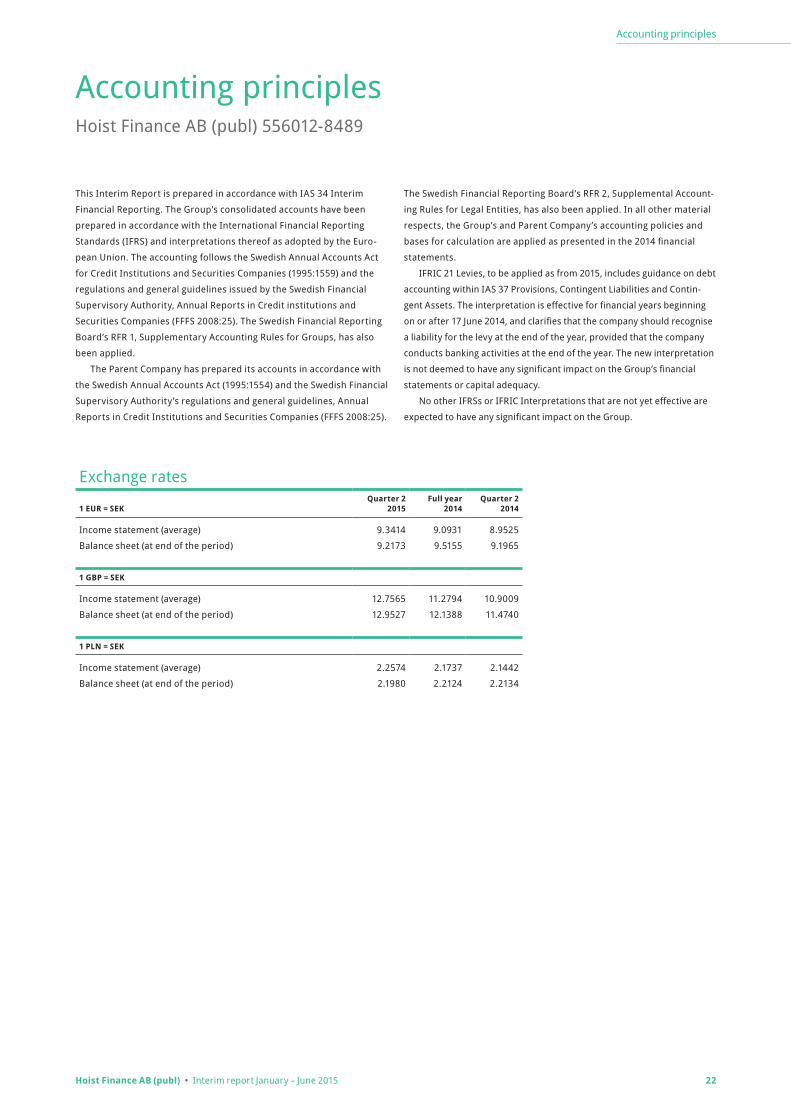
This Interim Report is prepared in accordance with IAS 34 Interim
Financial Reporting. The Group’s consolidated accounts have been
prepared in accordance with the International Financial Reporting
Standards (IFRS) and interpretations thereof as adopted by the Euro-
pean Union. The accounting follows the Swedish Annual Accounts Act
for Credit Institutions and Securities Companies (1995:1559) and the
regulations and general guidelines issued by the Swedish Financial
Supervisory Authority, Annual Reports in Credit institutions and
Securities Companies (FFFS 2008:25). The Swedish Financial Reporting
Board’s RFR 1, Supplementary Accounting Rules for Groups, has also
been applied.
The Parent Company has prepared its accounts in accordance with
the Swedish Annual Accounts Act (1995:1554) and the Swedish Financial
Supervisory Authority’s regulations and general guidelines, Annual
Reports in Credit Institutions and Securities Companies (FFFS 2008:25).
Exchange rates
1 EUR = SEKQuarter 2
2015Full year
2014Quarter 2
2014
Income statement (average) 9.3414 9.0931 8.9525
Balance sheet (at end of the period) 9.2173 9.5155 9.1965
1 GBP = SEK
Income statement (average) 12.7565 11.2794 10.9009
Balance sheet (at end of the period) 12.9527 12.1388 11.4740
1 PLN = SEK
Income statement (average) 2.2574 2.1737 2.1442
Balance sheet (at end of the period) 2.1980 2.2124 2.2134
The Swedish Financial Reporting Board’s RFR 2, Supplemental Account-
ing Rules for Legal Entities, has also been applied. In all other material
respects, the Group’s and Parent Company’s accounting policies and
bases for calculation are applied as presented in the 2014 financial
statements.
IFRIC 21 Levies, to be applied as from 2015, includes guidance on debt
accounting within IAS 37 Provisions, Contingent Liabilities and Contin-
gent Assets. The interpretation is effective for financial years beginning
on or after 17 June 2014, and clarifies that the company should recognise
a liability for the levy at the end of the year, provided that the company
conducts banking activities at the end of the year. The new interpretation
is not deemed to have any significant impact on the Group’s financial
statements or capital adequacy.
No other IFRSs or IFRIC Interpretations that are not yet effective are
expected to have any significant impact on the Group.

Hoist Finance AB (publ) • Interim report January – June 2015 23
Notes
NotesNote 1 Segment reporting
Consolidated income statement
SEK thousand Quarter 2 2015 Quarter 2 2014 Jan–Jun 2015 Jan–Jun 2014 Full year 2014
Revenue from acquired loan portfolios 473,621 337,131 905,431 632,268 1,398,291 Of which, gross cash collections 834,098 615,479 1,624,833 1,151,002 2,541,311 Of which, portfolio amortisation and revaluation –360,477 –278,348 –719,402 –518,734 –1,143,020Interest income –9,117 21,850 –1,254 43,196 89,731 Of which, interest income from run-off portfolio of consumer loans 2,994 9,566 6,112 20,633 38,180 Of which, interest income excl. run-off loan portfolio –12,111 12,284 –7,366 22,563 51,551Interest expense –92,876 –81,653 –185,497 –166,034 –344,969
Net interest income 371,628 277,328 718,680 509,430 1,143,053 Fee and commission income 41,747 39,111 89,363 76,874 153,222Net income from financial transactions 1,519 –6,518 –18,740 –3,905 –17,719Other income 3,439 2,205 4,985 4,089 12,219
Total operating income 418,333 312,126 794,288 586,488 1,290,775 General administrative expensesPersonnel expenses –153,016 –110,255 –298,682 –218,676 –473,200Other operating expenses –211,764 –151,843 –439,505 –273,383 –627,467Depreciation and amortisation of tangible and intangible assets –10,859 –7,267 –21,612 –13,778 –30,281
Total operating expenses –375,639 –269,365 –759,799 –505,837 –1,130,948 Profit before loan losses 42,694 42,761 34,489 80,650 159,827
Net loan losses –5,298 – –5,298 – –Profit from shares and participations in joint ventures 14,946 13,203 30,296 25,073 58,662
Profit before tax 52,342 55,964 59,487 105,724 218,489
Operating income statement based on segment reporting
SEK thousand Quarter 2 2015 Quarter 2 2014 Jan–Jun 2015 Jan–Jun 2014 Full year 2014
Gross cash collections 834,098 615,479 1,624,833 1,151,002 2,541,311Portfolio amortisation and revaluation –360,477 –278,348 –719,402 –518,734 –1,143,020Interest income from run-off consumer loan portfolio 2,994 9,566 6,112 20,633 38,180
Net revenue from acquired loan portfolios 476,615 346,697 911,543 652,901 1,436,471Fee and commission income 41,747 39,111 89,363 76,874 153,222Profit from shares and participations in joint ventures 14,946 13,203 30,296 25,073 58,662Other income 3,439 2,205 4,985 4,089 12,219
Total revenue 536,747 401,216 1,036,187 758,937 1,660,574
Personnel expenses –153,016 –110,255 –298,682 –218,676 –473,200Other operating expenses –211,764 –151,843 –439,505 –273,383 –627,467Depreciation and amortisation of tangible and intangible assets –10,859 –7,267 –21,612 –13,778 –30,281
Total operating expenses –375,639 –269,365 –759,799 –505,837 –1,130,948 EBIT 161,108 131,851 276,388 253,100 529,626
Interest income excl. run-off portfolio of consumer loans –12,111 12,284 –7,366 22,563 51,551Interest expense –92,876 –81,653 –185,497 –166,034 –344,969Net income from financial transactions incl. financing expenses –3,779 –6,518 –24,038 –3,905 –17,719
Total financial items –108,766 –75,887 –216,901 –147,376 –311,137
Profit before tax 52,342 55,964 59,487 105,724 218,489
Segment reporting has been prepared based on the manner in which executive management monitors operations. This differs from statutory account preparation; the material differences are as follows:• Revenueincludesincomefrom − acquired loan portfolios − run-off portfolios of consumer loans
− fee and commission income from third parties – profit from shares and participations in joint ventures − certain other income• Totalfinancialitemsincludeinterestincomefromsourcesother
than acquired loan portfolios, interest expense and net income from financial transactions.

Hoist Finance AB (publ) • Interim report January – June 2015 24
Notes
Note 1 Segment reporting, cont.
Income statement Quarter 2, 2015
SEK thousandGerman
and Austria1)
Belgium, the Netherlands
and France2) UK Italy Poland
Central Functions/
Eliminations Group
Gross cash collections 210,312 234,349 162,516 127,465 99,456 – 834,098Portfolio amortisation and revaluation –114,302 –146,271 –20,835 –42,748 –36,321 – –360,477Interest income from run-off consumer loan portfolio 2,994 – – – – – 2,994
Net revenue from acquired loan portfolios 99,004 88,078 141,681 84,717 63,135 – 476,615Fee and commission income 1,416 1,636 27,379 1,705 9,611 – 41,747Profit from shares and participations in joint ventures – – – – – 14,946 14,946Other income 3,365 –8 1,076 330 64 –1,388 3,439
Total revenue 103,785 89,706 170,136 86,752 72,810 13,558 536,747
Personnel expenses –35,781 –21,389 –41,383 –14,642 –5,208 –34,613 –153,016Other operating expenses –23,954 –27,011 –88,682 –28,526 –15,155 –28,436 –211,764Depreciation and amortisation of tangible and intangible assets –869 –511 –871 –1,610 –964 –6,034 –10,859
Total operating expenses –60,604 –48,911 –130,936 –44,778 –21,327 –69,083 –375,639
EBIT 43,181 40,795 39,200 41,974 51,483 –55,525 161,108
Interest income excl. run-off portfolio of consumer loans 116 0 – 0 894 –13,121 –12,111Interest expense – –18 0 0 –102 –92,756 –92,876Net income from financial transactions incl. financing expenses –28,305 –25,652 –23,791 –14,381 –16,005 104,355 –3,779
Total financial items –28,189 –25,670 –23,791 –14,381 –15,213 –1,522 –108,766
Profit before tax 14,992 15,125 15,409 27,593 36,270 –57,047 52,342
1) Total revenue for Germany of SEK 100,368,000 is included in the revenue for Germany and Austria.2) Total revenue for the Netherlands of SEK 62,844,000 is included in the revenue for Belgium, the Netherlands and France.
Income statement Quarter 2, 2014
SEK thousandGerman
and Austria1)
Belgium, the Netherlands
and France2) UK Italy Poland
Central Functions/
Eliminations Group
Gross cash collections 155,454 192,280 125,220 60,769 81,756 – 615,479Portfolio amortisation and revaluation –84,250 –115,263 –52,380 –22,522 –3,933 – –278,348Interest income from run-off consumer loan portfolio 9,566 – – – – – 9,566
Net revenue from acquired loan portfolios 80,770 77,017 72,840 38,247 77,823 – 346,697Fee and commission income 4,469 1,755 32,887 – – – 39,111Profit from shares and participations in joint ventures – – – – – 13,203 13,203Other income 2,979 – 141 – – –915 2,205
Total revenue 88,218 78,772 105,868 38,247 77,823 12,288 401,216
Personnel expenses –32,687 –21,530 –30,490 – –475 –25,073 –110,255Other operating expenses –20,040 –23,264 –33,288 –14,249 –16,750 –44,252 –151,843Depreciation and amortisation of tangible and intangible assets –708 –998 –1,750 – –27 –3,784 –7,267
Total operating expenses –53,435 –45,792 –65,528 –14,249 –17,252 –73,109 –269,365
EBIT 34,783 32,980 40,340 23,998 60,571 –60,821 131,851
Interest income excl. run-off portfolio of consumer loans 6 20 5 – – 12,253 12,284Interest expense 46 –20 –1 – – –81,678 –81,653Net income from financial transactions incl. financing expenses –24,972 –25,460 –16,896 –6,371 –11,461 78,642 –6,518
Total financial items –24,920 –25,460 –16,892 –6,371 –11,461 9,217 –75,887
Profit before tax 9,863 7,520 23,448 17,627 49,110 –51,604 55,964
1) Total revenue for Germany of SEK 87,772,000 is included in the revenue for Germany and Austria.2) Total revenue for the Netherlands of SEK 48,292,000 is included in the revenue for Belgium, the Netherlands and France.
Group costs for central and supporting functions are not allocated to the operating segments but are reported as Central Functions and Eliminations.
A financing cost is allocated to the operating segments based on the acquired loan portfolio assets. The difference between the actual fi-nancing cost and the standardised cost is included in Central Functions and Eliminations. Certain internal functions located in Germany were
reclassified as Group functions during Q2 2015; accordingly, costs asso-ciated with these functions are now included in the Central Functions operating segment.
With respect to the balance sheet, only acquired loan portfolios are monitored. Other assets and liabilities are not monitored on a segment-by-segment basis.

Hoist Finance AB (publ) • Interim report January – June 2015 25
Notes
Income statement Jan–Jun 2015
SEK thousandGerman
and Austria1)
Belgium, the Netherlands
and France2) UK Italy Poland
Central Functions/
Eliminations Group
Gross cash collections 461,906 412,037 314,144 250,952 185,794 – 1,624,833Portfolio amortisation and revaluation –264,923 –251,499 –59,253 –87,726 –56,001 – –719,402Interest income from run-off consumer loan portfolio 6,112 – – – – – 6,112
Net revenue from acquired loan portfolios 203,095 160,538 254,891 163,226 129,793 – 911,543Fee and commission income 4,095 3,451 60,548 2,912 18,357 – 89,363Profit from shares and participations in joint ventures – – – – – 30,296 30,296Other income 4,527 –8 1,082 675 97 –1,388 4,985
Total revenue 211,717 163,981 316,521 166,813 148,247 28,908 1,036,187
Personnel expenses –71,676 –45,831 –78,649 –27,339 –10,404 –64,783 –298,682Other operating expenses –46,151 –50,931 –150,911 –54,061 –29,570 –107,881 –439,505Depreciation and amortisation of tangible and intangible assets –1,744 –1,320 –1,726 –3,184 –1,745 –11,893 –21,612
Total operating expenses –119,571 –98,082 –231,286 –84,584 –41,719 –184,557 –759,799
EBIT 92,146 65,899 85,235 82,229 106,528 –155,649 276,388
Interest income excl. run-off portfolio of consumer loans 337 28 – 0 906 –8,637 –7,366Interest expense – –34 0 –8 –109 –185,346 –185,497Net income from financial transactions incl. financing expenses –56,630 –52,516 –47,145 –28,586 –30,776 191,615 –24,038
Total financial items –56,293 –52,522 –47,145 –28,594 –29,979 –2,368 –216,901
Profit before tax 35,853 13,377 38,090 53,635 76,549 –158,017 59,487
1) Total revenue for Germany of SEK 205,139,000 is included in the revenue for Germany and Austria.2) Total revenue for the Netherlands of SEK 91,879,000 is included in the revenue for Belgium, the Netherlands and France.
Income statement Jan–Jun 2014
SEK thousandGerman
and Austria1)
Belgium, the Netherlands
and France2) UK Italy Poland
Central Functions/
Eliminations Group
Gross cash collections 309,572 350,168 257,898 110,920 122,444 – 1,151,002Portfolio amortisation and revaluation –154,423 –220,230 –106,867 –46,438 9,224 – –518,734Interest income from run-off consumer loan portfolio 20,633 – – – – – 20,633
Net revenue from acquired loan portfolios 175,782 129,938 151,031 64,482 131,668 – 652,901Fee and commission income 9,061 3,373 64,440 – – – 76,874Profit from shares and participations in joint ventures – – – – – 25,073 25,073Other income 4,143 0 558 0 0 –612 4,089
Total revenue 188,986 133,311 216,029 64,482 131,668 24,461 758,937
Personnel expenses –64,492 –40,382 –63,392 – –878 –49,532 –218,676Other operating expenses –35,357 –44,158 –71,244 –23,468 –28,139 –71,017 –273,383Depreciation and amortisation of tangible and intangible assets –1,416 –1,866 –3,081 – –27 –7,388 –13,778
Total operating expenses –101,265 –86,406 –137,717 –23,468 –29,044 –127,937 –505,837
EBIT 87,721 46,905 78,312 41,014 102,624 –103,476 253,100
Interest income excl. run-off portfolio of consumer loans 18 42 233 0 0 22,270 22,563Interest expense 46 –54 –91 – 0 –165,935 –166,034Net income from financial transactions incl. financing expenses –49,778 –47,388 –33,374 –10,064 –22,117 158,816 –3,905
Total financial items –49,714 –47,400 –33,232 –10,064 –22,117 15,151 –147,376
Profit before tax 38,007 –495 45,080 30,950 80,507 –88,325 105,724
1) Total revenue for Germany of SEK 184,925,000 is included in the revenue for Germany and Austria.2) Total revenue for the Netherlands of SEK 81,537,000 is included in the revenue for Belgium, the Netherlands and France.
Note 1 Segment reporting, cont.

Hoist Finance AB (publ) • Interim report January – June 2015 26
Notes
Income statement Full year 2014
SEK thousandGerman
and Austria1)
Belgium, the Netherlands
and France2) UK Italy Poland
Central Functions/
Eliminations Group
Gross cash collections 724,044 733,474 527,346 260,828 295,619 – 2,541,311Portfolio amortisation and revaluation –348,873 –484,991 –200,802 –91,324 –17,030 – –1,143,020Interest income from run-off consumer loan portfolio 38,180 – – – – – 38,180
Net revenue from acquired loan portfolios 413,351 248,483 326,544 169,504 278,589 – 1,436,471Fee and commission income 17,889 6,989 128,344 – – – 153,222Profit from shares and participations in joint ventures – – – – – 58,662 58,662Other income 14,294 218 2,686 311 0 –5,290 12,219
Total revenue 445,534 255,690 457,574 169,815 278,589 53,372 1,660,574
Personnel expenses –133,245 –86,886 –134,502 –17,854 –2,035 –98,678 –473,200Other operating expenses –85,272 –102,656 –137,601 –86,028 –74,812 –141,098 –627,467Depreciation and amortisation of tangible and intangible assets –2,940 –4,679 –4,588 –2,340 – –15,734 –30,281
Total operating expenses –221,457 –194,221 –276,691 –106,222 –76,847 –255,510 –1,130,948
EBIT 224,077 61,469 180,883 63,593 201,742 –202,138 529,626
Interest income excl. run-off portfolio of consumer loans 96 170 241 0 0 51,044 51,551Interest expense –678 –90 –179 –2 0 –344,020 –344,969Net income from financial transactions incl. financing expenses –105,135 –100,481 –72,627 –25,292 –52,232 338,048 –17,719
Total financial items –105,717 –100,401 –72,565 –25,294 –52,232 45,072 –311,137
Profit before tax 118,360 –38,932 108,318 38,299 149,510 –157,066 218,489
1) Total revenue for Germany of SEK 437,105,000 is included in the revenue for Germany and Austria.2) Total revenue for the Netherlands of SEK 119,747,000 is included in the revenue for Belgium, the Netherlands and France.
Acquired loans at 30 Jun 2015
SEK thousandGerman
and Austria
Belgium, the Netherlands
and France UK Italy Poland
Central Functions/
Eliminations Group
Run-off portfolio of consumer loans 81,879 81,879Acquired loan portfolios 2,139,178 1,981,923 1,900,387 1,264,030 1,449,193 8,734,711Shares and participations in joint ventures 223,024 223,024Acquired loans 2,221,057 1,981,923 1,900,387 1,264,030 1,449,193 223,024 9,039,614
Acquired loans at 31 Dec 2014
SEK thousandGerman
and Austria
Belgium, the Netherlands
and France UK Italy Poland
Central Functions/
Eliminations Group
Run-off portfolio of consumer loans 118,799 118,799Acquired loan portfolios 2,231,593 2,194,000 1,797,520 1,181,210 1,182,459 8,586,782Shares and participations in joint ventures 215,347 215,347Acquired loans 2,350,392 2,194,000 1,797,520 1,181,210 1,182,459 215,347 8,920,928
Acquired loans at 30 Jun 2014
SEK thousandGerman
and Austria
Belgium, the Netherlands
and France UK Italy Poland
Central Functions/
Eliminations Group
Run-off portfolio of consumer loans 155,385 155,385Acquired loan portfolios 1,854,880 2,084,060 1,438,361 518,847 1,114,723 7,010,871Shares and participations in joint ventures 219,302 219,302Acquired loans 2,010,265 2,084,060 1,438,361 518,847 1,114,723 219,302 7,385,558
Note 1 Segment reporting, cont.

Hoist Finance AB (publ) • Interim report January – June 2015 27
Notes
GROUP
SEK thousand 30 Jun 2015 31 Dec 2014 30 Jun 2014
Opening balance 8,586,782 5,997,935 5,997,935Acquisitions 937,744 3,226,795 1,330,259Translation differences –70,413 505,071 201,411 Changes in valueBased on opening balance forecast (amortisation) –710,320 –1,128,103 –518,734Based on revised estimates (revaluation) –9,082 –14,916 –
Carrying value 8,734,711 8,586,782 7,010,871Changes in carrying value reported in the income statement –719,402 –1,143,020 –518,734
Note 2 Financial instruments
Sensitivity analysisWhile Hoist Finance considers the assumptions made in assessing fair value to be reasonable, the application of other methods and assumptions
may produce a different fair value. For Level 3 fair value, a reasonable change in one or several assumptions would have the following impact on
earnings:
GROUP
SEK thousand 30 Jun 2015 31 Dec 2014 30 Jun 2014
Carrying value of loan portfolios 8,734,711 8,586,782 7,010,871A 5% increase in estimated cash flow over the forecast period (10 years) would increase the carrying value by 407,798 424,369 328,544Of which, valued at fair value 66,235 72,804 77,672A 5% decrease in estimated cash flow over the forecast period would reduce the carrying value by –407,984 –424,369 –328,557Of which, valued at fair value –66,235 –72,804 –77,672
Carrying value of loan portfolios acquired prior to 1 Jul 2011 1,324,710 1,460,229 1,512,847A 1% decrease in the market rate of interest would increase the carrying value by 40,644 46,058 47,055A 1% increase in the market rate of interest would reduce the carrying value by –38,442 –43,483 –44,510Shortening the forecast period by 1 year would reduce the carrying value by –49,844 –48,622 –59,192Lengthening the forecast period by 1 year would increase the carrying value by 44,980 43,413 53,456
Of which, reported at fair value GROUP
SEK thousand 30 Jun 2015 31 Dec 2014 30 Jun 2014
Opening balance 1,460,229 1,607,061 1,607,061Translation differences –44,900 94,594 4,953
Changes in valueBased on opening balance forecast (amortisation) –90,619 –188,953 –99,167Based on revised estimates (revaluation) – –52,473 –
Carrying value 1,324,710 1,460,229 1,512,847Changes in carrying value reported in the income statement –90,619 –241,426 –99,167
Portfolios valued at fair value through profit or loss The Group has chosen to categorise portfolios acquired prior to 1 July
2011 as valued at fair value through profit or loss, as these financial
assets are managed and their performance evaluated on a fair value
basis in accordance with the Group’s risk management policies. Portfo-
lios acquired after that date are valued at amortised cost. Information
on the portfolios is provided internally to Group Management on this
basis. The underlying concept for valuation at fair value is to assess the
carrying value of an asset by using the best available price for the as-
set. Loan portfolios are typically not traded publicly and, consequently,
there are no market prices available. Most participants in the industry,
however, apply similar pricing methods for portfolio acquisitions and
calculate the present value of cash flows that correspond to the market
value of a portfolio.
The primary influencing factors in assessing fair value are:
• thegrosscollectionsforecast
• thecostlevel,and
• themarketdiscountrate
The Group monitors and evaluates its valuation methods on a regular
basis in order adequately to track fluctuations in portfolio value.
The Group monitors the coming ten years’ net collection forecasts
for all portfolios on a monthly basis and discounts the forecasts
accordingly. The portfolio forecast curve initially used in fair value
calculations is the portfolio’s acquisition curve. These forecast curves
serve as the basis for calculating the fair value for each portfolio. The
result then represents the portfolio’s new fair value.

Hoist Finance AB (publ) • Interim report January – June 2015 28
Notes
Note 2 Financial instruments, cont.
The discount rate corresponding to the market rate of return is
updated regularly and reflects actual rates of return on relevant and
comparable market transactions. The portfolios are valued at a 12 per
cent IRR (Internal Rate of Return) over a ten-year period, which is in
line with prevailing and relevant market transactions.
Fair value measurements The Group uses observable data to the greatest possible extent when
assessing the fair value of an asset or a liability. Fair values are catego-
rised in different levels based on the input data used in the valuation
approach, as per the following:
Level 1) Quoted prices (unadjusted) on active markets for identical
instruments.
Level 2) Based on directly or indirectly observable market inputs not
included in Level 1. This category includes instruments valued
based on quoted prices on active markets for similar instru-
ments, quoted prices for identical or similar instruments
traded on markets that are not active, or other valuation
techniques in which all important input data is directly or
indirectly observable in the market.
Level 3) According to inputs that are not based on observable market
data. This category includes all instruments for which the
valuation technique is based on data that is not observable
and has a substantial impact on valuation.
The following table presents the financial instruments referenced in
the balance sheet for informational purposes and thus measured at
fair value:
Group, 30 Jun 2015
SEK thousand Loan portfolios Financing Carrying value Fair value Level 1 Level 2 Level 3
Treasury bills and Treasury bonds 1,723,545 1,723,545 1,723,545 1,723,545Acquired loan portfolios
Of which, carried at fair value 1,324,710 1,324,710 1,324,710 1,324,710 Of which, carried at amortised cost 7,410,001 7,410,001 7,569,701 7,569,701
Bonds and other securities1) 3,299,691 3,299,691 3,299,691 3,299,691Derivatives 47,757 47,757 47,757 47,757Total assets 8,734,711 5,070,993 13,805,704 13,965,404 5,023,236 47,757 8,894,411
Additional purchase price liability 67,334 67,334 67,334 67,334Derivatives 39,951 39,951 39,951 39,951Senior unsecured debt 1,458,626 1,458,626 1,490,944 1,490,944Subordinated liabilities 334,773 334,773 410,596 410,596Total liabilities 1,900,684 1,900,684 2,008,825 1,941,491 67,334
1) Bonds and other securities include SEK 25 million in shares. The shares are reported at acquisition cost as there are no quoted prices, and it has not been possible to estimate a reliable fair value using accepted valuation methods.
Group, 31 Dec 2014
SEK thousand Loan portfolios Financing Carrying value Fair value Level 1 Level 2 Level 3
Treasury bills and Treasury bonds 2,316,110 2,316,110 2,316,110 2,316,110Acquired loan portfolios
Of which, carried at fair value 1,460,229 1,460,229 1,460,229 1,460,229 Of which, carried at amortised cost 7,126,553 7,126,553 7,311,207 7,311,207
Bonds and other securities1) 1,926,241 1,926,241 1,926,241 1,926,241Total assets 8,586,782 4,242,351 12,829,133 13,013,787 4,242,351 8,771,436
Derivatives 246,724 246,724 246,724 246,724Senior unsecured debt 1,493,122 1,493,122 1,681,899 1,681,899Subordinated liabilities 332,796 332,796 386,750 386,750Total liabilities 2,072,642 2,072,642 2,315,373 2,315,373
1) Bonds and other securities include SEK 25 million in shares. The shares are reported at acquisition cost as there are no quoted prices, and it has not been possible to estimate a reliable fair value using accepted valuation methods.

Hoist Finance AB (publ) • Interim report January – June 2015 29
Notes
Note 2 Financial instruments, cont.
For acquired loan portfolios, the valuation approach, key input data
and valuation sensitivity for material changes thereto are described in
this note (above).
Derivatives used for hedging have been model-valued in cases
where interest and currency market rates were used as input data.
Bonds are valued based on quoted rates. Fair value of financing in
the form of bonds and other subordinated liabilities was deemed to
correspond to amortised cost. Bond buy-backs were reported net on
the liability side.
Carrying amounts for accounts receivable and accounts payable
are deemed to correspond to fair value. The fair value of current
loans corresponds to their carrying value due to the limited impact of
discounting.
No transfers between any of the levels took place during the
period.
In December 2014 Hoist Kredit acquired 100 per cent of the shares in
Kancelaria Navi Lex. As at 31 December 2014, SEK 8,549 thousand of
the purchase price remained unsettled. The amount was paid during
the first quarter of 2015.
Since the acquisition took place as late as 30 December 2014,
additional consideration was not included in the acquisition analysis.
Subsequent adjustments to the acquisition analysis include additional
consideration, which may range between SEK 0 million and SEK 83
million and be paid during the period 2015-2018. Management’s as-
sessment is that the maximum additional purchase consideration will
be payable, which is why SEK 81,409 thousand is referenced in the ac-
quisition analysis. The discount effect of the additional purchase price
Note 3 Business combinations
totals SEK 4,976 thousand and gives rise to an additional surplus value
of SEK 76,433 thousand. Of the additional consideration, SEK 9,436
thousand has been paid. The entire amount is attributable to goodwill.
Goodwill is primarily attributable to the Group’s base and organisation
being well suited for further expansion on the Polish NPL market. Navi
Lex has an experienced management team and an efficient organisa-
tion with excellent market knowledge and a network of contacts for
acquiring portfolios and managing collection operations. The Navi Lex
collection system and call centre infrastructure are also well invested.
External collection agencies were used for the Polish portfolios prior to
the acquisition; this is now done internally via Navi Lex, which signifi-
cantly reduces collection costs.
Group, 30 Jun 2014
SEK thousand Loan portfolios Financing Carrying value Fair value Level 1 Level 2 Level 3
Treasury bills and Treasury bonds 1,258,740 1,258,740 1,258,740 1,258,740Acquired loan portfolios
Of which, carried at fair value 1,512,847 1,512,847 1,512,847 1,512,847 Of which, carried at amortised cost 5,498,024 5,498,024 5,675,293 5,675,293
Bonds and other securities1) 1,432,021 1,432,021 1,432,021 1,432,021Derivatives 2,904 2,904 2,904 2,904Total assets 7,010,871 2,693,665 9,704,536 9,881,805 2,690,761 2,904 7,188,140
Derivatives 47,944 47,944 47,944 47,944Senior unsecured debt 740,355 740,355 847,500 847,500Subordinated liabilities 330,952 330,952 353,500 353,500Total liabilities 1,119,251 1,119,251 1,248,944 1,248,944
1) Bonds and other securities include SEK 25 million in shares. The shares are reported at acquisition cost as there are no quoted prices, and it has not been possible to estimate a reliable fair value using accepted valuation methods.
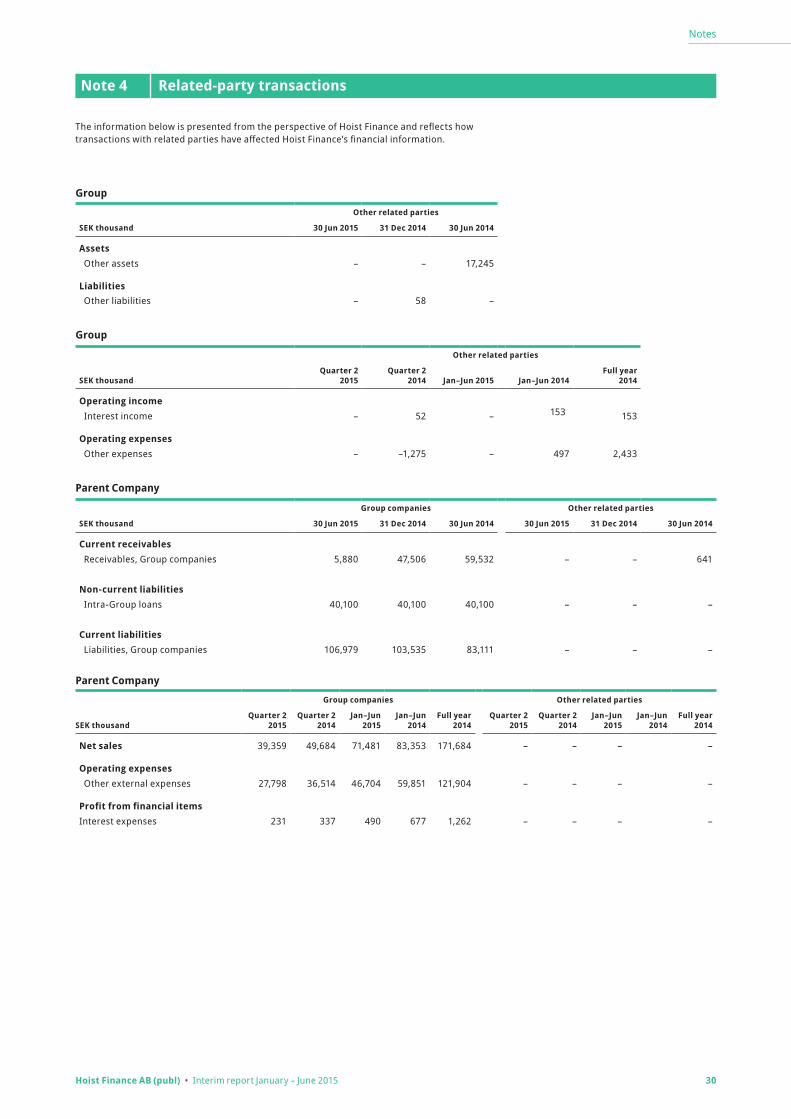
Hoist Finance AB (publ) • Interim report January – June 2015 30
Notes
The information below is presented from the perspective of Hoist Finance and reflects how transactions with related parties have affected Hoist Finance’s financial information.
Note 4 Related-party transactions
Group
Other related parties
SEK thousand 30 Jun 2015 31 Dec 2014 30 Jun 2014
Assets Other assets – – 17,245
Liabilities Other liabilities – 58 –
Group
Other related parties
SEK thousandQuarter 2
2015Quarter 2
2014 Jan–Jun 2015 Jan–Jun 2014Full year
2014
Operating income
Interest income – 52 – 153 153
Operating expenses Other expenses – –1,275 – 497 2,433
Parent Company
Group companies Other related parties
SEK thousand 30 Jun 2015 31 Dec 2014 30 Jun 2014 30 Jun 2015 31 Dec 2014 30 Jun 2014
Current receivables
Receivables, Group companies 5,880 47,506 59,532 – – 641
Non-current liabilities Intra-Group loans 40,100 40,100 40,100 – – –
Current liabilities Liabilities, Group companies 106,979 103,535 83,111 – – –
Parent Company
Group companies Other related parties
SEK thousandQuarter 2
2015Quarter 2
2014Jan–Jun
2015Jan–Jun
2014Full year
2014Quarter 2
2015Quarter 2
2014Jan–Jun
2015Jan–Jun
2014Full year
2014
Net sales 39,359 49,684 71,481 83,353 171,684 – – – –
Operating expenses Other external expenses 27,798 36,514 46,704 59,851 121,904 – – – –
Profit from financial items Interest expenses 231 337 490 677 1,262 – – – –

Hoist Finance AB (publ) • Interim report January – June 2015 31
Notes
This note provides information required to be disclosed under the
provisions of FFFS 2008:25 regarding annual reports for credit institu-
tions and FFFS 2014:12 regarding prudential requirements and capital
buffers. The information relates to Hoist Finance on a consolidated
basis and Hoist Kredit (regulated entity). The only difference between
the consolidated accounts and the consolidated situation for capital
adequacy purposes is that the equity method is applied in the consol-
idated accounts whereas the proportional method is applied for the
joint venture in relation to capital adequacy reporting. When estab-
lishing the company’s statutory capital requirements the following
laws and regulations apply: EU regulation No 575/2013 on prudential
requirements for credit institutions and investment firms; Swedish law
2014:968, Supervision of credit institutions and securities companies;
and Swedish law 2014:966 on capital buffers. The purpose of these
Note 5 Capital adequacy
laws and regulations is to ensure that the licensed institution and its
consolidated situation manages its risks and protects its customers.
The regulations specify that the capital base shall cover capital require-
ments, including minimum capital requirements (capital requirements
for credit risk, market risk and operational risk), and capital require-
ments for all other essential risks (i.e. Pillar II risks).
Own fundsThe table below shows own funds for Hoist Kredit AB (publ) (regulated
entity) and Hoist Finance (consolidated situation) that are used to meet
capital adequacy requirements. To calculate capital ratios (see “Capital
Ratios and Capital Buffers” section below) own funds in each category
are divided by the risk exposure amount (shown in the “Own funds
Requirements” section).
Capital adequacy assessment
Hoist Finance, consolidated situation Hoist Kredit AB (publ)
Own funds, SEK thousand 30 Jun 2015 31 Dec 2014 30 Jun 2014 30 Jun 2015 31 Dec 2014 30 Jun 2014
Common Equity Tier 1, in capital adequacy 2,022,380 1,304,190 1,012,113 2,007,135 1,182,658 875,141Intangible assets –244,380 –171,048 –66,829 –45,627 –45,273 –28,465Deferred tax assets –63,430 –70,885 –63,665 –8,382 –1,249 –1,536Interim profit1) –44,164 – – –104,267 – –Regulatory dividend deduction –1,092 –5,000 –2,500 – – –
Common Equity Tier 1 capital 1,669,314 1,057,257 879,119 1,848,859 1,136,136 845,140Additional Tier 1 capital instruments 93,000 93,000 193,000 93,000 93,000 193,000Regulatory adjustments – – –50,266 – – –59,116
Additional Tier 1 capital 93,000 93,000 142,734 93,000 93,000 133,884
Tier 1 capital 1,762,314 1,150,257 1,021,853 1,941,859 1,229,136 979,024
Tier 2 capital instruments 334,773 332,796 330,952 334,773 332,796 330,952Regulatory adjustments –69,399 –106,655 –140,640 –76,369 –111,814 –152,440
Tier 2 capital 265,374 226,141 190,312 258,404 220,982 178,512
Total capital for capital adequacy purposes 2,027,688 1,376,398 1,212,165 2,200,263 1,450,118 1,157,536
1) Unaudited, i.e. cannot be included in the calculation of CET1 capital.
Own funds requirementsThe table below shows 8 per cent of the risk exposure amounts for Hoist Kredit (regulated entity) and Hoist Finance (consolidated situation).
Hoist Finance, consolidated situation Hoist Kredit AB (publ)
Own funds requirements, SEK thousand 30 Jun 2015 31 Dec 2014 30 Jun 2014 30 Jun 2015 31 Dec 2014 30 Jun 2014
Institutions 141,192 54,575 31,297 62,569 24,704 24,070 – of which, arising from counterparty credit risk 2,270 1,701 1,266 2,270 1,701 1,266Corporates 17,013 11,702 13,275 643,748 425,346 326,433Retail 5,452 8,222 10,474 5,452 7,849 10,474Exposures in default 718,500 707,040 587,775 221,030 234,038 224,588Other items 24,380 18,641 5,298 38,318 139,936 67,683
Credit risk (standardised approach) 906,537 800,180 648,119 971,117 831,872 653,248
Operational risk (basic indicator approach) 140,220 93,379 93,379 47,761 41,049 41,049
Foreign exchange risk 14,738 11,005 19,496 14,738 11,005 19,496
Credit valuation adjustment (standardised approach) – – 254 – – 254
Total own funds requirement 1,061,495 904,564 761,249 1,033,616 883,926 714,046
Total risk exposure amount 13,268,694 11,307,052 9,515,610 12,920,205 11,049,076 8,925,580

Hoist Finance AB (publ) • Interim report January – June 2015 32
Notes
Capital ratios and capital buffersWhen Regulation (EU) No. 575/2013 of the European Parliament and
of the Council entered into force on 1 January 2014 credit institutions
were required to maintain at least 4.5 per cent Common Equity Tier
1 capital, 6 per cent Tier 1 capital and 8 per cent Total capital as a
percentage of the total risk exposure amount. On 2 August 2014, when
Swedish implementation of the Capital Requirements Directive entered
into force, credit institutions became required to maintain certain
capital buffers. Currently Hoist Finance is required to uphold a capital
conservation buffer of 2.5 per cent of the total risk exposure amount.
The table below shows Hoist Finance’s consolidated situation and the
Hoist Kredit AB (publ) regulated entity’s CET 1, Tier 1 and Total capital
as a percentage of the total risk exposure amount. It also shows the
total regulatory requirements in each capital tier.
All capital ratios exceed the minimum requirements and the capital
buffer requirements are within a margin of safety.
Hoist Finance, consolidated situation Hoist Kredit AB (publ)
Capital ratios and capital buffers, % 30 Jun 2015 31 Dec 2014 30 Jun 2014 30 Jun 2015 31 Dec 2014 30 Jun 2014
Common Equity Tier 1 capital ratio 12.58 9.35 9.24 14.31 10.28 9.47Tier 1 capital ratio 13.28 10.17 10.74 15.03 11.12 10.97Total capital ratio 15.28 12.17 12.74 17.03 13.12 12.97
Institution-specific buffer requirements for CET1 capital 7.00 7.00 4.50 7.00 7.00 4.50 of which: Pillar I requirements for CET1 capital 4.50 4.50 4.50 4.50 4.50 4.50 of which: capital conservation buffer requirement 2.50 2.50 – 2.50 2.50 – of which: countercyclical buffer requirement – – – – – –
Common Equity Tier 1 capital available to meet as buffers1) 7.28 4.17 4.74 9.03 5.12 4.97
1) CET1 capital ratio as reported, less minimum requirement of 4.5% (excluding buffer requirements) and less any CET1 items used to meet the Tier 1 and total capital requirements.
Internally assessed capital requirement (Pillar II risks)The internally assessed capital requirement totalled SEK 171m (85).
The capital requirement was increased following adjusted methods for
assessing capital requirements in accordance with Pillar II.
Note 5 Capital adequacy, cont.

Hoist Finance AB (publ) • Interim report January – June 2015 33
Notes
Liquidity riskLiquidity risk is the risk being unable to meet payment obligations due
to insufficient liquidity. Liquidity risk for Hoist Finance is associated
primarily with the Group’s financing, which is based on deposits from
the public and outflows of deposits on short notice. Hoist Finance’s
liquidity risk is low due to the fact that
•depositsarewell-diversified
•morethan99percentofdepositsarecoveredbythestate-
provided deposit guarantee scheme
•theamountofdepositsismanagedbyadjustingreference
interest rates
•fixed-ratefinancingcoversover60percentofHoistFinance’s
fixed assets (acquired loan portfolios)
Pursuant to Swedish Financial Supervisory Authority regulations regard-
ing management of liquidity risks in credit institutions and investment
firms (FFFS 2010:7), Hoist Kredit AB (publ) and Hoist Finance (consoli-
dated situation) shall maintain a separate reserve of high-quality liquid
assets to secure their short-term capacity to meet payment obligations
in the event of lost or impaired access to regularly available funding
sources. The liquidity reserve of Hoist Kredit AB (publ) and Hoist Finance
(consolidated situation) is comprised of unencumbered assets that
enable rapid liquidity creation at foreseeable values, including:
•cashatcreditinstitutions
•depositswithothercreditinstitutionsavailablethefollowingday
•otherassetsthatarebothliquidonprivatemarketsandeligible
for refinancing by central banks.
Hoist Finance, consolidated situation Hoist Kredit AB (publ)
Liquidity position, SEK thousand 30 Jun 2015 31 Dec 2014 30 Jun 2014 30 Jun 2015 31 Dec 2014 30 Jun 2014
Deposits and borrowing from the public 12,768,384 10,987,289 8,913,034 12,768,384 10,987,289 8,913,034Liquidity reserve1) 6,525,605 5,348,625 2,951,830 4,506,691 4,394,508 2,624,395Available liquidity, minimum of SEK 2,544m2) 7,563,943 5,531,632 3,635,449 5,545,029 4,577,515 3,308,015
1) Defined as cash at credit institutions available the next day and liquid debt instruments eligible for refinancing via the Swedish Central Bank.2) Defined as liquidity available within three days.
Hoist Finance, consolidated situation Hoist Kredit AB (publ)
Liquidity funding, SEK thousand 30 Jun 2015 31 Dec 2014 30 Jun 2014 30 Jun 2015 31 Dec 2014 30 Jun 2014
Deposits and borrowing from the public, flexible 7,434,280 7,559,043 6,662,833 7,434,280 7,559,043 6,662,833Deposits and borrowing from the public, fixed 5,334,104 3,428,246 2,250,201 5,334,104 3,428,246 2,250,201Senior unsecured debt 1,458,626 1,493,122 740,355 1,458,626 1,493,122 740,355Convertible debt instruments 93,000 93,000 193,000 93,000 93,000 193,000Subordinated liabilities 334,773 332,796 330,952 334,773 332,796 330,952Shareholders’ equity 2,055,346 1,304,190 1,012,113 2,039,719 1,182,659 854,417Other 693,234 851,432 425,242 265,242 503,267 248,380Balance sheet total 17,403,363 15,061,829 11,614,696 16,959,744 14,592,133 11,280,137
Note 5 Capital adequacy, cont.
On 1 July 2015 Hoist Finance acquired a large diversified banking port-
folio in the UK through the shares in Compello Holdings Limited, a debt
purchase company with self-owned portfolios operating in the UK and
headquartered in Milton Keynes. The acquisition will further strength-
en Hoist Finance’s market position. The total purchase price of SEK
1,256,408 thousand was paid in cash upon completion of the acquisi-
tion. The portfolio value at acquisition was SEK 1,489,921 thousand and
the outstanding capital claim totalled SEK 32,592,281 thousand.
Note 6 Subsequent events
Acquired company’s net assets at date of acquisition:
SEK thousand
Cash and cash equivalents 23,306
Tangible fixed assets 3,965
Accounts receivable and other receivables 1,507,074
Accounts payable and other liabilities –131,528
Non-current liabilities to Group companies –146,409
Total identifiable net assets 1,256,408
The acquisition balance sheet included SEK 1,256,408 thousand in net
assets, including SEK 23,306 thousand in cash and cash equivalents.
Acquisition-related expenses are estimated at SEK 17,700 thousand and
include a stamp duty of approximately SEK 6,200 thousand. Compello
Holdings Limited had SEK 184,683 thousand in income and an operat-
ing profit of SEK 33,028 thousand during the first six months of 2015.
The acquisition will not give rise to any acquisition goodwill, as the en-
tire purchase price is related to the debt portfolios. Compello Holdings
Limited will be consolidated into Hoist Finance Group as of July 2015.
The acquisition calculation is preliminary.

Hoist Finance AB (publ) • Interim report January – June 2015 34
Assurance
Assurance
The Board of Directors and the CEO hereby give their assurance that the interim report provides a true and fair view of the business activities,
financial position and results of operations of the Group and the Parent Company, and describes the significant risks and uncertainties to which
the Parent Company and the Group companies are exposed.
Stockholm, 30 July 2015
Jörgen Olsson
CEO
Board member
Ingrid Bonde
Chair of the Board
Annika Poutiainen
Board member
Costas Thoupos
Board member
Liselotte Hjorth
Board member
Per-Eric Skotthag
Board member
Gunilla Wikman
Board member

Hoist Finance AB (publ) • Interim report January – June 2015 35
Definitions
Acquired loans The total of acquired loan portfolios, run-off consumer loan portfolios, and shares and participations in joint ventures.
Acquired loan portfolios An acquired loan portfolio consists of a number of defaulted consumer loans or debts that arise from the same originator.
Basic earnings per share Profit for the period in relation to the basic weighted average number of shares outstanding.
Common Equity Tier 1 ratio The ratio numerator is the sum of shares issued by the company, share premium reserve, retained earnings, other income, and other reserves after deductions for primary deferred tax assets, intangible fixed assets and goodwill. The ratio denominator is the company’s risk-weighted exposure amount.
Cost/Gross cash collections on acquired loan portfolios
Operating expenses less fee and commission income and other income, divided by the sum of gross cash collections and income from run-off consumer loan portfolios.
EBIT Earnings Before Interest and Tax
EBIT margin EBIT (operating earnings) divided by total revenue.
Fee and commission income Commission generated from third-party collection services.
FTE (Full-Time Equivalent) Average number of employees during the year, based on working hours for which the company pays salary or other compensation. Calculation is based on number of hours worked divided by standard work hours per year.
Gross cash collections Gross cash flow from the Group’s customers on loans included in the Group’s acquired loan portfolios.
Gross 120-month ERC ”Estimated Remaining Collections” - i.e. the estimated remaining gross collection amount on acquired loan portfolios for the coming 120 months.
Liquidity ratio Cash in bank accounts and high-grade liquid bonds that can be made liquid within three days, divided by total deposits from the public.
Net revenue from acquired loan portfolios The sum of gross cash collections from acquired loan portfolios and income from run-off consumer loan portfolios, less portfolio amortisation and portfolio revaluation.
Non-performing loans (NPL) An originator's loan is non-performing as at the balance sheet date if it is past due or will be due shortly.
Portfolio amortisation The share of gross cash collections that will be used for amortising the carrying value of acquired loan portfolios.
Portfolio revaluation Changes in the portfolio value based on revised estimated remaining collections for the portfolio.
Return on assets Net profit for the period divided by average total assets.
Return on shareholders’ equity Net profit for the period divided by average shareholders’ equity during the period.
Total capital ratio The company’s CET1 capital, additional Tier 1 capital and Tier 2 capital divided by the company’s risk-weighted exposure amount.
Total revenue Total of net revenue from acquired loans, fee and commission income, profit from joint ventures and other income.
Year-on-year Comparison between the results for a period and the same period in the previous year.
Year-to-date The period starting from the beginning of the current year (calendar or fiscal year) and continuing to the present day.
Definitions

Financial calendar 2015
Interim report Q3
29 October 2015Year-end report Q4
10 February 2016
Contact
Investor Relations Anne Rhenman-Eklund Group Head of Communications and IR Phone: +46 (0) 8 55 51 77 45 Email: [email protected]
Hoist Finance AB (publ) Corp. ID no. 556012-8489
Box 7848, 103 99 Stockholm Phone: +46 (0) 8 55 51 77 90
The interim report and investor presentation are available onwww.hoistfinance.com
Hoist Finance is a leading debt restructuring partner to international banks. Present in eight countries across Europe, we offer a broad spectrum of flexible and tailored solutions for the acquisition and management of non-performing unsecured consumer loans.In Sweden, we offer the HoistSpar retail deposit service with approximately 80,000 active accounts.
Our Mission – Your Trust
Our strategies
Strengthen and expand position in current markets and grow in selected new markets
Maintain acquisition model and focus on core assets Build on our status as a regulated credit institution Develop debt management models focused on amicable in-house collection Leverage existing economies of scale Maintain and develop unique funding base and leverage on solid capital and liquidity positions
Our business model
Specialisation, experience and a data-driv-en acquisition strategy allow Hoist Finance to acquire attractive portfolios of non-per-forming unsecured consumer loans.
Our proven model for amicable set-tlements generates stable, predicta-ble and long-dated cash flows.
Our medium-term financial targets
Information
Every care has been taken in the translation of this report. In the event of any discrepancy, the Swedish original will supersede the English translation.
Dividends as percentage of net income
25–30%EBIT margin
40%CET1 ratio
13%