intermediation efficiency and productivity of...
TRANSCRIPT

Interdisciplinary Journal of Research in Business Vol. 1, Issue. 9, (pp.12- 26) September, October, 2011
12
INTERMEDIATION EFFICIENCY AND PRODUCTIVITY OF THE
BANKING SECTOR IN KENYA
Anne W. Kamau1
1 Anne Kamau, Ph.D. Africa Research Fellow
Africa Growth Initiative/Global Economy & Development Division BROOKINGS 1775 Massachusetts Ave. NW, Washington, DC 20036
Email: [email protected] www.brookings.edu
ABSTRACT
The main objective of the study is to investigate intermediation efficiency and productivity in the banking sector
in the post liberalization period in Kenya. The study is motivated by the fact that though the banking sector
constitutes a large part of the financial system in Kenya, little is known about its intermediation efficiency and
productivity status. Further banks are awash with liquidity despite private sector credit demand indicating some
inefficiency in the intermediation process in Kenya. This study adopts a non-parametric Data Envelopment
Analysis (DEA) to analyze intermediation efficiency in the banking sector and Malmquist Productivity Index
(MPI) to measure productivity gains of banks in Kenya. The results show that though the banks were not fully
efficient in all respects, they performed fairly well during the period under study. Banks still have reason and
scope to improve performance by improving their technology, skills and enlarging their scale of operations so as
to be fully efficient. Based on the main conclusions, policies encouraging competition, products diversification
to advance loans, risks minimization through increased capital regulation and privatization of some banks are
generally recommended.
Keywords: Banks, Productivity, Intermediation, Efficiency
JEL: G2 D2 G21 G25 E58
1.0 INTRODUCTION
In any economy, the financial sector is the engine that drives economic growth through efficient allocation of
resources to productive units. According to the Central Bank of Kenya Act, one of its primary roles is to foster
liquidity, solvency and proper functioning stable financial system. This legislated function essentially implies a
stable and efficient financial system that underpins intermediation process for economic growth and
development1. The Kenyan financial system comprises banks, non-bank financial institutions, insurance
companies, microfinance institutions, stock brokerage firms, fund managers. The banking industry with asset
base of over Kshs. 1.3 trillion is the largest sector in the Kenyan financial sector. With a limited and under
developed capital market, the banking sector plays pivotal role in intermediation process between savers and
investors.
In recent times there has been serious contention between the Central Bank of Kenya Monetary Policy
Committee (MPC) and the players in the banking industry on the high spread between lending and deposit rates.
Such high spread is indicative of intermediation inefficiencies (Sologoub, 2006). In the Kenya context, the
significant reforms initiatives undertaken, such as operationalisation of credit reference bureaus, payments
system improvements, operationalisation of Microfinance Act and activation of horizontal repos presents
opportunities for enhanced banking sector performance. These reforms are hinged on three key pillars of the
Kenyan financial sector as espoused in the Vision 2030 (the Government Economic Blue Print) - Efficiency,
Stability and Access. Thus, for Kenya to realise Vision 2030, the banking sector‘s efficiency is a critical element
that remains the cornerstone of the targeted economic growth trajectory. In one of his speech at official branch
opening of a Kenyan bank, the Governor of the Central Bank of Kenya, appealing to banks on service delivery
states2:
1 See also speech by the Governor of the Central Bank of Kenya Prof. Ndung‘u on ―Bank regulation reforms in Africa:
Enhancing bank competition and intermediation efficiency‖ at the 12th Seminar by African Economic Research Consortium - March 22, 2010.
2 For details see Governor‘s speech of 26 July, 2007 - Banking sector developments in Kenya. Available online: www.bis.org/review/r070817c.pdf
Interdisciplinary Journal of Research in Business Vol. 1, Issue. 9, (pp.12- 26) September, October, 2011
13
...explore ways of enhancing efficiency in service delivery. By enhancing efficiency banks are capable of offering
more affordable banking services. This has the potential of drawing a larger number of Kenyans to the
financial system resulting in an expandable banking clientele‖
Banking sector efficiency is important for promoting access to financial services as well as stability of the
banking sector as integral component of the financial system. Banks play essential role in the proper functioning
of payments systems and their efficiency is directly related to improved productivity in the economy (Ikhide,
2009). It is against these considerations that this study examines efficiency and productivity of the Kenyan
banking sector.
Owing to importance of banking sector efficiency to macroeconomic stability, a number of country specific
studies on banking sector have been undertaken with mixed results. Although bulk of the studies focused in the
developed economies, a handful of studies have undertaken in the African context. Notable examples are: South
Africa (Ncube, 2009), Tanzania (Aikaeli, 2008), Namibia (Ikhide, 2008; Adongo, Stork and Hasheela, 2005).
Kiyota (2009) examined efficiency of commercial banks in 29 sub-Saharan African studies. Although there is a
growing body of literature that focuses on efficiency and productivity gains, market structure and the
performance of banking industries in other countries (see Casu & Molyneux 2003; Chakrabarti & Chawla 2005;
Girardone, Molyneux & Gardener 2004; Hondroyiannis, Lolos & Papapetrou 1999; Maudos & Pastor 2002), no
major study has been conducted in Kenya.
Further, Kenya needs to go back to her fast growth path. The success in achieving broad-based economic growth
will depend largely on the ability to efficiently utilize the available resources. As a developing country, Kenya
has immense potential for better economic growth in both the short and long-run than it is currently recording.
Therefore, need arises for the efficient allocation of productive resources in order to narrow the gap between the
actual and potential national output. Given the strategic role that Kenya‘s financial sector plays, it is important
for efforts to be directed towards monitoring and formulation of policies that will enhance its efficiency in
allocating resources to different sectors of the economy. This paper is organised as follows. The first section
presents the introduction to the study. Section two reviews literature on efficiency and productivity change and
their application in the banking industry. Section three gives the data and methodology that has been used in the
paper. Section four presents the findings from the estimation results and section five concludes and provides policy
implications of the study.
2.0 LITERATURE REVIEW
The concept of productivity is linked closely with the issues of efficiency and encompasses several efficiency
elements such as price efficiency, allocative efficiency, technical efficiency and scale efficiency. The overall
productivity level of an organization depends on all these elements.
Improvements in efficiency and productivity gains can be considered as one of the goals of a firm in a
competitive market. Therefore, measurements in efficiency and productivity gains provide supplementary
information about the firm‘s performance. These measurements can be considered as non-financial performance
indicators as they consider all of the contributors to the firm‘s performance. In any organization, whether it is
profit-oriented or not, measurements of productivity help to analyze the efficiency of resource use in the
organization. Moreover, productivity indices help to set realistic targets for monitoring activities during an
organizational development process by highlighting bottle-necks and barriers to performance.
Productivity can be measured by using either partial-factor productivity, which is the ratio of output (measured in specific units) to any input (also measured in specific units), or total factor productivity (TFP), which is the
ratio of total outputs to total inputs used in production. Partial measures can be defined for specific operational
attributes such as total revenue per labour unit, expenses as a percentage of total assets, and return on assets. In
contrast, TFP measures estimate the overall effectiveness of utilization of inputs to produce the outputs.
Production frontier analysis (PFA) and index number approaches can be used to estimate TFP.
The index number approach is an alternative method which can be applied for estimating total productivity.
Grifell-Tatje and Lovell (1996) identified the Tornquvist Index, the Fisher Ideal Index (which is geometric mean
of the Laspeyres and Paasche Indices) and Malmquist Productivity Index (MPI) as the main indices that can be
used in productivity analysis. The popularity of the Malmquist index stems from three quite different sources.
First, it is calculated from quantity data only a distinct advantage if price information is unavailable or if prices
are distorted. Second, it rests on much weaker behavioral assumptions than the other two indices, since it does
not assume cost minimizing or revenue maximizing behavior. Third, provided panel data is available, it provides

Interdisciplinary Journal of Research in Business Vol. 1, Issue. 9, (pp.12- 26) September, October, 2011
14
decomposition of productivity change into two components. One is labeled technical change, and it reflects
improvement or deterioration in the performance of best practice manufacturing industries. The other is labeled
technical efficiency change, and it reflects the convergence toward or the divergence from best practice on the
part of the remaining banks. The value of the decomposition is that it provides information on the source of
overall productivity change in the banks. In this paper, the malmquist index is implemented by solving a series of
linear programming problems to construct the distance function that make up the malmquist index. These
distance functions characterize the best practice frontier at any point in time, and they also characterize shifts in the
frontier over time as well as movements towards or away from the frontier.
MPI originally developed by Caves, Christensen and Diewert (1982), has been used in previous studies to
decompose various components of estimated productivity improvements and efficiency. A variant of MPI has
been used to decompose scale efficiency from technical efficiency. In DEA-based efficiency studies, efficiency
losses from scale and managerial decisions have been identified using the MPI (Coelli, Rao and Battese, 1998).
Scale efficiency is measured using BCC-DEA and CCR-DEA models. The estimated efficiency using the
CCRDEA model is identified as technical efficiency. Similarly, the estimated efficiency using BCC-
DEA is identified as pure-technical efficiency (Cooper, Seiford and Kaoru, 2000).
DMUs with estimated efficiency scores of ‗1‘ for both CCR-DEA and BCC-DEA models are considered as
fully efficient (Banker et al., 2004). If there is a difference in the CRS and VRS estimated efficiency for a
particular firm, it is not regarded as a fully efficient DMU (Coelli, Rao and Battese, 1998). The difference
between CCR and BCC estimated efficiencies is regarded as scale inefficiency. It can be decomposed by
dividing the technical efficiency estimated by CCR by the estimated efficiency using BCC. However, the
estimated scale efficiency may distort the real scale efficiency when the sizes of BANKs under consideration are
significantly different (Dyson et al., 2001).
Favero and Papi (1995) indicated that the intermediation approach is most appropriate for banks where most
activities consist of turning large deposits and funds purchased from other financial institutions into loans and
financial investments. Elyasiani and Mehdian (1990b) stressed that the production approach can be applied only
when functional cost analysis data are available. Since the data on the number of deposits and loan accounts are
available only as a part of the functional cost analysis, the ability to use the production approach appears to be
limited. Contrarily, the intermediation approach allows the use of the value of the input and output variables.
Berger, Hunter and Timme (1993), and Berger and Humphrey (1997) presented two literature surveys on the
application of frontier based efficiency and productivity studies in the financial services sector. An interesting
observation of these literature reviews is that only a few studies have addressed efficiency and productivity
issues in developing countries. Previous studies have mainly focused on evaluating efficiency and productivity
gains in the developed countries. Thus, efficiency and productivity in the financial services sector in developing
countries have been given a very low priority by researchers. However, with globalization of financial services
sector activities, it is important to understand the operational performance of the financial services sector in
developing countries as well as the developed countries. The next section of literature investigates the existing
efficiency and productivity gains-related studies in the financial services sector in African countries that
primarily have used DEA to estimate efficiency and productivity gains.
Aikaeli (2008) investigate efficiency of commercial banks in Tanzania. Utilising secondary time series data of
the Tanzanian banking sector, the paper examines technical, scale and cost efficiency of banks. Data
Envelopment Analysis (DEA) model was applied to derive efficiency estimates of banks. Results of the study
suggest that overall bank efficiency was fair, and there was room for marked improvements on all the three
aspects of efficiency examined. Foreign banks ranked highest in terms of technical inefficiencies. Cost
inefficiencies of banks was attributed to inadequate fixed capital, poor labour compensation, less management
capacity as banks expanded and accumulated excess liquid assets.
Ncube (2009) examines the South African banking sector efficiency. The paper focused was on cost and profit
efficiency of banks in South Africa. Applying stochastic frontier model, the paper examined cost and profit
efficiency of four small and four large banks. Results indicated that over the study period (2000 - 2005) South
African banks significantly improved their cost efficiencies and no significant gains on profitability fronts. The
results also indicate that there is a weak positive correlation between cost and profit efficiency of South African
Banks. In addition, most cost efficient banks were also most profit efficient. A regression analysis of cost
efficiency and bank size suggests a negative relationship with cost efficiency declining with increasing bank
size.
Applying standard econometrics frontier approach, Ikhide (2008) examines cost efficiency of commercial banks in

Interdisciplinary Journal of Research in Business Vol. 1, Issue. 9, (pp.12- 26) September, October, 2011
15
Namibia. The cost structure of the banks was estimated using loans as output of the three input factors:
labour, capital and deposit. Results of the study indicate that efficiency of commercial banks can be improved by
increasing their scale of operations. In other words, there are substantial economies of scale to be exploited to
enhance sector‘s efficiency. The findings suggest that more efficient combination of inputs will reduce operating
costs and stimulate efficiency in the Namibian commercial banking sector.
Kiyota (2009) provides a comprehensive banking sector efficiency analysis of sub-Saharan African
countries. The study employs two stage analyses in examination of profit efficiency and cost efficiency of
commercial banks: stochastic frontier approach and Tobit regression. Stochastic frontier approach is utilised to
estimate profit efficiency and cost efficiency, whereas Tobit regression is employed to provide cross-country
evidence of the influence of environmental factors on efficiency African commercial banks. Results of the study
indicate that foreign banks outperform domestic banks for profit efficiency, and entry of foreign banks appears
to have positive performance impacts on domestic banks. Also, Consistent with agency theory postulates, banks
with higher leverage or lower equity are associated with higher profit efficiency. In terms of bank size, smaller
banks are more profit efficient whereas medium size and larger banks are cost efficient. As noted in the paper,
the main limitation of this study is data deficiencies for some years.
3.0 RESEARCH METHODOLOGY
3.1 Data and measurement
The study makes use of annual individual commercial bank data for the 40 banks for thirteen years under study
(1997-2009). The data has been collected from the balance sheets and income statements reported by the
commercial banks to the Central bank, bank supervision department. A complementary source of the data is the
Banking Survey (Oloo Martin, 2010). The data series is fairly long to reflect the situation of commercial
banking sector in Kenya.
The definition of inputs and outputs for the banking sector are derived from the intermediary role that banks
play in the Economy. Financial intermediation process involves the transformation of borrowed funds from
savers (surplus spending units) and lending those funds to borrowers (deficit spending units). Therefore, outputs of
banks in a technical sense are a set of financial services to depositors and borrowers. The intermediation
approach thus regards deposits, capital and labour as inputs, which are used for producing the other banking
outputs such as loans and investments.
The measurement of these inputs and outputs matters. There are three main measurement approaches for
banking outputs and inputs that could be used in efficiency and productivity analysis. They are flow measures
(the number of transactions processed on deposits and loan accounts), stock measures based on money value
(the real or constant monetary values of funds in the deposit and loan accounts), and stock measures based on
the number of deposit and loan accounts serviced (Humphrey, 1991). The majority of efficiency and
productivity studies on banks have applied stock measures based on monetary values due to the more ready
availability of the required information. However, the use of monetary value-based stock measures may distort
estimated efficiency. This notwithstanding, the study uses the monetary value-based stock measures of the
inputs and outputs in the banking sector intermediation process.
3.2 Methodology of Estimating Banks’ Efficiency and Productivity changes
The paper makes use of non parametric approach in measuring the efficiency and productivity in the
intermediation process of the banking sector in Kenya. It is advantageous to use the Non parametric DEA as it
does not require the specification of a particular functional form for the frontier.
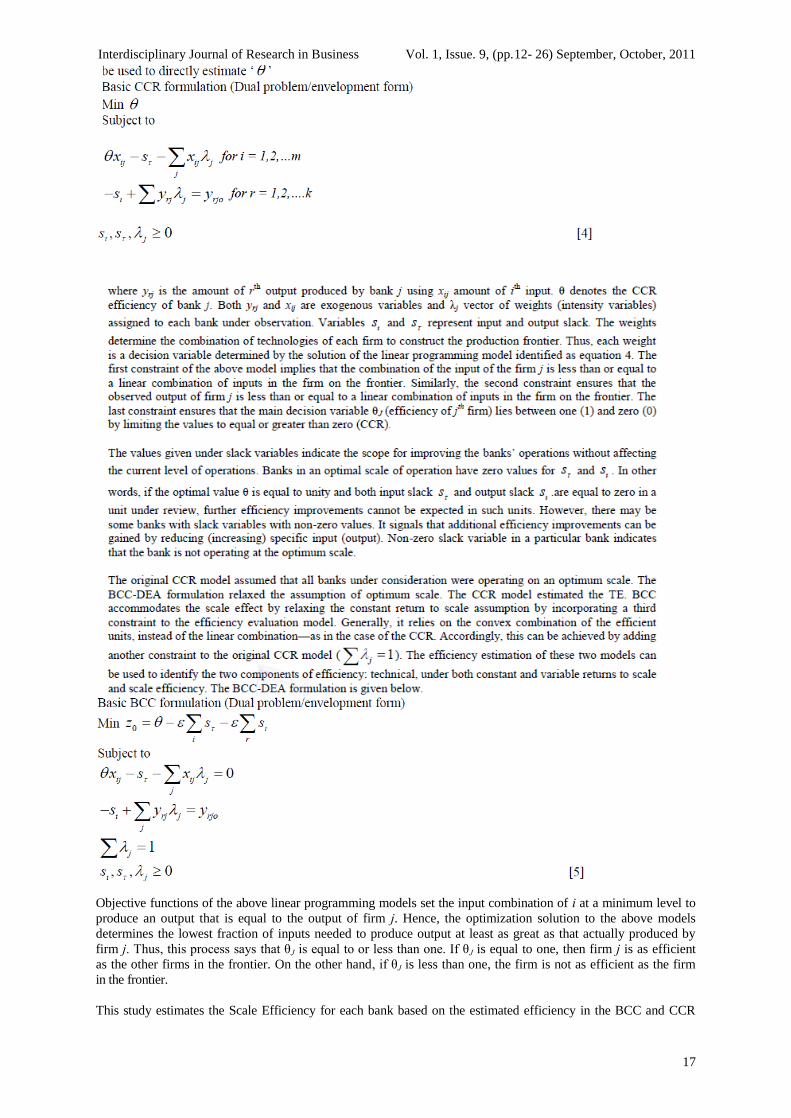
DEA‘s model formulation is as follows; following notations by Seiford et al., (1994). The basic DEA model is
based on a productivity ratio index which is measured by the ratio of weighted outputs to weighted inputs. DEA
extrapolates Ferrell‘s (1957) single-output to single-input technical measure to a multiple-output to multiple-
input technical measure. This model assumes that jth bank uses a ‘m’ dimensional input vector, xij (i = 1,2,…m)
to produce a ‘k‘ dimensional output vector, yrj (r = 1,2,…,k). The bank under evaluation is denoted by ‘0’.

Interdisciplinary Journal of Research in Business Vol. 1, Issue. 9, (pp.12- 26) September, October, 2011
16
Where w0 is the relative efficiency, x and y are the input and output vectors respectively, and ur and vr are the
weights of output r and input i. The above ratio accommodates multiple inputs and outputs in efficiency
stimation and measures the relative efficiency based on input and output weights. However, a unique set of
weights for all banks may be difficult to identify, because different banks have different input and output
combinations (Charnes, et al., 1978) (CCR). CCR proposed the use of a set of weights that accommodates those
differences. They suggested that each bank should assign weights that allow it to be shown more favorably,
compared with all other banks under comparison. Thus, the respective weights for each bank should be derived
using the actual observed data instead of fixing in advance (Cooper, et al., 2000). CCR introduced the following
fractional programming problem to obtain values for input weights and output weights. Basic CCR formulation
where w0 is the relative efficiency, x and y are the input and output vectors respectively, ur and vr are the
weights of output r, and input i, n, m and k denote the number of banks, inputs and outputs respectively. The
above fractional programming problem is based on the objective to estimate the optimum input and output
weights for each bank under evaluation. It measures the relative efficiency of bank0 based on the performance of
the other banks in the industry. For that, the weighted input and output ratio is maximised subject to given
constraints. The first constraint of the model limits the estimated efficiency of the banks to one. The second
constraint in the above model indicates that all variables, including input and output weights, are non-negative.
Estimated input and output weights are used to find the efficiency index ‗w‘. The fractional programming
problem can be transformed into a linear programming model (CCR), as illustrated in equation (3). Basic CCR formulation (Multiplier form)
The above linear programming problem aims to maximize the sum of weighted outputs of bank0 subject to
virtual inputs of bank0 while maintaining the condition that the virtual outputs cannot be exceeded by virtual
inputs of any banks. Both the fractional programming problem and the linear programming problem have the
same objective function. CCR-inefficient firms are given an efficiency ratio W0 < 1. Efficiency indices of
efficient firms are equal to ‗1‘. Furthermore, there is at least one efficient unit that is used as the referencing unit
for estimating relative weights for the inefficient units. Both linear programming problems outlined above can
Interdisciplinary Journal of Research in Business Vol. 1, Issue. 9, (pp.12- 26) September, October, 2011
17
Objective functions of the above linear programming models set the input combination of i at a minimum level to
produce an output that is equal to the output of firm j. Hence, the optimization solution to the above models
determines the lowest fraction of inputs needed to produce output at least as great as that actually produced by
firm j. Thus, this process says that θJ is equal to or less than one. If θJ is equal to one, then firm j is as efficient
as the other firms in the frontier. On the other hand, if θJ is less than one, the firm is not as efficient as the firm
in the frontier.
This study estimates the Scale Efficiency for each bank based on the estimated efficiency in the BCC and CCR

Interdisciplinary Journal of Research in Business Vol. 1, Issue. 9, (pp.12- 26) September, October, 2011
18
models. This analysis has helped to identify the effectiveness of existing scales of operation.
The MPI uses a distance function approach to measure productivity improvements. Following from the previous
section on DEA, if inefficiency does exist, the movements of any given bank over time will depend on both its
position relative to the corresponding frontier (technical efficiency) and the position of the frontier itself
(technical change). These enable us to distinguish between improvements emanating from the bank‘s catch up to
the frontier and that resulting from the frontier shifting up over time. For this purpose, the output - oriented
Malmquist index is used to assess the sources of factor productivity change in banks. The index decomposes
total factor productivity change into efficiency change and technological change. Malmquist index is written as
follows:
Total productivity change =Efficiency change XFrontier shift
The first element of the equation on the right hand side stands for the efficiency change, and the second element
stands for the frontier shift between time period ‗t‘ and ‗t+1‘. Based on the above equation, two separate
equations have been constructed to estimate the efficiency change and impact of frontier shift (Fare et al., 1994).
The study thus uses the MPI in computing the productivity indices for the commercial banks in Kenya.
4.0 STATISTICAL RESULTS AND FINDINGS
Analysis of commercial banks efficiency is discussed with special focus on the main bank categories consisting
of size in three groups large banks, medium banks and small banks and ownership in this case we have foreign
and local. Under the local banks they are divided into two public and private banks. It is important to note that
with the exception of one bank that is fully Corporate bank, all the other commercial banks are mainly retail
banks with some Corporate banking. The study excludes the one fully Corporate bank from the sample so that
the results may not be biased. The Malmquist indexes are computed too to determine the productivity of the
banking sector. The DATA Envelopment Analysis program (DEAP) of Coelli version 2.1 is used to compute
productivity and efficiency measures presented in this section. The Multistage DEA is used to compute the
efficiency measures such as overall technical efficiency (OTE), pure technical efficiency (PTE) and scale
efficiency (SCE) measures.
4.1 Overall Commercial Banks Efficiency
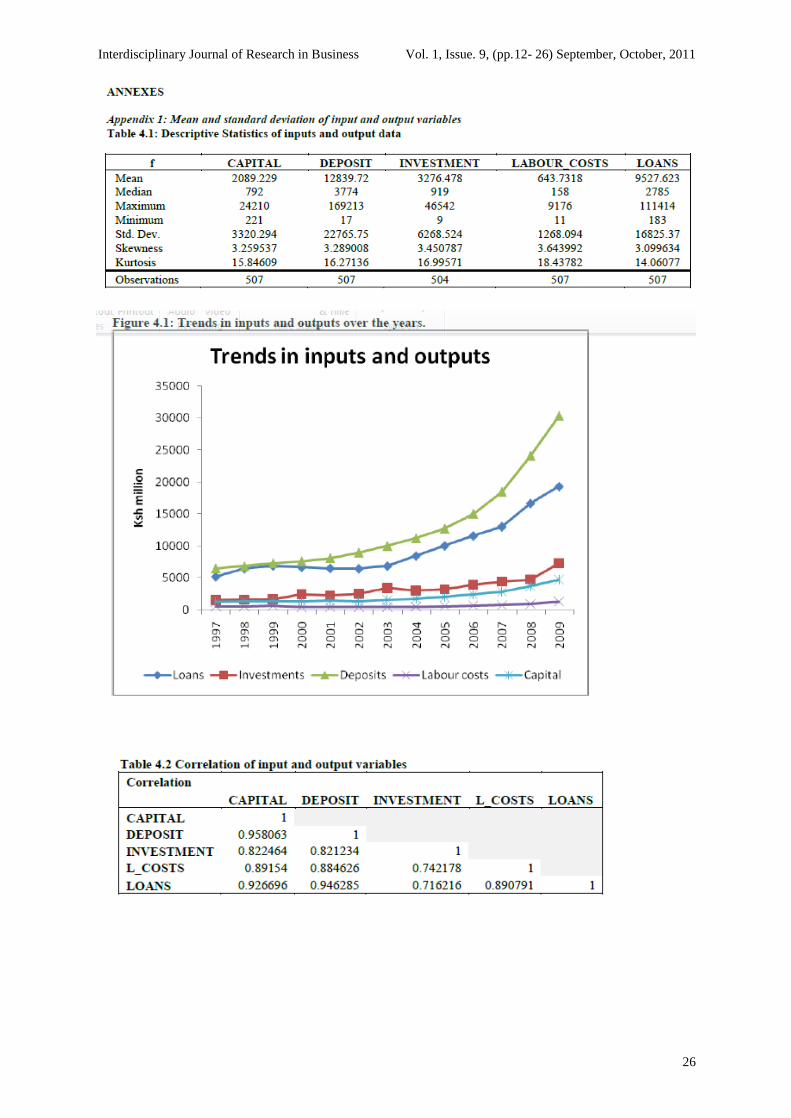
The mean values, standard deviations and correlation coefficients of inputs and output variables used in the
efficiency analysis are presented in the appendix 1 Tables 4.1, 4.2 and figure 4.1. The statistics indicate that all
the inputs and outputs have increased in their mean terms from 1997-2009. Almost all the variables indicate
high standard deviations. Correlations among input and output variables can be used to show the
appropriateness of such variables. The recorded high correlation coefficients between input and output variables,
confirm that selected input and output variables for performance evaluations are appropriate. The remainder of
this section presents the estimated efficiency scores.
Figure 4.2 and Tables 4.3 presents the results of efficiency scores for all the commercial banks in Kenya. In

Interdisciplinary Journal of Research in Business Vol. 1, Issue. 9, (pp.12- 26) September, October, 2011
19
general the performance of the commercial banks in Kenya in the period 1997-2009 has been above 40 percent
efficient for most of the banks. The findings show that most of the commercial banks have been operating at the
decreasing returns to scale part for the same period. That means that when inputs increased in the period, the
output increased by less than proportionate increase in the inputs. This means that the commercial banks have
been operating on the rising part of the average long run cost curve. This is indeed supported by evidence
gathered in a recent banking survey conducted in Kenya in 2010(Oloo, 2007). Further, the banks in Kenya have
excess funds liquidity than they should hold. It is evident that Kenyan banks liquidity averages 40 percent which
is 20 percent above what they are required to hold. Holding of these idle funds has implications as to the
efficiency of the intermediation process of the Kenyan banks. There is a definite need for credit in the economy
and retaining it in the banks not only increases cost in the banks but undermines the development and growth
process of the economy by not availing funds. Below is a graph indicating efficiency measure for commercial
banks in Kenya for the period 1997-2009.
In general the overall average efficiency in the banking sector is about 47 percent for the technical eff iciency
under the constant returns to scale, 56 percent efficient under the variable returns to scale and 84 percent under
scale efficiency. The scale efficiency level of 84 percent shows that commercial banks are 16 percent scale
inefficient. The technical efficiency of 47 percent and 56 percent under the constant returns to scale and variable
returns to scale imply that the commercial banks in Kenya could have increased outputs by 53 percent and 44
percent in the thirteen years period under study had they been 100 percent efficient.
From the graph, we note an upward trend line implying efficiency in the banking sector is improving over the
years. Scale efficiency picks up from 1997 and continues on an upward trend till 2006 where it falls afterwards.
The fall in 2006 may be attributed to the elections expectations in the year following year 2007. The same
period is backed up by new entrants into the banking sector. In year 2004 two microfinance institutions were
converted into full fledged banks thus expanding the banking operations in the country. This may have led to
some increased output in the period. The same results are tabulated in table 4.3 below.
Bias corrected results are presented below.
One of the main drawbacks of non-parametric techniques is their determistic nature. This is what has
traditionally driven Economic literature to describe them as non-statistical methods. Further, due to the
complexity and multidimensional nature of the DEA estimators, their sampling distributions are not easily
obtainable. The bootstrap provides us with a suitable way to analyze the sensitivity of efficiency scores relative
to the sampling variations of the calculated frontier by avoiding the drawbacks of asymptotic sampling
distributions. The bootstrap is based on the idea that the known bootstrap distribution will mimic the unknown
sampling distribution of the estimator of interest Through the bootstrap, the bias of the original estimator can be
calculated, and the original estimator corrected for the bias. In particular, as earlier mentioned output oriented
DEA is used in the study and these scores are a higher bound of the true efficiency scores. A bias corrected
estimator of the true value of the DEA score is computed using the bootstrap. The results are presented in table 4.4 below.
The conclusions reached with the scores adjusted for bias using bootstrap are similar as before though
insignificantly lower with lower efficiency scores.
Slack Values
It is observed for the summary of input slacks that technical inefficiency arose more from the inefficient use of
deposits and capital rather than under utilization of labour in the intermediation process in the later years of
2004 - 2009. In the earlier years 1997 to 1999 inefficiencies emerged from the use of labour. However, the use
of labour more effectively has improved over time and has been the least contributor to inefficiencies in the later
years. The period 2007-2009 show an improvement from the period 1997-1999 moving from 679.96 and 187.96
in the case of labour in contrast to the use of deposits that move from 1,223.61 to 11,178.17 for the same period.
The later years 2005-2009, show the rate of accumulation of deposits exceeded the rate of loan given out for that
the period hence the high value of slack input for deposits. This undermines the efficiency of the commercial
banks intermediation process and reflects a situation where banks keep excess liquidity than is necessary for
efficient service provision. In the case of labour, is an indication of improved utilization of that factor in
production in the period 2005-2009 thus contributing to efficiency of the commercial banks. The earlier years
1997-1999, the situations reflect a situation where labourers were not fully utilized.

Interdisciplinary Journal of Research in Business Vol. 1, Issue. 9, (pp.12- 26) September, October, 2011
20
4.3 Efficiency by Types of banks
Banks are classified according to size and ownership. Classification on the basis of size is done based on asset
size of the banks. Large banks have asset base of Ksh. 20- 120 billion, medium banks have an asset base of Ksh.
4 -20 billion and small banks have asset base of Ksh 1-3 billion. Ownership is mainly in the two categories
foreign and local. Local is further divided into private and public. It is assumed that banks in the same group are
homogenous in nature and portray the same characteristics.
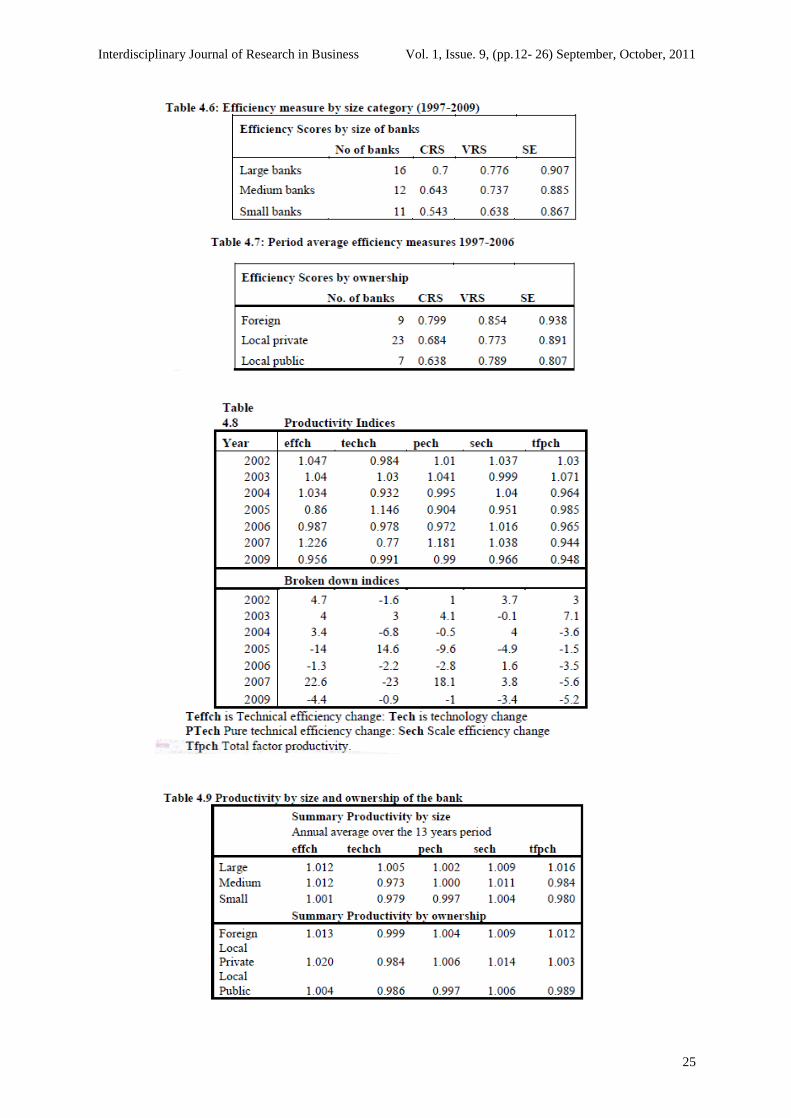
From the results, Table 4.6, the general finding is that large banks in Kenya are most efficient followed by the
medium banks and finally the small banks. One bank in the large category operates in the efficient frontier and
this is the best practice bank.
The bank is foreign-owned implying foreign banks set the pace for the Kenyan case in terms of efficiency in
running their banks. Small banks are mainly local-owned and show the lowest efficiency measures in the
categories of banks based on size. In terms of scale-efficiency, the small banks show the largest deviation from
the efficiency frontier. Scale inefficiency means underutilization of productive capacity or a situation where
production is taking place at a point below scale efficient frontier. Scale inefficiency for the banks is
approximately 10 percent, 12 percent and 14 percent for the large-sized banks, medium banks and small banks,
respectively. In terms of returns to scale, these banks are supposed to catch up by exhausting the remaining
capacity to achieve full efficiency. Similar results with similar conclusions are found for banks with large
branch networks. Large banks have the largest branch networks with the largest customer base followed by
medium banks and small banks.
From theory, it is expected that the size of the production firm matters positively with regard to economies of
scale and thus increasing possibility for large banks to rank high in performance analysis. This is found fairly
true in the Kenyan banking sector for the period analyzed. The large banks are found to be more efficient than
the small and medium banks. This implies a majority of the large sized banks operate closely to the frontier and
this is attributed to availability of resources to adopt new/latest technology thus leading to efficiency in
production. Further, large banks can benefit from economies of scale emanating from large scale production.
In terms of ownership structures, foreign banks seem to be most efficient followed by local private, then local
public. A number of reasons can be given for difference between foreign and local banks that is access to
technology and ease of technology transfer, managerial skills since foreign banks are generally multinational
companies. The scale inefficiencies measures are 7 percent, 11 percent and 20 percent for foreign banks, local
private and local public. For the banks to be full scale efficient they are supposed to exhaust their 7 percent, 11
percent and 20 percent of underutilized production scale.
Foreign banks have been expanding their branch networks in the country as the local banks have been inefficient
in service delivery. The way the Kenyan banks operate is interesting in the sense that some foreign banks
concentrate strategically in some certain highly profitable towns and target large number of corporate customer
niches, large local banks have their branches spread in many regions in the country. Whereas some foreign
banks refrain from retail banking to specialize in corporate products, large domestic banks are not very much
discriminatory in terms of clientele composition. These strategic business modalities have a good deal with
banks profitability and can have implications on measured efficiency.
4.4 Malmquist Indices of Efficiency Change
The investigation of productivity growth is achieved by applying a non-parametric method developed by Fare et
al. (1989) which computes total factor productivity (TFP) growth using a Malmquist index of productivity
change. Within this framework, productivity growth may occur due to a combination of industry-wide
technological change, that is, a shift in production surface, and a change in technical efficiency at the level of
the operating unit, which is movement towards or away from the production surface. The Malmquist index can
be decomposed to capture these two components, technological change and change in technical efficiency.
Furthermore, the efficiency component can be decomposed into a pure technical and a scale efficiency change
component.
Technical efficiency indicates the degree to which the operating unit produces the maximum feasible output for a given level of inputs, or uses the minimum amount of feasible inputs to produce a given level of output.
Higher efficiency from one period to another does not necessarily suggest that the operating unit achieves higher productivity since technology may have changed.

Interdisciplinary Journal of Research in Business Vol. 1, Issue. 9, (pp.12- 26) September, October, 2011
21
4.4.1 Productivity changes
Figure 4.3 and Table 4.8 below gives the efficiency scores broken down into their respective components. The
results indicate that total factor productivity increased by 3 percent, 7.1 percent, in years 2002 and 2003 and
declined by -5.6 percent and -5.2 percent in years 2007 and 2009 respectively. For the whole banking industry,
the resultant increase in total factor productivity was a result of a positive technical efficiency change of 4.7
percent and 4 percent coupled with improved technological change of (-1.6) and 3.0 respectively. The
inefficiencies in the banking sector may further be decomposed to pure technical inefficiency and scale
inefficiency changes. For instance there are scale inefficiencies in the year 2003 of 0.1 and positive pure
efficiency gains of 4.1. The productivity gains reflect well the efficiency scores earlier discussed.
It is expected that the banks with the greatest efficiency should show some technology improvement and this is
the case. The performance of large banks shows increase in technological innovations by the largest percentage
as compared to medium and small banks. Large banks are mainly foreign-owned and have resources to spend in
new technology. Further, by virtue that they are foreign-owned there is transfer of technology from the mother
banks in Europe, America and other affiliation countries. The local banks falling under this category of large
banks have also improved their technology. Likewise the foreign owned banks show the highest productivity
index.
The results show that the medium banks and small banks have to build capacity for technological innovations.
They can invest in technology and improve on their efficiency to reach the full scale efficiency. Given the high
cost that is associated with technology investment they need to look for resources.
5.0 CONCLUSION
This paper examines the trends in efficiency and productivity changes of the banking industry during the
postliberalization period. Efficiency scores and total factor productivity growth are estimated using the
outputoriented DEA model. Three inputs and two outputs specifications are used to represent efficiency
and productivity gains in intermediation process. A general remarkable observation on estimated commercial
banks efficiency scores is that banks in Kenya performed fairly well during the period. The commercial
banks‘ efficiency score was not less than 40 percent at any one point.
In terms of ownership and size, foreign banks are found to be more efficient than local banks. And in the local category local private are more efficient than local public. Large sized banks are found to be more efficient than
medium and small banks. It is further observed from the summary of slacks, that the inefficient use of deposits
rather than under utilization of capital and labour in the intermediation process is the cause of the inefficiency.
The banking industry is technology based and the results suggest situation where commercial banks keep excess
liquidity than is necessary for efficient service provision.
Since large banks and foreign owned banks are most efficient as compared to medium banks small Banks and
Local Banks. This perhaps indicates a case for privatization of local banks in Kenya, if not, then Policies be put in
place directed towards improving efficiency and productivity locally owned banks. Furthermore, the move by the
minister for finance to increase capital requirements to 1 billion by 2012 in Kenya is a welcomed policy
directive as the results confirm small banks are most inefficient and least productive.
The estimated total factor productivity indicates an improvement in the productivity in banks emanating from
technological change. The improvement was mainly experienced in larger banks and foreign owned banks. This
validates that Kenyan banks have been productive with productivity emanating from technology change in the
post liberalization period. The reforms being undertaken have enhanced competition, branch expansion, product
diversification ought to continue, so as the banking sector may continue on its growth path.
The declining efficiency and productivity in the later years indicates potential for increase in outputs -Loans and
investments in the banking sector. Banks have been successful in mobilizing resources deposits through
improved technology/innovations and product offering. Now this should translate into increased output of loans
and investments, through reduced prices (interest rate spread) and improve on their productivity. Policies to
enhance Loan advancement at good prices be encouraged or policies to enhance competitive pricing to ensure
advancement of loans may be pursued. This will improve intermediation in the banking sector.
REFERENCES
Interdisciplinary Journal of Research in Business Vol. 1, Issue. 9, (pp.12- 26) September, October, 2011
22
1. Aikaeli Jehovaness (2008), ―Commercial Banks Efficiency in Tanzania‖, Bank of Tanzania Monetary
and Financial Affairs Department, A Paper Presented in a CSAE Conference on ―Economic Development in
Africa‖, Held at St. Catherine‘s College, Oxford, 16th - 18th March 2008.
2. Banker, R. D, Cooper, W. W, Seiford, L. M, Thrall, R. M and Zhu, J., (2004), ―Returns to Scale in
Different DEA Models‖, European Journal of Operational Research, vol. 154, no. 2, pp. 345-62.
3. Berger, AN, Hunter, WC and Timme, SG 1993, ―The Efficiency of Financial Institutions: A review and
preview of research past, present and future‖, Journal of Banking and Finance, vol. 17, no. 2-3, pp. 221-49.
4. Berger, A. N. and Humphrey, B. C. (1997) ―Efficiency in financial institutions: International survey
and directions for future research‖, European Journal of Operational Research,98, pp. 175-212
5. Caner S. and Kontrorovich V. (2004), ―Efficiency of the Banking Sector in the Russian Federation
with International Comparison‖, Ekonomicheski Journal, vol. 8, pp. 357-375.
6. Casu, B and Molyneux, P 2003, ―A Comparative Study of Efficiency in European Banking‖,
Applied Economics, vol. 35, no. 17, p. 1865-76.
7. Chakrabarti, R. and Chawla, G. (2005), ―Banking efficiency in India since the reforms‖, Money and
Finance, Vol. 9 No.2, pp.31-47.
8. Charnes, A, Cooper, W.W and Rhodes, E (1978), ―Measuring Efficiency of Decision Making Units‖,
European Journal of Operation Research, vol. 2, no. 6, pp. 429-44.
9. Caves, DW, Christensen, L. R. and Diewert, W. E., (1982), ―The Economic Theory of Index Numbers and
the Measurement of Input, Output, and Productivity‖, Econometrica, vol. 50, no. 6, pp. 1393-414.
10. Claessens C. Jansen M. (2000), The Internationalization of Financial Services: Issues
and Lessons for
11. Developing Countries. Dordrecht, Holland: Kluwer.
12. Coelli, T., Rao, D.S.P., Batesse, G.E. (1998), An Introduction to Efficiency and Productivity Analysis,
Kluwer Academic Publishers, Boston, MA,
13. Cooper, W. W., Seiford, L. M. and Kaoru, T., (2000), Data Envelopment Analysis; A comprehensive Text
with Models, Application, References and DEA-Solver Software, Kluwer Academic Publishers, Boston.
14. Fare, R., S Grosskopt and C. A. K Lovell (1985), The Measurement of Efficiency of Production,
Kluwer Academic Publishers, Boston
15. Fare, R, Grosskopf, S, Lindgre N, B and Roos, P 1994, ―Productivity change in Swedish pharmacies
1980-
1989: A non parametric Malmquist approach‖, in A Charnes, WW Cooper, A Lewin and L Seiford (eds),
Data Envelopment Analysis:
16. Farrell, M. J, (1957), ―The Measurement of Productivity and Efficiency‖, Journal of the Royal
Statistical Society (Series A- General), vol. 120, no. 2, pp. 253-81.
17. Favero, CA and Papi, L (1995), ―Technical Efficiency and Scale Efficiency in the Italian Banking Sector:
A Non-parametric Approach‖, Applied Economics, vol. 27, no. 4, pp. 385-96.
18. Girardone C, Molyneux P, and Gardener E. P.M, (2004), ―Analysing the determinants of bank efficiency: the
case of
Italian banks‖, Applied Economics, Taylor and Francis Journals, vol. 36(3), pages 215-227, February
19. Grifell-Tatje, E and Lovell, C. A. K., (1996), ―Deregulation and Productivity Decline: The Case of
Spanish Savings Banks‖, European Economic Review, vol. 40, no. 6, pp. 1281-303.
20. Hondroyiannis, Lolos & Papapetrou (1999),‖Assessing Competitive Condition in the Greek Banking
system‖, International Financial Markets, Institutions and Money, Vol. 9, no. 4, pp. 377-91.
21. Humphrey, D. B. (1991), ―Productivity in Banking and Effect from Deregulation‖, Economic Review,
Federal Bank of Richmond, Vol.1991 March/April.
22. Ikhide, S. I. (2008). ―Measuring the operational efficiency of commercial banks in Namibia‖, South
African Journal of Economics. Vol. 76, no. 4, pp. 586 - 95
23. Kiyota, H (2009), ―Efficiency of Commercial Banks in Sub-Saharn Africa: A comparative Analysis of
domestic and foreign banks‖, A Paper Presented in a CSAE Conference on ―Economic Development in
Africa‖, Held at the University of Oxford, 22nd
to 24th March 2009.
24. Levine R., Loayza N. and Beck T, (1999), ―Financial intermediation and growth: Causality and causes‖,
Policy
Research Working Paper Series 2059, The World Bank.
25. Martin Oloo (2007), BANKING SURVEY, Kenya.
26. ----------------, (2008), BANKING SURVEY, Kenya.
27. Maudos & Pastor, (2002), ―Competition and efficiency in the Spanish Banking Sector‖, Applied
financial Economics, vol. 12, no 7, pp505-16
28. McKinnon, R. I. 1973. Money and Capital in Economic Development. Washington D.C.:
Brookings Institution. 29.
Ncube, M (2009). ―Efficiency of the Banking sector in South Africa‖, A Paper presented at African

Interdisciplinary Journal of Research in Business Vol. 1, Issue. 9, (pp.12- 26) September, October, 2011
23
Economic
Conference on ―Fostering development in an era of economic and financial crises‖, held at Addis Ababa on
11th
- 13th November 2009
30. Sologoub, D (2006). ―The determinants of bank interest margins and profitability:
Case of Ukraine.
31. www.bof.fi/bofit/seminar/bofcef06/sologoub.pdf TABLES AND FIGURES
Figure 4.2: Scale efficiency measure for banking sector in Kenya for the period 1997-2009
Figure 4.3 Movement of productivity and efficiency changes

Interdisciplinary Journal of Research in Business Vol. 1, Issue. 9, (pp.12- 26) September, October, 2011
24
Interdisciplinary Journal of Research in Business Vol. 1, Issue. 9, (pp.12- 26) September, October, 2011
25
Interdisciplinary Journal of Research in Business Vol. 1, Issue. 9, (pp.12- 26) September, October, 2011
26