intermodal logistics consulting inc. senanu … travel time performance measures.pdfintermodal...
TRANSCRIPT
Intermodal Logistics Consulting Inc.
Senanu Ashiabor, PhD & Nicholas Hinze
Greensboro Urban Area MPO
Tyler Meyer (AICP) & Lydia Mclntyre
@ 2016 North Carolina MPO Conference, Greensboro
Big data is a broad term for datasets that are so large or complex that traditional data processing applications are inadequate. The popular industry definition is based on 3-Vs of Volume, Velocity and Variety: Increasing Volume (sensor generated data) Speed of data generation (automated data collection) Variety of data structure (numeric, text, video, audio, etc.)
Handling large datasets like these, creates challenges in: Collecting, storing, retrieving, analyzing, sharing, transferring, and
visualizing the data. Privacy and security concerns are also a key issue.
2
Single-Point Sensors: stationary and measure traffic volumes, vehicle classifications, and spot speeds
Multi-Point Sensors: can identify and match vehicles across multiple detectors (Bluetooth, video license plate matching)
Probe data sources/vehicles: measure route specific travel times and can identify slow down points within the route
Area-wide Sensory Data: provide continual coverage over a wide area and are closet to Big Data definition. Examples include cell phone and GPS device tracking
Data Fusion Platforms: Combine all of the above and synthesize out relevant metrics.
3
The goal of our study was to identify a travel time data source the Greensboro Metropolitan Planning Organization (MPO) could use for performance measurement in its Congestion Management Process The MPO needed to identify: Highest Bottleneck Locations Estimate annual Total and Peak Hour Travel Times Estimate Vehicle Hours of Delay Calculate Centerline Miles % Below Free Flow Speed Analyze Corridor Performance
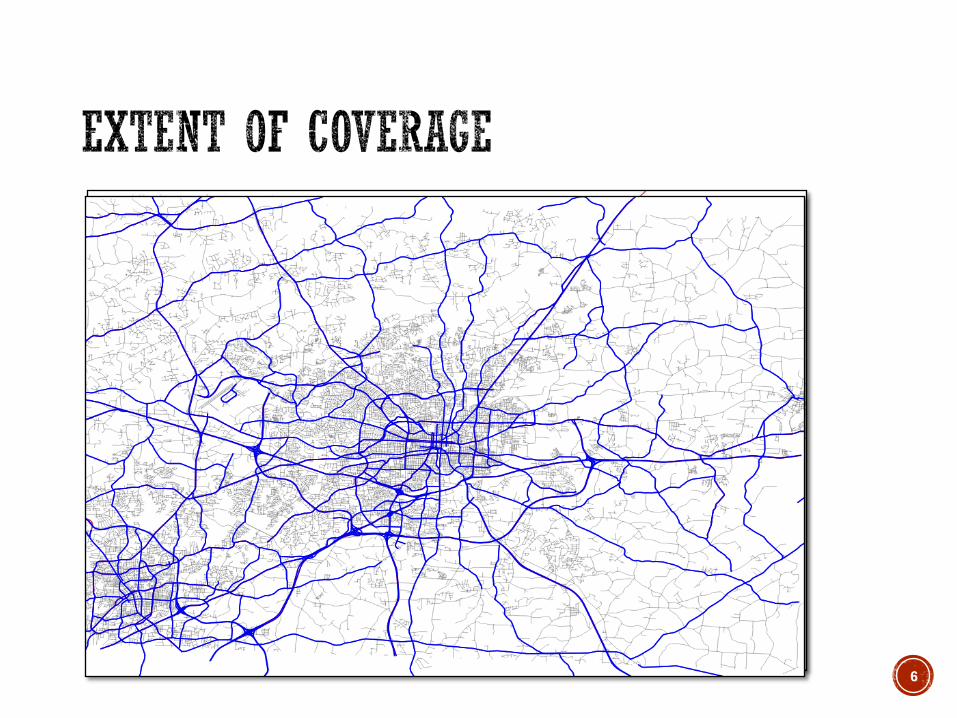
Evaluated two fused area-wide travel time data sources 1. I-95 Corridor Coalition a partnership of States and transportation
agencies along the eastern seaboard from Maine down to Florida (http://i95coalition.org/projects/vehicle-probe-project/)
2. FHWA NPMRDS (National Performance Management Research Data Set)
4
5
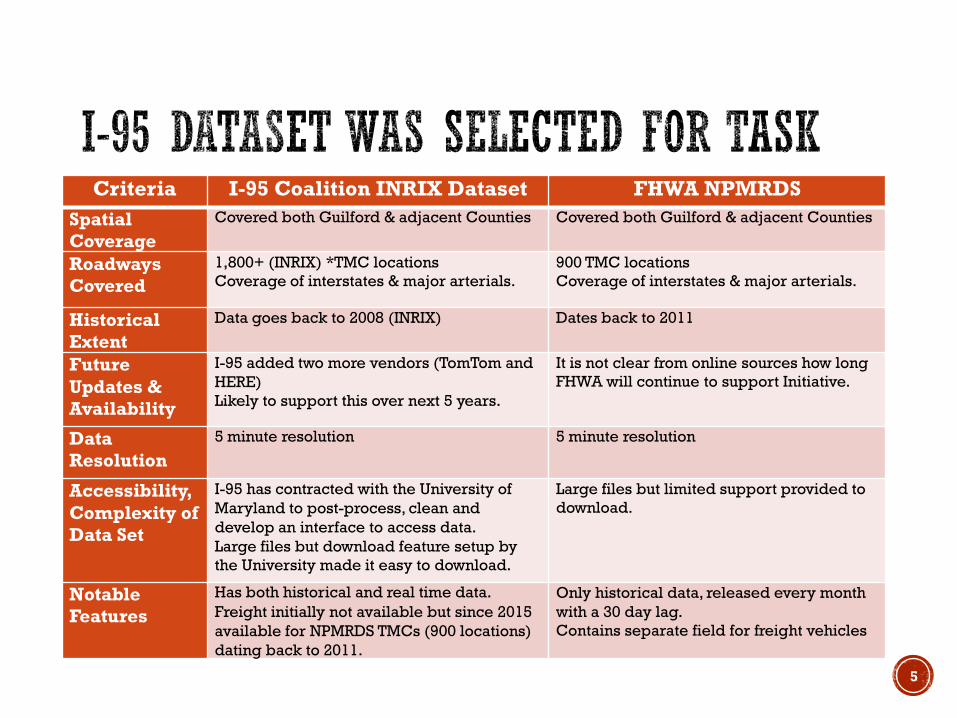
Criteria I-95 Coalition INRIX Dataset FHWA NPMRDS Spatial Coverage
Covered both Guilford & adjacent Counties Covered both Guilford & adjacent Counties
Roadways Covered
1,800+ (INRIX) *TMC locations Coverage of interstates & major arterials.
900 TMC locations Coverage of interstates & major arterials.
Historical Extent
Data goes back to 2008 (INRIX) Dates back to 2011
Future Updates & Availability
I-95 added two more vendors (TomTom and HERE) Likely to support this over next 5 years.
It is not clear from online sources how long FHWA will continue to support Initiative.
Data Resolution
5 minute resolution 5 minute resolution
Accessibility, Complexity of Data Set
I-95 has contracted with the University of Maryland to post-process, clean and develop an interface to access data. Large files but download feature setup by the University made it easy to download.
Large files but limited support provided to download.
Notable Features
Has both historical and real time data. Freight initially not available but since 2015 available for NPMRDS TMCs (900 locations) dating back to 2011.
Only historical data, released every month with a 30 day lag. Contains separate field for freight vehicles
6
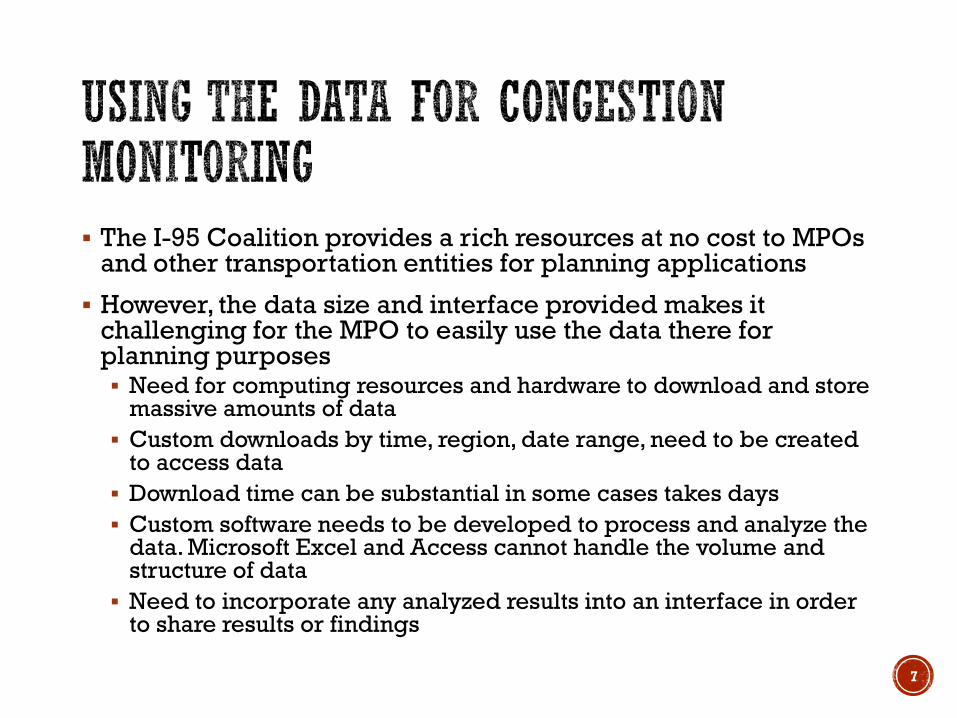
The I-95 Coalition provides a rich resources at no cost to MPOs and other transportation entities for planning applications
However, the data size and interface provided makes it challenging for the MPO to easily use the data there for planning purposes Need for computing resources and hardware to download and store
massive amounts of data Custom downloads by time, region, date range, need to be created
to access data Download time can be substantial in some cases takes days Custom software needs to be developed to process and analyze the
data. Microsoft Excel and Access cannot handle the volume and structure of data
Need to incorporate any analyzed results into an interface in order to share results or findings
7
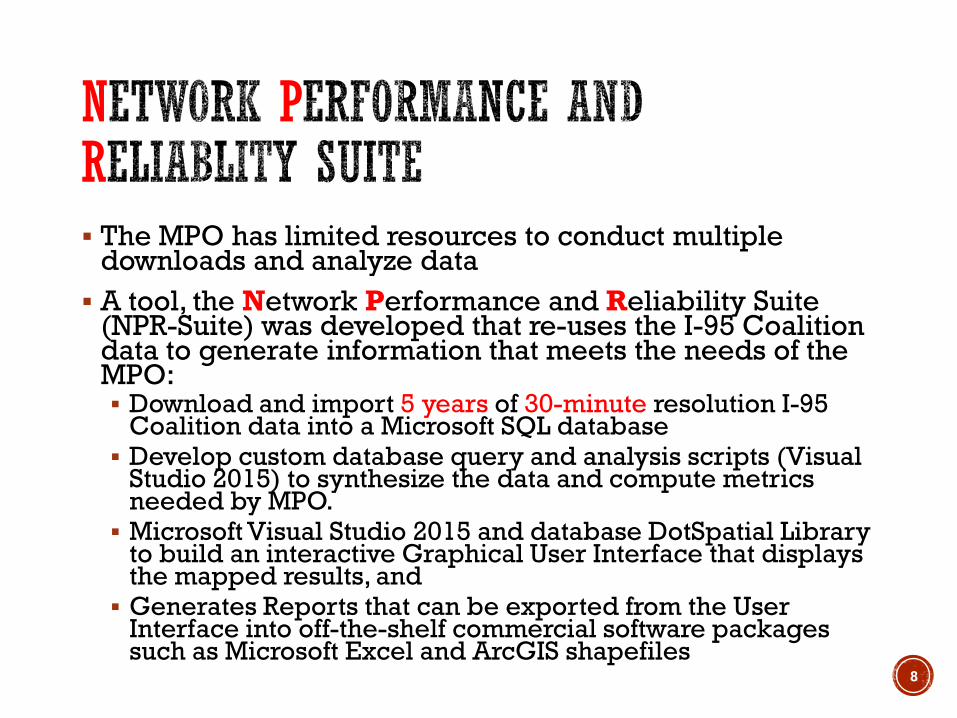
N PR The MPO has limited resources to conduct multiple
downloads and analyze data A tool, the Network Performance and Reliability Suite
(NPR-Suite) was developed that re-uses the I-95 Coalition data to generate information that meets the needs of the MPO: Download and import 5 years of 30-minute resolution I-95
Coalition data into a Microsoft SQL database Develop custom database query and analysis scripts (Visual
Studio 2015) to synthesize the data and compute metrics needed by MPO. Microsoft Visual Studio 2015 and database DotSpatial Library
to build an interactive Graphical User Interface that displays the mapped results, and Generates Reports that can be exported from the User
Interface into off-the-shelf commercial software packages such as Microsoft Excel and ArcGIS shapefiles
8
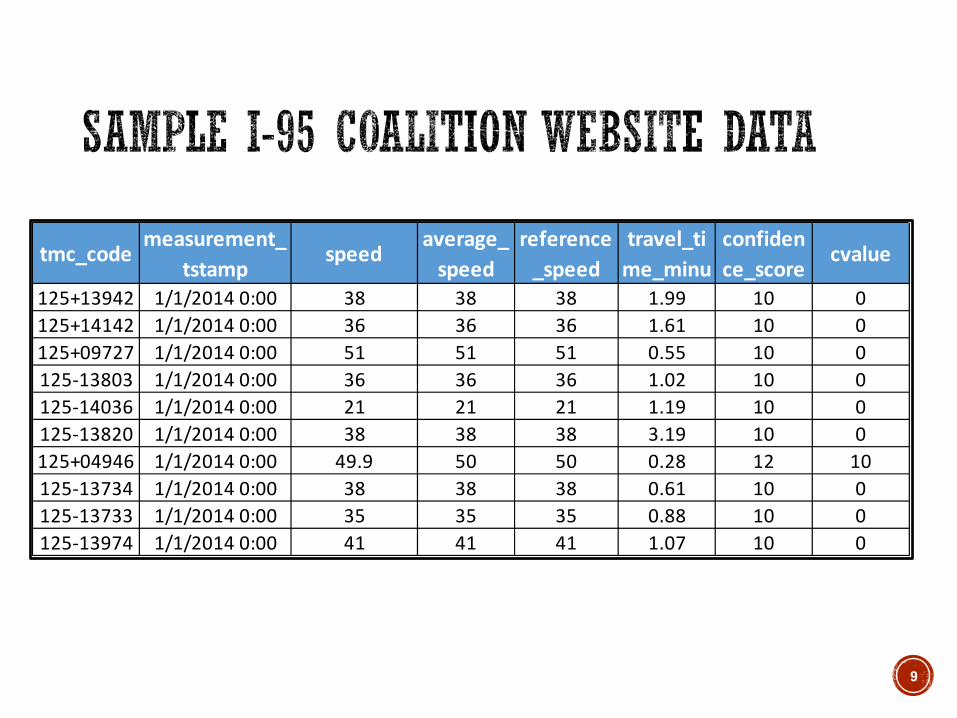
9
tmc_codemeasurement_
tstampspeed
average_speed
reference_speed
travel_time_minu
confidence_score
cvalue
125+13942 1/1/2014 0:00 38 38 38 1.99 10 0125+14142 1/1/2014 0:00 36 36 36 1.61 10 0125+09727 1/1/2014 0:00 51 51 51 0.55 10 0125-13803 1/1/2014 0:00 36 36 36 1.02 10 0125-14036 1/1/2014 0:00 21 21 21 1.19 10 0125-13820 1/1/2014 0:00 38 38 38 3.19 10 0125+04946 1/1/2014 0:00 49.9 50 50 0.28 12 10125-13734 1/1/2014 0:00 38 38 38 0.61 10 0125-13733 1/1/2014 0:00 35 35 35 0.88 10 0125-13974 1/1/2014 0:00 41 41 41 1.07 10 0
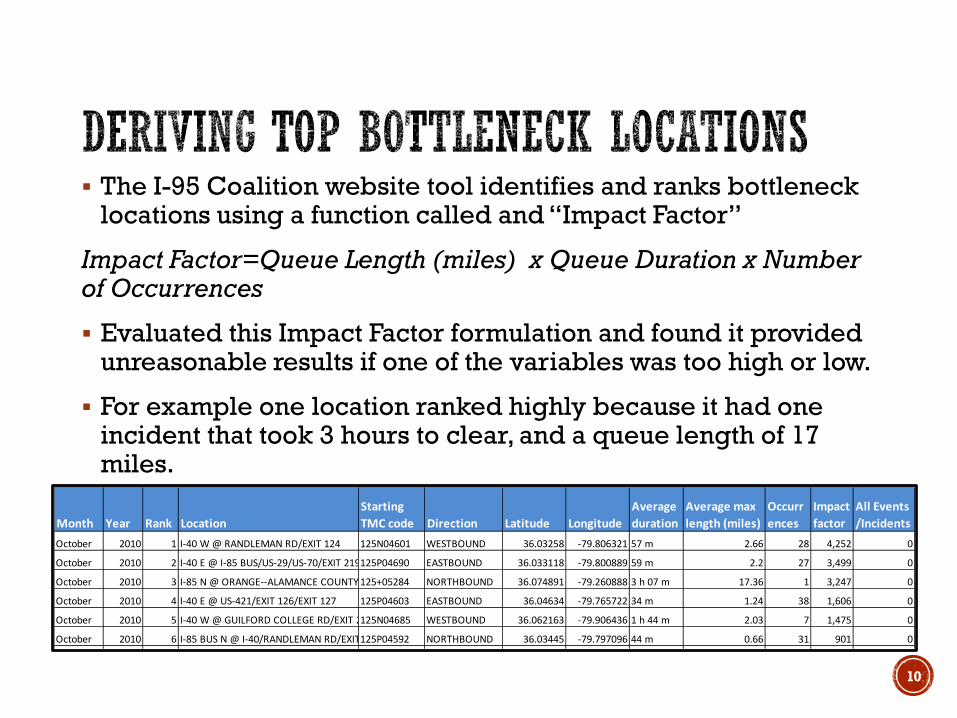
The I-95 Coalition website tool identifies and ranks bottleneck locations using a function called and “Impact Factor”
Impact Factor=Queue Length (miles) x Queue Duration x Number of Occurrences
Evaluated this Impact Factor formulation and found it provided unreasonable results if one of the variables was too high or low.
For example one location ranked highly because it had one incident that took 3 hours to clear, and a queue length of 17 miles.
10
Month Year Rank LocationStarting TMC code Direction Latitude Longitude
Average duration
Average max length (miles)
Occurrences
Impact factor
All Events /Incidents
October 2010 1 I-40 W @ RANDLEMAN RD/EXIT 124 125N04601 WESTBOUND 36.03258 -79.806321 57 m 2.66 28 4,252 0
October 2010 2 I-40 E @ I-85 BUS/US-29/US-70/EXIT 219125P04690 EASTBOUND 36.033118 -79.800889 59 m 2.2 27 3,499 0
October 2010 3 I-85 N @ ORANGE--ALAMANCE COUNTY 125+05284 NORTHBOUND 36.074891 -79.260888 3 h 07 m 17.36 1 3,247 0
October 2010 4 I-40 E @ US-421/EXIT 126/EXIT 127 125P04603 EASTBOUND 36.04634 -79.765722 34 m 1.24 38 1,606 0
October 2010 5 I-40 W @ GUILFORD COLLEGE RD/EXIT 2125N04685 WESTBOUND 36.062163 -79.906436 1 h 44 m 2.03 7 1,475 0
October 2010 6 I-85 BUS N @ I-40/RANDLEMAN RD/EXIT 125P04592 NORTHBOUND 36.03445 -79.797096 44 m 0.66 31 901 0
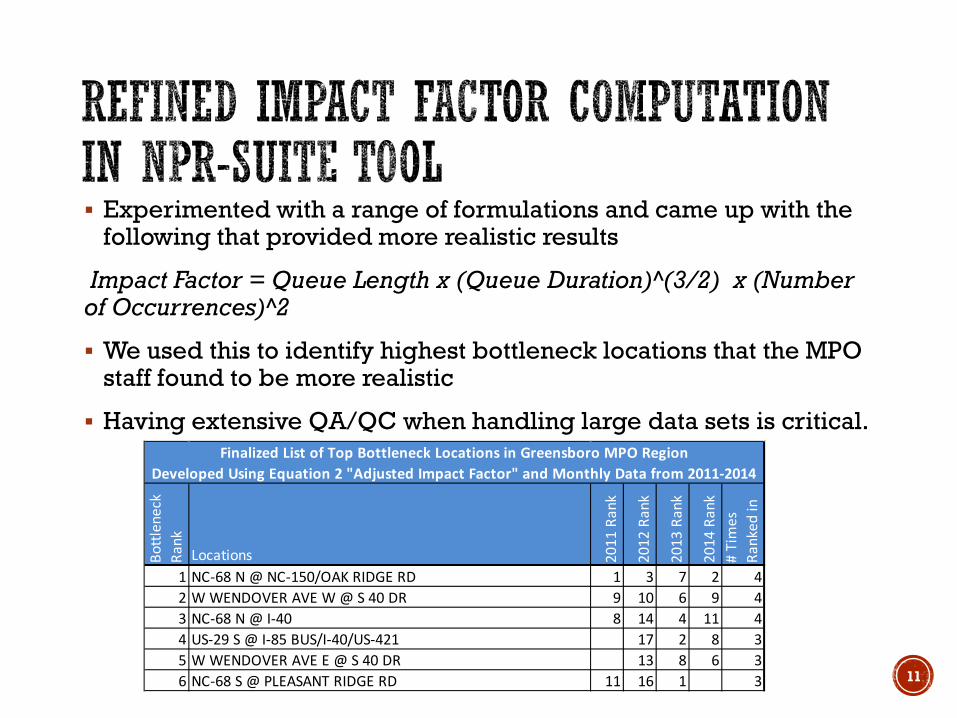
Experimented with a range of formulations and came up with the following that provided more realistic results
Impact Factor = Queue Length x (Queue Duration)^(3/2) x (Number of Occurrences)^2
We used this to identify highest bottleneck locations that the MPO staff found to be more realistic
Having extensive QA/QC when handling large data sets is critical.
11
Bottl
enec
k Ra
nk
Locations 2011
Ran
k
2012
Ran
k
2013
Ran
k
2014
Ran
k#
Tim
es
Rank
ed in
1 NC-68 N @ NC-150/OAK RIDGE RD 1 3 7 2 42 W WENDOVER AVE W @ S 40 DR 9 10 6 9 43 NC-68 N @ I-40 8 14 4 11 44 US-29 S @ I-85 BUS/I-40/US-421 17 2 8 35 W WENDOVER AVE E @ S 40 DR 13 8 6 36 NC-68 S @ PLEASANT RIDGE RD 11 16 1 3
Developed Using Equation 2 "Adjusted Impact Factor" and Monthly Data from 2011-2014Finalized List of Top Bottleneck Locations in Greensboro MPO Region
12

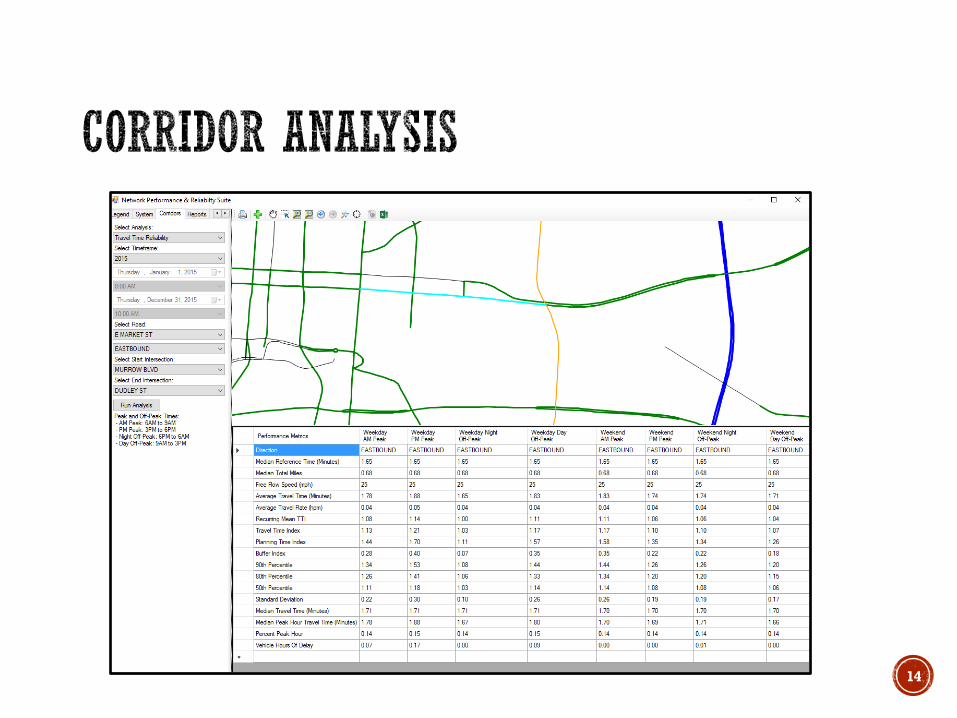
Average Speed
Below FFS
Travel Time Index
Planning Time Index
Buffer Index
Percent Peak Hour
Vehicle Hours of
Delay
13
14
15
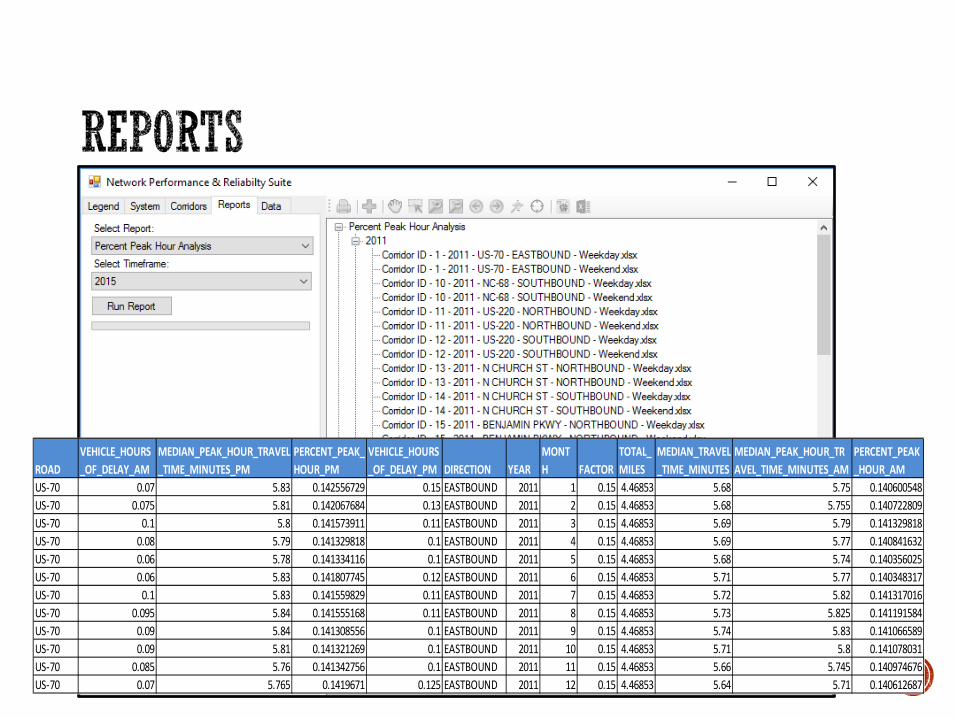
ROADVEHICLE_HOURS_OF_DELAY_AM
MEDIAN_PEAK_HOUR_TRAVEL_TIME_MINUTES_PM
PERCENT_PEAK_HOUR_PM
VEHICLE_HOURS_OF_DELAY_PM DIRECTION YEAR
MONTH FACTOR
TOTAL_MILES
MEDIAN_TRAVEL_TIME_MINUTES
MEDIAN_PEAK_HOUR_TRAVEL_TIME_MINUTES_AM
PERCENT_PEAK_HOUR_AM
US-70 0.07 5.83 0.142556729 0.15 EASTBOUND 2011 1 0.15 4.46853 5.68 5.75 0.140600548US-70 0.075 5.81 0.142067684 0.13 EASTBOUND 2011 2 0.15 4.46853 5.68 5.755 0.140722809US-70 0.1 5.8 0.141573911 0.11 EASTBOUND 2011 3 0.15 4.46853 5.69 5.79 0.141329818US-70 0.08 5.79 0.141329818 0.1 EASTBOUND 2011 4 0.15 4.46853 5.69 5.77 0.140841632US-70 0.06 5.78 0.141334116 0.1 EASTBOUND 2011 5 0.15 4.46853 5.68 5.74 0.140356025US-70 0.06 5.83 0.141807745 0.12 EASTBOUND 2011 6 0.15 4.46853 5.71 5.77 0.140348317US-70 0.1 5.83 0.141559829 0.11 EASTBOUND 2011 7 0.15 4.46853 5.72 5.82 0.141317016US-70 0.095 5.84 0.141555168 0.11 EASTBOUND 2011 8 0.15 4.46853 5.73 5.825 0.141191584US-70 0.09 5.84 0.141308556 0.1 EASTBOUND 2011 9 0.15 4.46853 5.74 5.83 0.141066589US-70 0.09 5.81 0.141321269 0.1 EASTBOUND 2011 10 0.15 4.46853 5.71 5.8 0.141078031US-70 0.085 5.76 0.141342756 0.1 EASTBOUND 2011 11 0.15 4.46853 5.66 5.745 0.140974676US-70 0.07 5.765 0.1419671 0.125 EASTBOUND 2011 12 0.15 4.46853 5.64 5.71 0.140612687
NPR-Suite is built so MPO can import additional travel time data over time.
Expected MPO will download data annually from the I-95 Coalition website and the tool will automatically synthesize the new datasets and generate the same metrics so the MPO can keep up to date on how the metrics produced are changing with time.
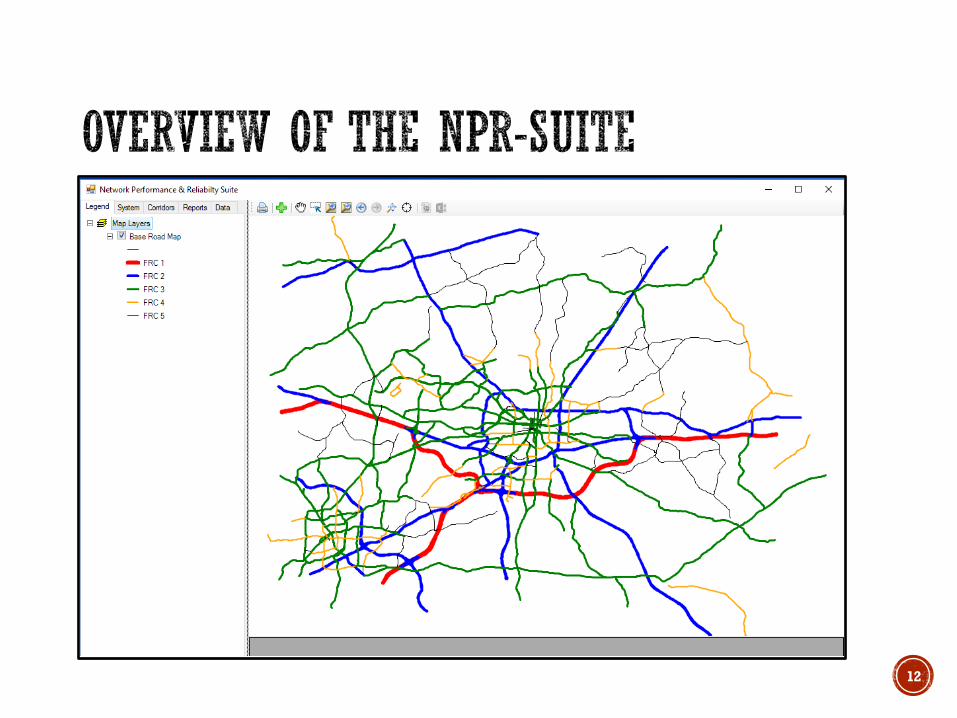
NPR-Suite also allows import of other data sets (non-travel time) using the Legend tab. This means the MPO could import for example a crash data shape file and overlay it with the systemwide average travel speed map output to explore if crashes are contributing significantly to congestions at the highly congested locations.
NPR-Suite will allow the MPO to easily extract a broad range of performance metrics across the existing road network that was difficult or cumbersome to implement using the I-95 Coalition website.
The tool also generates travel time reliability metrics that are being used by many agencies for performance measures and project evaluation.
16
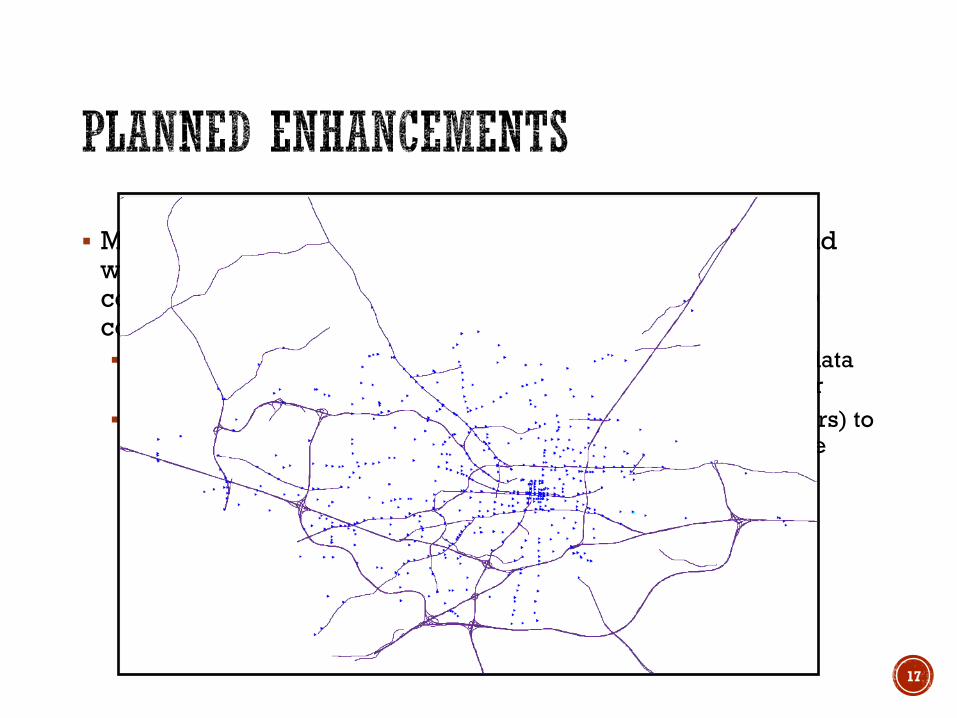
Most of the locations where the MPO collects count data, and will like to measure travel time and congestions are not covered by the I-95 Coalition dataset. Two options the MPO could consider to address that gap are: Purchase additional vehicle probe data from one of the major data
vendors providing data to the I-95 Coalition (INRIX, TomTom, or Install travel time data collection units (Bluetooth or WiFi readers) to
collect data at those locations and integrate information into the NPR-Suite.
17

18