internal repair of pipelines 30-month technical progress
TRANSCRIPT

EWI Project No. 46211GTH
Electronic File Name: 41633R68.pdf
Internal Repair of Pipelines 30-Month Technical Progress Report
Reporting Period: September 30, 2004 through March 30, 2005
Principal Authors: Bill Bruce, Nancy Porter, George Ritter, Matt Boring, Mark Losev, Ian Harris,
Bill Mohr, Dennis Harwig, Robin Gordon, Chris Neary, and Mike Sullivan
Report Issued: July 20, 2005 Revised: n/a Revision n/a
DOE Award No.: DE-FC26-02NT41633
Submitted By: Edison Welding Institute
1250 Arthur E. Adams Drive Columbus, OH 43221
Significant Subcontractor:
Pacific Gas & Electric 3400 Crow Canyon Road San Ramon, CA 94583

DISCLAIMER This report was prepared as an account of work sponsored by an agency of the United States Government. Neither the United States Government nor any agency thereof, nor any of their employees, makes any warranty, express or implied, or assumes any legal liability or responsibility for the accuracy, completeness, or usefulness of any information, apparatus, product, or process disclosed or represents that its use would not infringe privately owned rights. Reference herein to otherwise does not necessarily constitute or imply its endorsement, recommendation, or favoring by the United States Government or any agency thereof. The views and opinions of authors expressed herein do not necessarily state or reflect those of the United States Government or any agency hereof. Measurement Units -- SI Metric System of Units are the primary units of measure for this report followed by their U.S. Customary Equivalents in parentheses ( ). Note: SI is an abbreviation for "Le Systeme International d'Unites."

iii 41633R42.pdf
ABSTRACT The two broad categories of fiber-reinforced composite liner repair and deposited weld metal repair technologies were reviewed and evaluated for potential application for internal repair of gas transmission pipelines. Both are used to some extent for other applications and could be further developed for internal, local, structural repair of gas transmission pipelines.
Principal conclusions from a survey of natural gas transmission industry pipeline operators can be summarized in terms of the following performance requirements for internal repair:
• Use of internal repair is most attractive for river crossings, under other bodies of water, in difficult soil conditions, under highways, under congested intersections, and under railway crossings.
• Internal pipe repair offers a strong potential advantage to the high cost of horizontal direct drilling when a new bore must be created to solve a leak or other problem.
• Typical travel distances can be divided into three distinct groups: up to 305 m (1,000 ft.); between 305 m and 610 m (1,000 ft. and 2,000 ft.); and beyond 914 m (3,000 ft.). All three groups require pig-based systems. A despooled umbilical system would suffice for the first two groups which represents 81% of survey respondents. The third group would require an onboard self-contained power unit for propulsion and welding/liner repair energy needs.
• The most common size range for 80% to 90% of operators surveyed is 508 mm (20 in.) to 762 mm (30 in.), with 95% using 558.8 mm (22 in.) pipe.
Evaluation trials were conducted on pipe sections with simulated corrosion damage repaired with glass fiber-reinforced composite liners, carbon fiber-reinforced composite liners, and weld deposition. Additional un-repaired pipe sections were evaluated in the virgin condition and with simulated damage. Hydrostatic failure pressures for pipe sections repaired with glass fiber-reinforced composite liner were only marginally greater than that of pipe sections without liners, indicating that this type of liner is only marginally effective at restoring the pressure containing capabilities of pipelines. Failure pressures for larger diameter pipe repaired with a semi-circular patch of carbon fiber-reinforced composite lines were also marginally greater than that of a pipe section with un-repaired simulated damage without a liner. These results indicate that fiber reinforced composite liners have the potential to increase the burst pressure of pipe sections with external damage Carbon fiber based liners are viewed as more promising than glass fiber based liners because of the potential for more closely matching the mechanical properties of steel. Pipe repaired with weld deposition failed at pressures lower than that of un-repaired pipe in both the virgin and damaged conditions, indicating that this repair technology is less effective at restoring the pressure containing capability of pipe than a carbon fiber-reinforced liner repair.
Physical testing indicates that carbon fiber-reinforced liner repair is the most promising technology evaluated to-date. In lieu of a field installation on an abandoned pipeline, a preliminary nondestructive testing protocol is being developed to determine the success or failure of the fiber-reinforced liner pipeline repairs. Optimization and validation activities for carbon-fiber repair methods are ongoing.

iv 41633R42.pdf
TABLE OF CONTENTS Page
DISCLAIMER ................................................................................................................................ ii
ABSTRACT...................................................................................................................................iii
TABLE OF CONTENTS............................................................................................................... iv
LIST OF TABLES......................................................................................................................... vi
LIST OF GRAPHICAL MATERIALS ............................................................................................vii
LIST OF EQUATIONS .................................................................................................................xii
1.0 - INTRODUCTION .................................................................................................................. 1
2.0 - EXECUTIVE SUMMARY ...................................................................................................... 9
3.0 - EXPERIMENTAL ................................................................................................................ 11 3.1 - Fiber-Reinforced Liner Repair Trials ....................................................................11 3.2 - Weld Deposition Repair Trials..............................................................................34 3.3 - Baseline Pipe Material Performance....................................................................53 3.4 - Survey Development............................................................................................54 3.5 - Simulation and Analysis of Potential Repairs.......................................................54 3.6 - Development of Preliminary Post Repair Testing Protocol ..................................54
4.0 - RESULTS AND DISCUSSION ........................................................................................... 60
Task 1.0 - Research Management Plan ..............................................................................60 Task 2.0 - Technology Status Assessment .........................................................................60 Task 3.0 - Review Operators Experience and Repair Needs ..............................................61
Subtask 3.1 - Repair Needs and Performance Requirements .........................................61 Subtask 3.2 - Target Specifications for an Internal Pipeline Repair System....................62 Subtask 3.3 - Summary of Industry Needs for Internal Pipeline Repair ...........................63
Part 1 – Currently-Used Repair Methods .....................................................................64 Part 2 – Use/Potential Use of Internal Repair ..............................................................69 Part 3 – Need for In-Service Internal Repair ................................................................80 Part 4 – Applicable Types of Damage..........................................................................85 Part 5 – Operational and Performance Requirements for Internal Repairs..................88 Part 6 - General Comments .........................................................................................93
Task 4.0 - Evaluation of Potential Repair Methods..............................................................94 Subtask 4.1 - Identify Potential Repair Methods ..............................................................94 Subtask 4.2 - Develop Internal Repair Test Program ....................................................100
Fiber-Reinforced Liner Repairs ..................................................................................100 Weld Deposition Repairs ............................................................................................106 Comprehensive Test Program....................................................................................115
Subtask 4.3 - Simulation and Analysis of Potential Repair Methods .............................118

v 41633R42.pdf
Subtask 4.4 - Internal Repair Evaluation Trials..............................................................124
Fiber-Reinforced Liner Repairs ..................................................................................124 Weld Deposition Repairs ............................................................................................128 Baseline Pipe Material Performance ..........................................................................143
Subtask 4.5 - Review and Evaluation of Internal Pipeline Repair Technologies Report 148 Task 5.0 - Optimize and Validate Internal Repair Methods ...............................................148
Subtask 5.1 - Develop Test Program .............................................................................148 Subtask 5.2 - Optimization of Internal Repair Methods..................................................148 Subtask 5.3 - Full-Scale Laboratory Validation Trials ....................................................160 Subtask 5.4 - Development of Preliminary Post Repair Testing Protocol ......................161 Subtask 5.5 - Prepare Full-Scale Internal Pipeline Repair Validation Test Report ........162
Task 6.0 - Develop Functional Specification......................................................................162 Task 7.0 - Demonstration of Repair Technology ...............................................................163
5.0 - CONCLUSIONS ............................................................................................................... 164
6.0 - REFERENCES ................................................................................................................. 169
7.0 - BIBLIOGRAPHY ............................................................................................................... 170
8.0 - LIST OF ACRONYMS ...................................................................................................... 172
9.0 - APPENDICES................................................................................................................... 173
Appendix A: Industry Survey with Cover Letter ........................................................................ A-1
Appendix B: Members of the Pipeline Research Council International..................................... B-1
Appendix C: List of Natural Gas Pipeline Operating Companies ............................................. C-1
Appendix D: Lists of Surveyed PRCI Member & Other Gas Transmission Companies............ D-1

vi 41633R42.pdf
LIST OF TABLES
Page Table 1 - Layer Build Schedule for Carbon Fiber Patch Design 1 .............................................. 20 Table 2 - Burst Pressures for Weld Deposition Repairs on 558.8 mm (22 in.) Diameter Pipe.... 45 Table 3 - Metric Unit Welding Parameters for Internal Weld Deposition Repair ......................... 46 Table 4 - U.S. Customary Unit Welding Parameters for Internal Weld Deposition Repair.......... 47 Table 5 - Welding Process Parameters for Weld Deposition Repairs in Methane...................... 53 Table 6 - Key to Ratings in Potential Repair Process Matrices (Table 7 - Table 9) .................... 95 Table 7 - Potential Welding Repair Methods .............................................................................. 96 Table 8 - Potential Liner Repair Methods ................................................................................... 97 Table 9 - Potential Surfacing Repair Methods ............................................................................ 98 Table 10 - Hydrostatic Pressure Testing Results...................................................................... 102 Table 11 - Tensile Testing Results for Glass/Polypropylene Liner Material.............................. 105 Table 12 - Welding Parameters for Specimens R-01 through R-05 ......................................... 112 Table 13 - Tie-In Quality at Each Clock Position for R-05 ........................................................ 113 Table 14 - 2002-2003 Natural Gas Transmission Pipeline Incident Summary by Cause ......... 115 Table 15 - Dimensional Data and RSTRENG Predicted Burst Pressures for Simulated Corrosion
Damage Selected for Internal Repair Evaluation Trials..................................................... 117 Table 16 - Predicted and Measured Burst Pressures for Pipe With A Carbon Fiber-Reinforced
Liner Repair Patch (Design 1) ........................................................................................... 127 Table 17 - Ultrasonic Thickness Measurements at Locations in Figure 116............................. 130 Table 18 - Hydrostatic Bust Test Results for Internal Weld Deposition Repair Specimen........ 135 Table 19 - Volume Percent of Methane per Weld Specimen.................................................... 139 Table 20 - Tensile and Yield Strengths of the 508 mm (20 in.) and 558.8 mm (22 in.) Pipe .... 143 Table 21 - Calculated Values for Simulated Damage for 508 mm (20 in.) and 558.8 mm.... 144 Table 22 - Summary of Predicted vs. Actual Hydrostatic Burst Pressure Values..................... 147 Table 23 - Predicted vs. Actual Hydrostatic Burst Pressure Values for Patch Design 2........... 152 Table 24 - Tensile and Interlaminar Shear Properties for Composite Panels ........................... 155 Table 25 - Predicted vs. Actual Hydrostatic Burst Pressure Values for Patch Design 3........... 157 Table 26 - Predicted vs. Actual Hydrostatic Burst Pressure Values for a Patch Design 3 Repair
of Long-Shallow Damage .................................................................................................. 159 Table 27 - Test Series Conducted To Date .............................................................................. 159

vii 41633R42.pdf
LIST OF GRAPHICAL MATERIALS Page
Figure 1 - Installation of a Full-Encirclement Repair Sleeve ......................................................... 1
Figure 2 - External Weld Deposition Repair of Internal Wall Loss in 90º Elbow ........................... 2
Figure 3 - Osaka Gas System Robotic Welding System .............................................................. 3
Figure 4 - Internal Pipeline NDE System (IPNS) .......................................................................... 3
Figure 5 - Welding and Inspection Steam Operations Robot (WISOR) ........................................ 4
Figure 6 - Explorer II ..................................................................................................................... 4
Figure 7 - Clock Spring® Fiber-Reinforced Composite Device for Pipeline Repair ...................... 5
Figure 8 - Installation of a Sectional Liner in a Low-Pressure Pipeline......................................... 7
Figure 9 - Installation of a Cured-in-Place Liner (Inversion Process)............................................ 8
Figure 10 - Installation of Fold-and-Formed Liner......................................................................... 8
Figure 11 - RolaTube Bi-Stable Reeled Composite Material ...................................................... 11
Figure 12 - Lay-Up and Forming of Fiber-Reinforced Composite Liner...................................... 12
Figure 13 - Insertion of Liner into 114.3 mm (4.5 in.) Diameter Pipe .......................................... 13
Figure 14 - Silicon Rubber Bag Inserted into Liner ..................................................................... 14
Figure 15 - Oven Used to Heat Pipe and Liner to 200°C (392°F)............................................... 14
Figure 16 - Liner Installed in 114.3 mm (4.5 in.) Diameter Pipe ................................................. 15
Figure 17 - Long, Shallow Simulated Corrosion Damage........................................................... 16
Figure 18 - Short, Deep Simulated Corrosion Damage .............................................................. 16
Figure 19 - 114.3 mm (4.5 in.) Diameter Pipe Section with Simulated Corrosion Damage and Welded End Caps................................................................................................................17
Figure 20 - Pipe Section Used for Test of Carbon Fiber Patch Design No. 1 ............................. 18
Figure 21 - Simulated Corrosion Defect for First Carbon Fiber Liner Repair Test in 508 mm (20 in.) Diameter Pipe.......................................................................................................... 18
Figure 22 - Mylar-Lined Semi-Circular Mold for Carbon Fiber Patch Design 1........................... 21
Figure 23 - Dry Pack of Quasi-Isometric Fiber............................................................................ 21
Figure 24 - Breather Cloth Frame Draped Around Pack............................................................. 22
Figure 25 - Mylar Top Shown Draped (Top Breather Draped Next Over Pack).......................... 22
Figure 26 - Vacuum Bag Film Draped Over Entire Pack ............................................................ 23
Figure 27 - Completed Repair Patch (Design 1) with Grit-Blasted Outer Diameter .................... 24
Figure 28 - Application of 3M DP460 Adhesive to Grit-Blasted Inside Diameter of Pipe............ 24
Figure 29 - Application of Adhesive to Repair Patch (Design 1) ................................................. 25
Figure 30 - Installation of Repair Patch (Design 1) ..................................................................... 25
Figure 31 - Clamping Bars Used to Hold Repair Patch (Design 1) in Place ............................... 26
Figure 32 - Adhesive Fillet Around Repair Patch (Design 1) ...................................................... 26

viii 41633R42.pdf
Figure 33 - Pressure Bandage Carbon Fiber-Reinforced Patch (Design 2) ............................... 27
Figure 34 - Mylar Over Release-Coated Plate............................................................................ 28
Figure 35 - Rim of Breather Added ≅ 76.2 mm (3 in.) Wide........................................................ 29
Figure 36 - Dry Stack Before Layup............................................................................................ 29
Figure 37 - Top Breather Added .................................................................................................30
Figure 38 - Vacuum Bag Added Over Sealer Tape .................................................................... 30
Figure 39 - Wet Panel Under Applied Vacuum ........................................................................... 31
Figure 40 - Patch Design 3 Installed in Pipe Section.................................................................. 32
Figure 41 - Long-Shallow Simulated Corrosion .......................................................................... 32
Figure 42 - Fabrication of Patch Design 3 for Long-Shallow Defect Evaluation ......................... 33
Figure 43 - Pipe in the 5G Horizontal and Fixed Position ........................................................... 34
Figure 44 - Bortech Motion Mechanism for Continuous Spiral Deposition.................................. 35
Figure 45 - Bortech Torch and Torch Height Control .................................................................. 36
Figure 46 - Bortech Controller..................................................................................................... 36
Figure 47 - OTC Robot Set-Up for Internal Welding ................................................................... 37
Figure 48 - OTC Robot Arm and Torch....................................................................................... 38
Figure 49 - Kobelco PC-350 Variable Polarity Fuzzy Logic Power Supply................................. 39
Figure 50 - Magnatech Pipeliner II Welding Tractor ................................................................... 40
Figure 51 - Magnatech Control Pendant Showing Control Parameters ...................................... 41
Figure 52 - Panasonic AE 350 Power Supply with Pulse Short-Circuit Metal Transfer Control.. 42
Figure 53 - Milling Machine Set-Up Used to Simulate Corrosion on Pipe Sections.................... 43
Figure 54 - Dimensions of Simulated Corrosion on 558.80 mm (22 in.) Pipe............................. 44
Figure 55 - Simulated Corrosion on 558.80 mm (22 in.) Pipe..................................................... 44
Figure 56 - Magnified View of Simulated Corrosion on 558.80 mm (22 in.) Pipe ....................... 45
Figure 57 - Dirt Box for Weld Deposition Repair......................................................................... 48
Figure 58 - Orientation of Pipe Section with Dirt Box for Weld Deposition Repair...................... 48
Figure 59 - Outline of Simulated Corrosion on Inside Diameter of Pipe Section ........................ 49
Figure 60 - First Pass of First Layer of Deposited Weld Metal on Inside Pipe Diameter ............ 49
Figure 61 - Second Pass of First Layer of Deposited Weld Metal on Inside Pipe Diameter ....... 50
Figure 62 - Third Pass of First Layer of Deposited Weld Metal on Inside Pipe Diameter ........... 50
Figure 63 - Finished First Layer of Deposited Weld Metal on Inside Pipe Diameter................... 51
Figure 64 - First Pass of Second Layer of Deposited Weld Metal on Inside Pipe Diameter ....... 51
Figure 65 - Finished Second Layer of Deposited Weld Metal on Inside Pipe Diameter ............. 52
Figure 66 - Two Areas of Simulated Corrosion on Outside Diameter of Pipe Section................ 55
Figure 67 - Shot Blasted Inside Diameter of Pipe Section.......................................................... 56
Figure 68 - Disbond Area Masked with Paper ............................................................................ 56

ix 41633R42.pdf
Figure 69 - Silicone Oil Applied to Pipe ...................................................................................... 57
Figure 70 - Pipe Surface After Mask Removed .......................................................................... 57
Figure 71 - Masking Tape Defects.............................................................................................. 58
Figure 72 - Defect Locations on Outside Diameter of Patch....................................................... 58
Figure 73 - Test Repair Patch with Known Defect Types and Sizes........................................... 59
Figure 74 - Currently Used Repair Methods ............................................................................... 64
Figure 75 - Criteria Affecting Choice of Repair Method .............................................................. 66
Figure 76 - Decision Factors for Internal Pipe Repair ................................................................. 70
Figure 77 - Specific Geographic Locations and Special Situations ............................................ 72
Figure 78 - Distance Repair System Required to Travel Down Pipe .......................................... 73
Figure 79 - Range of Pipe Diameters Used ................................................................................ 75
Figure 80 - Potential Obstructions to be Negotiated ................................................................... 76
Figure 81 - Cost Comparative Breakpoint for Internal Repair ..................................................... 77
Figure 82 - Estimated Number of Internal Repairs Required Per Year....................................... 79
Figure 83 - Importance of Repair While Pipeline Remains In-Service........................................ 80
Figure 84 - Still Attractive if Pipeline Must be Shut Down (Depressurized and Evacuated) ....... 82
Figure 85 - Still Attractive if Pipeline Must be Depressurized but Not Evacuated....................... 83
Figure 86 - Still Attractive if Pipeline Must be Out of Service but Pressurized?.......................... 84
Figure 87 - External Coatings Used............................................................................................ 85
Figure 88 - Maintenance on Coating Integrity............................................................................. 86
Figure 89 - Is CP System Capable of Compensating for Small Coating Breaches..................... 87
Figure 90 - Inspectable by Pigging .............................................................................................88
Figure 91 - How Far Could the Repair Protrude Into Pipe Before Interference .......................... 89
Figure 92 - NDE Required for Repair to an Existing Weld.......................................................... 90
Figure 93 - NDE Required for Base Metal Repair....................................................................... 91
Figure 94 - Would Internal Repair be Attractive Even as a Temporary Repair? ......................... 92
Figure 95 - Weighted Scores of Potential Repair Methods......................................................... 99
Figure 96 - Pipe Section with Long, Shallow Simulated Corrosion Damage – Without Liner - Following Hydrostatic Pressure Test ................................................................................. 100
Figure 97 - Pipe Section with Long, Shallow Simulated Corrosion Damage – With Liner – Following Hydrostatic Pressure Test ................................................................................. 101
Figure 98 - Pipe Section with Short, Deep Simulated Corrosion Damage – Without Liner – Following Hydrostatic Pressure Test ................................................................................. 101
Figure 99 - Pipe Section with Short, Deep Simulated Corrosion Damage – With Liner – Following Hydrostatic Pressure Test ................................................................................. 102
Figure 100 - Water-Jet Cut Section through Pipe Sample Containing Round-Bottom Longitudinal Slot with Liner Installed......................................................................................................103

x 41633R42.pdf
Figure 101 - Pipe Sample Containing Round-Bottom Longitudinal Slot Showing Rupture of Liner Material .............................................................................................................................. 104
Figure 102 - Tensile Testing Results for Glass/Polypropylene Liner Material .......................... 105
Figure 103 - Weld Bead Shape Diagram .................................................................................. 107
Figure 104 - Tests R-01 through R-04 at 12:00 (Note the Poor Tie-Ins for R-01 through R-03)108
Figure 105 - Test R-01 at 12:00 Showing Poor Stop-Start Tie-In ............................................. 109
Figure 106 - Tests R-03 and R-04 at 12:00 Showing Better Stop-Start Overlap. ..................... 110
Figure 107 - Tests R-01 and R-02 at 3:00 Showing Steady-State Bead Shape....................... 111
Figure 108 - Tie-In Tests Using Parameters R-05 Every 30º Around One Ring Deposit.......... 114
Figure 109 - Selected Configuration of Simulated Damage for 558.80 mm (22 in.) Diameter Pipe Sections ............................................................................................................................. 116
Figure 110 - Selected Configuration of Simulated Damage for 508 mm (20 in.) Diameter Pipe Sections ............................................................................................................................. 117
Figure 111 - Relationship Between Modulus and Strength for Carbon Fibers.......................... 120
Figure 112 - Design Space for Composite Liner....................................................................... 122
Figure 113 - Pipe With Carbon Fiber-Reinforced Liner (Design 1) Repair After Burst Test...... 125
Figure 114 - Failure Initiation Site For Burst Tested Pipe With Carbon Fiber-Reinforced Liner Repair (Design 1)............................................................................................................... 126
Figure 115 - Magnification of Carbon Fiber-Reinforced Patch (Design 1) After Burst Test ...... 127
Figure 116 - Ultrasonic Thickness Measurement Locations on Weld Deposition Repair ......... 129
Figure 117 - Simulated Corrosion on Outside of Pipe After Internal Weld Deposition Repair .. 131
Figure 118 - Dirt That Was In Contact With Pipe During Internal Weld Deposition Repair....... 132
Figure 119 - Profile of Dent in Outside Pipe Surface After Internal Weld Deposition Repair.... 133
Figure 120 - Magnified Pictures of Dent at Ends and Middle of Simulated Damage ................ 133
Figure 121 - Pipe Section with Internal Weld Deposition Repair After Hydrostatic Burst Test .134
Figure 122 - Experimental Set-Up for Welding onto Thin-Wall Pipe containing Pressurized Methane Gas ..................................................................................................................... 136
Figure 123 - External Appearance of Welds Made on 3.2 mm (0.125 in.) Thick Pipe with Methane Gas at 4.5 mPa (650 psi) and 6.1 m/sec (19.9 ft/sec) Flow Rate ....................... 136
Figure 124 - Internal Appearance of Welds Shown in Figure 123 ............................................ 136
Figure 125 - Metallographic Section through Weld 2M9 (middle weld shown in Figure 123 and Figure 124) ........................................................................................................................ 137
Figure 126 - Eutectic Iron Layer at Inside Surface of Section through Weld 2M9 .................... 137
Figure 127 - Cracks in Eutectic Iron Layer of Metallographic Section Shown in Figure 126 .... 138
Figure 128 - Graphical Representation of Table 19 Hardness Values and Carbon Content .... 139
Figure 129 - Weld Specimen 325-2 .......................................................................................... 140
Figure 130 - Weld Specimen 325-3 .......................................................................................... 140
Figure 131 - Weld Specimen 325-4 .......................................................................................... 141

xi 41633R42.pdf
Figure 132 - Weld Specimen 325-5 .......................................................................................... 141
Figure 133 - Weld Specimen 325-6 .......................................................................................... 141
Figure 134 - Weld Specimen 325-8 .......................................................................................... 142
Figure 135 - Weld Specimen 325-9 .......................................................................................... 142
Figure 136 - Hydrostatic Burst Specimen of 508.0 mm (20 in.) in Virgin Pipe.......................... 144
Figure 137 - Hydrostatic Burst Specimen of 508.0 mm (20 in.) with Un-Repaired Damage..... 145
Figure 138 - Hydrostatic Burst Specimen of 558.8 mm (22 in.) Pipe in Virgin Pipe.................. 145
Figure 139 - Hydrostatic Burst Specimen of 558.8 mm (22 in.) With Un-Repaired Damage.... 146
Figure 140 - Carbon Fiber Patch Design 2 with Failure Locations ........................................... 150
Figure 141 - Failure of Pipe and Composite Repair.................................................................. 151
Figure 142 - Disbondment Between Pipe and Patch 2 at Pipe Failure Site.............................. 151
Figure 143 - Three-Point Bending Test Set Up for ILS Testing ................................................ 154
Figure 144 - Average Tensile and Modulus Properties for Composite Panels ......................... 156
Figure 145 - Failure of Pipe Section with Patch Design 3......................................................... 157
Figure 146 - Patch Design 3 Repair of Long-Shallow Damage after Burst Test....................... 159
Figure 147 - Percent Improvement of Burst Test Results for Repaired vs. Un-Repaired Pipe Sections ............................................................................................................................. 160

xii 41633R42.pdf
LIST OF EQUATIONS
Equation 1 - Tensile Strength of the Fiber σfu in MPa............................................................... 119
Equation 2 - Tensile Strength of the Fiber σfu in ksi .................................................................. 119
Equation 3 - Pressure to Reach Stress Equal to the SMYS of the Pipe Material ..................... 120
Equation 4 - Minimum Allowable Tensile Strength of the Fiber σfu in MPa............................... 121
Equation 5 - Minimum Allowable Tensile Strength of the Fiber σfu in ksi .................................. 121
Equation 6 - Maximum Fiber Modulus in MPa .......................................................................... 121
Equation 7 - Maximum Fiber Modulus in ksi ............................................................................. 121
Equation 8 - c as a Function of the Thickness of Both the Pipe and Liner, and the Moduli of Both the Pipe and Liner ................................................................................................ 123
Equation 9 - Shear Stress as a Function of Shear Force ......................................................... 123
Equation 10 - Shear Force per Unit Length .............................................................................. 123
Equation 11 - Length at Which Hoop Stress Can No Longer Redistribute Itself Around the Ends of Damage............................................................................................................ 158

1 41633R42.pdf
1.0 - INTRODUCTION External, corrosion-caused loss of wall thickness is the most common cause of repair for gas transmission pipelines. To prevent an area of corrosion damage from causing a pipeline to rupture, the area containing the corrosion damage must be reinforced. As pipelines become older, more repairs are required. Repair methods that can be applied from the inside of a gas transmission pipeline (i.e., trenchless methods) are an attractive alternative to conventional repair methods since pipeline excavation is precluded. This is particularly true for pipelines in environmentally sensitive and highly populated areas.
Several repair methods that are commonly applied from the outside of the pipeline are, in theory, directly applicable from the inside. However, issues must be addressed such as development of the required equipment to perform repairs remotely and the mobilization of said equipment through the pipeline to areas that need to be repaired. In addition, several additional repair methods that are commonly applied to other types of pipelines (e.g., gas distribution lines, water lines, etc.) have potential applicability, but require further development to meet the requirements for repair of gas transmission pipelines. To prevent a corrosion defect from causing a pipeline to rupture, the area containing the defect must be reinforced to prevent the pipeline from bulging. The most predominant method of reinforcing corrosion defects in transmission pipelines is to install a welded full-encirclement repair sleeve, e.g., external repair of external wall loss (Figure 1). Full-encirclement sleeves resist hoop stress and can also resist axial stresses if the ends of the sleeves are welded.
Figure 1 - Installation of a Full-Encirclement Repair Sleeve

2 41633R42.pdf
Gas transmission pipeline repair by direct deposition of weld metal, or weld deposition repair, is also a proven technology that can be applied directly to the area of wall loss or to the side opposite to the wall loss, e.g., external repair of internal wall loss (Figure 2).
Figure 2 - External Weld Deposition Repair of Internal Wall Loss in 90º Elbow There are no apparent technical limitations to applying this repair method to the inside of an out-of-service pipeline. It is direct, relatively inexpensive to apply, and requires no additional materials beyond welding consumables. However, application of this repair method to the inside of an in-service pipeline would require that welding be performed in a hyperbaric environment. Deposited weld metal repairs are also used to repair circumferentially oriented planar defects (e.g., intergranular stress corrosion cracks adjacent to girth welds) in the nuclear power industry. Remote welding has been developed primarily by needs in the nuclear power industry. For example, Osaka Gas has developed remote robotic equipment for repair of flaws in the root area of welds of gas transmission lines (Figure 3).

3 41633R42.pdf
Figure 3 - Osaka Gas System Robotic Welding System Although remote welding was developed primarily for the nuclear power industry, working devices have been built for other applications, including repair of gas transmission pipelines. Pacific Gas and Electric Company (PG&E) has developed the Internal Pipeline NDE System (IPNS) for internal inspection of gas pipelines (Figure 4). The system incorporates a variety of inspection technologies to characterize girth and long seam flaws, corrosion, and dents and gouges. Figure 4 - Internal Pipeline NDE System (IPNS) Honeybee Robotics and Consolidated Edison have developed the Welding and Inspection Steam Operations Robot (WISOR) system for inspection and repair of flanges in steam piping (Figure 5).

4 41633R42.pdf
Figure 5 - Welding and Inspection Steam Operations Robot (WISOR) A successfully developed internal repair method could be coupled to an autonomous inspection robot such as the Explorer II (Figure 6) to provide continuous inspection and repair capability for the natural gas infrastructure. Figure 6 - Explorer II Fiber-reinforced composite repairs are becoming widely used as an alternative to the installation of welded, full-encirclement sleeves for repair of gas transmission pipelines. These repairs typically consist of glass fibers in a polymer matrix material bonded to the pipe using an adhesive. Adhesive filler is applied to the defect prior to installation to allow load transfer to the composite material. The primary advantage of these repair products over welded, full-encirclement sleeves is the fact that welding is precluded.

5 41633R42.pdf
Figure 7 - Clock Spring® Fiber-Reinforced Composite Device for Pipeline Repair Glass-fiber based composite systems, such as Clock Spring® (Figure 7), are becoming widely used as an alternative repair method for transmission pipelines. Clock Spring® consists of a coil of continuous uniaxial e-glass fibers in a polyester matrix material that is bonded to the pipe using an adhesive. As is the case with welded full-encirclement repair sleeves, adhesive filler is applied to the defect prior to Clock Spring® installation to allow load transfer to the composite material. The average tensile strength and elastic modulus of the Clock Spring® composite in the hoop direction are 70,000 psi and 5.5 X 10⁶ psi, respectively. The elastic modulus of steel is approximately 30 X 106 psi. When a pipe with a corrosion defect that has been repaired using Clock Spring® is pressurized, both the steel and the Clock Spring® begin to carry the hoop stress that is generated by the pressure. The Clock Spring®, because it has a lower elastic modulus than steel, begins to carry the load at a reduced rate compared to the steel. The reason for this is that a material with a lower elastic modulus must experience a greater amount of strain (elongation) to carry an equal amount of load compared to a material with a higher elastic modulus. Once the steel in the vicinity of the defect exceeds its elastic limit, (i.e., begins to yield), the Clock Spring® begins to carry a larger portion of the load while at the same time preventing the defect from bulging. Because yielding is required in order for the Clock Spring® to carry a larger portion of the load, the use of Clock Spring® is not recommended for low toughness pipe or for sharp defects. When applied to the inside of a pipe with a corrosion defect, a glass-fiber based composite repair system behaves in much the same way as an externally applied Clock Spring® up to the elastic limit of the steel. The composite material is prevented from carrying its share of the load because of the constraint that is provided by the steel pipe around it. The steel prevents the composite from experiencing the strain (elongation) required to carry a significant portion of the

6 41633R42.pdf
load. When the steel in the vicinity of the defect exceeds its elastic limit, (i.e., begins to yield), the composite begins to carry a larger portion of the load, but since it is applied to the inside of the pipe, cannot prevent the defect from bulging. The adhesive that bonds the composite to the steel and the matrix material of the composite both have low strength in tension compared to the steel and the composite fibers. For external repair, bulging of the pipe wall in the vicinity of the defect places the adhesive in compression. For internal repair, bulging places the adhesive in tension. When the steel in the vicinity of the defect begins to yield, the adhesive and the matrix material fail allowing pressure to act upon the defect. For internal repair, a composite repair material that has an elastic modulus that is closer to steel is required to protect the defect from experiencing the hoop stress that eventually leads to bulging. Carbon-fiber based composite materials are a more attractive option for internal repair of transmission pipelines, as they have an elastic modulus that is much closer to that of steel than glass-fiber based composite materials. For internal repair, designs that avoid loading the adhesive and the matrix material in tension are also required. A variety of liners are commonly used for repair of other types of pipelines (e.g., gas distribution lines, sewers, water mains, etc.). These repair processes are primarily used to restore leak-tightness and are not considered structural repairs. Of these, the three that are potentially applicable to internal repair of gas transmission pipelines are sectional liners, cured-in-place liners, and fold-and-formed liners. Sectional liners are typically 0.9 m (3 ft.) to 4.6 m (15 ft.) in length and are installed only in areas that require repairs. The installation of a sectional liner is illustrated in Figure 8. Cured-in-place liners and fold-and-formed liners are typically applied to an entire pipeline segment. Cured-in-place liners are installed using the inversion process (Figure 9), while fold-and-formed liners (Figure 10) are pulled into place and then unfolded so they fit tightly against the inside of the pipe. Composite liner repair processes and materials require further development before liner repair is a viable option for structural repair. The strength and stiffness of these materials must be improved, as well as, the adhesive systems that bond the liner to the pipe surface. The required material thickness is of particular interest for internal structural reinforcement, as liner thickness can have an adverse affect on internal inspection and flow restriction.

7 41633R42.pdf
Figure 8 - Installation of a Sectional Liner in a Low-Pressure Pipeline

8 41633R42.pdf
Figure 9 - Installation of a Cured-in-Place Liner (Inversion Process)
Figure 10 - Installation of Fold-and-Formed Liner
Defective Sewer
Liner
Water Added

9 41633R42.pdf
2.0 - EXECUTIVE SUMMARY The two broad categories of deposited weld metal repair and fiber-reinforced composite liner repair technologies were reviewed for potential application for internal repair of gas transmission pipelines. Both are used to some extent for other applications and could be further developed for internal, local, structural repair of gas transmission pipelines. Both of these repair technologies can easily be applied out-of-service and both require excavation prior to repair. The most frequent cause for repair of gas transmission pipelines was identified as external, corrosion-caused loss of wall thickness. The most commonly used in-service method for repair is externally welding on a full-encirclement steel sleeve. Weld deposition repair is also a proven technology that can be applied directly to the area of wall loss. There are no apparent limitations to applying this repair technology to the outside of an out-of-service pipeline. Repairing the inside of an in-service pipeline, however, would require that welding be conducted in a hyperbaric environment, which would require extensive research to develop. External corrosion can be repaired by applying adhesive to the defect and wrapping a fiber-reinforced composite liner material around the outside diameter of the pipeline. Fiber-reinforced composite liner repairs are becoming widely used to repair pipeline both in- and out-of-service as an alternative to welding. Three liners that are potentially applicable to internal repair of pipelines are sectional liners, cured-in-place liners, and fold-and-formed liners. A test program was developed for both deposited weld deposition repair and fiber-reinforced composite liner repair. Areas of simulated damage were introduced into pipe sections using methods previously developed at EWI. These damaged pipe sections were then repaired with both weld deposition and fiber-reinforced composite liner repairs. The repaired pipe sections were then hydrostatically pressure tested until rupture to establish performance data for both repair processes. Additionally, un-repaired pipe sections in the virgin (i.e., undamaged) condition and with simulated corrosion damage were hydrostatically tested until rupture; thus establishing baseline performance data to enable an apples-to-apples comparison of all performance data. Glass fiber-reinforced composite liners were hydrostatically tested in small-scale pipe sections with simulated damage. Unlined, small-scale pipe sections with simulated damage were also hydrostatically tested until rupture. The pipe sections with glass fiber-reinforced liners failed at pressures only marginally greater than the pipes with no liners, indicating that the glass fiber-reinforced liners are only marginally effective at restoring the pressure containing capabilities of pipelines. Postmortem results indicate that a fiber-reinforced composite liner material that is more elastic would more effectively reinforce steel pipelines, thus allowing the liner to carry its share of the load without putting the interface between the liner and the steel pipe in tension.

10 41633R42.pdf
A survey of natural gas transmission industry pipeline operators was conducted to better understand their needs and performance requirements for internal repair. Survey responses produced the following principal conclusions:
• Use of internal repair is most attractive for river crossings, under other bodies of water (e.g., lakes and swamps) in difficult soil conditions, under highways, under congested intersections, and under railway crossings. All these areas tend to be very difficult and very costly if, and where, conventional excavated repairs may be currently used.
• Internal pipe repair offers a strong potential advantage to the high cost of horizontal direct drilling when a new bore must be created to solve a leak or other problem in a water/river crossing.
• Typical travel distances can be divided into three distinct groups: up to 305 m (1,000 ft.); between 305 m (1,000 ft.) and 610 m (2,000 ft.); and beyond 914 m (3,000 ft.). All three groups require pig-based systems. A despooled umbilical system would suffice for the first two groups which represents 81% of survey respondents. The third group would require an onboard self-contained power unit for propulsion and welding/liner repair energy needs.
• Pipe diameter sizes range from 50.8 mm (2 in.) through 1,219.2 mm (48 in.). The most common size range for 80% to 90% of operators surveyed is 508 mm (20 in.) to 762 mm
(30 in.), with 95% of companies using 558.8 mm (22 in.) diameter pipe. Engineering analysis determined that a composite liner with a high fiber modulus and shear strength is required for composite liners to resist the types of shear stresses that can occur when external corrosion continues to the point where only the liner carries the stresses from the internal pressure in the pipe. Realistic combinations of composite material and thickness were analytically determined for use in a carbon fiber-reinforced liner system that EWI developed. Failure pressures for full-scale pipe repaired with the carbon fiber-reinforced composite liner were greater than that of pipe sections without liners, indicating that the carbon fiber-reinforced liners are effective at fully restoring the pressure containing capabilities of gas transmission pipelines. Specimens of virgin pipe material had the highest hydrostatic burst pressures. The pipe section with simulated corrosion damage repaired with a carbon fiber-reinforced liner had the next highest burst pressure. The specimens of un-repaired pipe with simulated corrosion damage had the third highest burst pressures. The pipe section with simulated corrosion damage repaired with weld deposition exhibited the lowest burst pressure. Physical testing clearly indicates that carbon fiber-reinforced liner repair is the most promising technology evaluated to-date. In lieu of a field installation on an abandoned pipeline, a preliminary nondestructive testing protocol is being developed to determine the success or failure of the fiber-reinforced liner pipeline repairs. Optimization and validation of this technology continues.

11 41633R42.pdf
3.0 - EXPERIMENTAL To date, experimental work has evaluated potential methods of fiber-reinforced liner repair and weld deposition repair. The survey part of the project did not involve an experimental procedure or equipment in the conventional sense. This section describes all experimental methods used during all reporting periods. 3.1 - Fiber-Reinforced Liner Repair Trials In the first six-month reporting period, Task 2.0 research activities resulted in the discovery of several potentially useful commercial fiber-reinforced composite liner products that are directly applicable to internal repair. The initial test program focused on a modified Wellstream-Haliburton/RolaTube product, which was a bi-stable reeled composite material used to make strong, lightweight, composite pipes and pipe linings (Figure 11). When unreeled, it changes shape from a flat strip to an overlapping circular pipe liner that is pulled into position. Following deployment, the longitudinal seam was welded with an adhesive that was activated and cured by induction heating. One example of this product is 100 mm (4 in.) diameter by 2.5 mm (0.10 in.) thick and is said to have a 5.9 MPa (870 psi) short-term burst pressure.
Figure 11 - RolaTube Bi-Stable Reeled Composite Material During the 6 month reporting period, RolaTube developed a modified version of the bi-stable reeled composite product, which uses nine plies of a glass-polypropylene material in the form of overlapping, pre-pregnated tapes of unidirectional glass and polymer. Glass-high density polyethylene (HDPE) material was also considered. The glass-polypropylene material was

12 41633R42.pdf
selected after problems were encountered bonding the glass-HDPE material to steel. Heat and pressure were used to consolidate the glass-polypropylene material into a liner (Figure 12). The resulting wall thickness of the liner is 2.85 mm (0.11 in.).
Figure 12 - Lay-Up and Forming of Fiber-Reinforced Composite Liner

13 41633R42.pdf
A supply of 114.3 mm (4.5 in.) outside diameter (OD) by 4 mm (0.156 in.) wall thickness, API 5L Grade B pipe material was procured and cut into four 1.2 m (4 ft.) long sections. After the inside surface was degreased, lengths of lining were installed into two of the pipe sections (Figure 13).
Figure 13 - Insertion of Liner into 114.3 mm (4.5 in.) Diameter Pipe

14 41633R42.pdf
The installation process consisted of inserting a silicon rubber bag inside the liner (Figure 14) and locating the liner inside the pipe. The silicon bag was then inflated to press the liner against the pipe wall.
Figure 14 - Silicon Rubber Bag Inserted into Liner For these experiments, the entire pipe sections were then heated to 200°C (392°F) in an oven (Figure 15) to fuse the liner to the pipe wall.
Figure 15 - Oven Used to Heat Pipe and Liner to 200°C (392°F)

15 41633R42.pdf
Possible choices for liner installation in the field include infra-red (IR) heaters on an expansion pig or a silicon bag inflated using hot air. An installed liner is shown in Figure 16.
Figure 16 - Liner Installed in 114.3 mm (4.5 in.) Diameter Pipe
16 41633R42.pdf
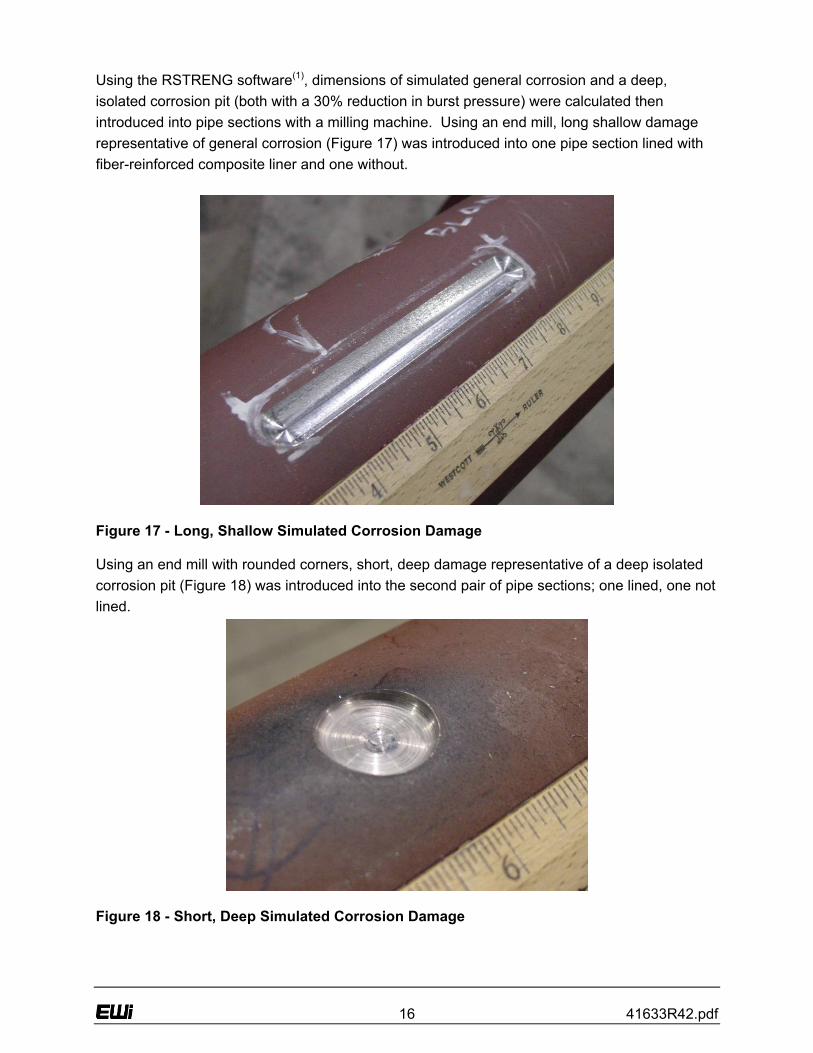
Using the RSTRENG software(1), dimensions of simulated general corrosion and a deep, isolated corrosion pit (both with a 30% reduction in burst pressure) were calculated then introduced into pipe sections with a milling machine. Using an end mill, long shallow damage representative of general corrosion (Figure 17) was introduced into one pipe section lined with fiber-reinforced composite liner and one without.
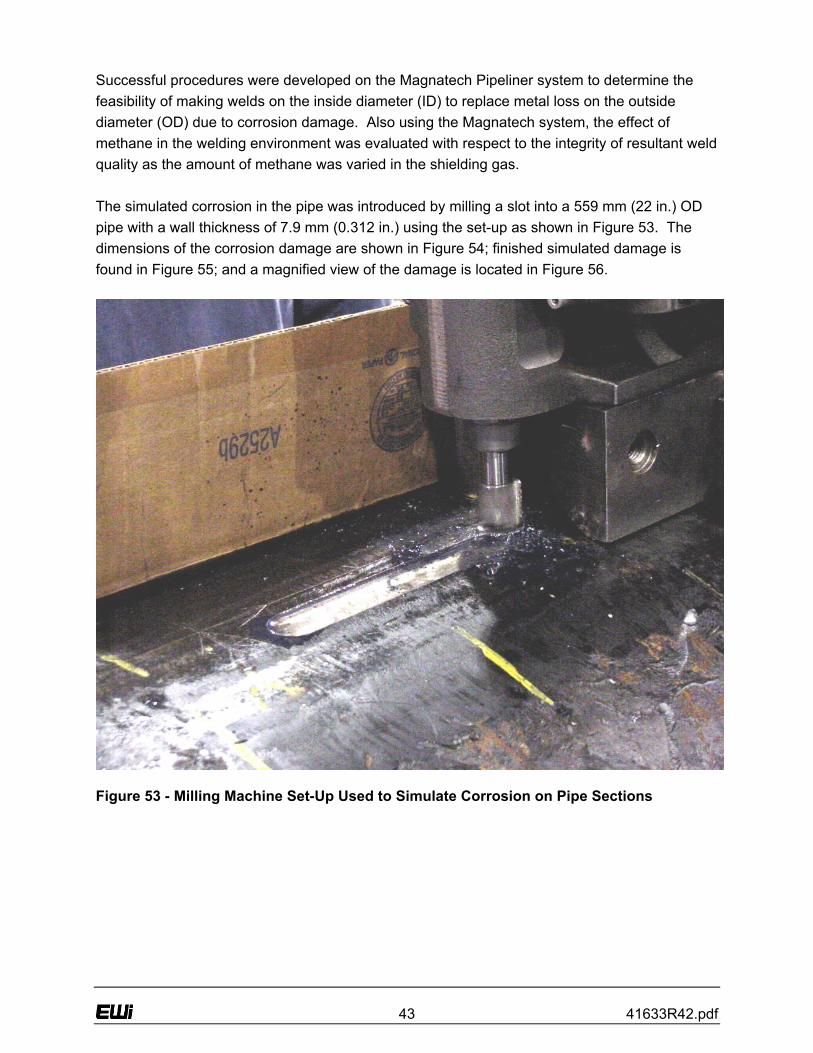
Figure 17 - Long, Shallow Simulated Corrosion Damage Using an end mill with rounded corners, short, deep damage representative of a deep isolated corrosion pit (Figure 18) was introduced into the second pair of pipe sections; one lined, one not lined.
Figure 18 - Short, Deep Simulated Corrosion Damage

17 41633R42.pdf
End caps were then welded to all four pipe sections as shown in Figure 19. Following the installation of end caps, all four pipe sections were hydrostatically pressurized to failure.
Figure 19 - 114.3 mm (4.5 in.) Diameter Pipe Section with Simulated Corrosion Damage
and Welded End Caps During the 12 month reporting period, using pipe sections with simulated corrosion damage, EWI hydrostatically tested a pipe section that was repaired with a carbon fiber-reinforced liner "patch", which was fabricated in-house. For repair simulation, a 508 mm (20 in.) diameter by 6.35 mm (0.25 in.) wall, API 5LX-52 pipe section was used (Figure 20).

18 41633R42.pdf
Figure 20 - Pipe Section Used for Test of Carbon Fiber Patch Design No. 1 With a ball end mill, long shallow damage representative of general corrosion was introduced into the pipe section. The simulated defect was 127 mm (5 in.) long and 3.45 mm (0.136 in.) deep (Figure 21) and effectively reduces the wall thickness down to 54%. The predicted burst pressure for this pipe material with a similar un-repaired defect is 6.72 MPa (974 psi).
Figure 21 - Simulated Corrosion Defect for First Carbon Fiber Liner Repair Test in
508 mm (20 in.) Diameter Pipe

19 41633R42.pdf
EWI procured raw carbon fiber material and fabricated a 11.42 mm (0.45 in.) thick reinforcement patch using a "wet lay-up" process with a vinylester resin system (composite patch design number 1). The raw materials used to create the patch design 1 were a standard 6K-tow, 5-harness weave carbon fiber fabric and a vinylester resin, catalyzed with methyl ethyl ketone peroxide (MEKP) and promoted with cobalt naphthenate. The resin had a gel time of 1.0 - 1.5 hours. The fabric was cut to give a quasi-isotropic lay-up with ± 45 degrees for the outer layers, interleaved with 0, 90 degree layers. A 567 g (20 oz.) woven roving, glass fabric outer layer was employed for the outer face (i.e., on the inside diameter of the patch). The inner glass face (i.e., outside diameter of the patch) was included to act as a galvanic corrosion barrier between the carbon fiber composite and the steel. The composite patch was fabricated using a wet lay-up process followed by vacuum bagging. To develop the technique, the first trial was a flat panel, approximately 254 mm (10 in.) by 254 mm (10 in.). It was determined that additional layers of fabric were needed to increase section thickness. This was accomplished by including extra 0, 90 degree internal layers in the semi-circular patch. The half-round composite patch (design 1) had an outside diameter that matched the internal diameter of the pipe section. The patch was 711 mm (28 in.) in length, 254 mm (10 in.) wide, by 11.42 mm (0.45 in.) thick. The semi-circular patch lay-up consisted of 27 layers; layers 1 and 27 were glass woven roving. The remainder consisted of alternating layers of ± 45 degree (i.e., quasi-isotropic) and 0, 90 degree (fiber orientation) to produce the patch (Table 1). A semi-circular mold was produced from a cut half-round of 508 mm (20 in.) diameter pipe (Figure 22). Figure 23 shows the dry pack of quasi-isometric fiber build. Figure 24 is the breather cloth frame draped around the pack. The Mylar top is draped next as in Figure 25, which is followed by the application of the top breather draped over the pack. Figure 26 is the vacuum bag film draped over entire pack.

20 41633R42.pdf
Patch Build Layer
Regular 9.65 mm (0.38 in.)
Thicker 11.43 mm (0.45 in.)
1 Glass Glass
2 Bias Bias
3 Regular Regular
4 Bias Bias
5 Regular Regular
6 Bias Bias
7 Regular Regular
8 Bias Bias
9 Regular Regular
10 Bias Bias
11 Regular Regular
12 Bias Regular
13 Regular Regular
14 Bias Bias
15 Regular Regular
16 Bias Regular
17 Regular Regular
18 Bias Bias
19 Regular Regular
20 Bias Bias
21 Regular Regular
22 Bias Bias
23 Glass Regular
24 Bias
25 Regular
26 Bias
27 Glass Table 1 - Layer Build Schedule for Carbon Fiber Patch Design 1

21 41633R42.pdf
Figure 22 - Mylar-Lined Semi-Circular Mold for Carbon Fiber Patch Design 1
Figure 23 - Dry Pack of Quasi-Isometric Fiber

22 41633R42.pdf
Figure 24 - Breather Cloth Frame Draped Around Pack
Figure 25 - Mylar Top Shown Draped (Top Breather Draped Next Over Pack)

23 41633R42.pdf
Figure 26 - Vacuum Bag Film Draped Over Entire Pack FiberGlast 1110 vinylester resin was catalyzed at 1.25% MEKP (9% Oxygen equivalent). The assembly required about 1,600 g (56.43 oz.) of catalyzed resin giving a cup gel time of 75 minutes. Each layer was pre-impregnated with resin as the lay-up proceeded. The hand lay-up was prepared inside the mold with the applied vacuum being maintained until gellation and initial cure was assured (approximately 4 hours). The assembly was then cured overnight. After excising the cured panel, it was trimmed to insertion dimensions. Forced post-cure was not required to maintain dimensions. The calculated fiber volume was between 40% - 45%. To facilitate patch installation, the outer surface of the patch (design 1) was grit-blasted using 50 - 80 grit Alumina to remove surface resin (Figure 27). Similarly, the installation area inside the pipe was grit-blasted to a near-white blast with 50 - 80 grit Alumina (Figure 28). After cleaning, a liberal coating of 3M DP460 epoxy adhesive was applied to the internal faying surface and a thin coating was applied to the patch faying surface (Figure 29).

24 41633R42.pdf
Figure 27 - Completed Repair Patch (Design 1) with Grit-Blasted Outer Diameter
Figure 28 - Application of 3M DP460 Adhesive to Grit-Blasted Inside Diameter of Pipe

25 41633R42.pdf
Figure 29 - Application of Adhesive to Repair Patch (Design 1) The patch and pipe section were mated as shown in Figure 30.
Figure 30 - Installation of Repair Patch (Design 1)

26 41633R42.pdf
Bar clamps were used along the axis of the pipe to hold the patch in place for cure. Figure 31 shows the adhesive squeeze-out being removed prior to forming a fillet as shown in Figure 32.
Figure 31 - Clamping Bars Used to Hold Repair Patch (Design 1) in Place Figure 32 - Adhesive Fillet Around Repair Patch (Design 1)

27 41633R42.pdf
Approximately two weeks after the patch cured, the pipe section with the carbon fiber-reinforced liner (design 1) was hydrostatically tested until failure. For optimization and validation activities during the 24 month reporting period, a 508 mm (20 in.) diameter by 6.35 mm (0.25 in.) wall, API 5L-X52 pipe section with simulated corrosion damage was repaired with a carbon fiber-reinforced patch in a "pressure bandage" configuration (design 2) as shown in Figure 33. The simulated corrosion damage was 127 mm (5.0 in.) long by 3.45 mm (0.136 in.) deep, representing a 25% reduction in burst strength.
Figure 33 - Pressure Bandage Carbon Fiber-Reinforced Patch (Design 2) Patch design number 2 was manufactured using the same materials and procedures developed during the 18 month reporting period. As shown in Figure 33, the patch resembles a "pressure bandage" (design 2) wherein there is a solid 254 mm (10 in.) long by 254 mm (10 in.) wide by 11.43 mm (0.45 in.) thick solid thickness of composite in the middle with wings of composite material that necked down toward the outside of both ends giving the patch a total overall length of 711.2 mm (28 in.). All 0, 90 construction was used with 27 layers (layers 1 and 27 were glass woven roving). Calculated fiber volume was 50% - 55%. The "pressure bandage" patch was allowed to cure for approximately two weeks after fabrication. After the patch was installed in the pipe section, it was allowed to cure for another week before hydrostatic testing until failure.

28 41633R42.pdf
During the 30 month reporting period, patch material was tested to determine tensile strength, modulus of elasticity, and the interlaminar shear value and two additional series of burst tests were conducted. The first series of burst tests was a repeat of the tests conducted in the 24 month reporting period with a thinner patch (design 3). The second series of burst tests involved a pipe section with long, shallow damage repaired with patch design 3. Three composite layup structures were designed to evaluate the mechanical properties of the material:
• Quasi-isotropic layup with alternating layers of 0, 90 and ± 45 with extra 0, 90 near the thickness-center
• 0, 90 only layup
• Uniaxial 0 only layup The thicknesses of the quasi-isotropic and the 0, 90 panels were 11.43 mm (0.45 in.). The thickness of the uniaxial panel was 8.89 mm (0.35 in.). For the first two, fiberglass close-out layers were included on the “steel side” as a proposed corrosion barrier at the steel/carbon fiber interface and as the top layer (bag side). The uniaxial panel had no fiberglass. The carbon-glass constructions produce ~40% w/w carbon fiber, with a density of 1.47-1.51 g/cc. The uniaxial panel contains >70% carbon fiber w/w, so a higher tensile modulus is anticipated (its density was measured at 1.44 g/cc, reflecting mostly the absence of fiberglass). All panels were produced using a combined hand layup-vacuum bagging technique. They were cured at least one month under ambient conditions before testing or were postcured at 70°C (158°F) for 2 hours. Figure 34 through Figure 39 show the panel fabrication process.
Figure 34 - Mylar Over Release-Coated Plate

29 41633R42.pdf
Figure 35 - Rim of Breather Added ≅ 76.2 mm (3 in.) Wide
Figure 36 - Dry Stack Before Layup

30 41633R42.pdf
Figure 37 - Top Breather Added
Figure 38 - Vacuum Bag Added Over Sealer Tape

31 41633R42.pdf
Figure 39 - Wet Panel Under Applied Vacuum The tensile dogbone samples were cut as a standard ASTM D638 Type-1 sample. Interlaminar shear (ILS) samples were taken from a separate panel in which a portion of one middle layer was omitted and replaced with a Teflon release sheet. This produced a molded-in defect notch for three-point bending tests. ILS panel was built with 0, 90 layers only. The first series of burst testing performed during the 30 month reporting period was a repeat of the tests conducted in the 24 month reporting period with a thinner patch (design 3). Two 508 mm (20 in.) diameter by 6.35 mm (0.25 in.) wall, API 5L-X52 pipe section were prepared with simulated corrosion damage that was 127 mm (5.0 in.) long by 3.45 mm (0.136 in.) deep, representing a 25% reduction in burst strength. One pipe section was repaired with patch design 3 which was fabricated in the same manner as before with all 0, 90 construction (as shown in Figure 40). Patch 3 was 254 mm (10 in.) long by 711.2 mm (28 in.) wide by 7.62 mm (0.3 in.) thick and consisted of 18 layers (layers 1 and 18 were glass woven roving). For comparison purposes, one pipe section with simulated corrosion was burst tested in the unrepaired condition, one pipe section in the virgin condition was burst tested, and one repaired pipe section with simulated damage was burst tested.

32 41633R42.pdf
Figure 40 - Patch Design 3 Installed in Pipe Section The second series of burst testing during the 30 month reporting period involved a pipe section with long, shallow damage. Two 508 mm (20 in.) diameter by 6.35 mm (0.25 in.) thick API 5L-52 pipe sections were prepared with simulated corrosion damage that was 381 mm (15 in.) long by 2.54 mm (0.1 in.) deep, representing a 25% reduction in burst strength (see Figure 41).
Figure 41 - Long-Shallow Simulated Corrosion

33 41633R42.pdf
One pipe section was repaired with patch design 3 which was fabricated in the same manner as before with all 0, 90 construction. As shown in Figure 42, the patch was 254 mm (10 in.) long by 711.2 mm (28 in.) wide by 7.62 mm (0.3 in.) thick and consisted of 18 layers (layers 1 and 18 were glass woven roving).
Figure 42 - Fabrication of Patch Design 3 for Long-Shallow Defect Evaluation For comparison purposes, one pipe section with long-shallow simulated corrosion was burst tested in the un-repaired condition, one pipe section in the virgin condition was burst tested, and one repaired pipe section with long-shallow simulated damage was burst tested.

34 41633R42.pdf
3.2 - Weld Deposition Repair Trials The project plan included evaluations of different pipeline repair conditions, such as soil and coating type, on weld deposition repairs; therefore, baseline welding procedures were needed to support these evaluations. During the second reporting period, several welding systems were evaluated for internal weld deposition using GMAW and used to develop baseline welding procedures. These evaluations focused on determining whether or not the systems could make a good internal weld deposit. The pipe axis was fixed in the 5G horizontal position (Figure 43). As welding progressed around the inside diameter, welding position transitioned between flat, vertical, and overhead. The types of envisioned repairs were ring deposits to perhaps reinforce a defective weld, spiral deposits to repair an entire pipeline section, and patches to repair local corrosion damage. Weld deposit motion for the first two types would best be achieved using orbital type welding procedures where welding clocks around the circumference. The patch repair could be accomplished using deposit motion that was either orbital or axial. Motion also required the use of torch weaving, a technique that improves out-of-position (i.e., vertical and overhead) weld pool shape. This is common in vertical-up welding to provide an intermediate shelf on which to progressively build the weld pool deposit. The effects of deposit motion on productivity and quality also required evaluation for this application. With the different welding systems, the preferred metal transfer mode for GMAW was short-circuit transfer. This mode assures drop transfer in all welding positions. Open arc droplet transfer that is provided by spray, pulse spray, and globular transfer are not suitable for spiral overhead welding where gravity promotes spatter instead of metal transfer. Figure 43 - Pipe in the 5G Horizontal and Fixed Position
Centerline

35 41633R42.pdf
The following welding systems were evaluated for internal repair of pipelines:
• Internal bore cladding system (Bortech)
• 6-axis robot capable of complex motion control (OTC Daihen)
• Orbital welding tractor configured for inside welding (Magnatech Pipeliner) Each system had motion control limitations and individually would not be appropriate candidates for an internal repair welding system. The internal bore cladding system manufactured by Bortech (Figure 44 and Figure 45) was designed for spiral cladding the inside of pipe that is preferably in the vertical position.
Figure 44 - Bortech Motion Mechanism for Continuous Spiral Deposition

36 41633R42.pdf
Figure 45 - Bortech Torch and Torch Height Control The Bortech system has simple controls for operating constant voltage (CV) power supplies (Figure 46). This includes the ability to set wire feed speed, voltage, step size (for the spiral motion), and rotation speed (i.e., travel speed). The system is very affordable as it uses simple motors for motion. When positioned inside a horizontal pipe, the rotation drive suffered from significant backlash. Conversations with the supplier led to the purchase and installation of a counterbalance weight that was used to balance the weight of the opposing torch.
Figure 46 - Bortech Controller

37 41633R42.pdf
Preliminary weld trials with the Bortech system had marginal results. Only stringer beads were successfully deposited using short-circuit transfer in the spiral clad mode. Travel speeds of 3.81 mpm (150 ipm) to 4.45 mpm (175 ipm) were used with an 0.89 mm (0.035 in.) diameter ER70S-6 filler metal (i.e., electrode). With stringer beads, the deposition rate was low since only narrow beads could be deposited. The bead shape suffered the most in the overhead position when starting downhill. Weaving was required to improve weld bead profile thus allowing higher deposition rates and improved fusion. The off-the-shelf system did not permit oscillation, but could if adapted with modern controls. In principle this type of mechanism would be suitable for an internal repair system. Here, anti-backlash servo-motors and gears, and programmable controls would be required to improve the system. Similarly, an additional motor drive that permits control of torch and work angle would also be required to cope with all the possible repair scenarios to optimize bead shape. Based on the results experienced with the Bortech system, the team decided to develop preliminary welding procedures using a robotic GMAW system. A 6-axis coordinated motion robot (Figure 47) permitted the application of weave beads for spiral cladding or stringer beads in either direction. An observed limitation was the fact that the system did not have a welding torch current commutater to permit continuous spiral welding.
Figure 47 - OTC Robot Set-Up for Internal Welding

38 41633R42.pdf
The standard robot welding torch (Figure 48) could only be used for half a revolution, then it had to be unwound to complete the remainder of each deposit ring. This limitation was acceptable for parameter development since the focus was the welding parameters not high duty cycle welding. The robot was interfaced to an advanced short-circuit power supply, the Kobelco PC-350.
Figure 48 - OTC Robot Arm and Torch The Kobelco PC-350 power supply (Figure 49) uses fuzzy logic pulse waveforms to minimize spatter during metal transfer and permits the application of variable polarity waveforms. Variable polarity combines the rapid, low heat input, melting of negatively charged electrode with the metal transfer stability of electrode positive. Until 1988, all commercial GMAW systems used positively charged electrodes for constant voltage and pulse power supplies. The PC-350 is more advanced than standard variable polarity power supplies, as it uses a fuzzy logic short-circuit anticipation control. On comparable applications that require low heat input, the PC-350 has shown productivity improvements compared to standard short-circuit. This power supply is equipped with waveform algorithms pre-programmed for steel using either 100% Carbon Dioxide shielding gas or an Argon - Carbon Dioxide shielding gas mixture for both

39 41633R42.pdf
0.8 mm (0.035 in.) or 1.2 mm (0.045 in) diameter electrodes. The waveform was simply modified by changing the electrode negative ratio on the pendant. Arc length and heat input is changed by an arc length knob on the pendant, which varies the pre-programmed pulse frequency.
Figure 49 - Kobelco PC-350 Variable Polarity Fuzzy Logic Power Supply The OTC robot welding system was used to develop preliminary repair welding procedures with the intent that they would be transferred to a different system for pipeline repair demonstrations. A range of orbital (ring motion) weave parameters were developed to establish an operating window, deposit quality, and deposition rate. Preliminary tests were also performed to evaluate bead overlap and tie-in parameters that would be required to make high quality repairs. All the welding tests were performed with a 95% Argon - 5% Carbon Dioxide shielding gas mixture using an 0.89 mm (0.035 in.) diameter ER70S-6 electrode.

40 41633R42.pdf
Several years ago, PG&E purchased a welding tractor (Figure 50) from Magnatech for internal weld repair procedure development. This system was sent to EWI so it could be used for pipeline repair evaluations, as this equipment is portable where the robot welding system is not.
Figure 50 - Magnatech Pipeliner II Welding Tractor

41 41633R42.pdf
The Magnatech welding tractor has orbital motion with controls (Figure 51) for torch oscillation. The system is limited to a finite number of revolutions that can be made before cables need to be unwound. The controls are analog and do not have high accuracy; however, they are sufficient for preliminary parameter development and demonstration welding. Programmable controls would be required for an internal repair welding system using a Magnatech tractor. In addition, numerous mechanical changes would be required to accommodate a range of pipeline diameter sizes.
Figure 51 - Magnatech Control Pendant Showing Control Parameters

42 41633R42.pdf
The Magnatech tractor was interfaced to a Panasonic AE 350 power supply (Figure 52). This power supply provides pulse waveforms and can be operated in a short-circuit mode where artificial intelligence is used to minimize spatter. The current pulsing and short circuiting helps lower heat input and improve deposition rate in out-of-position welds. Pre-programmed current waveforms are provided by algorithms for steel electrodes, and many other materials.
Figure 52 - Panasonic AE 350 Power Supply with Pulse Short-Circuit Metal Transfer
Control PG&E bought the Magnatech Pipeliner system specifically to repair weld 559 mm (22 in.) diameter pipe. In order to use the PG&E system for this project, Panhandle Eastern supplied approximately 12.19 m (40 ft.) of asphalt covered, 559 mm (22 in.) diameter pipe that was made in the 1930s. Additional lengths of 508 mm (20 in.) diameter pipe of similar vintage were already in the EWI material inventory.
43 41633R42.pdf
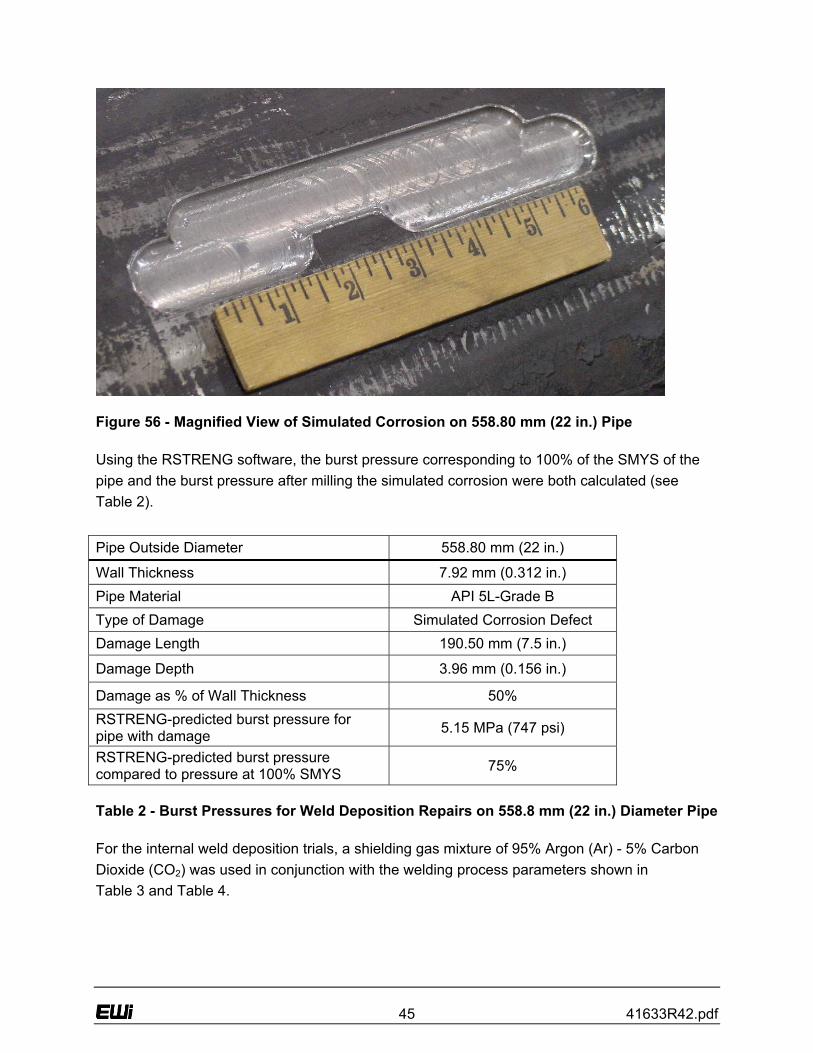
Successful procedures were developed on the Magnatech Pipeliner system to determine the feasibility of making welds on the inside diameter (ID) to replace metal loss on the outside diameter (OD) due to corrosion damage. Also using the Magnatech system, the effect of methane in the welding environment was evaluated with respect to the integrity of resultant weld quality as the amount of methane was varied in the shielding gas. The simulated corrosion in the pipe was introduced by milling a slot into a 559 mm (22 in.) OD pipe with a wall thickness of 7.9 mm (0.312 in.) using the set-up as shown in Figure 53. The dimensions of the corrosion damage are shown in Figure 54; finished simulated damage is found in Figure 55; and a magnified view of the damage is located in Figure 56.
Figure 53 - Milling Machine Set-Up Used to Simulate Corrosion on Pipe Sections

44 41633R42.pdf
19.05 mm [0.75 in.]
168.40 mm [6.63 in.]
190.50 mm [7.51 in.]
63.50 mm [2.50 in.]
95.25 mm [3.75 in.]
Ø25.40 mm [Ø1.00 in.]
38.10 mm [1.50 in.]
Typical (6) Places
Figure 54 - Dimensions of Simulated Corrosion on 558.80 mm (22 in.) Pipe
Figure 55 - Simulated Corrosion on 558.80 mm (22 in.) Pipe
45 41633R42.pdf
Figure 56 - Magnified View of Simulated Corrosion on 558.80 mm (22 in.) Pipe Using the RSTRENG software, the burst pressure corresponding to 100% of the SMYS of the pipe and the burst pressure after milling the simulated corrosion were both calculated (see Table 2).
Pipe Outside Diameter 558.80 mm (22 in.)
Wall Thickness 7.92 mm (0.312 in.) Pipe Material API 5L-Grade B Type of Damage Simulated Corrosion Defect Damage Length 190.50 mm (7.5 in.)
Damage Depth 3.96 mm (0.156 in.)
Damage as % of Wall Thickness 50% RSTRENG-predicted burst pressure for pipe with damage 5.15 MPa (747 psi)
RSTRENG-predicted burst pressure compared to pressure at 100% SMYS 75%
Table 2 - Burst Pressures for Weld Deposition Repairs on 558.8 mm (22 in.) Diameter Pipe For the internal weld deposition trials, a shielding gas mixture of 95% Argon (Ar) - 5% Carbon Dioxide (CO2) was used in conjunction with the welding process parameters shown in Table 3 and Table 4.

46 41633R42.pdf
Layer Pass Wire Feed
Speed (mpm)
Current (amps) Volts Length
(mm) Time (sec)
Travel Speed (mpm)
Heat Input
(kJ/mm)
1 5.44 100 19.9 158.750 165 0.058 2.07 2 5.51 97 19.8 165.100 175 0.057 2.04 3 5.46 96 19.9 171.450 173 0.059 1.93 4 5.49 98 19.8 165.100 173 0.057 2.03 5 5.46 98 19.8 168.275 185 0.055 2.13 6 5.46 99 20.0 171.450 191 0.054 2.21 7 5.38 98 19.9 171.450 192 0.054 2.18 8 5.46 99 19.8 174.625 200 0.052 2.24 9 5.44 98 19.8 171.450 200 0.051 2.27 10 5.38 98 19.5 174.625 197 0.053 2.16
1
11 5.46 100 19.6 174.625 192 0.055 2.16 1 5.49 96 19.9 155.575 179 0.052 2.20 2 5.41 98 19.8 165.100 179 0.055 2.11 3 5.38 99 19.9 155.575 171 0.055 2.17 4 5.51 98 19.8 161.925 187 0.052 2.24 5 5.46 104 19.6 160.274 176 0.055 2.24 6 5.44 101 19.8 165.100 189 0.052 2.29 7 5.46 98 19.8 165.100 189 0.052 2.22 8 5.46 96 19.9 163.576 199 0.049 2.32 9 5.46 100 19.8 166.624 204 0.049 2.42
2
10 5.49 101 19.8 169.545 205 0.050 2.42 Table 3 - Metric Unit Welding Parameters for Internal Weld Deposition Repair

47 41633R42.pdf
Weld Layer Pass
Wire Feed
Speed (ipm)
Current (amps) Volts Length
(in) Time (sec)
Travel Speed (ipm)
Heat Input (kJ/in)
1 214 100 19.9 6.25 165 2.27 52.5 2 217 97 19.8 6.50 175 2.23 51.7 3 215 96 19.9 6.75 173 2.34 49.0 4 216 98 19.8 6.50 173 2.26 51.6 5 215 98 19.8 6.63 185 2.15 54.2 6 215 99 20.0 6.75 191 2.12 56.0 7 212 98 19.9 6.75 192 2.11 55.4 8 215 99 19.8 6.88 200 2.06 57.0 9 214 98 19.8 6.75 200 2.02 57.6 10 212 98 19.5 6.88 197 2.09 54.8
1
11 215 100 19.6 6.88 192 2.15 54.7 1 216 96 19.9 6.13 179 2.06 55.8 2 213 98 19.8 6.50 179 2.18 53.5 3 212 99 19.9 6.13 171 2.15 55.1 4 217 98 19.8 6.38 187 2.04 57.0 5 215 104 19.6 6.31 176 2.15 57.0 6 214 101 19.8 6.50 189 2.06 58.1 7 215 98 19.8 6.50 189 2.06 56.4 8 215 96 19.9 6.44 199 1.94 59.0 9 215 100 19.8 6.56 204 1.93 61.5
2
10 216 101 19.8 6.68 205 1.95 61.5 Table 4 - U.S. Customary Unit Welding Parameters for Internal Weld Deposition Repair

48 41633R42.pdf
The dirt box in Figure 57 was used to simulate in-service welding conditions and cooling rates for weld deposition repair evaluation trials.
Figure 57 - Dirt Box for Weld Deposition Repair The pipe section with the dirt box was rotated as shown in Figure 58 to facilitate welding on the inside of the pipe section from the 6:00 position (where the weld passes were initiated) to the 9:00 position (where the weld passes were terminated).
Figure 58 - Orientation of Pipe Section with Dirt Box for Weld Deposition Repair

49 41633R42.pdf
An outline of the simulated corrosion was made on the ID of the pipe (Figure 59) to assure the deposited weld metal completely covered the area of simulated corrosion on the inside of the pipe.
Figure 59 - Outline of Simulated Corrosion on Inside Diameter of Pipe Section The first pass of the first layer of the ID weld repair is shown in Figure 60.
Figure 60 - First Pass of First Layer of Deposited Weld Metal on Inside Pipe Diameter

50 41633R42.pdf
For the first layer of weld deposition, each subsequent weld pass overlapped the previous weld pass by 1.5 mm (0.06 in.). The second pass of the first layer of the ID weld repair is shown in Figure 61.
Figure 61 - Second Pass of First Layer of Deposited Weld Metal on Inside Pipe Diameter During execution of the third pass of the first layer of deposited weld metal, a small defect was created as indicated in the yellow circle in Figure 62. The defect was repaired with an autogenous (i.e., with no filler metal) gas tungsten arc weld (GTAW). Figure 62 - Third Pass of First Layer of Deposited Weld Metal on Inside Pipe Diameter

51 41633R42.pdf
The finished first layer of the deposited weld metal repair is shown in Figure 63. The axial length of the deposited layer exceeded the simulated corrosion by more than 25.4 mm (1.0 in.), which is three times the pipe wall thickness (the weld deposit should exceed the corrosion area by at least one wall thickness).
Figure 63 - Finished First Layer of Deposited Weld Metal on Inside Pipe Diameter First pass of the second layer is shown in Figure 64. The second layer passes were centered over the weld toes of the previous layer.
Figure 64 - First Pass of Second Layer of Deposited Weld Metal on Inside Pipe Diameter

52 41633R42.pdf
Completed second layer is shown in Figure 65.
Figure 65 - Finished Second Layer of Deposited Weld Metal on Inside Pipe Diameter

53 41633R42.pdf
For the methane evaluation study, shielding gas was supplied by two independent gas bottles: one bottle contained a mixture of 95% Ar - 5% CO2; the other bottle contained a mixture of 10% methane with a balance of 95% Ar - 5% CO2. The amount of methane was raised by increasing the flow rate on the flow meter of the bottle containing methane. Linear travel speeds of the welds were not recorded as it was held constant for the preparation of all weld specimens. Methane welding process parameters are found in Table 5.
Shielding Gas Flow Rate
95% Ar + 5% CO2
10% Methane + 4.5% CO2 + 85.5% Ar
Wire Feed Speed Weld ID
(m3/hr) (ft3/hr) (m3/hr) (ft3/hr)
Voltage (volts)
Current (amps)
(mpm) (ipm) 325-2 1.41 50 0.00 0 23.4 111 5.36 211 325-6 1.22 43 0.20 7 23.4 104 5.23 206 325-3 1.13 40 0.28 10 23.3 108 5.28 208 325-8 0.99 35 0.28 10 23.2 101 5.26 207 325-4 0.99 35 0.42 15 23.4 99 5.08 200 325-9 0.85 30 0.42 15 23.1 97 5.56 219 325-5 0.85 30 0.57 20 23.1 96 5.41 213
Table 5 - Welding Process Parameters for Weld Deposition Repairs in Methane No welding deposition repairs were performed this reporting period. This subtask is complete. 3.3 - Baseline Pipe Material Performance Due to large discrepancies in the predicted hydrostatic burst pressures and the actual burst pressures, additional physical tests were performed. Tensile testing was conducted on 508 mm (20 in.) and 558.8 mm (22 in.) pipe material. Four additional hydrostatic pressure tests were also conducted to establish baseline performance data for un-repaired pipe sections in the virgin condition (i.e., undamaged) and with un-repaired simulated corrosion damage. Simulated corrosion damage (similar to that found in Figure 54 and Figure 56) was introduced into one section of 558.8 mm (22 in.) diameter by 7.93 mm (0.312 in.) thick API 5L Grade B pipe and into one section of 508 mm (20 in.) diameter by 6.4 mm (0.25 in.) wall API 5L-X52 pipe. No repair processes were applied to either pipe section with simulated damage. Both pipe sections were assembled as shown in Figure 19 to prepare for burst testing. Two pipe sections in the virgin condition, one section of 558.8 mm (22 in.) diameter by 7.93 mm (0.312 in.) thick API 5L Grade B pipe and one section of 508 mm (20 in.) diameter by 6.4 mm (0.25 in.) wall API 5LX-52

54 41633R42.pdf
pipe, were assembled as shown in Figure 19 to prepare for burst testing. All four un-repaired pipe sections were then hydrostatically tested until failure. This subtask is complete. 3.4 - Survey Development The survey (Appendix A) was sent to a wide range of gas transmission companies, both member companies of the Pipeline Research Council International (PRCI), and also to other companies within the industry (Appendix B). The list of contacts was built up from the PRCI Materials Committee Roster, a list of other gas companies from the http://www.ferc./gov/gas companies/pipelines web site, and a web-based list of gas company executives, in addition to personal contacts within the industry. An extensive series of phone calls were made to establish the most appropriate person or persons at each company to whom to send the survey, and to establish whether a central point of contact (POC) or multiple recipients was preferred. In most cases, the appropriate staff member at parent companies with several pipeline subsidiaries preferred to be a central POC, gathering this and sending the feedback to EWI through one survey for their company. Email addresses (Appendix D) were gathered for all the survey recipients such that the survey could be sent, completed, and returned, electronically. No survey activities were performed this reporting period. This subtask is complete. 3.5 - Simulation and Analysis of Potential Repairs The composite liner requirements were determined from the assumed values for an economical carbon fiber reinforcement with a vinylester resin system. The objective was to define realistic combinations of composite material and thickness for use in liner systems for internal repair of natural gas transmission pipelines. To date, two simple cases have been investigated. The first case is one in which the entire steel pipe has been lost to external corrosion, leaving only the liner to carry the external stress. The second case is one in which shear failure occurs in the matrix material between the layers of fibers. EWI chose an initial pipeline size in the middle of the commonly used range for transmission pipelines: a 508 mm (20 in.) outside diameter pipe with a 6.35 mm (0.25 in.) wall thickness made from X-65 pipe material. For this situation, the additional liner material could not be so thick as to prevent subsequent examinations of the adjacent steel pipeline by internal inspection devices and was limited the thickness of the simulated liner to less than 12.7 mm (0.5 in.). No simulation activities were performed during this reporting period. 3.6 - Development of Preliminary Post Repair Testing Protocol

55 41633R42.pdf
The Project Management Plan was modified on March 14, 2005 to include the development of a preliminary post repair testing protocol (Cooperative Agreement modified on April 7, 2005). Based on the results of full-scale validation tests, EWI will develop a detailed preliminary protocol which could be used for verification of effectiveness of repair following application. The protocol will define a proposed method for non-destructively determining success or failure of the pipeline repair and should address any potential problems, which may need to be addressed in repair verification testing. A test repair patch with anticipated defect types and sizes was built into the adhesive bond to make a calibration block for the evaluation of each candidate nondestructive evaluation (NDE) method. To create a calibration block, a 508 mm (20 in.) diameter by 6.35 mm (0.25 in.) wall 5L-X52 pipe section was used. Two areas of simulated corrosion were introduced on the outside diameter on either side of the pipe centerline as shown in Figure 66. Figure 66 - Two Areas of Simulated Corrosion on Outside Diameter of Pipe Section
C L

56 41633R42.pdf
As shown in Figure 67, the inside diameter was then shot blasted to prepare the surface for adhesive bonding (note location of pipe centerline). The area that will contain known defects was outlined with black marker. Figure 67 - Shot Blasted Inside Diameter of Pipe Section Areas of disbondment bewteen the adhesive system and the pipe wall were created by the application by silicon oil in specific areas on either side of the pipe centerline. Figure 68 shows the disbond areas masked on the inside diameter of the pipe. Figure 68 - Disbond Area Masked with Paper Silicone oil was then sprayed on the pipe surface as shown in Figure 69. Figure 70 shows the pipe surface after the paper masking is removed.
C L
C L

57 41633R42.pdf
Figure 69 - Silicone Oil Applied to Pipe Figure 70 - Pipe Surface After Mask Removed Defects were made by cutting masking tape into triangles (Figure 71). These defects were affixed to the patch to simulate defects between the patch and the adhesive (Figure 72). The patch (thick 0 - 90) was 6K-tow, 5-harness weave carbon fiber fabric and a vinylester resin (FiberGlast 1110 vinylester resin), catalyzed with methyl ethyl ketone peroxide (MEKP) and promoted with cobalt naphthenate.
C A
C L

58 41633R42.pdf
Figure 71 - Masking Tape Defects Figure 72 - Defect Locations on Outside Diameter of Patch
L C

59 41633R42.pdf
Using 3M DP460 epoxy, the patch was then adhesively bonded to the ID of the pipe section with known defects as shown in Figure 73. Figure 73 - Test Repair Patch with Known Defect Types and Sizes This subtask is in process.
Disbond Area
Defect Area
C L

60 41633R42.pdf
4.0 - RESULTS AND DISCUSSION
This report describes the first twenty-four months of progress for a project sponsored by the U.S. Department of Energy (DOE) National Energy Technology Laboratory (NETL) to develop internal repair technology for gas transmission pipelines. In order to thoroughly investigate repair technology, this project brings together a combination of partners that have a proven track record in developing pipeline repair technology. The project team consists of Edison Welding Institute (EWI), a full-service provider of materials joining engineering services; Pacific Gas & Electric (PG&E), a pipeline company that has a current need for the technology; and the Pipeline Research Council International (PRCI), an international consortium of pipeline companies, to provide project oversight and direction. EWI is the lead organization performing this Award for NETL in Morgantown, West Virginia. Task 1.0 - Research Management Plan During the first 6 month reporting period, the team created a Research Management Plan(2). This document contains a work breakdown structure and supporting narrative that concisely summarizes the overall project. The plan is an integration of the technical and programmatic data into one document that details the technical objectives and technical approach for each task and subtask. The document also contains detailed schedules and planned expenditures for each task and all major milestones/decision points. During the first and second reporting periods, the plan was updated to reflect a schedule rearrangement, and as mutually decided by NETL and EWI, the plan was then updated to accommodate a six-month no cost extension required to obtain new carbon fiber-reinforced composite liner material for evaluation. During the 30 month reporting period, the Project Management Plan was modified (on March 14, 2005) to change the work scope of Subtask 5.4 from Perform Field Trials on Abandoned Pipeline to Development of Preliminary Post Repair Testing Protocol (see section Subtask 5.4 for a complete description of the reasoning/events that precipitated the change). This is a living document that changes as necessary throughout project duration. Task 2.0 - Technology Status Assessment During the first six-month reporting period, a Technology Status Report(3) was produced that presents the status of existing pipeline repair technology that can be applied to the inside of a gas transmission pipeline. This report describes the current state-of-the-art technologies that are being developed, including the positive and negative aspects of each technology. This task is complete.

61 41633R42.pdf
Task 3.0 - Review Operators Experience and Repair Needs During the second six-month reporting period, a total of fifty-six pipeline operator companies were surveyed to determine the specific geographic locations and special situations where internal repair would be the preferred repair method for gas transmission pipelines. A total of twenty completed surveys were returned, representing a 36% response rate, which is considered very good given the fact that tailored surveys are known in the marketing industry to seldom attract more than a 10% response rate. This task is complete. Subtask 3.1 - Repair Needs and Performance Requirements The pipeline operators experience and repair needs survey was divided into the following parts:
• Currently-Used Repair Methods
• Use/Potential Use of Internal Repair
• Need for In-Service Internal Repair
• Applicable Types of Damage
• Operational and Performance Requirements for Internal Repairs The survey primarily focused on pipeline operating companies (gas transmission) that are members of the Pipeline Research Council International (Appendix B). The survey was also sent to other pipeline operating companies (Appendix C). A detailed list of contact information for surveyed individuals can be found in Appendix D. Following receipt of completed surveys, follow-up telephone calls were made to further identify the range of pipeline sizes, materials and coating types in most common use and the types of pipeline damage and remediation/upgrades (to more stringent code requirements) that are most frequently encountered. The pipeline companies were also asked to define specific operational and performance requirements for internal repairs, including post repair inspection and future pipeline inspection (i.e., pigging). Additionally, the survey determined operating requirements such as the minimum and maximum distance a repair system needs to be able to travel inside a pipe to facilitate internal repair and potential obstructions such as elbows, bends, branches, and taps that may limit access. Companies that offer in-line inspection services were also surveyed to determine the maximum geometric variations associated with internal repairs (particularly internal build-up, liner thickness, etc.) that can be tolerated by current and next generation in-line inspection vehicles (a.k.a. smart pigs). This task is complete.

62 41633R42.pdf
Subtask 3.2 - Target Specifications for an Internal Pipeline Repair System The results of the survey were collected/analyzed and the target specifications for an internal Pipeline Repair System were identified. General Specifications:
• The most frequently cited potential application would be for out-of-service use under river crossings, lakes, swamps, highways, high population density areas, and railway crossings.
• Use of internal repair as a temporary repair is of limited interest and is only attractive in seasonal climates where excavation and permanent repair would occur during the summer months.
• The repair system should have the ability to effect permanent internal repairs within the range of 508 mm to 762 mm (20 in. to 30 in.) diameter pipe as identified by 90% of survey respondents (559 mm (22 in.) diameter is the most commonly used size).
Deployment Distance Specifications:
• One excavation should be required to insert internal repair device into the pipe. From this insertion point, the repair device should travel in each direction from the excavation.
o 81% of all respondents would be served by a pig-based system (with despooled umbilicals) capable of traveling 610 m (2,000 ft.) which would suffice for all highway and river crossings. A river crossing of up to 1,219 m (4,000 ft.) could be accessed from an insertion point on either side of the river.
Inspection Specifications:
• The repaired pipeline must be inspectable by pigging after repair per DOT code 49 CFR 192.150(4) which states, "each new transmission line and each line section of a transmission line where the line pipe, valve, fitting, or other line component is replaced must be designed to accommodate the passage of instrumented inspection devices."
• Repairs made by the system must be inspectable via nondestructive evaluation (NDE) pigging, preferably radiographic testing (RT), with ultrasonic testing (UT) as an acceptable alternative. Inspection requirements should meet those specified in the following codes:
o ASME B31.8
o ASME B31.4
o CSA Z662
o DOT Part 192 NDE

63 41633R42.pdf
Coatings Specifications:
• Repairs must not compromise cathodic protection effectiveness after completion.
• Preservation of pipeline coating integrity must meet DOT 192/195 requirements Geometric Specifications:
• System must be capable of effecting circumferential and/or patch type repairs.
• System must be capable of negotiating bends in the range of 1.5D maximum to 6D minimum (3D is the most common).
• Repair reinforcement, or protrusion into the pipeline, should not exceed 1% - 2% of the inside diameter. For example, a 914 mm (36 in.) outside diameter pipe with a 12.7 mm (0.5 in.) wall thickness has an inside diameter of 888.6 mm (35 in.). The maximum protrusion into this pipe must be equal to or less than 17.77 mm (0.7 in.).
Information identified in this subtask will be used to complete Subtask 6.3 Functional Specification of an Innovative Internal Pipeline Repair System. This subtask is complete. Subtask 3.3 - Summary of Industry Needs for Internal Pipeline Repair During the previous reporting period EWI completed and submitted the Task 3.0 Review of Operators Experience and Repair Needs (41633R25.pdf ) to NETL ADD Document Control in Pittsburgh, Pennsylvania. There are no planned activities for next reporting period. This subtask is complete. Survey Responses The following survey responses are summarized in categories that correspond to the sections and questions asked in the survey itself. The questions are repeated (and presented in bold type to distinguish them) within each section to avoid the need to continually refer to Appendix A. In most instances, the data collected is presented in the form of a bar chart for easy interpretation. Most respondents answered all the survey questions, but this was not always the case. As such, in many cases there were twenty responses to a particular question, in others there were less, and in some cases, such as the types of coatings used on pipelines, there were many more, since most companies have used several coating types over the years.

64 41633R42.pdf
Part 1 – Currently-Used Repair Methods
1. Describe the corrective actions your company has taken due to degradation (corrosion, cracking, etc.) of transmission pipelines, especially repair or replacement actions. Figure 74 summarizes the responses received. The most common type of repair is a welded external steel sleeve, which was mentioned fourteen times, followed closely by "cut-out and replace" which was listed thirteen times. ClockSpring®, grind-out repairs, and composite wraps were all mentioned eight times.
0
2
4
6
8
10
12
14
16
Cut Out andReplace
Grind Out Composite Wrap Clockspring Steel Sleeve Welded Plug Internal Repair Weld Repair
Figure 74 - Currently Used Repair Methods
One response summarized the company’s perspective in the following fashion: cut-out and replace cylinder (seldom), full encirclement steel sleeves (most common), direct deposition of weld metal (seldom, but frequency may increase), grinding to remove gouges (common), and welding a plugged fitting like a Threadolet over the damage. After the degradation is detected by whatever means, repair protocols are used. For general corrosion these include steel sleeves or composite sleeves. For stress corrosion cracking (SCC), gouges, and sharp corrosion profiles, grinding is often used. Typically gouges are ground until the cold worked material has been removed and are sleeved where necessary. For cracks, much of the time these are cut out, however,

65 41633R42.pdf
there are times that cracks are ground out using in-house protocols. Repair of dents is carried out with steel reinforcement sleeves. All respondents indicated that excavations and repairs involve the replacement of the existing coating with liquid applied epoxy coating. One reply indicated that the first step was evaluation to ASME B31G. For repairs needed in lines that can be taken out of service, the solution is to either replace the damaged section as a "cylinder" or attach a sleeve. In the past, sleeves were exclusively steel, as technology has evolved, fiberglass wraps have been used. For low pressure lines leak clamps are used where appropriate. In the case of internal corrosion, on-stream cleaning, chemical treatment, in-situ coating and in-situ polyethylene (PE) sleeve repairs have been applied. Recently, an internal repair approach of a 914 m (3,000 ft.) long, 607 mm (24 in.) diameter, river crossing was considered (http://www.unisert.com) using an internal fiberglass sleeve supported by a grouted annulus. Ultimately, a new HDD river crossing option was selected because of loss of cover in the river bottom. Another respondent stated that a variety of repair methods are used, with the selection of the method dependent on several factors including class location, type of damage, operating pressure, and operational considerations. Corrosion is repairable by a variety of repair methods dependent upon the conditions. Options include band clamp, mechanical sleeve, weld-on sleeve, ClockSpring®, and replacement. External repair methods used by one company include sleeves (reinforcing, pressure containment), grinding (cracks) and pipe replacement. Another company indicated that they normally use ClockSpring® to re-enforce external corrosion areas, whereas cracks that exceed code limitations require an automatic cut-out (which is the last option to consider). Yet another company uses external repair techniques that include a simple blast and recoat, grind and recoat, ClockSpring® repair, welded sleeve repair or pipe replacement.
2. Have you used methods other than external sleeving or pipe replacement to repair different types of degradation? The responses to this question were split 50% "no" and 50% "yes." The "yes" responses typically gave examples, which are summarized as follows:
• Grinding is used to remove gouges (common), cracks, SCC, and sharp anomalies.
• Plugs are fitted and welded over the damage, e.g. a Threadolet.
• Composite wraps are used.

66 41633R42.pdf
• ClockSpring® is used.
• Direct deposition welding has been used to repair wall loss
• “Encapsulating” a malfunctioning or defective area has been used.
• Taps have been used for small defects.
• Leak clamps have also been used. Seven of the responses mentioned grinding of one type of defect or another and was the most common other type of repair. Three examples of different types of welding solution were cited, of which only one involved direct deposition of weld metal on the outside of the pipe.
4. What criteria (including ease of pipe access) affect choice of the specific repair method to be used? The compiled answers to this question are represented in Figure 75 and show twelve responses, of which cost and the availability of the repair method were those most frequently cited. The next important consideration is the position of the defect, and whether the line had to be out-of-service as the next most frequently mentioned criteria.
0
1
2
3
4
5
6
7
8
Type o
f Defe
ct
Cost o
f Rep
air
Safety
Availa
bility
of R
epair
Meth
od ILI
Corros
ion R
ecord
s
Positio
n of D
efect
Reliab
ility o
f Rep
air
Pressu
re Res
torati
on (M
OAP)
Line O
ut of
Service
Conse
quen
ce of
Failure
Option
al Inp
ut
Figure 75 - Criteria Affecting Choice of Repair Method

67 41633R42.pdf
One respondent summarized the evaluated criteria as follows:
• Consequence of failure
• Position of defect (on bend, weld, top/bottom, etc.)
• Impact of a pressure restriction
• Cost of repair
• Type of defect • Availability of repair method, crews, expertise, etc.
Another response listed the following criteria:
• Maximum allowable operating pressure (MAOP) and possible future increases
• Maximum operating pressure (MOP) at time of repair
• Pipeline specified minimum yield strength (SMYS)
• Downstream demand
• Ability to remove the pipeline from service
• Cost
• Projected life of the pipeline The size of flaw (surface area), the ability to shut in and replace the damaged section, the ratio of estimated failure pressure to MAOP, and the ability to stop additional degradation (in the case of internal corrosion) were stated as important criteria by another respondent. Other responses follow:
• Must make repairs without taking the line out of service since it is not looped.
• Need to have the line out-of-service or at less pressure during repair work
• Can the pipeline be taken out-of-service, gas loss?
• Leak history
• Corrosion records
• ILI (in-line inspection) logs
• Cost (access, out-of-service time, mobilization time, etc.)
• Reliability (how reliable is the repair method to fix the problem, permanent repair, temp. repair)
• Safety issues

68 41633R42.pdf
• Operator qualification
• Type and depth
• Material properties and type of pipes, e.g. electric resistance welded (ERW), seamless, etc.
• Coating
• Location (proximity to housing or public facilities)
• Operational timing (ability to take line out-of-service, i.e. impacts to customers and system)
• Type or severity of defect, access to site, time constraints in regards to length of line outage or restriction, soil conditions (e.g. swamp, rock, etc.), environmental issues (wetlands, streams, etc.).
• Pressure, Department of Transportation (DOT) status (we operate many rural gathering lines), contents of line, risk to public
• Location, pipe condition, operating pressure/SMYS, pipe geometry (e.g. straight, over-bend, sag, etc.)
5. Comments pertaining to currently used repair methods.
Not unexpectedly, comments ranged from:
• Most of our line has easy access
• The use of sleeves for the repair of external flaws has been satisfactory to date
• Most existing methods have been effective
• The ClockSpring® has been a very useful repair method in the last few years
• Many are very difficult in swamp or underwater locations Cut-out repair is considered the last resort due to flow disruption and overall cost. External faults are more readily repaired using sleeves than internal anomalies. Internal damage requiring repair in bends equate to a pipe replacement. The threshold for pipe replacement versus repair decreases once the first replacement in a section is justified. Live repair methods require a reduction in operating pressure. Normally the excavation trench requires tight sheeting and shoring, a certified welder, and qualified maintenance welding procedure with low hydrogen procedures (e.g. E7018 low hydrogen electrodes).

69 41633R42.pdf
Part 2 – Use/Potential Use of Internal Repair
1. Has your company attempted repair of a transmission line from inside the pipe? Of the nineteen responses to this question, only one was "yes." Another company indicated that they considered the use of the PG&E tool for weld repair on the internal diameter, but the expense was said to be large and the diameter range was limited. Other companies raised the question of how to ensure the quality of the repair. If so, describe the repair(s)
Plastic tight liners were used and for lower pressure lines (less than 100 psig MAOP) slip lined plastic liners have been used. Both of these methods require the line to be out of service when repair is made.
2. There are many factors that affect the decision to repair or replace pipe. What circumstances would favor performing a repair from inside the pipe using only one or two excavations rather than excavating the entire length of pipe? Figure 76 shows the primary factor for choice of an internal repair method is road and river crossings. Confidence in repair method, presence of numerous but localized areas of damage, inability to excavate large areas because of environmental permitting issues, economics/cost and availability of a proven, industry (and regulator) accepted internal method were also factors mentioned.

70 41633R42.pdf
0
2
4
6
8
10
12
14
16
Confidence inMethod
NumerousLocalized Areas of
Damage
Inability to ExcavateEnvironment
Cost Road/RiverCrossings
Single Pipelines(Not Looped)
Locating/RepairingWall Loss ILI
Figure 76 - Decision Factors for Internal Pipe Repair
Specific comments follow:
• Depending on the depth of burial and the presence of over-bends, sag bends or side-bends or road/river crossings etc., then an internal repair may be much more preferable than cutting out the piece of affected pipe. Single barrel pipelines (versus looped lines) are more difficult to remove from service (customer interruption).
• Factors, such as, class location, environmentally sensitive areas, in crossings, under waterways or rugged terrain would be some of the major factors influencing this decision; an anomaly found inside a casing might be (a factor), under a road, irrigation canal, or railroad tracks; difficult to excavate locations (e.g. rocky conditions, caliche soils, etc.); and cost would be another factor influencing the decision. This potential technology would also be useful for locating and repairing internal wall loss identified by ILI inspections without excavation of the entire pipeline and numerous cuts to the line.
• Property damages, contractor costs, inaccessible right-of-way, lack of temporary workspace, road, railroad, and stream crossings sometimes must be replaced just because indicated damage cannot be directly measured highway crossings, railroad crossings, and heavy traffic intersections.

71 41633R42.pdf
• Highly congested areas that impact risk to other pipelines or utilities and proximity to structures.
• Possibly a pipeline under water or a permanent structure where the pipeline is not easily accessible
• Where the pipe repair is located under a road or body of water where access is limited.
• Pipelines that are under paved areas, or in narrow or confined rights-of-way where space is limited. Crossings at roads, railroads, lakes, and rivers, and water cover, such as, marsh or swamp.
• If the cost of an internal repair plus the outage restriction was less than the cost of an external repair. For example, if the defect was in the middle of a major water crossing or swamp which would normally require ice road construction for access.
- High traffic areas
- Federal, state, city or county roadway restoration requirements
- Environmental concerns
- Railway crossings
3. If the technology were available to perform a repair from the inside, would your company consider using the technology? One "no" response was received. The other seventeen responses were "yes" and some were qualified with additional comments as follows:
• We would want to review testing and possibly witness a demonstration
• Only if proven
• If cost is reasonable
• Particularly if DOT compatible
• Depending on the site-specific conditions One response indicated that the company transports non-corrosive natural gas, so the probability of an internal flaw is highly unlikely. While this may be true for many companies in terms of internal corrosion, it misses the point that the internal repair can be used for repair of external damage. If so, for what application(s) – e.g., specific geographic locations and special situations?

72 41633R42.pdf
Figure 77 summarizes the answers to this question. River crossings and populated areas with highway crossings were most frequently cited. Use for repair of flaws found by pigging, included internal or external corrosion pitting, gouges, seam or weld flaws (if detectable by pigging).
0
1
2
3
4
5
6
7
8
9
Unkno
wn Loc
ation
s
Flaws F
ound
in Pigg
ing
Intern
al an
d Exte
rnal
River C
rossin
gs
Popula
ted/A
reas/R
oads
Offsho
re
Reduc
ed C
ost
Interm
ittent
Intern
al Corr
osion
Figure 77 - Specific Geographic Locations and Special Situations
Seven responses mentioned river crossings and this was the most common response to this question. Others cited pipelines that are under paved areas, or in narrow or confined rights-of-way where space is limited, crossings at roads, railroads, lakes, swamp areas, and difficult access due to physical barriers inherent to high population density and congested areas (e.g., numerous utilities, building, streets, etc.). One response mentioned concerns regarding the use of internal repair on a direction bored crossing of a freeway, because of unknown future cathodic protection (CP) effectiveness after welding. Another response referred to applications where it is not cost effective to repair or replace the pipe conventionally, provided the internal repair is an equivalent repair. Probably the best application in this case would be offshore.

73 41633R42.pdf
4. At least one excavation will be required to insert the internal repair device into the pipe. From this excavation, the repair device could travel in each direction from the excavation. About how far from the insertion point should the repair device be able to travel? Answers ranged from 15 m (50 ft.) to 113 km (70 miles); the latter for offshore operation, with most answers being in the 305 m to 915 m (1,000 ft. to 3,000 ft.) range. The array of responses is summarized in Figure 78, showing that there are discrete lengths of 305 m (1,000 ft.) and 610 m (2,000 ft.) "umbilicals" (or travel distances) for certain categories of repairs or related requirements. The typical travel distances required are divided into three groups; up to 305 m (1,000 ft.); between 305 m to 610 m (1,000 ft. and 2,000 ft.); and beyond 915 m (3,000 ft.), and are indicated by the dotted lines in Figure 78. In concept, all these systems would be pig-based. Systems with despooled umbilicals could be considered for the first two groups, while the last group would be better served with a self propelled system with self-contained onboard power and welding system.
Figure 78 - Distance Repair System Required to Travel Down Pipe

74 41633R42.pdf
152 m (500 ft.) appears to be adequate to cross most interstate highway crossings and 610 m (2,000 ft.) for all river crossings. A major river crossing would require the device to travel up to 610 m (2,000 ft.). In one case it was stated that the longest section of pipe which is not accessible (directional bore) is approximately 1,219 m (4,000 ft.), so the need would be to access the pipe a distance of approximately 610 m (2,000 ft.) from either end. Longer distances, probably from 915 m (3,000 ft.) to several miles or more would require the technology to travel in a similar way as an inspection pig. Realistically, such a system would have to be based on an onboard propulsion device using gas line pressure as the motive force. A self-contained, inverter-based welding power source and welding system would also be required. In what range of pipe diameters should the repair device be capable of operation?
A wide range of pipe sizes were cited, both within a particular company, and between various companies. The results are summarized in Figure 79 show that pipe size range requirements run from 51 mm (2 in.) through 1,219 mm (48 in.) diameter. The common size range for 80% to 90% of operators surveyed is 508 mm to 762 mm (20 in. to 30 in.) diameter, with 95% using 559 mm (22 in.) diameter pipe.

75 41633R42.pdf
Figure 79 - Range of Pipe Diameters Used
5. What potential obstructions such as elbows, bends, branches, and taps should the repair system be able to negotiate? The answers to this question were quite varied and are summarized in Figure 80. Pipe bends of various radii were most commonly mentioned including 1.5 times the diameter (1.5D), 3 times the diameter (3D), and 6 times the diameter (6D), with 3D pipe bends being the most commonly used. Elbows were mentioned in three responses. It is interesting to note that the answer "all" was given four times.

76 41633R42.pdf
0
1
2
3
4
5
6
7
8
Elbows Bends Branches Taps All Same asSmart Pig
Same asAn ILI Tool
Valves Tees Offsets Drip Traps Change inDiameter
Figure 80 - Potential Obstructions to be Negotiated
6. For the situations described in Question #3, at what approximate cost would an internal repair method become competitive with existing repair options? Statements and cost figures varied widely from $25,000 to $1,000,000 depending on the perspective of the survey respondent and the terrain that their pipeline systems crossed (see Figure 81).
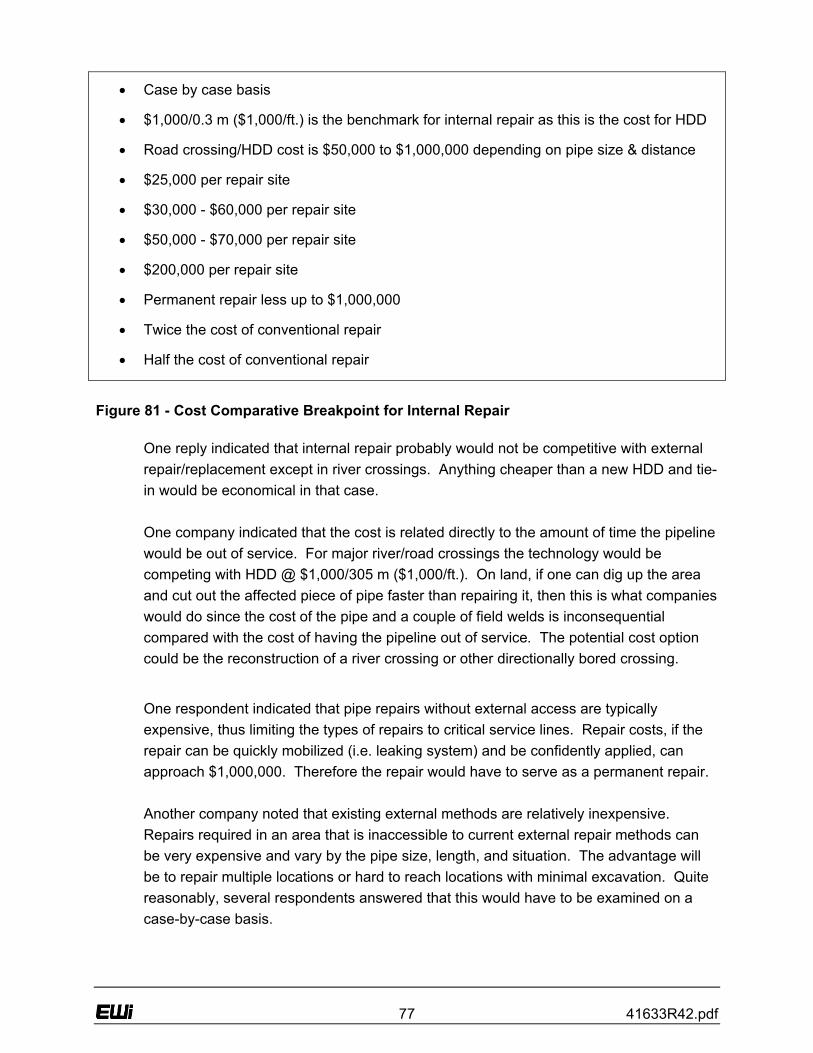
77 41633R42.pdf
• Case by case basis
• $1,000/0.3 m ($1,000/ft.) is the benchmark for internal repair as this is the cost for HDD
• Road crossing/HDD cost is $50,000 to $1,000,000 depending on pipe size & distance
• $25,000 per repair site
• $30,000 - $60,000 per repair site
• $50,000 - $70,000 per repair site
• $200,000 per repair site
• Permanent repair less up to $1,000,000
• Twice the cost of conventional repair
• Half the cost of conventional repair
Figure 81 - Cost Comparative Breakpoint for Internal Repair
One reply indicated that internal repair probably would not be competitive with external repair/replacement except in river crossings. Anything cheaper than a new HDD and tie-in would be economical in that case. One company indicated that the cost is related directly to the amount of time the pipeline would be out of service. For major river/road crossings the technology would be competing with HDD @ $1,000/305 m ($1,000/ft.). On land, if one can dig up the area and cut out the affected piece of pipe faster than repairing it, then this is what companies would do since the cost of the pipe and a couple of field welds is inconsequential compared with the cost of having the pipeline out of service. The potential cost option could be the reconstruction of a river crossing or other directionally bored crossing.
One respondent indicated that pipe repairs without external access are typically expensive, thus limiting the types of repairs to critical service lines. Repair costs, if the repair can be quickly mobilized (i.e. leaking system) and be confidently applied, can approach $1,000,000. Therefore the repair would have to serve as a permanent repair. Another company noted that existing external methods are relatively inexpensive. Repairs required in an area that is inaccessible to current external repair methods can be very expensive and vary by the pipe size, length, and situation. The advantage will be to repair multiple locations or hard to reach locations with minimal excavation. Quite reasonably, several respondents answered that this would have to be examined on a case-by-case basis.

78 41633R42.pdf
Yet another response indicated that an internal repair tool would be valuable where the pipe is inaccessible. Replacing a road crossing/directional bore could range from $50,000 to $1,000,000 depending on the size of pipe/distance. Other quantitative replies were within the wide range of about $30,000 to $60,000 per repair site in one case; for repairs other than in crossings, about $25,000 per site total including excavation, recoating and backfill; and another reply mentioned about $200,000, while a another response indicated that an internal repair would have to be 50% to 75% of the cost for a conventional repair/replacement to be competitive.
7. Have new regulatory requirements created a need to improve the fitness for service of existing transmission lines via localized repair or removal of conditions that are acceptable under previous criteria? Responses to this question were varied, with six "no" responses and nine "yes" responses. Specific remarks are listed below:
• Not in Canada – new requirements only change documentation effort.
• Regulations will require companies to prove the fitness for purpose of their pipelines rather than improve. There maybe circumstances with HCA’s where repairs are now required.
• Some, but I see this as having little impact on the use of this technology. The newly proposed pipeline integrity regulation will make us more aware more quickly to the extent of repair required.
• Under the current Texas Railroad Commission Integrity Rule, and the pending DOT integrity rule, operators are in-line inspecting more pipe than has been done in the past. More repairs may be necessary as a result of more inspections.
• Upcoming inspection requirements may result in the discovery of defects requiring repairs that would not otherwise have been discovered. Increased cost of excavation restoration has been imposed by various municipalities.
8. What is the estimated number of repairs per year that could potentially be
performed by internal repair in your company for the reasons discussed in Questions #3 and #7? Responses varied from "none," through "1 repair in 5 years," and in one case, "10-75 repairs per site." These answers are summarized in Figure 82, which shows that answers from "1 repair in 5 years," up to "5 repairs per year" were by far the most common response. This indicates a limited expected requirement for such a system, particularly based on expected relative cost to purchase and operate. This supports the suggestion that pigging operators would be the best source to supply and operate such equipment on a contracted basis.

79 41633R42.pdf
0
1
2
3
4
5
6
1/5 1-2 3-5 10-75 Don't Know
Figure 82 - Estimated Number of Internal Repairs Required Per Year
9. Comments pertaining to the use/potential use of internal repair.
Significant individual responses follow:
• Internal methods would be hard to accept as it would be difficult for QA/QC and direct inspection.
• It would have to provide a permanent repair and be piggable to be worthwhile.
• Reinforcing weld joints internally for the in-service pipelines built using welding process, which produced joints with incomplete penetration and lack of fusions.
• Any internal repair sites would have to still be capable of passing an ILI tool and be visible to that tool.
• Internal repair could not impede the ability to pig lines and still be a viable option.
• The major concern would be not to obstruct subsequent ability to assess the pipeline’s integrity through internal inspection schemes.
• It is a good to have, whenever necessary.
• A method of inspection of the repaired area may need to be devised.
• It would seem that internal repair methods would have minimal use unless long distances need repaired in congested locations.

80 41633R42.pdf
• Offshore or underwater (e.g. river crossings, swamps, etc.) offer best economics.
• It would be a valuable tool to have; however, I see no advantage to the process for pipe, which is accessible. The only value would be where pipe is inaccessible in a road/stream.
• The use of an internal repair would probably be driven by the discovery of unacceptable corrosion in an inaccessible location. We are currently unaware of this situation in our system.
Part 3 – Need for In-Service Internal Repair
1. How important is the ability to perform a repair from the inside the pipe while the pipeline remains in service? The majority of survey respondents considered the ability for the pipeline to remain in service while the repair was conducted to be very important (Figure 83), especially if their system was not looped. Companies with looped pipeline systems presumably account for the respondents that considered this to be only somewhat important.
0
2
4
6
8
10
12
14
Little Somewhat Very Depends
Figure 83 - Importance of Repair While Pipeline Remains In-Service

81 41633R42.pdf
Significant individual responses:
• If the pipeline could remain in service the probability of using the tool would be very greatly increased.
• The ability to keep a pipeline in service during repair work would be an important factor when considering internal repair as a possible option.
• Very important for the economics of a large diameter transmission line. Keeping the line in-service is a distinct advantage over cut-out.
• For us it would be important because we are not looped.
• Because this may compete with external sleeving, I think that this is real important.
• This repair method would save gas that would normally be lost and would allow service to be uninterrupted. It is very important.
• Minimizing business disruptions to key customers is important. This ability would make such a repair method very important.
• For those pipelines where service cannot be interrupted and where welding is impractical, it is very important.
2. Would internal repair remain attractive if it was necessary to completely shut
down the pipeline (depressurized and evacuated) during the repair? The answers summarized in Figure 84 include six "yes" and three "no," with a variety of other responses in between.

82 41633R42.pdf
0
2
4
6
8
10
12
14
Yes No Depends on Other Criteria
Figure 84 - Still Attractive if Pipeline Must be Shut Down (Depressurized and Evacuated) Twelve respondents collectively indicated that this depends on a number of other criteria. It would remain attractive if:
• It could eliminate the need to build an ice road in the swamp or dam and flume a river
• in highly congested areas it could be attractive
• Could be where it is too hard to get to the defect location directly like under a river, lake, for offshore and underwater.
• For offshore environments, shut-in is possible, blow-down probably an extra $100k minimum dependant upon gas prices.
• To depressurize and evacuate the gas adds cost that would affect how attractive this type of repair would be.
Depressurized but not evacuated?
Responses are presented in Figure 85: there were eight "yes" responses and two "no" responses.

83 41633R42.pdf
0
2
4
6
8
10
12
Yes No Depends
Figure 85 - Still Attractive if Pipeline Must be Depressurized but Not Evacuated
Individual responses:
• Depressurized but still flowing is better.
• Depressurized and not flowing is poor; usually the cost of excavation is minor compared to the outage.
• It is typically not possible to depressurize without a blow down and would not be as attractive.
• There could still possibly be applications but would then be much more a function of the cost of the internal repair versus the cost of external repair or replacement.
Out-of-service (no flow), but remain pressurized?
Responses are summarized in : there were eleven "yes" responses and two "no" responses. If the pipeline must be out-of-service, the amount of pressure remaining and whether or not it is evacuated are probably far lesser considerations.

84 41633R42.pdf
0
2
4
6
8
10
12
Yes No Depends
Figure 86 - Still Attractive if Pipeline Must be Out of Service but Pressurized?
Specific responses:
• This is more attractive than the previous two.
• It would be an attractive repair technology under these conditions.
• Leaving the line pressurized would reduce the gas lost, and reduce the potential cost of the repair.
3. Comments pertaining to the need for in-service internal repair.
One response commented that hopefully internal repair would only be required for operators who transport wet or corrosive products. This comment refers to their lack of internal corrosion damage, but also indicates a lack of understanding that the internal repair could be used to repair external corrosion damage. An internal repair appears to be attractive if it reduces the potential for gas lost from blowing down a pipeline, and reduces cost, and/or reduces out-of-service time. Obviously, as the price of gas increases each of the above options will have more impact.

85 41633R42.pdf
Part 4 – Applicable Types of Damage
1. What types of external coatings would be found on transmission lines owned by your company? A wide variety of coatings were cited ranging from none (bare steel pipe) through a wide range of bitumastic, coal tar, wax; plastic and composite tapes and wraps; to POWERCRETE® and concrete. The number of responses indicating the use of each coating type is summarized in Figure 87. The top three coating types mentioned were fusion bonded epoxy (FBE), coal tar, and concrete/POWERCRETE®.
0
2
4
6
8
10
12
14
16
FBE
Extrud
ed P
olyeth
ylene
Coal T
arWax
Concre
te
Powerc
rete
Bare
Tape C
ost All
Bitumen
Aspha
lt
Two-Part
Epoxie
s
Figure 87 - External Coatings Used
2. If a repair involving welding from the inside was performed, how important is it to
preserve the integrity of the coating? The ten responses are summarized in Figure 88. There were ten responses to this question. One company indicated a level of importance of "important," six companies listed the level as "very important," and three indicated a level of "critical/essential." Five respondents commented that preserving the coating integrity was not very important, as the CP system was considered capable of taking care of local degradation in these instances.

86 41633R42.pdf
0
1
2
3
4
5
6
7
Not Too Important (CP System) Important Very Important Critical
Figure 88 - Maintenance on Coating Integrity
Individual responses:
• It is of utmost importance.
• If the existing coating cannot be maintained, then additional excavations will be necessary and the coating repaired.
• It is very important for large damaged areas since access to site to repair the coating may be difficult.
• It is necessary to try to preserve as much coating as possible since the repair may be applied to an area of external corrosion and we would not be able to assess the root cause of the corrosion or know if it is mitigated.
• An offshore pipeline operator suggested that perhaps considering attaching an anode if necessary, but then again, reasonable access would be required. In offshore applications, a small amount of coating damage is not too much of a problem.

87 41633R42.pdf
3. Is your cathodic protection system capable of compensating for relatively small
breaches in the coating? The results here are shown in Figure 89. All respondents said that the CP system is capable of compensating for relatively small breaches in the coating: there were thirteen "yes" responses and five qualified "yes" responses.
0
2
4
6
8
10
12
14
Yes No (Don't Want) Usually/Depends
Figure 89 - Is CP System Capable of Compensating for Small Coating Breaches
Comments received:
• Preservation of external coating must be a major consideration.
• Not for disbonded coating.
• It would not meet DOT code requirements under 192/195.
• We do not want any breaches or holidays in their coatings. Coating damage would reduce the attractiveness of this repair system.
One company stated that the CP system can normally compensate, but that one would have to consider that if you had an external corrosion anomaly at the repair site, you may repair it and still have an active external corrosion site. The internal repair would have to be fully pressure containing. Also, if the weld damages good coating, and there

88 41633R42.pdf
is some localized issues with CP protection, that may set-up an active corrosion site at the weld sites (especially if damaged coating is left disbonded and shielded from CP).
4. Comments pertaining to applicable types of damage.
The following three comments were received:
• I would not want to trade a known likelihood of external coating damage in order to permit an internal repair.
• I do not think the industry or the regulators would accept a repair method that damages the coating and leaves it in worse shape than originally found
• If the coating is damaged and CP shielding occurs, then problems would be great. It may be possible to install a Magnesium (Mg) anode at the repair location to spot protect damage to the coating.
Part 5 – Operational and Performance Requirements for Internal Repairs
1. Two general categories of repairs are being considered, (1) using weld metal to restore a surface and (2) installing an internal sleeve, either metallic or nonmetallic, to provide structural reinforcement of leak tightness. Is it important that the line remain inspectable by pigging after repair? The responses are summarized in Figure 90, which shows the unanimous response was "yes."
0
2
4
6
8
10
12
14
Yes (Only) Yes (With Comments) No
Figure 90 - Inspectable by Pigging

89 41633R42.pdf
The five "yes" responses contained the following comments:
• Maybe not for a temporary repair. One scenario that comes to mind is in the mountains where there is too much snow to access. A temporary repair could be made and not worry about ILI restriction. Would perform cut-out in the summer.
• Yes, if original line was piggable.
• DOT code 49 CFR 192.150 states that all new lines, or line repaired, will be able to accommodate the passage of an ILI device. Additionally, with the new integrity management rules requiring regular pigging of pipelines, any internal repair would have to allow the passage of a pig.
• Under existing DOT codes it would seem that being able to inspect the line is required. New pipeline integrity regulations may allow for alternative methods.
• For some lines, being “smart- piggable” after repair would be mandatory. About how far could the repair protrude into the pipe before it would interfere with pigging?
The responses are summarized in Figure 91. Six responses gave a range in the region of 5% to 10% of nominal pipe diameter. Even for relatively small diameter pipe this amount of protrusion could be quite large.
0
1
2
3
4
5
6
7
8
1% of Diameter 5% of Diameter 10% of Diameter 1/8 in. 1/4 in. 1/2 in. Ask PiggingVendors
Don't Know
Figure 91 - How Far Could the Repair Protrude Into Pipe Before Interference

90 41633R42.pdf
Seeking guidance from pigging vendors was suggested by seven of the responses. An amount of 1% of diameter was considered a good number as a rule of thumb in one case. In another, about 1.5 mm (0.6 in.) for a 914 mm (36 in.) pipe (2% of diameter) was mentioned. Several responses mentioned that the type of pig is an important consideration when considering an answer to this question. A "smart pig" was said to be able to accommodate a 10% reduction in diameter. One response stated that the acceptable protrusion varies depending on the type of pig, pipe size, geometry, and longitudinal length of the restriction. Another response stated that this is dependent upon the type of pigging utilized (e.g., traditional versus smart).
2. What NDE would your utility require for a repair to an existing longitudinal or
circumferential weld?
Thirteen survey respondents included radiographic testing (RT) or indicated that only radiographic inspection was used or allowed; five indicated that ultrasonic testing (UT) is also permitted; and two responses indicated that magnetic particle inspection (MPI) is also allowed (see Figure 92).
0
2
4
6
8
10
12
14
RT Only RT or UT RT or MPI
Figure 92 - NDE Required for Repair to an Existing Weld

91 41633R42.pdf
UT or RT acceptability is judged to code acceptance criteria; specifically ASME B31.8 or B31.4, and CSA Z662 codes were mentioned. In one case it was noted that all welds below 40% SMYS are repaired with a reinforcement sleeve/canopy or removed from the system. In another, it was stated that inspection must comply with Part 192 NDE requirements. What NDE would your utility require for a welded repair to base metal (e.g. corrosion pitting)?
Figure 93 summarizes the NDE requirements for weld repair to base metal: seven responses include or only use/allow RT, three responses include UT as an acceptable alternative to RT, and three responses include MPI. UT or RT acceptability to code acceptance criteria ASME B31.8 or ASME B31.4 were also mentioned. In one case, it was noted that, at a minimum, all weld repairs are visually inspected and soap tested. Another response indicated that all welds must meet the acceptability standards of the currently referenced edition of the API 1104.
0
1
2
3
4
5
6
7
8
RT Only RT or UT MPI Visual Don't Know
Figure 93 - NDE Required for Base Metal Repair

92 41633R42.pdf
Could a visual or magnetic particle examination be substituted for radiography in these special circumstances?
The answers to the question were evenly distributed. There were three "yes" only responses, three qualified "yes" answers, three "MPI not visual," three "maybe," three "no," and three "don't know." Specific comments:
• On fillet welds to the base metal, yes. For the long seam repair, probably not. • Below 40% SMYS repairs utilizing pre-qualified components with a
manufacturer established MAOP require both a visual and a soap test. • I am not sure how the MPI would be done remotely, but it would have value.
3. Would the use of internal repair be attractive even if it were considered a
temporary repair?
The answers to this question were mixed, as summarized in Figure 94: eight were "no" responses, three were "yes" only, and eight were qualified "yes" responses.
0
1
2
3
4
5
6
7
8
9
No Yes (Only) Yes (Qualified)
Figure 94 - Would Internal Repair be Attractive Even as a Temporary Repair?

93 41633R42.pdf
Individual comments:
• In some circumstances, especially in seasonal climates (Canada, mountains, muskeg).
• Yes, if it could be done at relatively low cost (competing with an external sleeve, which is permanent) and with little to no interruption in service.
• Only if the cost was very low.
• If we were using this as a repair, we would rather have a permanent solution.
• Only in a very limited number of cases.
• It could be to allow for scheduling repairs and avoid a shut down during critical times.
• Yes – if it could be accomplished without purging the pipeline.
• Possibly, dependent upon the situation.
4. Comments pertaining to operational and performance requirements for internal repairs. Specific responses:
• Repairs would need to be as good as the original pipe; one would not want to create local corrosion cells if the weld filler metal was more/less active than the base metal. This would only be attractive if shutdown is not required and no excavation is required to find the defect.
• The internal repair should provide for a smooth internal surface. The weld repair would not leave an area subject to long term cracking. CP would not be compromised. Repair will not interfere with future inspections.
Part 6 - General Comments
Please provide any general comments that you may have. For example, comments on an acceptable range of commercial pricing for such a system would be useful (as distinct from a repair cost in Question #6 of Part 2). Individual responses follow:
• This would not be a piece of equipment that our company would use often enough to justify us owning it. The most effective management of this system may be through a smart pigging company that could offer this as a follow-on service after inspection.

94 41633R42.pdf
• The internal repair should return pipe to its original serviceability and safety factor. Pricing would determine selection if the repair was appropriate and proven for the type of defect. The costs are going to be weighed against the cost of excavation and the need to purge the line. Quite often, corrosion damage and even some dents can be repaired with steel sleeves using hot tap procedures so the pipeline does not have to be shut down. In swamp conditions, excavation is very expensive due to special equipment and the need to construct isolation dams to keep out the water and use pumps to dry the hole. Of course, offshore repairs require divers and habitats. The internal repair method would have the best economics for underwater repair locations. Some urban areas may have the same type of economics.
• Having an internal welding tool option would be very advantageous for a given situation. That situation is a totally inaccessible location such as a directional bore. For a busy intersection or street alignment where the pipeline can be accessed by conventional method at a high cost, accessing the pipeline externally would be preferred. The repair method would have to be approved by DOT prior to being used.
• The cost depends mainly on the requirements of the repair as in pipe size, length, customer outages, etc. I would say that it has to be considerably less then the standard repair methods to make the new repair method accepted by industry. Because it is internal and the integrity of the repair has to be assessed through some form of NDE, the actual repair strength will be hard to sell.
Task 4.0 - Evaluation of Potential Repair Methods Task 4.0 activities evaluate potential repair processes to assess their feasibility and suitability for internal pipeline repair. The results from the evaluation will be used to complete Task 5.0. Consideration will be given to each method's applicability to planar or metal loss damage types and their suitability for in-service repair. During the first reporting period, the Task 2.0 - Technology Status Assessment was used to identify the broad categories of deposited weld metal and fiber-reinforced composite repair technologies that are potentially applicable to gas transmission pipelines from the inside; both were investigated in the experiments in the Task 4.0 evaluation. Subtask 4.1 - Identify Potential Repair Methods To capture the results of Subtask 4.1 activities, a Matrix of Potential Repair Methods (M9) was created to compare and contrast the collective knowledge of, and interest in, specific repair methods that should be emphasized in the experimental portion of this project. The five major feasibility categories defined for the Matrix:
• Technical Feasibility • Inspectability

95 41633R42.pdf
• Technical Feasibility of the Process while the Pipeline is In-Service • Cost • Industry Experience with the Repair Method
Each feasibility category was then subdivided into capabilities or characteristics to rank. Each capability/characteristic was assigned a unique weight factor to distinguish its importance in the overall repair process feasibility. Weight factors were based on the quantity of survey responses associated with the feasibility capability/characteristic, with the sum of all weight factors being 100%. For each potential repair process, individual feasibility capabilities were rated on a scale from (-1) to (5) as defined in Table 6.
Rating Definition of Rating -1 Unacceptable 0 Unknown Potential - High Risk 1 Marginal Potential - High Risk 2 Development Required - High Risk3 Development Required - Low Risk 4 Acceptable - No Risk 5 Ideal - No Risk
Table 6 - Key to Ratings in Potential Repair Process Matrices (Table 7 - Table 9) Each rating was then multiplied by its unique weight factor to arrive at the weighted score for the individual feasibility capability. Five feasibility characteristics were determined to be "show stoppers," given the fact that an unacceptable rating for these capabilities would negate repair process feasibility. The five show stoppers were identified as:
• Ability to Perform the Process Out-of-Position • Technical Feasibility of the Process Itself • Ability of the Process to Match the Strength of the Base Material • Technical Feasibility of Performing the Process In-Service • Material Cost
The rating of each show stopper was multiplied by 25 to produce the corresponding weighted score. The Matrix of Potential Repair Methods is subdivided into three technology specific tables: Potential Welding Repair Methods (Table 7), Potential Liner Repair Methods (Table 8), and Potential Surfacing Repair Methods (Table 9).

96 41633R42.pdf
Welding Processes
GTA
W
GM
AW
FCA
W
SAW
Lase
r
Expl
osiv
e
Feasibility Category W
eigh
t Fac
tor
Capability or Characteristic to Rank
Rating Weighted Score Rating Weighted
Score Rating Weighted Score Rating Weighted
Score Rating Weighted Score Rating Weighted
Score
Out-of-Position Applicability 2 50 3 75 3 75 -1 -25 2 50 1 25
Process Technical Feasibility 2 50 3 75 -1 -25 -1 -25 0 0 -1 -25
5% Process Robustness 2 10 3 15 2 10 0 0 2 10 1 5
10% Repair Permanence 2 20 3 30 2 20 0 0 2 20 1 10
10% Process Deployment Risk 2 20 5 50 -1 -10 0 0 1 10 -1 -10
5% Remote Operation Feasibility 2 10 3 15 -1 -5 0 0 1 5 0 0
Ability to Match Strength of Pipe Material 3 75 4 100 4 100 0 0 3 75 3 75
1% Ability to Match Pipe Corrosion Resistance 3 3 4 4 4 4 0 0 4 4 3 3
1% Ability to Effect Patch Repair 2 2 3 3 -1 -1 0 0 2 2 -1 -1
5% Ability to Effect Circumferential Repair 2 10 3 15 -1 -5 0 0 2 10 1 5
10% Ability to Negotiate 3D Bends 3 30 3 30 3 30 3 30 0 0 0 0
5% Metallurgical Bond 5 25 5 25 5 25 5 25 5 25 2 10
Technical
1% Mechanical Bond 5 5 5 5 5 5 5 5 5 5 2 2
5% Ability to Inspect via Pigging 5 25 5 25 -1 -5 0 0 5 25 0 0 Inspectability
5% Radiographic Flaw Detectability 5 25 5 25 5 25 5 25 5 25 -1 -5
7% Low Power Required (Process Efficiency) 4 28 4 28 4 28 1 7 -1 -7 -1 -7
5% Pipeline Depressurized, But Not Evacuated 2 10 2 10 2 10 0 0 0 0 0 0
5% Pipeline Pressurized 0 0 0 0 0 0 0 0 0 0 -1 -5 In-Service
Technical Feasibility 2 50 2 50 -1 -25 0 0 0 0 2 50
5% Process Development 1 5 3 15 0 0 0 0 1 5 0 0
10% Process Application 1 10 4 40 0 0 0 0 0 0 0 0 Cost
Material 2 50 4 100 4 100 0 0 1 25 0 0
History 5% Industry Experience with Process 0 0 4 20 4 20 0 0 0 0 2 10
100% 513 755 376 42 289 142
Table 7 - Potential Welding Repair Methods

97 41633R42.pdf
Liner Processes
Fibe
r-R
einf
orce
d C
ompo
site
Stee
l Coi
l
Shap
e M
emor
y A
lloy
Ree
led
Com
posi
te
Solid
Exp
anda
ble
Tubu
lars
Feasibility Category Wei
ght F
acto
r
Capability or Characteristic to Rank Rating Weighted
Score Rating Weighted Score Rating Weighted
Score Rating Weighted Score Rating Weighted
Score
Out-of-Position Applicability 2 50 3 75 3 75 2 50 3 75
Process Technical Feasibility 2 50 3 75 3 75 2 50 2 50
5% Process Robustness 1 5 2 10 2 10 1 5 2 10
10% Repair Permanence 2 20 3 30 3 30 1 10 2 20
10% Process Deployment Risk 2 20 0 0 0 0 1 10 2 20
5% Remote Operation Feasibility 2 10 1 5 0 0 1 5 2 10
Ability to Match Strength of Pipe Material 2 50 1 25 1 25 -1 -25 2 50
1% Ability to Match Pipe Corrosion Resistance 3 3 2 2 2 2 2 2 2 2
1% Ability to Effect Patch Repair -1 -1 -1 -1 -1 -1 -1 -1 -1 -1
5% Ability to Effect Circumferential Repair 3 15 2 10 2 10 2 10 2 10
10% Ability to Negotiate 3D Bends 3 30 0 0 0 0 1 10 -1 -10
5% Metallurgical Bond 0 0 -1 -5 -1 -5 -1 -5 -1 -5
Technical
1% Mechanical Bond 2 2 0 0 1 1 1 1 2 2
5% Ability to Inspect via Pigging 2 10 0 0 2 10 0 0 2 10 Inspectability
5% Radiographic Flaw Detectability -1 -5 0 0 0 0 -1 -5 0 0
7% Low Power Required (Process Efficiency) 3 21 3 21 3 21 3 21 2 14
5% Pipeline Depressurized, But Not Evacuated 3 15 2 10 2 10 3 15 2 10
5% Pipeline Pressurized 3 15 2 10 2 10 3 15 1 5 In-Service
Technical Feasibility 3 75 2 50 2 50 3 75 2 50
5% Process Development 3 15 2 10 1 5 3 15 2 10
10% Process Application 3 30 3 30 2 20 3 30 1 10 Cost
Material 2 50 3 75 -1 -25 3 75 -1 -25
History 5% Industry Experience with Process 3 15 3 15 -1 -5 3 15 0 0
100% 495 447 318 378 317
Table 8 - Potential Liner Repair Methods
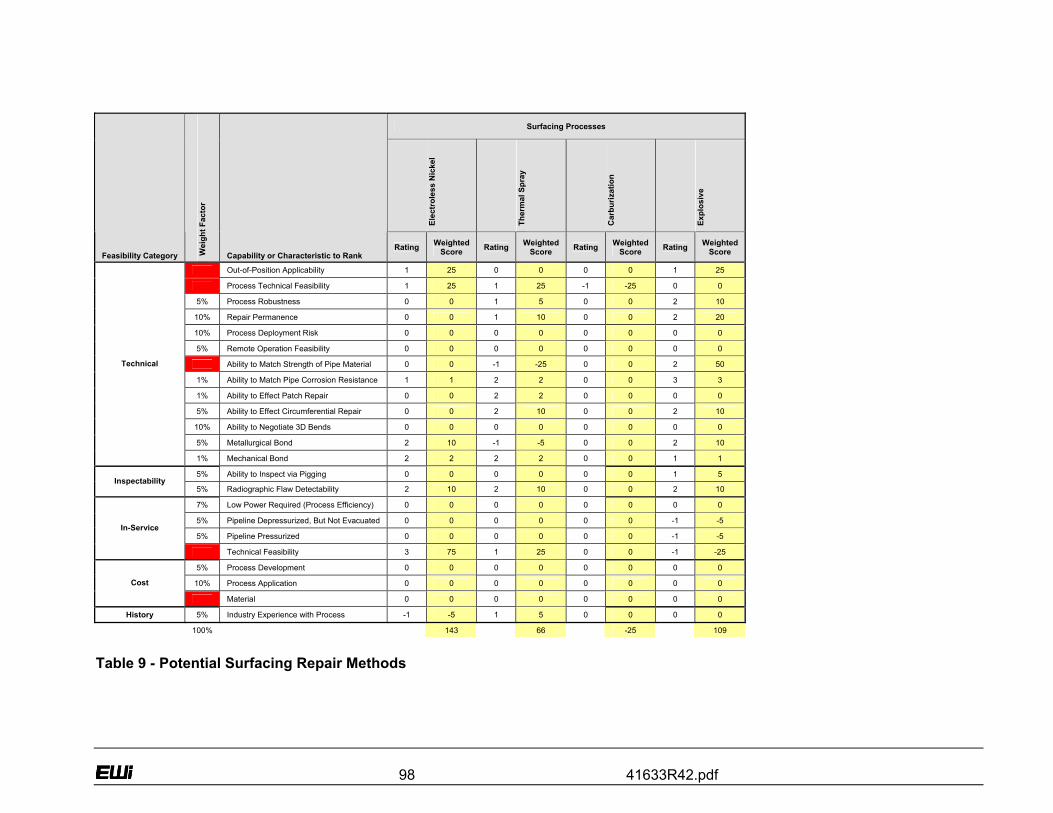
98 41633R42.pdf
Surfacing Processes
Elec
trol
ess
Nic
kel
Ther
mal
Spr
ay
Car
buriz
atio
n
Expl
osiv
e
Feasibility Category Wei
ght F
acto
r
Capability or Characteristic to Rank Rating Weighted
Score Rating Weighted Score Rating Weighted
Score Rating Weighted Score
Out-of-Position Applicability 1 25 0 0 0 0 1 25
Process Technical Feasibility 1 25 1 25 -1 -25 0 0
5% Process Robustness 0 0 1 5 0 0 2 10
10% Repair Permanence 0 0 1 10 0 0 2 20
10% Process Deployment Risk 0 0 0 0 0 0 0 0
5% Remote Operation Feasibility 0 0 0 0 0 0 0 0
Ability to Match Strength of Pipe Material 0 0 -1 -25 0 0 2 50
1% Ability to Match Pipe Corrosion Resistance 1 1 2 2 0 0 3 3
1% Ability to Effect Patch Repair 0 0 2 2 0 0 0 0
5% Ability to Effect Circumferential Repair 0 0 2 10 0 0 2 10
10% Ability to Negotiate 3D Bends 0 0 0 0 0 0 0 0
5% Metallurgical Bond 2 10 -1 -5 0 0 2 10
Technical
1% Mechanical Bond 2 2 2 2 0 0 1 1
5% Ability to Inspect via Pigging 0 0 0 0 0 0 1 5 Inspectability
5% Radiographic Flaw Detectability 2 10 2 10 0 0 2 10
7% Low Power Required (Process Efficiency) 0 0 0 0 0 0 0 0
5% Pipeline Depressurized, But Not Evacuated 0 0 0 0 0 0 -1 -5
5% Pipeline Pressurized 0 0 0 0 0 0 -1 -5 In-Service
Technical Feasibility 3 75 1 25 0 0 -1 -25
5% Process Development 0 0 0 0 0 0 0 0
10% Process Application 0 0 0 0 0 0 0 0 Cost
Material 0 0 0 0 0 0 0 0
History 5% Industry Experience with Process -1 -5 1 5 0 0 0 0
100% 143 66 -25 109
Table 9 - Potential Surfacing Repair Methods

99 41633R42.pdf
Figure 95 is a bar chart that contains the total weighted scores for each potential repair technology. It is apparent that, of the three broad categories of repair (welding, liners, and surfacing), repair methods that involve welding are generally the most feasible. Of the various welding processes, GMAW is the preferred method. The primary factors that make GMAW the most feasible are process technical feasibility and robustness, and industry familiarity with the process. The second most feasible of the three broad categories is repair methods that involve internal liners. Of these, fiber-reinforced composite liners are the most promising. The primary factors that make fiber-reinforced composite liners the most feasible are the ability to match the strength of the pipe material and negotiate bends, and their corrosion resistance. The advantage of using a fiber-reinforced composite liner is somewhat offset by its material cost which is anticipated to be comparatively higher than that of a steel coil liner.
Gas
Tun
gste
n A
rc W
eldi
ng
Gas
Met
al A
rc W
eldi
ng
Flux
Cor
ed A
rc W
eldi
ng
Sub
mer
ged
Arc
Wel
ding
Lase
r Wel
ding
Expl
osiv
e W
eldi
ng
Fibe
r-R
einf
orce
d C
ompi
ste
Line
r
Stee
l Coi
l Lin
er
Shap
e M
emor
y A
lloy
Line
r
Ree
led
Com
posi
te L
iner
Solid
Exp
anda
ble
Tubu
lar L
iner
Elec
trole
ss N
icke
l Sur
faci
ng
Ther
mal
Spr
ay S
urfa
cing
Expl
osiv
e Su
rfaci
ng
Car
bura
tion
-100
100
300
500
700
900
1,100
Figure 95 - Weighted Scores of Potential Repair Methods This subtask is complete.

100 41633R42.pdf
Subtask 4.2 - Develop Internal Repair Test Program During previous reporting periods, experimental work evaluated the potential repair methods of fiber-reinforced composite repairs and weld deposition repairs. Fiber-reinforced composite repair evaluation trials were delayed as new material properties were defined, which were not yet commercially available. EWI developed in-house procedures to create liners with desired properties using raw materials that were difficult to obtain. Welding parameters development was delayed due to late receipt of the PG&E Magnatech Pipeliner II internal welding system and late receipt of 558.8 mm (22 in.) diameter pipe material from Panhandle Eastern (for which the PG&E welding system was specifically designed). A six-month no-cost extension was obtained to compensate for these schedule delays. Fiber-Reinforced Liner Repairs During the first twelve-month reporting period, a preliminary test program of small-scale experiments for glass fiber-reinforced composite repairs were conducted in order to take advantage of existing tooling for the RolaTube product. API 5L Grade B pipe sections with a 114.3 mm (4.5 in.) diameter and a 4 mm (0.156 in.) thick wall were used with a 2.85 mm (0.11 in.) thick glass polypropylene liner. Following the installation of end caps, all four pipe sections were hydrostatically pressurized to failure. All four pipe sections failed in the areas of simulated corrosion damage. The two pipes with long shallow damage representative of general corrosion resulted in ruptures (Figure 96 and Figure 97) and the two pipes with short, deep damage representative of a deep isolated corrosion pit developed leaks (Figure 98 and Figure 99). The hydrostatic testing results are shown in Table 10.
Figure 96 - Pipe Section with Long, Shallow Simulated Corrosion Damage – Without Liner -
Following Hydrostatic Pressure Test

101 41633R42.pdf
Figure 97 - Pipe Section with Long, Shallow Simulated Corrosion Damage – With Liner –
Following Hydrostatic Pressure Test
Figure 98 - Pipe Section with Short, Deep Simulated Corrosion Damage – Without Liner –
Following Hydrostatic Pressure Test

102 41633R42.pdf
Figure 99 - Pipe Section with Short, Deep Simulated Corrosion Damage – With Liner –
Following Hydrostatic Pressure Test
Simulated Corrosion Damage
Liner Hydrostatic Failure Pressure
MPa (psi) Failure
Mode/Location
No 23.6 (3,431) Rupture in simulated
corrosion damage Long, Shallow
Yes 23.9 (3,472) Rupture in simulated
corrosion damage
No 25.8 (3,750) Leak in simulated corrosion damage
Short, Deep Yes 27.7 (4,031)
Leak in simulated corrosion damage
Table 10 - Hydrostatic Pressure Testing Results The failure pressures for the pipes with the liners were only marginally greater than the pipes without the liners (i.e., 23.9 MPa (3,472 psi) vs. 23.6 MPa (3,431 psi) for the pipe specimens containing long shallow damage and 27.7 MPa (4,031 psi) vs. 25.8 MPa (3,750 psi) for the pipe specimens containing short, deep damage), indicating that the glass fiber-reinforced liners were only marginally effective at restoring the pressure containing capabilities of the pipes. The

103 41633R42.pdf
increases in burst pressure achieved by installing liners in the pipe sections with the long shallow and short deep damage are 1% and 7%, respectively. While these results were initially viewed as discouraging, they do indicate that fiber reinforced composite liners have the potential to increase the burst pressure of pipe sections with external damage. A postmortem analysis of the first four hydrostatic burst tests in pipe sections with simulated corrosion was conducted. So as not to damage the liner, water jet cutting was used to section the pipe sample containing the round-bottom longitudinal slot with the liner installed. The results indicate that the liner did rupture (Figure 100 and Figure 101), thus disbonding was not an issue.
Figure 100 - Water-Jet Cut Section through Pipe Sample Containing Round-Bottom
Longitudinal Slot with Liner Installed

104 41633R42.pdf
Figure 101 - Pipe Sample Containing Round-Bottom Longitudinal Slot Showing Rupture of
Liner Material Postmortem test results also indicate that the difference in modulus of elasticity between the steel and the liner material prevents the liner from carrying its share of the load. The modulus of elasticity for steel is approximately 206.8 GPa (30 x 106 psi). Tensile testing was carried out to determine the modulus of elasticity for the glass/polypropylene liner material that was used (Table 11 and Figure 102). The mean value for the modulus of elasticity for the liner material was measured to be approximately 15.2 GPa (2.2 x 10⁶ psi). Because the glass fiber-reinforced liner material has a significantly lower modulus of elasticity than the steel pipe, as pressure in the lined pipe increases, the stiffness of the steel prevents the composite liner material from experiencing enough strain to share any significant portion of the load.

105 41633R42.pdf
Stress at Break
MPa (ksi) Strain at Break (%)
1% Secant Modulus MPa (ksi)
Trial 1 486.6 (70.58) 4.34 15,123.4 (2,193.394) Trial 2 557.6 (80.88) 4.21 17,166.7 (2,489.741) Trial 3 492.0 (71.36) 5.21 17,316.5 (2,511.472) Trial 4 371.5 (53.89) 5.02 14,103.5 (2,045.482) Trial 5 460.9 (66.85) 4.56 14,347.9 (2,080.924) Trial 6 154.7 (22.45) 4.51 15,191.0 (2,203.205) Mean 420.6 (61.00) 4.64 15,541.5 (2,254.036) S. D. 143.4 (20.81) 0.39 1,384.3 (200.776) C. V. 235.1 (34.11) 8.45 61.4 (8.907)
Minimum 154.7 (22.45) 4.21 14,103.5 (2,045.482) Maximum 557.6 (80.88) 5.21 17,316.5 (2,511.472)
Range 402.8 (58.43) 1.00 3,213.0 (465.990) Table 11 - Tensile Testing Results for Glass/Polypropylene Liner Material
Figure 102 - Tensile Testing Results for Glass/Polypropylene Liner Material

106 41633R42.pdf
It is anticipated that a liner material with a modulus of elasticity on the order of 95% of that for steel will be required for effective reinforcement of steel pipelines that have been weakened by wall loss defects (e.g., by eternal corrosion). A liner material with a modulus of elasticity that is just less than that of steel (i.e., on the order of 95%) would allow the liner to carry its share of the load without putting the interface between the liner and the steel pipe in tension. If the modulus of elasticity for the liner material were greater than that of the steel pipe, as pressure in the pipe increases, the stiffness of the liner would prevent it from expanding with the steel pipe, putting the weak adhesively-bonded interface in tension. If the adhesive layer between the pipe and the sleeve were to be broken, this would allow pressure into the annular space between the pipe and liner, allowing the pressure to act upon the defect-weakened area and rendering the liner useless. Development of testing program to evaluate fiber-reinforced liner repair technology is complete. Weld Deposition Repairs During the first 18 months of the program, a preliminary test program for deposited weld metal repairs was developed. This test program focused on developing GMAW parameters necessary to complete an internal circumferential weld deposition repair. Arc welding processes offer a viable repair method that can be applied from the inside of a gas transmission pipeline. There are several arc welding processes that can be operated remotely. Based on the survey and assessment conducted of candidate arc welding processes, the GMAW process was the most likely choice for this application. It offers a good combination of simplicity, high productivity, robustness, and quality that are required for this welding repair application. Arc welding processes are routinely used to externally repair pipelines. However, repair from the inside offers new challenges for process control since welding will need to be performed remotely. In addition, since the intent is to leave an unexcavated pipeline in the ground, there are several variables that will affect the welding process and resultant weld quality. Soil conditions have the potential to influence heat removal during welding thereby altering the fusion characteristics, welding cooling rate, and mechanical properties. The effects of welding on the external coating used to protect against corrosion will need to be evaluated to assure future pipeline integrity. Finally, if welding was performed in-service, the pressure and flow rate of the gas will have a strong effect on the equipment design of the welding process. New process equipment technology will be required to shield the welding process from methane contamination and cope with higher gas pressures. If weld deposition repair had been selected as the most viable repair process, a significant deliverable would have been the development of an equipment specification defining all the functional requirements for an internal repair welding system. Welding procedures were developed using the 6-axis robot. The objective of these tests was to establish deposit layer parameters that could be used to make ring, spiral or patch repairs. Since

107 41633R42.pdf
the objective for these repairs is to reinforce the wall thickness, the bead shape criteria was to make flat deposits. If a large area needed repaired, multiple weld beads would be tied to each other. Here, bead overlap parameters need to be developed to optimize the uniformity of the entire repair deposit area. In many ways, the parameters that were developed are similar to cladding procedures. The ideal weld bead shape would have uniform thickness across the weld section except near the weld toes, which should taper smoothly into the base material (Figure 103). Smooth toes promote good tie-ins with subsequent weld beads. The fusion boundary should be uniform and free from defects. Figure 103 - Weld Bead Shape Diagram Using the robot welding system, ring welding procedures using weaving were developed for several bead widths (Figure 104). This figure shows the location were the first half of the ring was stopped and the second half was started in the overhead position. This was not an ideal stop-start location but was required with the robot to manage the welding cables. If start-stops were required to complete a repair, it would be preferred to have them positioned at a different location around the circumference, ideally in the flat position. Tie-in parameters will need to be optimized for each possible starting position once preferred bead shape weaving parameters are selected. A true orbital bore welding machine, like the Bortech, would have a current and shielding gas commutation system to provide infinite rotations without cable problems thereby minimizing stop-starts.
Weld Bead
Weld Toe
Base Metal

108 41633R42.pdf
Figure 104 - Tests R-01 - R-04 at 12:00 (Note the Poor Tie-Ins for R-01 through R-03)

109 41633R42.pdf
When welding was initiated, the pipe was near room temperature. The weld bead profile at the start (Figure 105 and Figure 106) slowly changed as a steady-state temperatures are built in the material based on the heat input of each welding procedure. In general, most weld starts appeared more convex based on the low starting material temperature. Note that test R-04 was overlapped on test R-03 to provide a larger deposit layer in Figure 106.
Figure 105 - Test R-01 at 12:00 Showing Poor Stop-Start Tie-In

110 41633R42.pdf
Figure 106 - Tests R-03 and R-04 at 12:00 Showing Better Stop-Start Overlap.
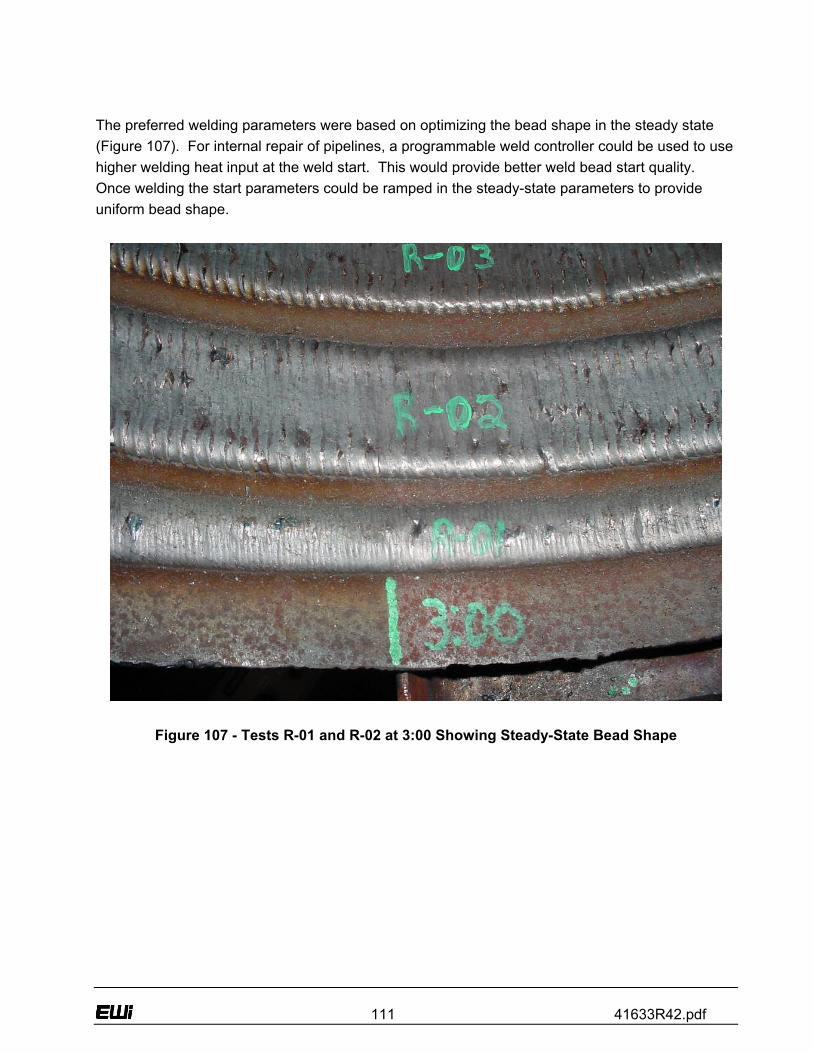
111 41633R42.pdf
The preferred welding parameters were based on optimizing the bead shape in the steady state (Figure 107). For internal repair of pipelines, a programmable weld controller could be used to use higher welding heat input at the weld start. This would provide better weld bead start quality. Once welding the start parameters could be ramped in the steady-state parameters to provide uniform bead shape.
Figure 107 - Tests R-01 and R-02 at 3:00 Showing Steady-State Bead Shape

112 41633R42.pdf
Table 12 contains the welding parameters for the weave bead procedures used. Wire feed speeds varied from 5.08 meters per minute (mpm) (200 ipm) to 6.35 mpm (250 ipm). This was better than preliminary tests with the Bortech system, which were at 4.45 mpm (175 ipm) and resulted in stringer beads that had a ropy appearance.
Weld No.
Specimen No.
Wire Feed Speed mpm (ipm)
Voltage (Trim)
Travel Speed mmpm (ipm)
Weave Amplitude
mm/side (in/side)
Weave Frequency
(Hz)
Dwell Time
(seconds) Comment
1 R-01 5.08 (200) 0 76.2 (3) 9.9 (0.39) 0.6 0.6 Good for a narrow repair.
2 5.08 (200) 0 127 (5) 25.4 (1.00) 0.6 0.2 Too fast. Zigzag pattern results.
3 R-02 6.43 (253) -4 25.4 (1) 25.4 (1.00) 0.1 0.6 • Bad at overhead position • Turned voltage to -4 • Dwell is not needed
4 R-03 6.43 (253) -4 25.4 (1) 25.4 (1.00) 0.1 0.0 6 mm (0.25 in.) overlap at overhead position to tie two welds together - porosity resulted.
5 R-04 6.43 (253) -4 25.4 (1) 25.4 (1.00) 0.1 0.0
• 6 mm (0.25 in.) overlap at overhead and flat positions.
• Centerline is 22 mm (0.88 in.) from previous weld edge (3 mm (0.125 in.) circumferential overlap).
• Good circumferential tie on uphill side. • Poor circumferential tie on downhill side. • Need more wire feed speed due to bad fusion
on downhill side
6 R-05 7.62 (300) -4 25.4 (1) 25.4 (1.00) 0.1 0.0 • 6 mm (0.25 in.) overlap at every 30 degrees. • See Table 13 for tie-in quality at each position
Table 12 - Welding Parameters for Specimens R-01 through R-05

113 41633R42.pdf
Table 13 contains the tie-in quality at each clock position for specimen R-05.
Position (clock)
Tie In Quality (poor/OK/good)
12:00 Poor
1:00 Poor
2:00 Poor
3:00 Poor
4:00 OK
5:00 Good
6:00 Good
7:00 Robot problem
8:00 Good
9:00 Good
10:00 Good
11:00 OK
Table 13 - Tie-In Quality at Each Clock Position for R-05 To further improve starting bead shape, some additional tests were performed using 7.62 mpm (300 ipm) wire feed speed (Figure 108). These tests were used by the technician to study the precise location for starting on a "stop" and to evaluate gravity effects. As shown by these tests, start bead shape can be improved through the use of higher wire feed speeds (which produce higher heat input). No additional procedures were developed with the 6-axis robot.

114 41633R42.pdf
12:00 – Too Much Overlap 1:00 – Too Much Overlap 2:00 – Slightly Better
3:00 – Some Convexity 4:00 – Okay 5:00 – Good
6:00 – Good 7:00 – Bad Appearance Due 8:00 – Good Robot Program Error
9:00 – Good 10:00 – Good 11:00 – Okay Figure 108 - Tie-In Tests Using Parameters R-05 Every 30º Around One Ring Deposit
The subtask is complete.

115 41633R42.pdf
Comprehensive Test Program A comprehensive test program was developed to evaluate the two most feasible potential repair methods of carbon fiber-reinforced composite liner repair and weld deposition repair based on the pipeline operator survey, input from NETL, physical testing to date, corrosion being the most common pipeline failure, and rupture due to excessive internal pressure being the failure mechanism of corrosion. From the operator survey, it was determined that pipe outside diameter sizes range from 50.8 mm (2 in.) through 1,219.2 mm (48 in.). The most common size range for 80% to 90% of operators surveyed is 508 mm to 762 mm (20 in. to 30 in.), with 95% using 558.8 mm (22 in.) pipe. Both 558.80 mm (22 in.) diameter by 7.92 mm (0.312 in.) wall, API 5L-Grade B pipe and 508 mm (20 in.) diameter by 6.35 mm (0.250 in.) wall, API 5L-X52 pipe sections were obtained from Panhandle Eastern. The test program considered a range of damage types, both internal and external, that are typical of those encountered in pipelines. The U. S. Department of Transportation, Research and Special Programs Administration, Office of Pipeline Safety, compiles statistics on pipeline failure causes(5) which are posted on their web site located at http://primis.rspa.dot.gov/pipelineInfo/stat_causes.htm. During 2002-2003, DOT statistics indicate that for natural gas transmission pipelines the largest contributor to pipeline damage was clearly corrosion (as shown in Table 14). Eventually, the wall thickness decreases to the point where it is not sufficiently large enough to contain the stresses from the internal pressure and the pipeline will rupture or burst.
Reported Cause Number ofIncidents
% of TotalIncidents
Property Damages
% of Total Damages Fatalities Injuries
Excavation Damage 32 17.9 $4,583,379 7.0 2 3 Natural Force Damage 12 6.7 $8,278,011 12.6 0 0 Other Outside Force Damage 16 8.9 $4,687,717 7.2 0 3 Corrosion 46 25.7 $24,273,051 37.1 0 0 Equipment 11 6.1 $3,958,904 6.0 0 5 Materials 36 20.1 $12,130,558 18.5 0 0 Operation 5 2.8 $286,455 0.4 0 2 Other 21 11.7 $7,273,647 11.1 0 0 Total 179 $65,471,722 2 13
Table 14 - 2002-2003 Natural Gas Transmission Pipeline Incident Summary by Cause Given the fact that corrosion was the most significant contributor to natural gas pipelines failures during 2002 and 2003, the two most common types of corrosion, general corrosion and a deep/isolated corrosion pit (both with a 30% reduction in burst pressure) were selected for repair process evaluation. Both types of corrosion damage were introduced into pipe sections

116 41633R42.pdf
with a milling machine. Using a ball end mill, long shallow damage representative of general corrosion (as shown in Figure 17) was originally introduced into pipe specimens. Using an end mill with rounded corners, short, deep damage representative of a deep isolated corrosion pit (as shown in Figure 18) was introduced pipe specimens as well. Over time, external corrosion will continue to decrease pipeline wall thickness. The selected configuration for simulated corrosion damage for 558.80 mm (22 in.) pipe is shown in Figure 109. The dimensions for the 20 in pipe were appropriately scaled down. The selected design for simulated corrosion damage for 508 mm (20 in.) pipe is shown in Figure 110.
Figure 109 - Selected Configuration of Simulated Damage for 558.80 mm (22 in.) Diameter
Pipe Sections

117 41633R42.pdf
Figure 110 - Selected Configuration of Simulated Damage for 508 mm (20 in.) Diameter
Pipe Sections The dimensional data and RSTRENG-predicted burst pressures for the selected simulated corrosion damage configuration for internal repair evaluation trials is shown in Table 15.
Pipe Outside Diameter 558.80 mm (22 in.) 508 mm (20 in.)
Wall Thickness 7.92 mm (0.312 in.) 6.35 mm (0.250 in.)
Pipe Material API 5L-Grade B API 5L-X52
Type of Damage Simulated Corrosion Defect Simulated Corrosion Defect
Damage Length 190.50 mm (7.5 in.) 127.00 mm (5 in.)
Damage Depth 3.96 mm (0.156 in.) 3.45 mm (0.136 in.)
Pressure corresponding to 100% SMYS 6.84 MPa (992 psi) 8.96 MPa (1,300 psi)
Damage as % of Wall Thickness 50% 54%
RSTRENG-predicted burst pressure for pipe with simulated damage 5.15 MPa (747 psi) 6.72 MPa (974 psi)
RSTRENG-predicted burst pressure compared to pressure at 100% SMYS 75% 75%
Table 15 - Dimensional Data and RSTRENG Predicted Burst Pressures for Simulated
Corrosion Damage Selected for Internal Repair Evaluation Trials

118 41633R42.pdf
Based on the preliminary fiber-reinforced liner and weld metal deposition repair trials conducted in the first six months of this project, the test program was consequently designed to evaluate full-scale pipe sections with simulated corrosion damage repaired with both carbon fiber-reinforced composite liner repairs and weld deposition repairs that will be subsequently hydrostatic pressure tested until rupture. Additionally, full-scale pipe sections in the virgin (i.e., un-damaged) condition and with un-repaired simulated corrosion damage were also hydrostatically tested until rupture to establish baseline performance data against which to compare the performance of both repair technologies. According to the Project Management Plan(2), Subtask 4.2 activities contain the development of a detailed test matrix to enable the selected repair methods to be evaluated over a range of typical operating conditions. Since physical testing to date has shown that carbon fiber-reinforced liner repair is clearly superior to weld deposition repair, it is more appropriate for this activity to be incorporated into the activities for Subtask 4.4 and to be developed solely for the application of carbon fiber-reinforced liner repair. This subtask is complete. Subtask 4.3 - Simulation and Analysis of Potential Repair Methods In previous work for PRCI(6), finite element analysis (FEA) was performed to simulate external weld deposition repair of internal wall loss. To supplement this work, plans were made for additional FEA to simulate internal weld deposition repair of external wall loss. During the first six-month reporting period, and prior to the initial trials for fiber-reinforced composite repairs, RolaTube conducted FEA to determine the required properties of the liner material. Again, postmortem analysis of the pipe section damage indicates that the difference in modulus of elasticity between the steel and the original glass fiber-reinforced liner material prevents the liner from carrying its share of the load. During the 18 months of project work, realistic combinations of composite material and thickness were determined for use in liner systems for internal repair of natural gas transmission pipelines. Pipeline repairs that use internal addition of material are advantageous for many circumstances where access to the external surface of the pipe is restricted. Transportation of any material that will be added to the pipe wall must be considered, since it must ultimately be introduced from outside the pipe wall. Composites offer the opportunity to tailor the properties of the liner material in different directions to allow the material to be fit through the inside of the pipe and then be reshaped so it can be placed against the wall in the area where repair is desired.

119 41633R42.pdf
Since repair is contemplated most often for external corrosion that exceeds the allowable limit sizes, we should consider that corrosion on the external surface may continue after the emplacement of the liner. As the external corrosion continues, the situation will get closer and closer to that where only the liner carries the stresses from the internal pressure in the pipe. A simple case can be used for estimation where the entire steel pipe has been lost to external corrosion and only the liner is left to carry the external stress. We can choose an initial case in the middle of the commonly used range for transmission pipelines: a 508 mm [20 in.] outside diameter pipe with a 6.35 mm (0.25 in.) wall thickness made from X-65. For this pipeline, the additional liner material should not be so thick as to prevent subsequent examinations of the adjacent steel pipeline by internal inspection devices. This roughly limits the thickness of the liner tc to less than 12.7 mm (0.5 in.) thickness. We can define several criteria for the acceptability of the liner repair. One will involve the strength of the liner under a maximum pressure. One simple test case is that the liner should not be at greater risk of bursting than the remote un-repaired pipe under the pressure to reach a stress equal to the standard minimum yield strength of the pipe material. Using Barlow’s formula, the pressure P to reach this hoop stress in the remote pipe is SMYS t/R or 11.3 MPa (1,646 psi). Composite materials differ from steel in the expected stress-strain relationship. The composite liner material would be designed to be strong both in the pipe axial and hoop directions. In a strong direction, the composite will have a much lower peak strain before failure than steel, but the stress-strain curve up to that failure point will be much closer to elastic. Figure 111 shows some estimates of the ranges of tensile strength and modulus for carbon fibers. The strength goes down as the modulus increases, a relationship that can be approximated by a linear relationship between the fiber modulus Ef and the tensile strength of the fiber σfu
⎟⎠⎞
⎜⎝⎛×−=
29,300MPaE380,1140,4 f
fu MPaMPaσ
Equation 1 - Tensile Strength of the Fiber σfu in MPa
⎟⎠⎞
⎜⎝⎛ ×
−=500,42
E200600 ffu ksiσ
Equation 2 - Tensile Strength of the Fiber σfu in ksi

120 41633R42.pdf
gTensile Modulus (ksi)
0.0 2.0e+4 4.0e+4 6.0e+4 8.0e+4 1.0e+5 1.2e+5
Tens
ile S
treng
th (k
si)
0
200
400
600
800
1000
Tensile Modulus (MPa)
0 1e+5 2e+5 3e+5 4e+5 5e+5 6e+5 7e+5 8e+5
Tens
ile S
treng
th (M
Pa)
0
1000
2000
3000
4000
5000
6000
Normal ModulusHigh ModulusVery High ModulusLinear Approximation
Figure 111 - Relationship Between Modulus and Strength for Carbon Fibers The tensile strength and modulus of the composite can be estimated in the strong direction as 60% of the fiber strength and modulus, respectively. It will be appropriate to use a safety factor (SF) on failure strength in design to keep the strain well below the failure level. Now the design condition for the composite becomes
22
6.0c
cfu
ttR
tσSFP−−
×××<
Equation 3 - Pressure to Reach Stress Equal to the SMYS of the Pipe Material Once SF has been set (with a value of 0.9) then we can determine the relationship between σfu and tc that defines the minimum allowable based on the values chosen above:

121 41633R42.pdf
MPat
MPa-mmσc
fu 5.101500,10 −⎟⎠⎞
⎜⎝⎛×>
Equation 4 - Minimum Allowable Tensile Strength of the Fiber σfu in MPa
ksit
inksiσc
fu 524.112.60 −⎟⎠⎞
⎜⎝⎛×−>
Equation 5 - Minimum Allowable Tensile Strength of the Fiber σfu in ksi The fiber modulus can thus be given a maximum value using the linear approximation given above. This function is plotted in Figure 112.
mm in t for 5.101500,10140,4380,1
000,293c ⎥
⎦
⎤⎢⎣
⎡
⎭⎬⎫
⎩⎨⎧
−⎟⎠⎞
⎜⎝⎛×−×⎟
⎠⎞
⎜⎝⎛<
cf
tE
Equation 6 - Maximum Fiber Modulus in MPa
inches in t for 524.112.60600200
500,42c ⎥
⎦
⎤⎢⎣
⎡
⎭⎬⎫
⎩⎨⎧
−⎟⎠⎞
⎜⎝⎛×−×⎟
⎠⎞
⎜⎝⎛<
cf
tE
Equation 7 - Maximum Fiber Modulus in ksi If the fiber modulus is above the line in Figure 112, then the strength of the fibers will be too low to achieve the required strength in the composite.

122 41633R42.pdf
Composite Thickness (in.)
0.0 0.1 0.2 0.3 0.4 0.5 0.6
Fibe
r Mod
ulus
(ksi
)
0.0
2.0e+4
4.0e+4
6.0e+4
8.0e+4
1.0e+5
1.2e+5
Composite Thickness (mm)
0 2 4 6 8 10 12 14
Fibe
r Mod
ulus
(MP
a)
0
1e+5
2e+5
3e+5
4e+5
5e+5
6e+5
7e+5
8e+5
Strength LimitShear Strength Limit
Fiber Strength Too Low
Matrix Strength Too Low
69.0 MPa[10 ksi] shear
27.6 MPa[4 ksi] shear
103.4 MPa[15 ksi] shear
Figure 112 - Design Space for Composite Liner This both limits the minimum thickness of the composite and limits the use of the highest modulus fibers, since they have lower ultimate strengths. There can also be a problem with failure in shear of the matrix material between the layers of fibers. The simple case described above does not have shear between the fibers, but any case where the steel thickness varies in the hoop direction will have to transfer loads back and forth into the composite and induce shear where those transfers occur. Again, we assume a simple case. Here the case is a relatively abrupt transition from the full wall thickness of steel to no steel remaining over a small sector of the circumference, with long axial length. In this case we have to transfer all of the load that was carried by the steel into the composite on one side of the loss of wall thickness and back into the steel on the other side. We can assume that all of the transfer occurs within a distance of four times the composite thickness, centered on the transition of the steel wall thickness to zero. Then we can estimate the shear between the composite layers based on an even transfer of the moment across this distance.

123 41633R42.pdf
The moment per unit length is PRc, where c is a function of the thickness of pipe ts and composite tc and the moduli of the materials Es and Ec. The c function can be written as
( ) ( )ccss
csss
EtEt
ttEtc
×+×
⎟⎠⎞
⎜⎝⎛ +××
=22
Equation 8 - c as a Function of the Thickness of Both the Pipe and Liner, and the Moduli
of Both the Pipe and Liner The shear stress τ is as function of the shear force per unit length V
ct
V×⎟⎠⎞
⎜⎝⎛
=34
τ
Equation 9 - Shear Stress as a Function of Shear Force where
ctcRPV
×××
=2
Equation 10 - Shear Force per Unit Length The shear stress must not exceed the shear resistance of the matrix material in the composite. Some examples of shear resistance have been chosen and included in Figure 112. The combination of the two design cases indicates that there is an optimum modulus of the fibers that allows the smallest thickness to be used. This optimum modulus is a function of the shear strength of the matrix material as well. The second design case could be refined by finite element modeling, which would better estimate the peak shear forces in the composite. Two economic limits should also be considered with carbon fiber composites. Higher modulus of the composite can be achieved by choosing high modulus fibers, but at increasing cost. Nevertheless, the more expensive manufacturing process for the highest modulus fibers has prevented wide scale use in infrastructure. The alternative described above is to go to larger thickness. Nevertheless, the larger thickness must be created in the composite by the addition of more sheets or “plies” of the fibers. As the number of plies increases, the manufacturing

124 41633R42.pdf
difficulties multiply. The “comfort level” for number of plies would today probably be less than that which would be needed for a 12.7 mm (0.5 in.) thick composite liner. The assessment above has only related to the hoop stress resistance of the composite. Axial strain resistance is also available from the composite because both the axial and hoop directions are strengthened by the fibers. Composite liners need both high fiber modulus and high shear strength of the matrix, above that for many thermoplastics, to resist the types of shear stresses that can happen in composite liners. There are limits to how high the modulus of the fibers should go, because the strength drops off for the highest modulus fibers. This subtask is complete. Subtask 4.4 - Internal Repair Evaluation Trials To date, the evaluation of potential repair methods focused on fiber-reinforced composite liner repairs and weld deposition repairs. Fiber-Reinforced Liner Repairs From the pipe provided by Panhandle Eastern, a section of 508 mm (20 in.) diameter pipe with simulated corrosion damage was used to evaluate a carbon fiber-reinforced liner. EWI procured raw carbon fiber material and fabricated a 11.4 mm (0.45 in.) thick reinforcement patch (design 1) using a "wet lay-up" process with a vinylester resin system. As compared to the glass fiber-reinforced composite used in the trials during the first six-month reporting period, carbon fiber-based composite materials have a much higher modulus of elasticity. The modulus of elasticity for commercial grade raw carbon fiber material is in the 206.8 GPa (30 x 106 psi) range, but this is reduced significantly when a matrix material is introduced. High grade raw carbon fiber materials have a modulus of elasticity that is in the 344.7 to 413.7 GPa (50 to 60 x 106 psi) range; however, these high grade raw carbon fiber materials are expensive and scarce. None the less, it may be possible to design a liner material that, when the matrix material is introduced, has a modulus of elasticity on the order of 95% of that for steel. The cost of a liner composed of high-grade raw carbon fiber material will be high. The results of the survey of pipeline operators suggests that such a repair may still be useful in spite of the high cost for river crossings, under other bodies of water (e.g., lakes and swamps), in difficult soil conditions, under highways, under congested intersections, and under railway crossings. When the glass/polypropylene liner material was evaluated, it was found to be only marginally effective at restoring the pressure containing capabilities of the pipe. The important contributing physical property for a composite repair device is assumed to be an intrinsic modulus

125 41633R42.pdf
approximating that for steel. Based on materials cost and availability, a true match was not possible, so the alternative was to develop a composite having an attainable estimated modulus and adjust section thickness to achieve the desired stiffness. The second issue is the ability to “access” that stiffness in the form of the composite physical properties. The limiting factor in composite failure is often interlaminar shear strength. A reaction to radial flexure will be a reacted shear stress that will attempt to separate the fabric lamina at the weak link, the resinous interface between fabric layers. A typical value for a “good" composite is an interlaminar shear strength of about 51.7 MPa (7,500 psi). Taking these two requirements together, engineering analysis was employed to arrive at the composite requirements based on the assumed values for economical carbon fiber reinforcement with a vinylester resin system (see Results and Discussion section for Subtask 4.3 - Simulation and Analysis of Potential Repairs Methods). It was determined that the patch should be on the order of 11.4 mm (0.45 in.) thick to approximate the stiffness of the steel while still maintaining an interlaminar shear strain below the 51.7 MPa (7,500 psi) benchmark. After two weeks of cure time, the pipe section with the EWI fabricated patch was hydrostatically tested until failure (Figure 113). The resultant burst pressure was 15.13 MPa (2,194 psi) which is 122% of pressure corresponding to 100% of specified minimum ultimate tensile strength. Figure 114 is a closer view of the failure initiation site. Figure 115 clearly shows that the failure was caused by interlaminar shear mostly between the anti-corrosion glass layer and the carbon layer (1 → 2 layer interfacial failure is common in composites). There was no evidence of disbonding between the pipe and the composite liner.
Figure 113 - Pipe With Carbon Fiber-Reinforced Liner (Design 1) Repair After Burst Test

126 41633R42.pdf
Figure 114 - Failure Initiation Site For Burst Tested Pipe With Carbon Fiber-Reinforced
Liner Repair (Design 1)

127 41633R42.pdf
Figure 115 - Magnification of Carbon Fiber-Reinforced Patch (Design 1) After Burst Test Table 16 contains the RSTRENG predicted and measured burst pressures for pipe repaired with a carbon fiber-reinforced liner.
Burst Pressure Composite Repair
(MPa) (psi) Failure Location
RSTRENG Prediction 6.72 974 n/a Burst Test 15.13 2,194 Center of reduced area
Table 16 - Predicted and Measured Burst Pressures for Pipe With A Carbon Fiber-
Reinforced Liner Repair Patch (Design 1) The burst pressure for the pipe repaired with a carbon fiber reinforced liner is much higher than the RSTRENG predicted burst pressure for an un-repaired pipe. This result must be viewed while taking into account the results of the additional testing that was performed on virgin (i.e., un-damaged) pipe and on pipe with un-repaired simulated corrosion damage, however. The results of this testing and an overall comparison of all burst test results are located in the Results and Discussion section for Subtask 4.4 - Internal Repair Evaluation Trials under the heading for Baseline Pipe Material Performance.

128 41633R42.pdf
This testing was an excellent evaluation of a carbon fiber-reinforced liner material. The patch design requires optimization, perhaps allowing a tapered design or smaller dimensions. The vacuum-bagging process also requires refinement. A Vacuum Assisted Resin Transfer Molding (VARTM) approach would be optimal as it would produce far better fiber compaction and would allow the production of more complex patch designs The results of these trials indicate that the use of carbon fiber-reinforced liners is promising for internal repair of gas transmission pipelines. Fiber reinforced composite repairs applied to the outside of exposed pipelines have become commonplace in the gas transmission pipeline industry. Based on the results of these trials, the application of this technology to internal repair appears to be feasible, although further development is required to achieve the required material properties. It is anticipated that higher grade raw carbon fiber materials will become more widely available in the future. Further development is also required to optimize the design of the carbon fiber liner/patch. Another promising aspect of internal pipeline repair using fiber reinforced composite materials is that there is no apparent technical limitation for performing the repairs while the pipeline remains in service. Weld Deposition Repairs During the 18 month reporting period, EWI conducted two weld metal deposition studies. The first evaluation was to determine the feasibility of making weld deposition repairs on the inside diameter (ID) of a pipeline to replace metal loss on the outside diameter (OD) due to corrosion damage. The second evaluation was to determine the effect of methane in the welding environment on weld quality as the amount of methane was varied in the shielding gas. To evaluate internal weld metal deposition repairs to replace metal loss on the OD due to corrosion damage, two layers of weld metal were deposited inside a section of 558.8 mm (22 in.) diameter API 5L-Grade B pipe that was incased in a dirt box filled with soil. After two layers of weld metal were deposited inside the pipe section, several ultrasonic thickness measurements were subsequently taken to confirm that the weld deposition layers restored the pipe wall back to the original thickness. See Figure 116 for the thickness measurement locations.

129 41633R42.pdf
Figure 116 - Ultrasonic Thickness Measurement Locations on Weld Deposition Repair Spacing of the ultrasonic measurements on the second weld layer were close enough to assure that the entire simulated corrosion area was measured. Locations 15 and 16 were designated as reference measurements. There are five locations that had thickness values less than reference points 15 and 16 (as seen in Table 17). As a consequence, these areas were ultrasonically scanned to determine the cause of the irregularities. It was determined that the irregularities were caused by lack-of-fusion defects between the weld toes of the first layer and the inside diameter of the pipe. These defects were oriented along the circumferential direction of the pipe. Defects oriented in the longitudinal direction have a tendency to fail from hoop stress (i.e., pressure loading) and must be reinforced in the circumferential direction. Defects oriented in the circumferential direction have a tendency to fail from axial stresses (due to pipeline settlement, etc.) and must be reinforced in the longitudinal direction. The irregularities found in the weld deposition layers were considered inconsequential to hydrostatic testing given their size and circumferential orientation, therefore, hydrostatic burst testing was conducted on the pipe section without repairing the irregularities. Additional ultrasonic measurements were taken
Inside Pipe Diameter Surface
Second Weld Layer
First Weld Layer

130 41633R42.pdf
at four locations with the transducer to the side of the defect. These measurements are shown to the right of the irregular defective measurements (to the right of the slash) in Table 17. The four additional measurements were in excess of reference measurements 15 and 16.
Thickness Measurement Thickness Measurement
Location in Figure 116 mm inches
Comments
1 10.67 0.420 2 13.13 0.517 3 5.36 / 9.14 0.211 / 0.360 Lack-of-Fusion 4 13.21 0.520 5 5.28 / 13.06 0.208 / 0.514 Lack-of-Fusion 6 9.27 0.365 7 9.37 0.369 8 9.22 0.363 9 5.84 / 9.35 0.230 / 0.368 Lack-of-Fusion
10 9.12 0.359 11 13.67 0.538 12 10.59 0.417 13 13.41 0.528 14 5.20 / 13.34 0.205 / 0.525 Lack-of-Fusion 15 7.89 0.311 Reference Measurement 16 8.18 0.322 Reference Measurement 17 13.21 0.520 18 9.37 0.369 19 13.46 0.530 20 9.25 0.364 21 5.46 0.215 Lack-of-Fusion 22 9.39 0.370 23 13.97 0.550 24 9.37 0.369
Table 17 - Ultrasonic Thickness Measurements at Locations in Figure 116

131 41633R42.pdf
The area of simulated corrosion on the outside pipe surface is shown in Figure 117 after internal weld deposition repair.
Figure 117 - Simulated Corrosion on Outside of Pipe After Internal Weld Deposition
Repair

132 41633R42.pdf
After the box with soil was removed from the weld repaired pipe section, an impression of the corrosion damage was left in the soil as shown in Figure 118. The outline of the weld deposition is also clearly visible where the asphalt coating melted and transferred to the surrounding soil during the welding process.
Figure 118 - Dirt That Was In Contact With Pipe During Internal Weld Deposition Repair Upon further examination, the outside pipe surface (opposite the internal weld repair) exhibited a dent (a.k.a. welding distortion) as a result of the weld heating and cooling cycles. In Figure 119, a red string is used as a reference against which to measure the extent of the distortion. The red string indicates where the outside surface of the pipe was before welding. The yellow box indicates the location of the simulated corrosion. Figure 120 contains magnified pictures from the middle and ends of the dented area of pipe.

133 41633R42.pdf
Figure 119 - Profile of Dent in Outside Pipe Surface After Internal Weld Deposition Repair Figure 120 - Magnified Pictures of Dent at Ends and Middle of Simulated Damage

134 41633R42.pdf
Figure 121 - Pipe Section with Internal Weld Deposition Repair After Hydrostatic Burst
Test

135 41633R42.pdf
Table 18 contains the predicted and actual burst pressure values.
Pipe Outside Diameter 558.80 mm (22 in.)
Wall Thickness 7.92 mm (0.312 in.) Pipe Material API 5L-Grade B Type of Damage Simulated Corrosion Defect Damage Length 190.50 mm (7.5 in.)
Damage Depth 3.96 mm (0.156 in.) Pressure corresponding to 100% SMYS 6.84 MPa (992 psi)
Damage as % of Wall Thickness 50%
RSTRENG-predicted burst pressure for pipe with damage
5.15 MPa (747 psi)
RSTRENG-predicted burst pressure compared to pressure at 100% SMYS
75%
Measured burst pressure for pipe with damage following repair
9.68 MPa (1,404 psi)
Table 18 - Hydrostatic Bust Test Results for Internal Weld Deposition Repair Specimen The burst pressure for the pipe repaired with using weld deposition is much higher than the RSTRENG predicted burst pressure. As before, this result must be viewed while taking into account the results of the additional testing that was performed on virgin (i.e., un-damaged) pipe and on pipe with un-repaired simulated corrosion damage. The results of this testing and an overall comparison of all burst test results are located in the Results and Discussion section for Subtask 4.4 - Internal Repair Evaluation Trials under the heading for Baseline Pipe Material Performance. During any arc welding operation, the material being welded is exposed to temperatures that range from ambient to well above the melting temperature 1,536°C (2,736°F). When steel at high temperature is exposed to a hydrocarbon gas (such as methane), carburization can occur. When steel at temperatures above 1,130ºC (2,066ºF) is exposed to methane, eutectic iron can form as the result of diffusion of carbon from the methane into the steel. In previous work at EWI,(7) in which welds were made on the outside of thin-wall pipe containing pressurized

136 41633R42.pdf
methane gas (Figure 122, Figure 123, and Figure 124), carburization and the formation of thin layer of eutectic iron occurred (Figure 125 and Figure 126).
Figure 122 - Experimental Set-Up for Welding onto Thin-Wall Pipe containing Pressurized
Methane Gas
Figure 123 - External Appearance of Welds Made on 3.2 mm (0.125 in.) Thick Pipe with
Methane Gas at 4.5 mPa (650 psi) and 6.1 m/sec (19.9 ft/sec) Flow Rate
Figure 124 - Internal Appearance of Welds Shown in Figure 123

137 41633R42.pdf
Figure 125 - Metallographic Section through Weld 2M9 (middle weld shown in Figure 123
and Figure 124)
Figure 126 - Eutectic Iron Layer at Inside Surface of Section through Weld 2M9

138 41633R42.pdf
This phenomenon was previously reported by Battelle during experiments with liquid propane.(8) There were also small cracks associated with the eutectic iron layer (Figure 127), which were attributed to the limited ductility of eutectic iron.
Figure 127 - Cracks in Eutectic Iron Layer of Metallographic Section Shown in Figure 126 In a field repair situation, evacuating a pipeline prior to weld repair will be particularly difficult. There is a high probability that the weld shielding gas will be contaminated to some degree with methane that remains in the pipe; therefore, EWI conducted weld trials with a shielding gas containing various levels of methane to determine the effect of methane on resultant weld quality. Table 19 contains the volume percent of methane for each weld specimen. Each weld was cross-sectioned and three weld metal hardness values obtained. The chemical composition of each weld were also measured to determine if the presence of methane affected the carbon content of each deposited weld.

139 41633R42.pdf
Shielding Gas Flow Rate
95% Ar + 5% CO2
10% Methane + 4.5% CO2 + 85.5% Ar
Weld ID
(m3/hr) (ft3/hr) (m3/hr) (ft3/hr)
Volume Percent Methane
Average Weld Metal Hardness (Hv-10kg)
Weld Metal Carbon Content
(%) Comments
325-2 1.42 50 0.00 0 0.0 169.7 0.073 No Porosity 325-3 1.13 40 0.28 10 2.0 174.7 0.074 No Porosity 325-4 0.99 35 0.42 15 3.0 175.0 0.062 Porosity 325-5 0.85 30 0.57 20 4.0 175.3 0.071 Porosity 325-6 1.22 43 0.20 7 1.4 169.7 0.075 No Porosity 325-8 0.99 35 0.28 10 2.2 176.7 0.071 No Porosity 325-9 0.85 30 0.42 15 3.3 171.3 0.081 Porosity
Table 19 - Volume Percent of Methane per Weld Specimen The average weld metal hardness values and percent carbon content from Table 19 are graphically depicted in Figure 128.
166
168
170
172
174
176
178
0.0 1.4 2.0 2.2 3.0 3.3 4.0
Volume Percent of Methane in the Shielding Gas
Ave
rage
Wel
d M
etal
Har
dnes
s, H
v-10
kg
0
0.01
0.02
0.03
0.04
0.05
0.06
0.07
0.08
0.09
% C
arbo
n C
onte
nt
Weld Metal Hardness Weld Metal Carbon Content
Figure 128 - Graphical Representation of Table 19 Hardness Values and Carbon Content

140 41633R42.pdf
In Figure 128, the weld metal hardness scale is on the left axis and the percent carbon content of the weld metal is shown on the right axis. Increasing the volume percent of methane did not consistently increase either weld metal hardness or percent carbon content of the weld metal. Each weld deposit specimen (made in methane) was photographed as shown in Figure 129 through Figure 135. A visual examination of the samples revealed that a volume of 3% methane caused porosity in weld specimens 325-4 (Figure 131), 325-5 (Figure 132), and 325-9 (Figure 135).
Figure 129 - Weld Specimen 325-2
Figure 130 - Weld Specimen 325-3

141 41633R42.pdf
Figure 131 - Weld Specimen 325-4
Figure 132 - Weld Specimen 325-5
Figure 133 - Weld Specimen 325-6

142 41633R42.pdf
Figure 134 - Weld Specimen 325-8
Figure 135 - Weld Specimen 325-9 These results clearly indicate that an increased volume of methane in the weld shielding gas produces welds with porosity defects that decrease weld quality. Adequate shielding gas protection is critical to creating sound, defect free welds. Providing adequate gas shielding protection during welding will be extremely difficult to achieve in a field repair situation. The results of these trials indicate that the use of weld deposition, although promising in principal, is less than ideal for internal repair of gas transmission pipelines. While weld deposition repairs applied to the outside of exposed pipelines are becoming more commonplace in the gas transmission pipeline industry, the application of this technique to the inside of the pipe presents a number of difficulties. When applied to the outside of an exposed pipeline,

143 41633R42.pdf
dents or concavity that result from welding residual stresses can be overcome by simply applying more weld metal until the outside diameter of the pipe is restored. This is not possible for internal repair where additional weld metal would result in further concavity. In addition to the difficulties that arise from remotely operating welding equipment from great distances, the presence of methane in the welding environment would seem likely to cause additional difficulties. This subtask is complete. Baseline Pipe Material Performance Because of the large discrepancies in the predicted burst pressures and the actual burst pressures, additional physical testing was performed. Four hydrostatic pressure tests were conducted for pipe sections in the following pipe materials and conditions:
• 558.8 mm (22 in.) diameter by 7.92 mm (0.312 in.) thick API 5L Grade B pipe sections:
− Virgin condition
− Un-repaired with simulated corrosion damage
• 508.0 mm (20 in.) diameter by 6.35 mm (0.25 in.) wall API 5LX-52 pipe sections:
− Virgin condition
− Un-repaired with simulated corrosion damage A section of the pipe material was also taken from each pipe diameter to determine the actual material strengths. Table 20 contains the resultant tensile and yield strengths of the two pipes. The tensile strength was then used to determine the corresponding burst pressures found in Table 21.
Specimen Width Thickness
Ultimate Strength
0.2% Yield Strength
Pipe Diameter mm (in.) mm (in) mm (in) MPa (ksi) MPa (ksi)
Elongation%
Reductionof Area
%
508.0 (20) 38.1 (1.5) 6.6 (0.26) 601.4 (87.2) 462.8 (67.1) 29.9 58.5
558.8 (22) 38.1 (1.5) 7.87 (0.31) 384.8 (55.8) 238.6 (34.6) 40.3 65.0 Table 20 - Tensile and Yield Strengths of the 508 mm (20 in.) and 558.8 mm (22 in.) Pipe Table 21 is a summary of the results of all the RSTRENG calculations and the calculated burst pressure from 100%SMYS and the tensile strength of the pipe.

144 41633R42.pdf
Pipe Outside Diameter 558.80 mm (22 in.) 508 mm (20 in.)
Wall Thickness 7.92 mm (0.312 in.) 6.35 mm (0.250 in.) Pipe Material API 5L-Grade B API 5L-X52 Type of Damage Simulated Corrosion Defect Simulated Corrosion Defect Damage Length 190.50 mm (7.5 in.) 127.00 mm (5 in.)
Damage Depth 3.96 mm (0.156 in.) 3.45 mm (0.136 in.) Pressure corresponding to 100% SMYS 6.84 MPa (992 psi) 8.96 MPa (1,300 psi)
Damage as % of wall thickness 50% 54%
RSTRENG-predicted burst pressure compared to pressure at 100% SMYS
75% 75%
Table 21 - Calculated Values for Simulated Damage for 508 mm (20 in.) and 558.8 mm (22 in.) Pipe Figure 136 through Figure 139 contain photos of the hydrostatic test specimens without repairs.
Figure 136 - Hydrostatic Burst Specimen of 508.0 mm (20 in.) in Virgin Pipe

145 41633R42.pdf
Figure 137 - Hydrostatic Burst Specimen of 508.0 mm (20 in.) with Un-Repaired Damage
Figure 138 - Hydrostatic Burst Specimen of 558.8 mm (22 in.) Pipe in Virgin Pipe

146 41633R42.pdf
Figure 139 - Hydrostatic Burst Specimen of 558.8 mm (22 in.) With Un-Repaired Damage Table 22 contains the predicted and actual burst pressures for all six hydrostatic tests. Measured burst pressure for pipe with un-repaired corrosion damage was 85% of the measured burst pressure for pipe in the virgin condition in 558.80 mm (22 in.) diameter pipe and 91% for 508 mm (20 in.) pipe. The failure pressure for the pipe with the liner (design 1) was again only marginally greater than the damaged pipe without the liner (i.e., 15.13 MPa (2,194 psi) vs. 14.57 MPa (2,112 psi), indicating that the carbon fiber-reinforced liner was only marginally effective at restoring the pressure containing capabilities of the pipes. The increase in burst pressure achieved by installing a liner in the pipe section is 4%. In spite of this, these results are viewed as being as encouraging as, or even more encouraging than, the initial trials carried out using glass fiber reinforced liners. The later results indicate that, not only do fiber reinforced composite liners have the potential to increase the burst pressure of pipe sections with external damage, they do so for pipe diameters that are representative those used in the gas transmission industry. Carbon fiber based liners are viewed as more promising than glass fiber based liners because of the potential for more closely matching the mechanical properties of steel.

147 41633R42.pdf
Predicted Burst Pressure
Actual Burst Pressure Pipe Diameter Pipe Condition
(MPa) (psi) (MPa) (psi)
Virgin 10.91 1,583 16.03 2,325
Simulated Damage Un-Repaired 6.72 974 14.57 2,112
508.0 mm (20 in.) Simulated Damage Repaired with Carbon Fiber-Reinforced Liner
(Design 1)
- - 15.13 2,194
Virgin 15.03 2,180 12.70 1,842
Simulated Damage Un-Repaired 5.15 747 10.78 1,563 558.8 mm (22 in.)
Simulated Damage Repaired with Weld
Deposition - - 9.68 1,404
Table 22 - Summary of Predicted vs. Actual Hydrostatic Burst Pressure Values Not surprisingly, the specimens of virgin pipe material had the highest hydrostatic burst pressures. The most surprising characteristic about the hydrostatic burst test results is that the failure pressures for the pipe sections with un-repaired damage are significantly greater than the RSTRENG predicted burst pressures. The areas of damage were designed using RSTRENG to produce a 25% reduction in predicted burst pressure (i.e., designed to require repair according to RSTRENG). For the 508.0 mm (20 in.) diameter pipe, the reduction in burst pressure that resulted from introducing the simulated corrosion damage, which was 127 mm (5 in.) long and more than 50% of the pipe wall thickness deep, is only 9% as opposed to the predicted 25%. The pipe section with simulated corrosion damage repaired with a carbon fiber-reinforced liner had a burst pressure that was greater than the pipe section with un-repaired damage. By contrast, the pipe section with simulated corrosion damage repaired with weld deposition had a burst pressure that was less than the pipe section with un-repaired damage. Distortion caused by welding residual stresses may have contributed to the lower burst pressure. Of the two potential pipeline repair technologies evaluated this reporting period, carbon fiber-reinforced liner repair was generally more effective at restoring the pressure containing capability of a pipeline. The results of these experiments illustrate that RSTRENG predictions tend to be conservative.(9) This conservatism will be taken into account in future experiments by designing and introducing areas of damage that have significantly larger predicted reductions in burst pressure (e.g., 50% as opposed to 25%). This will allow the ability of repairs to restore pressure containing capability to be better demonstrated.

148 41633R42.pdf
This subtask is complete. Subtask 4.5 - Review and Evaluation of Internal Pipeline Repair Technologies Report During the 24 month reporting period, EWI submitted the Task 4.5 - Evaluation of Potential Repair Methods report that contained a detailed analysis of the development trial results. Development of a comprehensive test plan for carbon fiber-reinforced liner repair is recommended for use in the field trial portion of this program as physical testing clearly indicated that this process is the most promising technology evaluated to-date. This subtask is complete. Task 5.0 - Optimize and Validate Internal Repair Methods Subtask 5.1 - Develop Test Program A detailed test program (M14) was developed for fiber reinforced liner repair, the most promising potential repair method identified in the previous task (M13). The test program consists of a series of hydrostatic burst tests that compare performance of a full-sized pipe section with simulated corrosion in the repaired condition, a pipe section with simulated corrosion in the un-repaired condition, and a pipe section in the virgin condition. RSTRENG is also used to predict the burst pressure for virgin and un-repaired pipe material. Physical results and predictions are then used to analyze the performance of a particular repair providing a more comprehensive investigation of repair performance. This test program can be applied to the range of pipe sizes, grades, and vintages covered by this project, as well as, the range of damage types encountered in cross-country pipelines. Pipe coating type and the potential for damage (or healing) by repair methods that involve welding or heat application are not relevant as weld deposition repair is no longer being considered. This subtask is complete. Subtask 5.2 - Optimization of Internal Repair Methods Using the test program methodology developed in Subtask 5.1, various carbon fiber-reinforced liner configurations will be evaluated until the optimal design is achieved. Subtask 5.2 activities are in preparation for the final full-scale laboratory testing of the optimal design in Task 5.3. All significant data pertinent to each repair method will be recorded during development trials. During the 24 month reporting period, the first round of optimization and validation activities were completed. A 508 mm (20 in.) diameter pipe section with simulated corrosion damage

149 41633R42.pdf
was repaired with a carbon fiber-reinforced patch in a "pressure bandage" configuration (design 2) as shown in Figure 33. The "pressure bandage" patch was allowed to cure for approximately two weeks before installation. After the patch was installed in the pipe section, it was allowed to cure for another week before hydrostatic testing until failure. As in previous reporting periods, two 508 mm (20 in.) diameter pipe sections were hydrostatically tested until failure in the virgin condition (with no simulated damage) and in the un-repaired condition with simulated corrosion damage. RSTRENG was also used to predict burst pressures. Figure 140 shows the design 2 carbon fiber patch configuration after burst tested until failure. The inset pictures are close up views of failure locations.

150 41633R42.pdf
Figure 140 - Carbon Fiber Patch Design 2 with Failure Locations

151 41633R42.pdf
The pipe section with patch design 2 was sectioned in the circumferential direction. The pictures in Figure 141 and Figure 142 are cross sections taken from locations in the area of pipe wall metal loss (i.e., the machined groove on the OD). Figure 141 shows a full failure of the pipe and composite repair. Figure 142 shows a failure of the pipe and the disbondment between the ID of the pipe and the composite repair.
Figure 141 - Failure of Pipe and Composite Repair
Figure 142 - Disbondment Between Pipe and Patch 2 at Pipe Failure Site The resultant burst pressure for the pipe section repaired with fiber-reinforced liner design 2 was 12.25 MPa (1,777 psi) which is 9.3% greater than the pressure corresponding to 100% of the SMYS for the pipe material. This represents a 16% reduction in strength as compared to the virgin pipe performance and a 37% improvement over the performance of the un-repaired pipe with simulated damage. As expected, post mortem analysis of the composite patch material

152 41633R42.pdf
revealed that the ultimate failure of patch 2 was the result of interlaminar shear. Figure 142 shows that the failure was caused by interlaminar shear, which appears to have occurred after the steel reached the plastic range (i.e., after the steel's yield point was exceeded). For the virgin condition pipe with no simulated damage, the resultant burst pressure was 14.63 MPa (2,122 psi). For the un-repaired pipe section with simulated corrosion damage, the resultant burst pressure was 8.95 MPa (1,298 psi), which represents a 39% reduction in burst pressure as compared to the performance of the virgin pipe section. The burst pressure for the pipe repaired with the carbon fiber reinforced patch design 2 is 11%
higher than the RSTRENG predicted burst pressure for an un-repaired pipe. This result must
be viewed while taking into account the results of the additional testing that was performed on
virgin (i.e., un-damaged) pipe and on pipe with un-repaired simulated corrosion damage.
Table 23 contains the RSTRENG predicted and measured burst pressures for the pipe sections
tested during the 24 month reporting period.
Predicted Burst Pressure
Actual Burst Pressure Pipe Diameter Pipe Condition
(MPa) (psi) (MPa) (psi)
Virgin 10.91 1,583 14.63 2,122
Simulated Damage Un-Repaired 6.72 974 8.95 1,298
508 mm (20 in.) Simulated Damage
Repaired with Carbon Fiber-Reinforced Liner
- - 12.25 1,777
Table 23 - Predicted vs. Actual Hydrostatic Burst Pressure Values for Patch Design 2 During the 30 month reporting period, additional engineering analysis was employed optimize the requirements for carbon fiber-based repair system. Patch material was tested to determine tensile strength, modulus of elasticity, and the interlaminar shear value and two additional series of burst tests were conducted. The first burst test was a repeat of the tests conducted in the 24 month reporting period with a thinner patch (design 3). The second burst testing involved a pipe section with long, shallow damage repaired with patch design 3. Composite design requirements are based on strength, modulus, and thickness. Composite performance is based on interlaminar shear (resin failure between the layers predominates), modulus (bending under load generates interlaminar shear), and thickness (to provide adequate stiffness to operate the load point below the interlaminar shear value). For patch material testing, three types of composite structures were produced for this program. All were made with

153 41633R42.pdf
carbon fiber cloth and vinylester (VE) resin. The cloth had no special treatment to compatibilize it with the VE resin. The carbon fiber fabric had a nominal weight of 10 oz/yd2 with 6K tows. Three composite layup structures were designed to evaluate the mechanical properties of the material:
• Quasi-isotropic layup (with alternating layers of 0, 90 and ± 45 with extra 0, 90 near the thickness-center)
• 0, 90 only layup
• Uniaxial 0 only layup The thicknesses of the quasi-isotropic and the 0, 90 panels were 11.43 mm (0.45 in.). The thickness of the uniaxial panel was 8.89 mm (0.35 in.). For the first two, fiberglass close-out layers were included on the “steel side” as a proposed corrosion barrier at the steel/carbon fiber interface and as the top layer (bag side). The uniaxial panel had no fiberglass. The carbon-glass constructions produce ~40% w/w carbon fiber, with a density of 1.47-1.51 g/cc. The uniaxial panel contains >70% carbon fiber w/w, so a higher tensile modulus is anticipated (its density was measured at 1.44 g/cc, reflecting mostly the absence of fiberglass). The panels were produced using a combined hand layup-vacuum bagging technique. Interlaminar shear (ILS) samples were taken from a separate panel in which a portion of one middle layer was omitted and replaced with a Teflon release sheet. This produced a molded-in defect notch for three-point bending tests (see Figure 143). The ILS panel was built with 0, 90 layers only.

154 41633R42.pdf
Figure 143 - Three-Point Bending Test Set Up for ILS Testing The first two panels were tested during the 30 month reporting period. The results for the two tested systems are shown in Table 24 for both normal and postcured samples (the averages are shown graphically in Figure 144). Postcuring produced no significant mechanical advantage over the ambient cure. The most striking differences were the significant increases in tensile strength and modulus for the 0, 90 construction in comparison with the quasi-isotropic construction. The replacement of every other layer with a 0, 90 resulted in a 50% improvement in tensile strength from 367.5 MPa (53.3 ksi) to 581.2 MPa (84.3 ksi) and a 70% improvement in modulus from 36,376 MPa (5,276 ksi) to 64,052 MPa (9,290 ksi). The uniaxial tape sample was subsequently built to see if the trend in tensile and modulus performance would continue upward once all the fibers were operating in a tensile mode. Interlaminar shear (ILS) was not affected by panel layup architecture. Based on the dimensions and the flexural failure load, the ILS value appears to be about 10.3 MPa (1,500 psi). This is lower than desired, but not unexpected given the lack of fiber treatment for resin compatibility and the notoriously low toughness for VE resins. Notice also the flexural modulus ranges from 586,578 MPa (85,076 ksi) to 636,241 MPa (92,279 ksi), meaning the panels are somewhat forgiving in flex. That may be advantageous for a pipe repair application.

155 41633R42.pdf
Ultimate (ksi)
0.2% Yield (ksi)
Modulus (ksi)
Failure Load (lb)
Modulus (psi)
T1 56.7 44.5 6036T2 54.1 41.1 5841T3 55.2 42.5 5278T4 47.0 46.4 3948
Average 53.3 43.6 5276
T11 85.6 68.1 9673T12 83.6 65.3 9620T13 84.2 68.4 8748T14 83.8 60.1 9118
Average 84.3 65.5 9290
ILS1 410 91377ILS2 400 93688ILS3 385 92463ILS4 404 91586
Average 400 92279
T5 58.6 50.0 6099T6 54.6 46.0 5683T7 61.2 46.4 7292T8 50.6 44.5 4628
Average 56.3 46.7 5926
T15 81.7 63.9 8803T16 86.9 73.3 8473T18 90.5 74.0 9567T17 87.8 9724
Average 86.7 70.4 9142
ILS5 382 75906ILS6 442 91990ILS7 411 85773ILS8 446 86635
Average 420 85076
Pos
tcur
edMechanical Properties for Carbon-Vinylester Composite
Sample
Not
Pos
tcur
ed
Quasi - Iso
0, 90
0, 90
Quasi - Iso
0, 90
0, 90
Tensile Flexural (Three Point)
Table 24 - Tensile and Interlaminar Shear Properties for Composite Panels

156 41633R42.pdf
53.3
43.6
5.28
56.3
46.7
5.93
84.3
65.5
9.30
86.7
70.4
9.10
0.0
10.0
20.0
30.0
40.0
50.0
60.0
70.0
80.0
90.0
100.0
Tensile(ksi) Yield(ksi) Modulus(msi)
Composite Type and Test
Tens
ile (k
si) a
nd M
odul
us (m
si)
Quasi-Norm Quasi - Postcured O_90 - Norm 0_90 - Postcured
Figure 144 - Average Tensile and Modulus Properties for Composite Panels The unaxial patch will be mechanically tested during the next reporting period. The first series of burst testing performed during the 30 month reporting period was a repeat of the tests conducted in the 24 month reporting period with a thinner patch (design 3). Two 508 mm (20 in.) diameter by 6.35 mm (0.25 in.) wall, API 5L-X52 pipe section were prepared with simulated corrosion damage that was 127 mm (5.0 in.) long by 3.45 mm (0.136 in.) deep, representing a 25% reduction in burst strength. One pipe section was repaired with patch design 3 which was fabricated in the same manner as before with all 0, 90 construction (as shown in Figure 40). Patch 3 was 254 mm (10 in.) long by 711.2 mm (28 in.) wide by 7.62 mm (0.3 in.) thick and consisted of 18 layers (layers 1 and 18 were glass woven roving). Calculated fiber volume was 50% - 55%. For comparison purposes, one pipe section with simulated corrosion was burst tested in the un-repaired condition, one pipe section in the virgin condition was burst tested, and one repaired pipe section with simulated damage was burst tested. As shown in Table 25, the resultant burst pressure for the pipe section repaired with fiber-reinforced liner design 3 was 11.93 MPa (1,730 psi) which is 33% greater than the pressure

157 41633R42.pdf
corresponding to 100% of the SMYS for the pipe material. This represents a 19% reduction in strength as compared to the virgin pipe performance and a 33% improvement over the performance of the un-repaired pipe with simulated damage.
Predicted Burst Pressure
Actual Burst Pressure Pipe Diameter Pipe Condition
(MPa) (psi) (MPa) (psi)
Virgin 8.96 1,300 14.63 2,122
Simulated Damage Un-Repaired 6.72 975 8.95 1,298 508 mm (20 in.)
API 5L-X52 Simulated Damage
Repaired with Carbon Fiber-Reinforced Liner
- - 11.93 1,730
Table 25 - Predicted vs. Actual Hydrostatic Burst Pressure Values for Patch Design 3 As expected, post mortem analysis of the composite patch material revealed that the ultimate failure of patch 3 was the result of interlaminar shear. Figure 145 shows the failure of patch 3 from the OD of the pipe section. The patch failure was caused by interlaminar shear, which appears to have occurred after the steel reached the plastic range (i.e., after the steel's yield point was exceeded). These results are very similar to those of the thicker patch (design 2) that was tested during the 24 month reporting period.
Figure 145 - Failure of Pipe Section with Patch Design 3 The second series of burst testing conducted during the 30 month reporting period involved a pipe section with long, shallow damage. Two 508 mm (20 in.) diameter by 6.35 mm (0.25 in.)

158 41633R42.pdf
thick API 5L-X52 pipe sections were prepared with simulated corrosion damage that was 381 mm (15 in.) long by 2.54 mm (0.1 in.) deep, representing a 25% reduction in burst strength. One pipe section was repaired with patch design 3 (as shown in Figure 40) which was fabricated in the same manner as before with all 0, 90 construction. The patch was 254 mm (10 in.) long by 711.2 mm (28 in.) wide by 7.62 mm (0.3 in.) thick and consisted of 18 layers (layers 1 and 18 were glass woven roving). For comparison purposes, one pipe section with simulated corrosion was burst tested in the un-repaired condition, one pipe section in the virgin condition was burst tested, and one repaired pipe section with simulated damage was burst tested. This series of tests were conducted to evaluate the ability of the carbon fiber-reinforced composite repair to overcome damage that exceeds the length for which hoop stress can redistribute itself around the ends of the damage. This length is defined in Equation 11 in terms of pipe diameter d and wall thicknesses t.
21
20dtL = Equation 11 - Length at Which Hoop Stress Can No Longer Redistribute Itself Around the
Ends of Damage For a 508 mm (20 in.) diameter pipe with a 6.35 mm (0.25 in.) wall thickness, L is equal to 254 mm (10 in.). In order to perform an experiment to that evaluates the ability of carbon fiber-reinforced repair system to restore the pressure-containing ability of the pipe with a long-shallow defect, an area of simulated damage in excess of a 508 mm (20 in.) in length is required. A simulated defect of 381 mm (15 in.) long by 2.54 mm (0.1 in.) deep was therefore introduced into the pipe sections for this investigation. As shown in Table 26, the resultant burst pressure for the pipe section repaired with fiber-reinforced liner design 3 with long-shallow damage was 10.26 MPa (1,488 psi) which is 14% greater than the pressure corresponding to 100% of the SMYS for the pipe material. This represents a 30% reduction in strength as compared to the virgin pipe performance and a 1% improvement over the performance of the un-repaired pipe with simulated damage.

159 41633R42.pdf
Predicted Burst Pressure
Actual Burst Pressure Pipe Diameter Pipe Condition
(MPa) (psi) (MPa) (psi)
Virgin 8.96 1,300 14.63 2,122
Simulated Damage Un-Repaired 6.72 975 10.16 1,473 508 mm (20 in.)
API 5L-X52 Simulated Damage
Repaired with Carbon Fiber-Reinforced Liner
- - 10.26 1,488
Table 26 - Predicted vs. Actual Hydrostatic Burst Pressure Values for a Patch Design 3
Repair of Long-Shallow Damage Figure 146 shows the OD of the pipe section with long-shallow simulated damage repaired with patch design 3. Post mortem analysis is on going.
Figure 146 - Patch Design 3 Repair of Long-Shallow Damage after Burst Test A summary description of all burst test series conducted to date is shown in Table 27. Test
Series Repair Material
Damage Type
1 RolaTube - Glass Fiber-Reinforced Composite Long-Shallow 2 RolaTube - Glass Fiber-Reinforced Composite Short-Deep 3 Carbon Fiber-Reinforced Composite - Design 1 Wide-Shallow 4 Weld Repair Wide-Shallow 5 Higher Modulus Carbon Fiber-Reinforced Composite - Design 2 Wide-Shallow 6 Higher Modulus Carbon Fiber-Reinforced Composite - Design 3 Wide-Shallow 7 Higher Modulus Carbon Fiber-Reinforced Composite - Design 3 Long-Shallow
Table 27 - Test Series Conducted To Date

160 41633R42.pdf
For each series of burst tests in Table 27, the percentage of performance improvement for each series of repaired pipe vs. the un-repaired pipe is plotted in Figure 147.
1%
7%
4%
-10%
37%
33%
1%
-20%
-10%
0%
10%
20%
30%
40%
1 2 3 4 5 6 7
Test Series
Figure 147 - Percent Improvement of Burst Test Results for Repaired vs. Un-Repaired
Pipe Sections During the next reporting period, post mortem analysis of patch design 3 performance on the long-shallow defect will be completed. Optimization and validation activities will continue for fiber-reinforced liner repair. At the request of NETL, EWI will also prepare and test a steel patch adhesively bonded to the ID of a pipe section with external damage. Subtask 5.3 - Full-Scale Laboratory Validation Trials Elliptical test heads with high-pressure fittings will be welded to the pipe sections and the vessels will be pressurized to failure (the same technique developed in Task 4.0). Full-scale laboratory validation trials will consist of a series of hydrostatic burst tests that compare

161 41633R42.pdf
performance of a full-sized pipe sections with simulated corrosion in the repaired condition, a pipe section with simulated corrosion in the un-repaired condition, and a pipe section in the virgin condition. RSTRENG is also used to predict the burst pressure for virgin and un-repaired pipe. A post-mortem analysis (including metallography) will be conducted on all evaluated pipe sections. Physical results and predictions are then used to analyze the performance of a particular repair providing a more comprehensive investigation of repair performance. Work on this subtask will begin once the optimal carbon fiber-reinforced liner repair is determined. Subtask 5.4 - Development of Preliminary Post Repair Testing Protocol When the program was originally proposed, the project team was fairly certain that weld deposition repair would be selected as the most promising repair technology. Given this assumption, Subtask 5.4 was Perform Field Trials on Abandoned Pipeline for several reasons. An abandoned pipeline is the place to study the issue of sending electrical power over distances in excess of 304.8 m (1,000 ft.). An abandoned pipeline is also the best place to study the affect of welding heat input on extant pipeline coatings. Finally, a buried pipeline provides an excellent opportunity to study the affects of soil induced cooling rates on resultant weld microstructure and the parameters necessary to produce a weld with an acceptable quality level. Given the fact that carbon fiber-reinforced composite repair was selected for further development (not weld deposition repair), performing field trails on an abandoned pipeline was no longer a judicious use of project funding, since carbon fiber repairs are deployed with a manual adhesive process that does not require the long distance delivery of electrical power, will not affect pipeline coatings, and will not be affected by the soil surrounding the pipeline. This field trial subtask would be viable if testing a prototype tooling system that installs the carbon fiber-reinforced liner repair; however, since a manual adhesive process is being used, this repair can be demonstrated in the EWI laboratories using the same methods required by a field trial. On March 14, 2005 the Project Management Plan was modified and this subtask now entails the development of a detailed preliminary protocol to verify the effectiveness of repair following application (the Cooperative Agreement was subsequently amended on April 7, 2005). The protocol will define a proposed method for non-destructively determining success or failure of the pipeline repair and should address any potential problems, which may need to be addressed in repair verification testing. Two types of defects are anticipated in a fiber-reinforced liner repair: areas of disbond between the pipe and the adhesive; and defects between the patch and the adhesive. A test repair patch with anticipated defect types and sizes was built into the adhesive bond to make a calibration block for the evaluation of each candidate nondestructive evaluation (NDE) method.

162 41633R42.pdf
The next step in developing the protocol is to identify the candidate NDE processes with the highest probability of accuracy and repeatability for the application. Due to the nature of the repair, NDE must be applied from the ID not the OD. The candidate technologies with the most promise are ultrasonics (UT) and electromagnetics. The UT methods of interest use specialized pulse-echo and phased array UT equipment to map corrosion damage in tube steel wall and to detect interface defects. The feasibility study with UT will involve laboratory trials using low frequency with a variety of probes: single focused probes; dual probes; single linear and dual linear phased array probes; and single matrix and dual matrix phased array probes. The electromagnetic technology of interest is Eddy Current (EC) which is currently used to map corrosion damage in tube steel wall. The feasibility study with EC will involve: the design of a high-power low-frequency probe through computer modeling and simulation; probe and accessories manufacture; and laboratory trials on the calibrated repair patch with known defects. Current UT and EC research must also be reviewed to identify potential problems which may need to be addressed in repair verification testing. The ability to capture the defects in the repair sample will then be evaluated for the most promising candidate NDE inspection methods. Work on this subtask is on going. Subtask 5.5 - Prepare Full-Scale Internal Pipeline Repair Validation Test Report The results of the verification trials will be analyzed in detail. The capabilities and/or limitations of each evaluated repair method will be determined. A report (M14) pertaining to the work carried out in this phase of the project and recommendations for the next phase of the project will be produced. Work for this subtask is on going. Task 6.0 - Develop Functional Specification During the twelve-month reporting period, preliminary system specifications were created for Subtask 3.2 - Define Target Specifications for an Internal Pipeline Repair System based on the data contained in the Subtask 3.3 - Summary of Industry Needs for Internal Pipeline Repair Report. During this reporting period, there was no activity on this task and no activity is planned for the next reporting period.

163 41633R42.pdf
Task 7.0 - Demonstration of Repair Technology During the 30 month reporting period, EWI proposed the following format for the end of project technology demonstration:
• Present project overview and major findings
• PG&E technician to manually install a carbon fiber-reinforced patch in a pipe section with simulated damage
• An identically repaired pipe section will be hydrostatically tested until rupture
• Failed pipe section to be inspected by participants
• Other tested pipe sections will be displayed for participant inspection NETL and EWI agreed that the demonstration testing will be conducted on a full-scale pipe assembly with damage sufficient to demonstrate the true effectiveness of the repair technology on representative pipeline damage. The NETL COR will be invited to witness demonstration testing which will also be video taped. Demonstration testing results will be compiled, analyzed and included as a portion of the test results in the final project report. The technology demonstration planned during the last six months of the project.

164 41633R42.pdf
5.0 - CONCLUSIONS The most common cause for repair of gas transmission pipelines is external, corrosion-caused loss of wall thickness(9). To prevent an area of corrosion damage from causing a pipeline to rupture, the area containing the corrosion damage must be reinforced. Other pipeline defects that commonly require repair include internal corrosion, original construction flaws, service induced cracking, and mechanical damage. Defects oriented in the longitudinal direction have a tendency to fail from hoop stress (pressure loading) and must be reinforced in the circumferential direction. Defects oriented in the circumferential direction have a tendency to fail from axial stresses (due to pipeline settlement, etc.) and must be reinforced in the longitudinal direction. Full-encirclement steel repair sleeves resist hoop stress and, if the ends are welded to the pipeline, can also resist axial stresses. Technology Status Assessment The Task 2.0 - Technology Status Assessment indicates that the most commonly used method for repair of gas transmission pipelines is the full-encirclement steel repair sleeve. This and other repair methods commonly applied from the outside of the pipeline are typically executed with the pipeline in-service. While in-service application would be desirable for internal repair, many of the repair methods that are applicable to the inside of the pipeline require that the pipeline be taken out-of-service. Extensive high risk research and development would be required to make these repair processes suitable for in-service natural gas pipeline application. Most of the repair methods that are commonly applied to the inside of other types of pipelines, which typically operate at low pressure, are done so to only restore leak tightness. These repair methods would also require extensive research and development in order for them to have the ability to restore the strength of a gas transmission pipeline. Given the budget and time restraints of this program, efforts will remain focused on evaluating internal repair technologies for application while the pipeline is out-of-service. Survey of Industry Needs for Internal Pipeline Repair The responses to the operator needs survey produced the following principal conclusions:
1. Use of internal weld repair is most attractive for river crossings, under other bodies of water such as lakes and swamps, in difficult soil conditions, under highways and in congested intersections, and under railway crossings. All these areas tend to be very difficult and very costly, if, and where conventional excavated repairs may be currently used.

165 41633R42.pdf
2. Internal pipe repair offers a strong potential advantage to the high cost of HDD when a new bore must be created to solve a leak or other problem in a water/river crossing.
3. Typical travel distances can be divided into three distinct groups: up to 305 m (1,000 ft.); between 305 m (1,000 ft.) and 610 m (2,000 ft.); and beyond 914 m (3,000 ft.). All three groups require pig-based systems. A despooled umbilical system would suffice for the first two groups which represents 81% of survey respondents. The third group would require an onboard self-contained power unit for propulsion and welding/liner repair energy needs.
4. Pipe diameter sizes range from 50.8 mm (2 in.) through 1,219.2 mm (48 in.). The most common size range for 80% to 90% of operators surveyed is 508 mm (20 in.) to 762 mm (30 in.), with 95% using 558.8 mm (22 in.) pipe.
5. Based on the frequency of expected use by many operators, the issue of acceptable system cost for a deployable solution could best be tackled through selling such technology as an additional service through existing "smart pig" vendors/operators.
6. There has been almost no use of internal repair to date and the concept is currently fairly alien to pipeline operators. Even the potential for internal repair of external damage using such a system needs further promotion/education within the industry as a whole.
7. Most operators were open to the economic potential an internal repair system may offer in terms of reducing interruption to product flow, particularly if they did not have looped lines.
8. The top three items of concern for selecting a repair method were cost, availability of the repair method (time/cost), and the position of the defect(s).
9. A wide range of pipe coatings were cited as being deployed in the field. The top three mentioned were FBE, coal tar, and concrete/POWERCRETE®.
10. The majority of operators considered the ability for the pipeline to remain in service while the repair was conducted to be very important.
11. RT is by far the most accepted method for pipeline NDE. UT was the second most common process cited.
To summarize, the important characteristics of a useful internal pipeline repair system would include the ability to operate at a long range from the pipe entry point, the agility to transverse bends and miters, and the ability to make a permanent repair that is subsequently inspectable via pigging. Potential Repair Methods Figure 95 is a bar chart that contains the total weighted scores for each potential repair technology that was considered. It is apparent that, of the three broad categories of repair (welding, liners, and surfacing), repair methods that involve welding are generally the most

166 41633R42.pdf
feasible. Of the various welding processes, GMAW is the preferred method. The primary factors that make GMAW the most feasible are process technical feasibility and robustness, and industry familiarity with the process. The second most feasible of the three broad categories is repair methods that involve internal liners. Of these, fiber-reinforced composite liners are the most promising. The primary factors that make fiber-reinforced composite liners the most feasible are the ability to match the strength of the pipe material and negotiate bends, and their inherent corrosion resistance. The advantage of using a fiber-reinforced composite liner is somewhat offset by its material cost which is anticipated to be comparatively higher than that of a steel coil liner. Evaluation of Repair Methods Fiber-reinforced composite liner and weld metal deposition repair technologies were evaluated by this program. Both are used to some extent for other applications and could be further developed for internal, local, structural repair of gas transmission pipelines. Fiber-Reinforced Liner Repairs Fiber-reinforced liner repair is contemplated most often for external corrosion that exceeds the allowable limit sizes, corrosion on the external surface may continue after the emplacement of the liner. Engineering analysis determined that a high fiber modulus and a high shear strength of the matrix (above that for many thermoplastics) is required for composite liners to resist the types of shear stresses that can occur when external corrosion continues to the point where only the liner carries the stresses from the internal pressure in the pipe. Realistic combinations of composite material and thickness were analytically determined for use in a carbon fiber-reinforced liner system. Failure pressures for pipe sections repaired with a circumferential glass fiber-reinforced composite liners were only marginally greater than that of pipe sections without liners, indicating that the glass fiber-reinforced liners are generally ineffective at restoring the pressure containing capabilities of pipelines. Failure pressures for larger diameter pipe repaired with a semi-circular patch of carbon fiber-reinforced composite lines were greater than that of a pipe section with un-repaired simulated damage without a liner, indicating that carbon fiber-reinforced liners have the potential to increase the burst pressure of pipe sections with external damage Carbon fiber based liners are viewed as more promising than glass fiber based liners because of the potential for more closely matching the mechanical properties of steel.

167 41633R42.pdf
Weld Deposition Repairs Arc welding processes offer a repair method that can be applied from the inside of a gas transmission pipeline. There are several arc welding processes that can be operated remotely. Based on the survey and assessment of candidate arc welding processes, the GMAW process was the most likely choice for this application. It offers a good combination of simplicity, high productivity, robustness, and quality that are required for this welding repair application. Arc welding processes are routinely used to externally repair pipelines. However, repair from the inside offers new challenges for process control since welding would need to be performed remotely. In addition, since the intent is to leave the pipeline in the ground, there are several variables that will affect the welding process and quality. Soil conditions have the potential to influence heat removal during welding thereby altering the fusion characteristics, welding cooling rate, and resultant mechanical properties. The effects of welding on the external coating used to protect against corrosion would also need thorough evaluation to assure future pipeline coating integrity. Finally, if welding is performed in-service, the pressure and flow rate of the gas would have a strong effect on the equipment design of the welding process. New process equipment technology would be required to shield the welding process from methane contamination and to cope with higher gas pressures in-service. The development of an equipment specification defining all the functional requirements for an internal welding repair system would require significant effort. In addition to the previously stated characteristics of a useful internal pipeline repair system, a successful internal welding repair system would need a machining capability to prepare the weld joint, a grinding system for cleaning and preparation, in addition to a robust, high deposition welding process. Although many of these features are incorporated in existing pigging systems, there is no single system that possesses all the required characteristics. Further work is required to develop a system with all of these features. Specimens of virgin pipe material had the highest hydrostatic burst pressures. The pipe section with simulated corrosion damage repaired with a carbon fiber-reinforced liner had the next highest burst pressure. The specimens of un-repaired pipe with simulated corrosion damage had the third highest burst pressures. The pipe section with simulated corrosion damage repaired with weld deposition exhibited the lowest burst pressure.

168 41633R42.pdf
Most Promising Repair Technology Physical testing indicates that carbon fiber-reinforced liner repair is the most promising technology evaluated to-date. The first round of optimization and validation activities for carbon-fiber repairs are complete. In lieu of a field installation on an abandoned pipeline, a preliminary nondestructive testing protocol is being developed to determine the success or failure of the fiber-reinforced liner pipeline repairs. Optimization and validation activities should continue.

169 41633R42.pdf
6.0 - REFERENCES (1) Kiefner, J. F. and Vieth, P. H., "A Modified Criterion for Evaluating the Remaining Strength
of Corroded Pipe" Final Report to A.G.A. Pipeline Corrosion Supervisory Committee, Project PR-3-805, Battelle, Columbus, OH, December 1989.
(2) Gordon, J. R., Bruce, W. A., and Porter, N. C., “Internal Repair of Pipelines – Research
Management Plan,” Report to National Energy Technology Laboratory, U.S. Department of Energy, DOE Award No.: DE-FC26-02NT41633, Edison Welding Institute, October 2002.
(3) Gordon, J. R., Bruce, W. A., Sullivan, M., and Neary, C. M., “Internal Repair of Pipelines –
Technology Status Assessment,” Report to National Energy Technology Laboratory, U.S. Department of Energy, DOE Award No.: DE-FC26-02NT41633, Edison Welding Institute and Pacific Gas & Electric, November 2002.
(4) U. S. Department of Transportation, Research and Special Programs Administration,
"§192.150 Passage of internal inspection devices," DOT 49 CFR Part 192 - Transportation of Natural & Other Gas by Pipeline: Minimum Safety Standards, July 1998.
(5) U. S. Department of Transportation, Research and Special Programs Administration,
Office of Pipeline Safety, "Pipeline Failure Causes," http://primis.rspa.dot.gov/pipelineInfo/stat_causes.htm (Washington, DC: U. S. Department of Transportation, Research and Special Programs Administration, Office of Pipeline Safety, 17 June 2004)
(6) Wang, Y.-Y., and Bruce, W. A., “Examination of External Weld Deposition Repair for
Internal Wall Loss,” Final Report for EWI Project No. 07723CAP to PRC International, Contract No PR-185-9633, March 1998.
(7) Bruce, W. A., “Welding onto In-Service Thin Wall Pipelines,” Final Report for EWI Project
No. 41732CAP to PRC International, Contract No PR-185-9908, July 2000. (8) Kiefner, J. F., Barnes, C. R., Gertler, R. C., Fischer, R. D., and Mishler, H. W.,
“Experimental Verification of Hot Tap Welding Thermal Analysis. Final Report - Phase II - Volume 2, Liquid Propane Experiments,” Repair and Hot Tap Welding Group, Battelle Columbus Laboratories, May 1983.
(9) Eiber, R. J., Bubenik, T. A., and Leis, B. N., "Pipeline Failure Mechanisms and
Characteristics of the Resulting Defects," Eighth Symposium on Line Pipe Research, Paper No. 7 (Houston, TX: American Gas Association, 1993).

170 41633R42.pdf
7.0 - BIBLIOGRAPHY Bruce, W. A., “Welding onto In-Service Thin Wall Pipelines,” Final Report for EWI Project No.
41732CAP to PRC International, Contract No PR-185-9908, July 2000. This report discusses special welding difficulties and the extra care required to ensure safe operating procedures and sound welds due to repairs and modifications to in-service, thin walled pipelines.
Eiber, R. J., Bubenik, T. A., and Leis, B. N., "Pipeline Failure Mechanisms and Characteristics of
the Resulting Defects," Eighth Symposium on Line Pipe Research, Paper No. 7 (Houston, TX: American Gas Association, 1993). This report discusses four broad categories of pipeline failure mechanisms: outside forces, environmentally induced defects, manufacturing/materials defects, and operator error or miscellaneous defects.
Gordon, J. R., Bruce, W. A., and Porter, N. C., “Internal Repair of Pipelines – Research
Management Plan,” Report to National Energy Technology Laboratory, U.S. Department of Energy, DOE Award No.: DE-FC26-02NT41633, Edison Welding Institute, October 2002. This plan contains a concise summary of the technical objectives and approach for each task. The document also contain detailed schedules and planned expenditures for each task and all major milestones and decision points for the two year project duration.
U. S. Department of Transportation, Research and Special Programs Administration. "§192.150
Passage of internal inspection devices." DOT 49 CFR Part 192 - Transportation of Natural & Other Gas by Pipeline: Minimum Safety Standards. Amdt. 192-72, 59 FR 17281, Apr 12, 1994, as amended by Amdt. 192-85, 63 FR 37502, July 13, 1998. This code describes minimum safety requirements for pipeline facilities and the transportation of gas, including pipeline facilities and the transportation of gas within the limits of the outer continental shelf as that term is defined in the Outer Continental Shelf Lands Act (43 U.S.C. 1331).
U. S. Department of Transportation, Research and Special Programs Administration, Office of
Pipeline Safety, "Pipeline Failure Causes," http://primis.rspa.dot.gov/pipelineInfo/stat_causes.htm (Washington, DC: U. S. Department of Transportation, Research and Special Programs Administration, Office of Pipeline Safety, 17 June 2004). This web site provides comprehensive information about the U.S. transportation pipeline infrastructure. It is developed and maintained by the Office of Pipeline Safety (OPS) of the U.S. Department of Transportation's Research and Special Programs Administration.

171 41633R42.pdf
Kiefner, J. F. and Vieth, P. H., "A Modified Criterion for Evaluating the Remaining Strength of
Corroded Pipe" Final Report to A.G.A. Pipeline Corrosion Supervisory Committee, Project PR-3-805, Battelle, Columbus, OH, December 1989. This report documents a modified criterion for evaluating the corrosion level of a pipeline based on pipeline stress calculations (available as a PC program) as a less conservative alternative to ANSI / ASME B31G.
Gordon, J. R., Bruce, W. A., Sullivan, M., and Neary, C. M., “Internal Repair of Pipelines –
Technology Status Assessment,” Report to National Energy Technology Laboratory, U.S. Department of Energy, DOE Award No.: DE-FC26-02NT41633, Edison Welding Institute and Pacific Gas & Electric, November 2002. This report presents the status of existing pipeline repair technology that can be applied to the inside of gas transmission pipelines, and includes results from a comprehensive computerized literature search, together with information obtained from discussions with companies that are currently developing or evaluating novel pipeline repair methods.
Kiefner, J. F., Barnes, C. R., Gertler, R. C., Fischer, R. D., and Mishler, H. W., “Experimental
Verification of Hot Tap Welding Thermal Analysis. Final Report - Phase II - Volume 2, Liquid Propane Experiments,” Repair and Hot Tap Welding Group, Battelle Columbus Laboratories, May 1983. This report documents the verification of two thermal analysis models of hot tap welding on pressurized pipelines. With velocity input modified as shown, the models are capable of predicting maximum temperatures in the pipe wall especially at the inside surface and critical cooling rates in the heat-affected zones within the range of heat inputs that are practical for shielded metal arc welding.
Wang, Y.-Y., and Bruce, W. A., “Examination of External Weld Deposition Repair for Internal
Wall Loss,” Final Report for EWI Project No. 07723CAP to PRC International, Contract No PR-185-9633, March 1998. This report discusses the deposition of weld metal on the external surface of straight sections of pipe, field bends, tees and elbows as a potentially useful method for in-service repair of internal wall loss.

172 41633R42.pdf
8.0 - LIST OF ACRONYMS
ANSI American National Standards Institute API American Petroleum Institute
ASME American Society of Mechanical Engineers CAE Computer Aided Engineering CP Cathodic Protection
CRLP Composite Reinforced Line Pipe CSA Canadian Standards Association CV Constant Voltage
DOE Department of Energy DOT Department of Transportation ERW Electric Resistance Welded EWI Edison Welding Institute FBE Fusion Bonded Epoxy FEA Finite Element Analysis
FRCP Fiber-Reinforced Composite Pipe Glass-HDPE Glass-High Density Polyethylene
GMAW Gas Metal Arc Welding HDD Horizontal Direct Drilling
HDPE High Density Polyethylene ILI In-Line Inspection ILS Interlaminar Shear IR Infra-Red
MAOP Maximum Allowable Operating Pressure MEKP Methyl Ethyl Ketone Peroxide MOP Maximum Operating Pressure MPI Magnetic Particle Inspection NDE Nondestructive Examination NETL National Energy Technology Laboratory OD Outside Diameter PC Personal Computer PE Polyethylene
PG&E Pacific Gas & Electric Co. PRCI Pipeline Research Council International QA Quality Assurance QC Quality Control RT Radiographic Testing
SCC Stress Corrosion Cracking SMYS Specified Minimum Yield Strength
UT Ultrasonic Testing VARTM Vacuum Assisted Resin Transfer Molding

173 41633R42.pdf
9.0 - APPENDICES

A-1 41633R42.pdf
Appendix A: Industry Survey with Cover Letter

A-2
1250 Arthur E. Adams Drive • Columbus, Ohio 43221 • (614) 688-5000 • (614) 688-5001 • http://www.ewi.org/
April 11, 2003 <<<FIELD 1>>> EWI Project No. 46211GTH, “Internal Repair of Pipelines” Dear <<<FIELD 2>>>: Enclosed is a survey of operator experience and industry needs pertaining to internal repair of pipelines. EWI is conducting this survey as part of a project being funded by the National Energy Technology Laboratory. The objectives of this project are to evaluate, develop, demonstrate, and validate internal repair methods for pipelines. Please complete this survey at your earliest convenience.1 Your participation is greatly appreciated. If you have questions or require additional information, please contact me at 614-688-5059 or [email protected] Sincerely, William A. Bruce, P.E. Principal Engineer Materials section Enclosure
1 A copy of this survey was also sent to <<<FIELD 3>>> at your company. You may want to coordinate your response.

A-3 41633R42.pdf
April 11, 2003 EWI Project No. 46211GTH
Internal Repair of Pipelines Survey of Operator Experience
and Industry Needs
conducted for:
National Energy Technology Laboratory Morgantown, WV

A-4 41633R42.pdf
Project No. 46211GTH
on
Internal Repair of Pipelines – Survey of Operator Experience and Industry Needs
for
National Energy Technology Laboratory Morgantown, WV
April 11, 2003
EWI 1250 Arthur E. Adams Drive
Columbus, OH 43221

A-5 41633R42.pdf
Internal Repair of Pipelines – Survey of Operator Experience and Industry Needs
1.0 Introduction
A repair method that can be applied from the inside of a gas transmission pipeline (i.e., a trenchless repair) is an attractive alternative to conventional repair methods since the need to excavate the pipeline is precluded. This is particularly true for pipelines in environmentally sensitive and highly populated areas. Several repair methods that are commonly applied from the outside of the pipeline are, in theory, directly applicable from the inside. However, issues such as development of the required equipment to perform repairs remotely and mobilization of equipment through the pipeline to areas that require repair need to be addressed. Several additional repair methods that are commonly applied to other types of pipelines (gas distribution lines, water lines, etc.) also have potential applicability for internal repair of gas transmission pipelines. Many of these require further development to meet the requirements for repair of gas transmission pipelines. The objectives of a project being funded by the National Energy Technology Laboratory are to evaluate, develop, demonstrate, and validate internal repair methods for pipelines; develop a functional specification for an internal pipeline repair system; and prepare a recommended practice for internal repair of pipelines. One of the initial tasks of this project involves conducting a survey to determine the repair needs and performance requirements for internal pipeline repairs. The purpose of this survey is to better understand the needs of the natural gas transmission industry regarding internal repair.
2.0 Instructions Please respond as completely as possible to as many questions as possible. Space is also provided for any comments that you may have.
3.0 Survey Part 1 – Currently-Used Repair Methods
1. Has your company experienced degradation (corrosion, cracking, etc) of a transmission line?
If so, has your company replaced or repaired pipe because of degradation?
2. What specific repair methods would typically be used to repair different types of
degradation? Comments pertaining to currently-used repair methods –

A-6 41633R42.pdf
Part 2 – Use/Potential Use of Internal Repair
1. Has your company attempted repair of a transmission line from inside the pipe?
If so, describe the repair(s)
2. There are many factors that affect the decision to repair or replace pipe. What circumstances would favor performing a repair from inside the pipe using only one or two excavations rather than excavating the entire length of pipe?
3. If the technology were available to perform a repair from the inside, would your
company consider using the technology?
If so, for what application(s) – e.g., specific geographic locations and special situations?
4. At least one excavation will be required to insert the internal repair device into the
pipe. From this excavation, the repair device could be travel in each direction from the excavation. About how far from the insertion point should the repair device be able to travel?
What range of pipe diameters should the repair device be capable of operation in?
5. What potential obstructions such as elbows, bends, branches, and taps should the
repair system be able to negotiate? Comments pertaining to the use/potential use of internal repair – Part 3 – Need for In-Service Internal Repair
1. How important is the ability to perform a repair from the inside the pipe while the pipeline remains in service?
2. Would internal repair remain attractive if it was necessary to completely shut down
the pipeline (depressurized and evacuated) during the repair?
Depressurized but not evacuated?

A-7 41633R42.pdf
Out of service (no flow) but remain pressurized?
Comments pertaining to the need for in-service internal repair – Part 4 – Applicable Types of Damage
1. What types of external coatings would be found on transmission lines owned by your company?
2. If a repair involving welding from the inside was performed, how important is it to
preserve the integrity of the coating?
Is your cathodic protection system capable of compensating for relatively small breaches in the coating?
Comments pertaining to applicable types of damage – Part 5 – Operational and Performance requirements for Internal Repairs
1. Two general categories of repairs are being considered, (1) using weld metal to restore a surface and (2) installing an internal sleeve, either metallic or nonmetallic, to provide structural reinforcement of leak tightness. Is it important that the line remain inspectable by pigging after repair?
About how far could the repair protrude into the pipe before it would interfere with pigging?
2. What NDE would your utility require for a repair to an existing longitudinal or
circumferential weld?
Could a visual or magnetic particle examination be substituted for radiography in these special circumstances?

A-8 41633R42.pdf
What NDE would your utility require for a welded repair to base metal (e.g. corrosion pitting)?
3. Would the use of internal repair be attractive even if it were considered a temporary
repair Comments pertaining to operational and performance requirements for internal repairs – Part 6 - General Comments Please provide any general comments that you may have.

B-1 41633R42.pdf
Appendix B: Members of the Pipeline Research Council International

B-2 41633R42.pdf
Members of the Pipeline Research Council International Advantica Technologies Ltd BP Buckeye Pipe Line Company Chevron Texaco Pipeline Company CMS Panhandle Companies Colonial Pipeline Company Columbia Gas Transmission Co. ConocoPhillips Consumers Energy Dominion Transmission Duke Energy Gas Transmission El Paso Corporation Enbridge Pipelines Enron Transportation Services Corp. Explorer Pipeline Company ExxonMobil Pipeline Company Foothills Pipe Lines Ltd Gassco A.S. (Norway) Gasum Oy (Finland) Gaz de France Gulf South Pipeline Marathon Ashland Pipe Line LLC N.V. Nederlandse Gasunie/Gastransport Services (The Netherlands) National Fuel Gas Supply Corporation Saudi Aramco Sempra Energy Utilities/Southern California Gas Company Shell Pipeline Company LP Southern Natural Gas Company TEPPCO TransCanada PipeLines Limited Transco (UK) TransGas Williams Gas Pipeline

C-1 41633R42.pdf
Appendix C: List of Natural Gas Pipeline Operating Companies
(from http://www.ferc.gov/gas/pipecomp.htm)

C-2 41633R42.pdf
List of Natural Gas Pipeline Operating Companies
Algonquin Gas Transmission Company Algonquin LNG, Inc. ANR Pipeline Company ANR Storage Company Black Marlin Pipeline Company Blue Lake Gas Storage Company Canyon Creek Compression Company Carnegie Interstate Pipeline Company Chandeleur Pipe Line Company Colorado Interstate Gas Company Columbia Gas Transmission Corporation Columbia Gulf Transmission Company Cove Point LNG Limited Partnership Crossroads Pipeline Company Discovery Gas Transmission LLC Dominion Transmission Inc. Dynegy Midstream Pipeline, Inc. East Tennessee Natural Gas Company Egan Hub Partners, L.P. El Paso Natural Gas Company Equitrans, Inc. Florida Gas Transmission Company Gas Transport, Inc. Granite State Gas Transmission, Inc. Great Lakes Gas Transmission Limited Partnership Gulf South Pipeline Gulf States Transmission Corporation High Island Offshore System Iroquois Gas Transmission System, L.P. Kansas Pipeline Company Kentucky West Virginia Gas Company Kern River Gas Transmission Company KM Interstate Gas Transmission Co. KN Wattenberg Transmission Maritimes & Northeast Pipeline L.L.C. Michigan Gas Storage Company Midwestern Gas Transmission Company MIGC, Inc. Mississippi River Transmission Corporation Mojave Pipeline Company National Fuel Gas Supply Corporation Natural Gas Pipeline Company of America Nora Transmission Company Northern Border Pipeline Company Northern Natural Gas Company Northwest Pipeline Corporation

C-3 41633R42.pdf
OkTex Pipeline Company Overthrust Pipeline Company Ozark Gas Transmission System Paiute Pipeline Company Panhandle Eastern Pipe Line Company Petal Gas Storage Company PG&E Gas Transmission-Northwest Corporation Questar Pipeline Company Reliant Energy Gas Transmission Company Sabine Pipe Line Company Sea Robin Pipeline Company Shell Offshore Pipelines South Georgia Natural Gas Company Southern Natural Gas Company Southwest Gas Storage Company Steuben Gas Storage Company TCP Gathering Co. Tennessee Gas Pipeline Company Texas Eastern Transmission Corporation Texas Gas Transmission Corporation Total Peaking LLC Trailblazer Pipeline Company TransColorado Gas Transmission Company Transcontinental Gas Pipe Line Corporation Transwestern Pipeline Company Trunkline Gas Company Trunkline LNG Company Tuscarora Gas Transmission Company U-T Offshore System Vector Pipeline Venice Gathering System, L.L.C. Viking Gas Transmission Company Williams Gas Pipelines Central, Inc. Williston Basin Interstate Pipeline Company Wyoming Interstate Company, Ltd. Young Gas Storage Company, Ltd.

41633R42.pdf D-1
Appendix D: Lists of Surveyed PRCI Member & Other Gas Transmission Companies
Including Contact Name, Email, and Telephone Contact Information

41633R42.pdf D-2
Members of the Pipeline Research Council International Email Contacts for Survey
(As of 7/9/03 Email of main POC {when determined} for multiple listings, or single listings on Materials Committee)
Organization POC Email Address
Advantica Technologies Ltd [email protected]
BP [email protected], [email protected] [email protected],
Buckeye Pipe Line Company [email protected] Chevron Texaco Pipeline Company [email protected] CMS Panhandle Companies [email protected] Colonial Pipeline Company [email protected] Columbia Gas Transmission Co. [email protected] ConocoPhillips [email protected] Consumers Energy [email protected] Dominion Transmission [email protected] Duke Energy Gas Transmission [email protected] El Paso Corporation [email protected] Enbridge Pipelines [email protected] Enron Transportation Services Corp. [email protected] Explorer Pipeline Company [email protected] ExxonMobil Pipeline Company [email protected] Foothills Pipe Lines Ltd [email protected] Gassco A.S. (Norway) [email protected] Gasum Oy (Finland) [email protected] Gaz de France [email protected] Gulf South Pipeline [email protected] Marathon Ashland Pipe Line LLC [email protected] N.V. Nederlandse Gasunie/Gastransport Services (The Netherlands) [email protected]
National Fuel Gas Supply Corporation [email protected] Saudi Aramco [email protected] Sempra Energy Utilities/Southern California Gas Company [email protected]
Shell Pipeline Company LP [email protected] Southern Natural Gas Company [email protected] TEPPCO [email protected] TransCanada PipeLines Limited [email protected] Transco (UK) [email protected] TransGas [email protected] Williams Gas Pipeline [email protected]

41633R42.pdf D-3
Members of the Pipeline Research Council International Contact Names and Phone Numbers
(As of 7/9/03)
Organization POC Name Phone Number
Advantica Technologies Ltd Bob Andrews 011 44 1509 282749 BP John Hammond 011 44 1932 775909 BP David Moore 907 564 4190 BP Larry Moskowitz 281 366 2924 Buckeye Pipe Line Company William Shea 610 254 4650 Chevron Texaco Pipeline Company George Kohut 510 242 3245 CMS Panhandle Companies Scott Gallagher 713 989 7444 Colonial Pipeline Company John Godfrey 678 762 2217 Columbia Gas Transmission Co. Jim Swatzel 304 357 2797 ConocoPhillips Dave Ysebaert 281 293 2969 Consumers Energy Robert Welsh 517 788 1928 Dominion Transmission Brian Sheppard 304 627 3733 Duke Energy Gas Transmission Steve Rapp 713 627 6394 El Paso Corporation Bennie Barnes 719 520 4677 Enbridge Pipelines Scott Ironside 780 420 5267 Enron Transportation Services Corp. Michael Crump 713 345 1623 Explorer Pipeline Company Jeff Wenzell 918 493 5140 ExxonMobil Pipeline Company Don Drake 713 656 2288 Foothills Pipe Lines Ltd Jack Beattie 403 294 4143 Gassco A.S. (Norway) Egil Hurloe 011 47 52812500 Gasum Oy (Finland) Ilkka Taka-Aho 011 358 20 44 78653 Gaz de France Gerard Jammes 011 33 49 22 54 19 Gulf South Pipeline Scott Williams 713 544 5220 Marathon Ashland Pipe Line LLC Thomas Shaw 419 421 4002 N.V. Nederlandse Gasunie/Gastransport Wytze Sloterdijk 011 31 50 521 2674 National Fuel Gas Supply Corporation John Pustulka 716 857 7909 Saudi Aramco Shuler Cox 011 966 3 874 6664 Sempra Energy Utilities/Southern Cal Gas Bill Amend 213 244 5277 Shell Pipeline Company LP John Niemeyer 713 241 1856 Southern Natural Gas Company George Benoit 832 528 4244 TEPPCO Leonard Mallett 713 759 3615 TransCanada PipeLines Limited David Dorling 403 948 8147 Transco (UK) Jeremy Bending 011 44 1689 881479 TransGas Brian Torgunrud 306 777 9357 Williams Gas Pipeline Thomas Odom 270 688 6964

41633R42.pdf D-4
Other Natural Gas Pipeline Operating Companies – Email Contacts (As of 7/9/03)
Organization Location Email Address
Algonquin Gas Transmission Co. Duke Energy [email protected] Algonquin LNG, Inc. Duke Energy [email protected] Alliance Pipeline Ltd. [email protected] ANR Pipeline Co. El Paso [email protected] ANR Storage Co. El Paso [email protected] Black Marlin Pipeline Co. Williams [email protected] Blue Lake Gas Storage Co. El Paso [email protected] Canyon Creek Compression Co. K. Morgan (KM) [email protected] Carnegie Interstate Pipeline Co. Equitrans [email protected] Chandeleur Pipe Line Co. ChevronTexaco [email protected] Colorado Interstate Gas Co. El Paso [email protected] Columbia Gas Transmission Corp. Columbia [email protected] Columbia Gulf Transmission Co. Columbia [email protected] Cove Point LNG, L.P. Dominion [email protected] Crossroads Pipeline Co. Columbia [email protected] Discovery Gas Transmission LLC Williams [email protected] Dynegy Midstream Pipeline, Inc. [email protected] East Tennessee Natural Gas Co. Duke Energy [email protected] Egan Hub Partners, L.P. Duke Energy [email protected] El Paso Natural Gas Co. El Paso [email protected] El Paso Field Services El Paso [email protected] Energy East [email protected] EPGT Texas Pipeline, L.P. El Paso [email protected] Equitrans, Inc. [email protected] Florida Gas Transmission Co. Enron [email protected] Granite State Gas Transmission, Inc. Columbia [email protected] Great Lakes Gas Transmission, L.P. [email protected] Gulf South Pipeline [email protected] Gulf States Transmission Corp. El Paso [email protected] High Island Offshore System El Paso [email protected] Iroquois Gas Transmission System [email protected]
Kansas Pipeline Co. Midcoast Energy Enbridge [email protected]
Kentucky West Virginia Gas Co. Equitrans [email protected] Kern River Gas Transmission Co. Williams [email protected] Keyspan Energy [email protected] KM Interstate Gas Transmission Co. KM [email protected] KN Wattenberg Transmission KM [email protected] Maritimes & Northeast Pipeline L.L.C. Duke Energy [email protected]
Michigan Gas Storage Co. Consumers Energy [email protected]
Midwestern Gas Transmission Co. Enron [email protected] MIGC, Inc. Western Gas [email protected]

41633R42.pdf D-5
Organization Location Email Address
Mississippi River Transmission Corp. CenterPoint Energy [email protected]
Mojave Pipeline Co. El Paso [email protected] National Fuel Gas Supply Corp. [email protected] Natural Gas Pipeline Co. of America KM [email protected] Nora Transmission Co. Equitrans [email protected]
North Carolina Natural Gas Carolina Power & Light [email protected]
Northern Border Pipeline Co. Enron [email protected]
Northern Natural Gas Co. Midamerican Energy [email protected]
Northwest Pipeline Corp. Williams [email protected] Overthrust Pipeline Co. Questar [email protected] Oncor Gas [email protected] Ozark Gas Transmission System [email protected] Paiute Pipeline Co. Southwest Gas [email protected] Panhandle Eastern Pipe Line Co. CMS [email protected] Petal Gas Storage Co. El Paso [email protected] PG&E Gas Transmission-Northwest Corp. PG&E [email protected]
PG&E Gas Transmission-Northwest Corp. PG&E [email protected]
Questar Pipeline Co. Questar [email protected]
Reliant Energy Gas Transmission Co. CenterPoint Energy [email protected]
Sabine Pipe Line Co. ChevronTexaco [email protected] Sea Robin Pipeline Co. CMS [email protected] Shell Offshore Pipelines Shell [email protected] Southern Natural Gas Co. El Paso [email protected] Southwest Gas Corp. [email protected] Southwest Gas Storage Co. CMS [email protected] Steuben Gas Storage Co. ANR/Arlington [email protected] Tennessee Gas Pipeline Co. El Paso [email protected] Texas Eastern Transmission Corp. Duke Energy [email protected] Texas Gas Transmission Corp. Williams [email protected] Total Peaking LLC Energy East [email protected] Trailblazer Pipeline Co. KM [email protected] TransColorado Gas Transmission Co. KM [email protected] Transcontinental Gas Pipe Line Corp. Williams [email protected] Transwestern Pipeline Co. Enron [email protected] Trunkline Gas Co. CMS [email protected] Trunkline LNG Co. CMS [email protected] Tuscarora Gas Transmission Co. [email protected] TXU Gas/TXU Lone Star Pipeline TXU Gas [email protected] Vector Pipeline Enbridge [email protected] Venice Gathering System, L.L.C. Dynergy [email protected]

41633R42.pdf D-6
Organization Location Email Address
Viking Gas Transmission Co. Northern Border (Enron) [email protected]
Williams Gas Pipelines Central, Inc. Williams [email protected] Williston Basin Interstate Pipeline Co. [email protected] Wyoming Interstate Co., Ltd. El Paso [email protected] Young Gas Storage Co., Ltd. El Paso [email protected]

41633R42.pdf D-7
Other Natural Gas Pipeline Operating Companies Contact Names and Phone Numbers
(As of 7/9/03)
Organization POC Name Phone Number
Algonquin Gas Transmission Co. Steve Rapp 713 627 6394 Algonquin LNG, Inc. Steve Rapp 713 627 6394 Alliance Pipeline Ltd. Arti Bhatia 403 517 7727 ANR Pipeline Co. George Benoit 832 528 4244 ANR Storage Co. George.Benoit 832 528 4244 Black Marlin Pipeline Co. Thomas Odom 270 688 6964 Blue Lake Gas Storage Co. Robert White 248 994 4046 Canyon Creek Compression Co. K. Morgan Mark Mayworn 713 369 9347 Carnegie Interstate Pipeline Co. Andy Murphy 412 231 4888 Chandeleur Pipe Line Co. George Kohut 510 242 3245 Colorado Interstate Gas Co. Bennie Barnes 719 520 4677 Columbia Gas Transmission Corp. Jim Swatzel 304 357 2797 Columbia Gulf Transmission Co. Jim Swatzel 304 357 2797 Cove Point LNG Limited Partnership Brian Sheppard 304 627 3733 Crossroads Pipeline Co. Jim Swatzel 304 357 2797 Discovery Gas Transmission LLC Thomas Odom 270 688 6964 Dynegy Midstream Pipeline, Inc. Rich Mueller 713 507 3992 East Tennessee Natural Gas Co. Steve Rapp 713 627 6394 Egan Hub Partners, L.P. Steve Rapp 713 627 6394 El Paso Field Services Pat Davis 210 528 4244 El Paso Natural Gas Co. Bennie Barnes 719 520 4677 Energy East Scott Martin 607 347 2561 EPGT Texas Pipeline, L.P. Pat Davis 210 528 4244 Equitrans, Inc. Andy Murphy 412 231 4888 Florida Gas Transmission Co. Michael Crump 713 345 1623 Granite State Gas Transmission, Inc. Jim Swatzel 304 357 2797 Great Lakes Gas Transmission L.P. Ryan Grondin 321 439 1777 Gulf South Pipeline Scott Williams 713 544 5220 Gulf States Transmission Corp. George Benoit 832 528 4244 High Island Offshore System George.Benoit 832 528 4244 Iroquois Gas Transmission System, L.P. Ben Gross 203 925 7257 Kansas Pipeline Company Scott Ironside 780 420 5267 Kentucky West Virginia Gas Co. Andy Murphy 412 231 4888 Kern River Gas Transmission Co. Thomas Odom 270 688 6964 Keyspan Energy Perry Sheth 516 545 3844 KM Interstate Gas Transmission Co. Mark Mayworn 713 369 9347 KN Wattenberg Transmission Mark Mayworn 713 369 9347 Maritimes & Northeast Pipeline L.L.C. Steve Rapp 713 627 6394 Michigan Gas Storage Co. Robert Welsh 517 788 1928 Midwestern Gas Transmission Co. Michael Crump 713 345 1623 MIGC, Inc. John Curtis Mississippi River Transmission Corp. Scott Mundy 318 429 3943

41633R42.pdf D-8
Organization POC Name Phone Number
Mojave Pipeline Co. Bennie Barnes 719 520 4677 National Fuel Gas Supply Corp. John Pustulka 716 857 7909 Natural Gas Pipeline Co. of America Mark Mayworn 713 369 9347 Nora Transmission Co. Andy Murphy 412 231 4888 North Carolina Natural Gas Ted Hodges 919 546 6369 Northern Border Pipeline Co. Michael Crump 713 345 1623 Northern Natural Gas Co. Paul Fuhrer 402 398 7733 Northwest Pipeline Corp. Thomas Odom 270 688 6964 Oncor Gas Mark Rothbauer 214 875 5574 Overthrust Pipeline Co. Questar [email protected] Ozark Gas Transmission System Larry Strawn 405 557 5271 Paiute Pipeline Co. Jerry Schmitz 702 365 2204 Panhandle Eastern Pipe Line Co. Scott Gallagher 713 989 7444 Petal Gas Storage Co. Bennie Barnes 719 520 4677 PG&E Gas Transmission-Northwest Corp. Bill Harris 925 974 4030 PG&E Gas Transmission-Northwest Corp. Alan Eastman 925 974 4312 Questar Pipeline Co. Questar [email protected] Reliant Energy Gas Transmission Co. Scott Mundy 318 429 3943 Sabine Pipe Line Co. George Kohut 510 242 3245 Sea Robin Pipeline Co. Scott Gallagher 713 989 7444 Shell Offshore Pipelines John Niemeyer 713 241 1856 Southern Natural Gas Co. George Benoit 832 528 4244 Southwest Gas Corp. Jerry Schmitz 702 365 2204 Southwest Gas Storage Co. Scott Gallagher 713 989 7444 Steuben Gas Storage Co. George Benoit 832 528 4244 Tennessee Gas Pipeline Co. George Benoit 832 528 4244 Texas Eastern Transmission Corp. Steve Rapp 713 627 6394 Texas Gas Transmission Corp. Thomas Odom 270 688 6964 Total Peaking LLC Scott Martin 607 347 2561 Trailblazer Pipeline Co. Mark Mayworn 713 369 9347 TransColorado Gas Transmission Co. Mark Mayworn 713 369 9347 Transcontinental Gas Pipe Line Corp. Thomas Odom 270 688 6964 Transwestern Pipeline Co. Michael Crump 713 345 1623 Trunkline Gas Co. Scott Gallagher 713 989 7444 Trunkline LNG Co. Scott Gallagher 713 989 7444 Tuscarora Gas Transmission Co. Les Cherwenuk 775 834 3674 TXU Gas/TXU Lone Star Pipeline Mark Rothbauer 214 875 5574 Vector Pipeline Scott Ironside 780 420 5267 Venice Gathering System, L.L.C. Rich Mueller 318 429 3943 Viking Gas Transmission Co. Michael Crump 713 345 1623 Williams Gas Pipelines Central, Inc. Thomas Odom 270 688 6964 Williston Basin Interstate Pipeline Co. Keith Seifert 406 359 7223 Wyoming Interstate Company, Ltd. Bennie Barnes 719 520 4677 Young Gas Storage Company, Ltd. Bennie Barnes 719 520 4677