international comparisons of education
TRANSCRIPT

CHAPTER 6International Comparisons of Education
This chapter offers a broad perspective on education acrossthe nations of the world. It also provides an international con-text for examining the condition of education in the UnitedStates. Insights into the educational practices and outcomes ofthe United States are obtained by comparing them with thoseof other countries. The National Center for Education Statis-tics (NCES) carries out a variety of these activities to providestatistical data for international comparisons of education.
This chapter presents data drawn from materials preparedby the United Nations Educational, Scientific, and CulturalOrganization (UNESCO), the Institute of International Edu-cation, the Organization for Economic Cooperation andDevelopment (OECD), and the International Association forthe Evaluation of Educational Achievement (IEA). Thebasic summary data on enrollments, teachers, enrollmentratios, and finances were synthesized from informationappearing in Education at a Glance, published by OECD.Even though OECD tabulations are very carefully prepared,international data users should be cautioned about the manyproblems of definition and reporting involved in the collec-tion of data about the educational systems in the world (seeOECD entry in Appendix A. Guide to Sources).
This chapter also presents data from the Trends in Inter-national Mathematics and Science Study (TIMSS) carriedout under the aegis of the IEA, and supported by NCES andthe National Science Foundation. This survey was formerlyknown as the Third International Mathematics and ScienceStudy. TIMSS, conducted every 4 years, is an assessment offourth- and eighth-graders in mathematics and science. In1995, TIMSS collected data for fourth and eighth grades. In1999, TIMSS collected data for eighth grade only. With the2003 data collection, TIMSS offers the first internationaltrend comparisons in mathematics and science at grades 4and 8. In 2003, the United States and a number of othercountries participated in data collection at two grade levels:25 nations collected data on fourth-graders, and 45 nationscollected data on eighth-graders. For 15 of these nations,including the United States, TIMSS offers comparisons offourth-grade student achievement between 1995 and 2003.For 34 of these nations, including the United States, TIMSSalso offers comparisons of eighth-grade student achievementbetween 2003 and at least one prior data collection year,either 1995 or 1999.
This chapter includes additional information on perfor-mance scores of 15-year-olds in the areas of reading, mathe-
matics, and science literacy from the Program forInternational Student Assessment (PISA). PISA also mea-sures general or cross-curricular competencies such as learn-ing strategies. While this study focuses on OECD countries,data from some non-OECD countries are also provided.
The role that the United States plays in the world ofhigher education is illuminated by data on foreign studentsenrolled in U.S. institutions of higher education. The Insti-tute of International Education provides estimates of thenumber of foreign students and their countries of origin.
Further information on survey methodologies is in theGuide to Sources in appendix A and in the publications citedin the source notes.
PopulationAmong the reporting OECD countries, Iceland had the
largest percentage of young people ages 5 to 14 (16 percent in2002) (table 387). The closest followers were New Zealand(15 percent) and the United States (15 percent). Countrieswith relatively small numbers of persons in this age groupincluded Greece, Spain, Japan, and Italy (all at 10 percent). In1999, Turkey had the largest percentage of young people ages5 to 14 among reporting OECD countries (21 percent).
EnrollmentsIn 1997, about 1.2 billion students were enrolled in
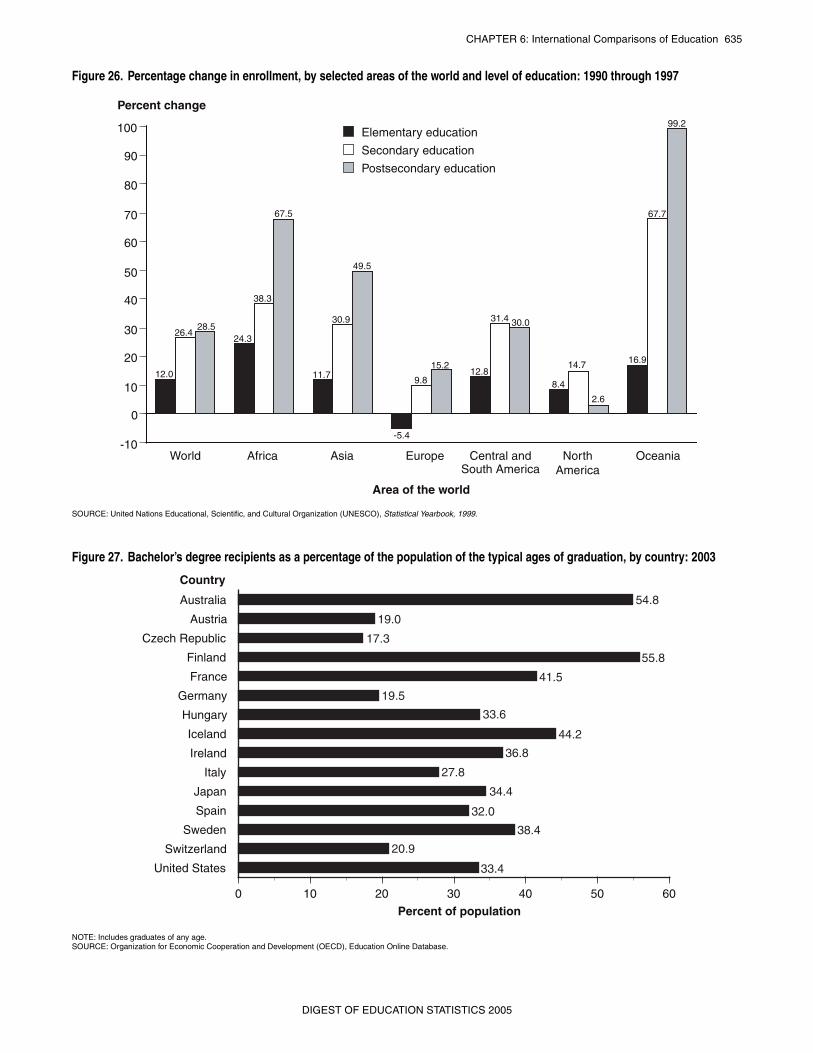
schools around the world (table 385). Of these students, 668million were in elementary-level programs, 398 millionwere in secondary programs, and 88 million were in highereducation programs. Between 1990 and 1997, enrollmentchanges varied from region to region. Changes in elementaryenrollment ranged from increases of 24 percent in Africa, 17percent in Oceania, 13 percent in Central and South Amer-ica, 12 percent in Asia, and 8 percent in Northern America(defined in UNESCO tabulations as including the UnitedStates, Canada, Greenland, Bermuda, St. Pierre, and Mique-lon) to a 5 percent decrease in Europe (figure 26). Over thesame period, enrollment increases at the secondary level out-paced increases at the primary (elementary) level, especiallyin Africa (38 percent), Oceania (68 percent), Asia (31 per-cent), and Central and South America (31 percent). At thesecondary level, enrollment increased by 10 percent inEurope and by 15 percent in Northern America.
DIGEST OF EDUCATION STATISTICS 2005 633

634 CHAPTER 6: International Comparisons of Education
At the postsecondary level, developing areas of the worldalso had substantial increases in enrollment between 1990and 1997 (table 385 and figure 26). Postsecondary enroll-ment rose by 99 percent in Oceania, by 68 percent in Africa,by 49 percent in Asia, by 30 percent in Central and SouthAmerica, by 15 percent in Europe, and by 3 percent inNorthern America (figure 26). These increases are due toboth growth in the proportion of the people attending post-secondary institutions and increases in the populations.
Postsecondary enrollment varied among countries due par-tially to differing definitions of postsecondary education and atwhat age it begins. In 2002, the OECD countries with the high-est proportion of 22- to 25-year-olds enrolled in postsecondaryeducation were Finland (39 percent), followed by the Republicof Korea (32 percent), Denmark (29 percent), Sweden (28 per-cent), Norway (27 percent), and Poland (26 percent)(table 388). The United States’ proportion was 25 percent.
In 2003–04, there were about 573,000 foreign studentsstudying at U.S. colleges and universities (table 408). Fifty-seven percent of these students were from Asian countries.Between 1990 and 2003, the proportion of students at U.S.colleges who were nonresident aliens rose from 2.8 to 3.5 per-cent (table 205).
AchievementIn 2003, U.S. fourth-grade students scored 518 in mathe-
matics, on average, exceeding the international average of 495for the 25 participating countries (table 393). U.S. fourth-graders were outperformed by their peers in 11 countries,including four Asian countries (Chinese Taipei, Hong KongSAR, Japan, and Singapore) and seven European countries(Flemish Belgium, England, Hungary, Latvia, Lithuania, theNetherlands, and the Russian Federation). On the other hand,U.S. fourth-graders outscored students in 13 countries. In2003, U.S. eighth-grade students scored 504 in mathematics,on average, exceeding the international average of 466 for the45 participating countries (table 394). U.S. eighth-graderswere outperformed by their peers in nine countries, includingfive Asian countries (Chinese Taipei, Hong Kong SAR,Japan, Korea, and Singapore) and four European countries(Flemish Belgium, Estonia, Hungary, and the Netherlands).On the other hand, U.S. eighth-graders outscored students in25 countries. These average scale scores are from the TIMSSassessment, with possible scores ranging from 1 to 1,000.
In 2003, U.S. performance in mathematics literacyamong 15-year-old students was lower than the average per-formance for 20 of the other 28 OECD countries for whichcomparable PISA results were reported (table 391). In prob-lem solving, U.S. performance on PISA was lower than 22of the other 28 OECD countries. The U.S. average score inreading literacy was not measurably different from theOECD average, and the U.S. average score in science liter-acy was below the OECD average.
Degrees Ratios of bachelor’s degrees conferred per 100 persons at
the typical age of graduation in 2003 ranged from 14 in Mex-ico and 17 in the Czech Republic to 55 in Australia and 56 inFinland (table 403 and figure 27). The ratio for the UnitedStates was 33. In 2003, women had higher bachelor’s degreeratios than men in 18 out of 21 countries reporting data.
The percentages of undergraduate degrees awarded in sci-ence fields (including natural sciences, mathematics and com-puter science, and engineering) reported by OECD countriesranged from 11 to 38 percent for 2003 (table 404). Austria,France, Germany, Japan, Korea, Spain, Sweden, and Switzer-land were 30 percent or higher, while Belgium, the CzechRepublic, Hungary, Italy, Mexico, New Zealand, Poland, andthe United States were 20 percent or less. The proportion ofgraduate degrees awarded in science fields also ranged widelyacross countries in 2003 (table 405). Among the countrieswith the highest proportions were Korea (46 percent), Japan(39 percent), Germany (36 percent), and Spain (36 percent).Among the countries with the lowest proportions were Poland(4 percent), Hungary (7 percent), the Czech Republic (12 per-cent), Italy (13 percent), and the United States (14 percent).
FinancesIn 2002, per student expenditures at the elementary level of
education were at least $7,500 in five OECD countries(table 406). Specifically, Luxembourg spent approximately$10,600 per student at the elementary level, the United Statesspent approximately $8,000, Switzerland spent approximately$7,800, Denmark spent approximately $7,700, and Norwayspent approximately $7,500. At the secondary level, fivecountries had expenditures of over $8,800 per student: Lux-embourg (approximately $15,200), Switzerland ($11,900),Norway (approximately $10,200), the United States (approxi-mately $9,100), and Austria (approximately $8,900). The fol-lowing five countries had expenditures of at least $13,700 perstudent in higher education: Switzerland (approximately$23,700), the United States (approximately $20,500), Sweden(approximately $15,700), Denmark (approximately $15,200),and Norway (approximately $13,700). These expenditureswere adjusted to U.S. dollars using the purchasing-power-par-ity (PPP) index. This index is considered more stable andcomparable than indexes using currency exchange rates.
A comparison of public direct expenditures on edu-cation as a percentage of gross domestic product(GDP) in OECD countries shows that national invest-ment in education in 2002 ranged from 3.4 percent inTurkey and 3.5 percent in Japan to 6.8 percent in Ice-land and 6.8 percent in Denmark (table 407 andfigure 28). Among reporting countries, the averagepublic investment in education in 2002 was 4.9 percentof GDP. In the United States, the public expenditure oneducation as a percentage of GDP was 5.3 percent. Thepercentage of expenditures on education in the RussianFederation, a non-OECD country, was 4.0 percent.
DIGEST OF EDUCATION STATISTICS 2005
CHAPTER 6: International Comparisons of Education 635
Figure 26. Percentage change in enrollment, by selected areas of the world and level of education: 1990 through 1997
SOURCE: United Nations Educational, Scientific, and Cultural Organization (UNESCO), Statistical Yearbook, 1999.
Figure 27. Bachelor’s degree recipients as a percentage of the population of the typical ages of graduation, by country: 2003
NOTE: Includes graduates of any age.SOURCE: Organization for Economic Cooperation and Development (OECD), Education Online Database.
Percent change
World Asia
Area of the world
Africa Europe Central andSouth America
NorthAmerica
Oceania
Elementary education
Secondary education
Postsecondary education
0
20
-10
40
60
80
90
100
10
30
50
70
12.0
26.428.5
67.5
24.3
38.3
11.7
30.9
49.5
9.8
-5.4
15.212.8
31.4 30.0
8.4
14.7
2.6
16.9
67.7
99.2
United States
Switzerland
Sweden
Spain
Japan
Italy
Ireland
Iceland
Hungary
Germany
France
Finland
Czech Republic
Austria
Australia
0 10 20 30 40 50 60
Country
Percent of population
54.8
19.0
17.3
55.8
41.5
19.5
33.6
44.2
36.8
27.8
34.4
38.4
32.0
20.9
33.4
DIGEST OF EDUCATION STATISTICS 2005

636 CHAPTER 6: International Comparisons of Education
Figure 28. Public direct expenditures for education as a percentage of the gross domestic product (GDP), by country: 2002
NOTE: Includes all government expenditures for education institutions, plus public subsidies to households for living costs which are not spent at educational institutions.SOURCE: Organization for Economic Cooperation and Development (OECD), Education at a Glance, 2005.
Percent of GDP
United StatesUnited Kingdom
TurkeySwitzerland
SwedenSpain
Russian FederationPortugalNorway
New ZealandNetherlands
MexicoKoreaJapan
ItalyGermany
FranceFinland
DenmarkBelgium, Flemish
Australia
0 5 6 7 81 2 3 4
5.3
5.03.4
5.7
6.74.3
4.0
5.76.7
5.64.6
5.1
4.2
3.5
4.64.4
5.7
5.9
6.8
6.14.4
Country
DIGEST OF EDUCATION STATISTICS 2005

CHAPTER 6: International Comparisons of Education 637
_
1Enrollment and teacher data exclude the Democratic People’s Republic of Korea.2Excludes Rodrigues and other small islands.3Includes 5 countries of the former Union of Soviet Socialist Republics (U.S.S.R.), Arabstates, and both the Asian and the European portions of Turkey.4Includes all countries of the former U.S.S.R. except Kazakhstan, Uzbekistan, Kyrgyzstan,Tajikistan, and Turkmenistan.5Northern America includes Bermuda, Canada, Greenland, St. Pierre and Miquelon, andthe United States of America. Hawaii is included in Northern America rather than Oceania.Central and South America includes Latin America and the Caribbean.6Includes American Samoa, Australia, Cook Islands, Fiji, French Polynesia, Guam, Kiribati,Marshall Islands, Nauru, New Caledonia, New Zealand, Niue, Norfolk Island, PacificIslands, Papua New Guinea, Samoa, Solomon Islands, Tokelau, Tonga, Tuvalu, and theRepublic of Vanuatu.
7Estimate of midyear population.8First-level enrollment generally consists of elementary school, grades 1–6.9Second-level enrollment includes general education, teacher training (at the second level),and technical and vocational education. This level generally corresponds to secondaryeducation in the United States, grades 7–12.10Third-level enrollment includes college and university enrollment, and technical and voca-tional education beyond the high school level. There is considerable variation in reportingfrom country to country.11This figure is for Europe, not including the former U.S.S.R.NOTE: Detail may not sum to totals because of rounding. Public expenditure data not avail-able for 1995 through 1997.SOURCE: United Nations Educational, Scientific, and Cultural Organization (UNESCO),Statistical Yearbook, 1999. (This table was prepared July 2000.)
Table 385. Selected population and enrollment statistics, school enrollment, and teachers, by major areas of the world: Selected years, 1980 through 1997
Selected characteristic World total1
Major areas of the world
Africa2 Asia3 Europe4Central and
South America5 Northern America5 Oceania6
1 2 3 4 5 6 7 8
1980Population, all ages,7 in thousands...................... 4,447,090 475,714 2,641,312 693,075 359,307 255,109 22,573Enrollment, all levels, in thousands...................... 856,971 78,036 495,155 131,633 87,291 60,041 4,815
First (primary) level8......................................... 541,556 62,134 336,174 52,471 65,414 22,611 2,752Second level9 ................................................... 264,379 14,360 144,755 62,734 16,969 23,913 1,647Third level10 ..................................................... 51,037 1,542 14,227 16,428 4,908 13,516 416
Teachers, all levels, in thousands ........................ 38,285 2,338 19,641 8,225 3,730 4,079 272First (primary) level8......................................... 19,044 1,661 10,874 2,541 2,260 1,580 129Second level9 ................................................... 15,398 584 7,554 4,387 1,083 1,679 112Third level10 ..................................................... 3,843 94 1,213 1,297 387 820 31Public expenditures on education, in millions
of U.S. dollars ............................................ 516,400 22,900 93,800 200,600 33,500 155,100 10,400As a percent of gross national product ................ 4.8 5.3 4.0 11 5.1 3.8 5.2 5.6
1990Population, all ages,7 in thousands...................... 5,281,986 629,389 3,184,342 722,109 437,822 282,020 26,304Enrollment, all levels, in thousands...................... 980,474 107,871 569,179 131,255 104,968 62,007 5,194
First (primary) level8......................................... 596,853 80,640 364,213 48,968 75,505 24,810 2,717Second level9 ................................................... 315,008 24,378 181,652 63,366 22,194 21,569 1,849Third level10 ..................................................... 68,613 2,853 23,314 18,922 7,269 15,628 628
Teachers, all levels, in thousands ........................ 47,105 3,791 24,455 9,398 5,131 4,000 330First (primary) level8......................................... 22,626 2,390 12,692 2,812 3,006 1,582 143Second level9 ................................................... 19,380 1,241 9,947 5,076 1,520 1,449 146Third level10 ..................................................... 5,100 160 1,816 1,509 605 969 41
Public expenditures on education, in millions of U.S. dollars ................................................ 986,500 25,700 199,800 367,500 44,600 330,300 18,600
As a percent of gross national product........................................................... 4.8 5.6 3.7 11 5.1 4.1 5.4 5.6
1995Population, all ages,7 in thousands...................... 5,686,775 719,497 3,437,791 728,034 476,641 296,644 28,168Enrollment, all levels, in thousands...................... 1,103,756 130,794 644,609 137,839 116,821 66,510 7,183
First (primary) level8......................................... 649,480 95,928 394,304 47,344 82,279 26,501 3,124Second level9 ................................................... 372,724 30,899 219,415 69,448 26,087 23,984 2,891Third level10 ..................................................... 81,552 3,966 30,890 21,047 8,455 16,026 1,167
Teachers, all levels, in thousands ........................ 52,047 4,486 26,955 10,113 5,784 4,269 439First (primary) level8......................................... 24,356 2,811 13,499 2,863 3,374 1,649 161Second level9 ................................................... 21,746 1,471 11,273 5,561 1,696 1,528 217Third level10 ..................................................... 5,945 205 2,183 1,689 714 1,092 61
1996Population, all ages,7 in thousands...................... 5,767,443 738,740 3,488,028 728,561 484,309 299,250 28,555Enrollment, all levels, in thousands...................... 1,130,667 134,843 663,394 137,522 120,429 67,122 7,357
First (primary) level8......................................... 659,106 98,356 400,405 46,866 83,596 26,736 3,147Second level9 ................................................... 386,386 32,127 229,981 69,103 27,815 24,355 3,005Third level10 ..................................................... 85,175 4,360 33,008 21,554 9,018 16,031 1,204
Teachers, all levels, in thousands ........................ 53,081 4,642 27,596 10,107 5,983 4,305 447First (primary) level8......................................... 24,622 2,881 13,630 2,842 3,446 1,661 162Second level9 ................................................... 22,375 1,538 11,719 5,556 1,785 1,552 224Third level10 ..................................................... 6,084 223 2,247 1,709 752 1,093 61
1997Enrollment, all levels, in thousands...................... 1,154,721 138,714 679,366 137,645 123,778 67,689 7,528
First (primary) level8......................................... 668,450 100,226 406,661 46,304 85,177 26,906 3,176Second level9 ................................................... 398,116 33,708 237,861 69,547 29,153 24,746 3,101Third level10 ..................................................... 88,156 4,780 34,844 21,794 9,448 16,038 1,251
Teachers, all levels, in thousands ........................ 54,120 4,754 28,288 10,141 6,138 4,342 456First (primary) level8......................................... 24,818 2,927 13,763 2,814 3,474 1,674 165Second level9 ................................................... 23,017 1,585 12,185 5,568 1,874 1,577 228Third level10 ..................................................... 6,284 242 2,339 1,759 789 1,092 62
DIGEST OF EDUCATION STATISTICS 2005

638 CHAPTER 6: International Comparisons of Education
_
—Not available.#Rounds to zero.1Selection based on total population for midyear 1997.2First-level enrollment generally consists of elementary school, grades 1–6.3Second-level enrollment includes general education, teacher training (at the second level), andtechnical and vocational education. This level generally corresponds to secondary education inthe United States, grades 7–12.4Third-level enrollment includes college and university enrollment, and technical and vocationaleducation beyond the high school level. There is considerable variation in reporting from countryto country.5Data represent the total enrollment of all ages in the school level divided by the population of thespecific age groups that correspond to the school level. The year shown in this column is the onein which the school or academic year starts. Adjustments have been made for the varyinglengths of first and second level programs. Ratios may exceed 100 because some countrieshave many students from outside the normal age range.
6Enrollment totals and ratios exclude Democratic People’s Republic of Korea. Data do notinclude adult education or special education provided outside regular schools.7Classification or data coverage of levels have been revised. Data by level may not be compara-ble over time.8Estimated by the UNESCO Institute for Statistics.9Data for 1994–95.10Data for 2001–02.11Policy change in 2000–01: introduction of free universal primary education.12National estimation.13Data for 1991–92.14Excludes private institutions.15Data refer to universities and exclude Al Azhar.16Data for 2003–04.
Table 386. Selected population and enrollment statistics for countries with populations over 10 million, by continent: Selected years, 1980 through 2002
Country1
Midyear population in millions
Persons persquare
kilometer
First level2
Enrollment in thousands Gross enrollment ratio5
1980 1990 2000 2002 2002 1980 1990 2000 2002 1980 1990 2000 2002
1 2 3 4 5 6 7 8 9 10 11 12 13 14
World total6 ............................................................... 4,447 5,282 6,054 6,201 48 541,556 596,853 587,775 671,849 96 99 97 108Africa
Algeria7....................................................................... 19 25 30 31 13 3,119 4,189 4,721 4,613 94 100 112 109Angola ........................................................................ 7 9 13 14 11 1,301 9 990 8 1,178 — 175 92 8 74 —Burkina Faso............................................................... 7 9 11 12 43 202 504 901 1,012 17 33 44 46Cameroon................................................................... 9 11 15 16 33 1,379 1,964 11 2,689 2,799 98 101 11 108 108Cote d’Ivoire................................................................ 8 12 16 17 53 1,025 1,415 2,047 12 2,046 75 67 79 12 78Democratic Rep. of the Congo ................................... 27 37 51 54 24 4,196 4,562 — — 92 70 — —Egypt7 ......................................................................... 44 56 64 66 67 4,663 6,964 8 7,856 8 7,874 73 94 8 100 8 97Ethiopia....................................................................... 36 48 64 67 67 2,131 2,466 6,651 7,623 37 33 64 66Ghana7 ....................................................................... 11 15 19 20 88 14 1,378 1,945 2,478 16 2,679 79 75 80 16 83Kenya7 ........................................................................ 17 23 30 31 55 3,927 5,392 8 5,700 5,590 115 95 8 94 92Madagascar................................................................ 9 13 16 16 28 1,724 1,571 2,308 2,856 130 103 103 120Malawi ........................................................................ 6 9 11 11 114 810 1,401 — 2,847 60 68 — 140Mali ............................................................................. 7 8 11 11 9 291 395 1,127 1,295 26 26 61 58Morocco7 .................................................................... 19 24 29 30 66 2,172 2,484 3,842 4,101 83 67 94 110Mozambique7 ............................................................. 12 14 18 18 24 21 1,387 1,260 2,316 2,705 — 67 92 103Niger ........................................................................... 6 8 11 12 9 229 369 657 858 25 29 35 44Nigeria7....................................................................... 72 96 127 133 146 12,117 13,607 — 24,563 109 91 — 119Senegal ...................................................................... 6 8 10 10 52 420 708 1,160 1,287 46 59 75 80South Africa ................................................................ 29 37 43 44 36 22 4,353 6,952 7,445 7,466 90 122 111 106Sudan7........................................................................ 19 24 — — — 1,464 2,043 2,800 3,028 50 53 59 60Tunisia......................................................................... 6 8 10 10 63 1,054 1,406 1,374 1,277 102 113 117 111Uganda ....................................................................... 13 17 22 23 119 26 1,292 22,26 2,470 6,559 7,354 50 74 136 141United Republic of Tanzania ....................................... 19 25 34 35 40 3,368 3,379 8 4,280 27 7,083 93 70 8 63 27 97Zambia........................................................................ 6 8 10 10 14 1,042 1,461 1,590 1,732 90 99 78 82Zimbabwe ................................................................... 7 10 12 13 34 1,235 2,116 2,461 16 2,362 85 116 95 16 93
AsiaAfghanistan7 ............................................................... 16 15 — — — 1,116 623 500 3,267 34 27 15 92Bangladesh................................................................. 88 110 130 136 1,042 8,240 11,940 17,668 17,562 61 72 100 96Cambodia ................................................................... 6 9 12 12 71 1,328 1,330 11 2,431 2,772 — 121 110 124China .......................................................................... 999 1,155 1,261 1,281 137 146,270 122,414 125,757 121,662 113 125 114 115Hong Kong, China (SAR)............................................ 5 6 7 7 — 540 525 494 10 497 107 102 109 10 108India............................................................................ 689 851 1,016 1,048 353 73,873 99,118 — 127,772 83 97 — 109Indonesia .................................................................... 151 183 210 212 117 25,537 29,754 28,690 29,051 107 115 110 112Iran, Islamic Republic of ............................................. 39 59 64 66 40 4,799 9,370 7,968 7,029 29 98 112 86 92Iraq ............................................................................. 13 18 — — — 2,616 3,328 — 4,281 113 111 — 110Japan.......................................................................... 117 124 127 127 349 11,827 9,373 7,395 10 7,326 101 100 101 10 101Kazakhstan................................................................. 15 17 15 15 5 1,064 1,197 1,190 1,120 84 87 99 102Korea, North (DPR) .................................................... 18 20 — — — — — — 4,148 — — — —Korea, South (Republic of) ......................................... 38 43 47 48 483 5,658 4,869 4,030 — 110 105 101 104Malaysia...................................................................... 14 18 23 24 74 2,009 2,456 3,018 3,009 93 94 98 93Myanmar..................................................................... 34 41 46 49 74 4,148 5,385 4,782 4,889 91 106 89 92Nepal7......................................................................... 14 19 24 24 169 1,068 2,789 3,623 3,929 86 108 118 119Pakistan ...................................................................... 85 119 138 145 188 30 5,474 30 11,451 12 14,562 14,045 40 61 12 75 68Philippines .................................................................. 48 61 76 80 268 14 8,034 10,427 12,760 12,971 112 111 113 112Saudi Arabia ............................................................... 10 16 21 22 10 927 1,877 2,308 2,342 61 73 68 67Sri Lanka7................................................................... 15 17 19 19 293 2,081 2,112 — 8,16 1,702 103 106 — 8,16 111Syrian Arab Republic .................................................. 9 12 16 17 93 1,556 2,452 2,835 2,985 100 108 109 115Thailand...................................................................... 47 56 61 62 121 7,393 6,957 6,179 16 6,113 99 99 95 97Turkey ......................................................................... 44 56 65 70 90 5,656 6,862 8 8,015 8 7,904 96 99 8 101 8 91Uzbekistan.................................................................. 16 21 25 25 61 1,391 1,778 — 2,513 81 81 — 103Viet Nam..................................................................... 54 67 79 81 247 7,887 8,862 9,751 8,841 109 103 106 101Yemen......................................................................... 8 12 18 19 35 — 24 2,679 8 2,644 2,950 — 24 79 8 79 83
EuropeBelarus7...................................................................... 10 10 10 10 48 750 615 8 551 437 104 95 8 109 102Belgium....................................................................... 10 10 10 10 314 842 719 772 762 104 101 105 105Czech Republic........................................................... 10 10 10 10 132 647 546 631 567 96 96 104 102France......................................................................... 54 57 59 59 108 4,610 4,149 3,838 3,792 111 108 105 104Germany33.................................................................. 78 79 82 82 231 3,636 3,431 3,519 3,304 — 101 104 99Greece........................................................................ 10 10 11 11 82 901 813 636 10 646 103 98 99 10 99Hungary7 .................................................................... 11 10 10 10 110 1,162 1,131 490 464 96 95 102 100Italy7 ........................................................................... 56 57 58 58 197 4,423 3,056 2,810 2,779 100 103 101 101Netherlands7............................................................... 14 15 16 16 477 1,333 1,082 1,282 1,291 100 102 108 108Poland7 ....................................................................... 36 38 39 39 127 4,167 5,189 3,221 10 3,105 100 98 100 10 100Portugal ...................................................................... 10 10 10 10 110 1,240 1,020 802 10 770 123 123 121 10 116Romania7.................................................................... 22 23 22 22 97 3,308 1,253 1,090 991 104 91 99 99Russian Federation..................................................... 139 148 146 144 9 6,009 7,596 5,702 5,417 102 109 109 118Spain7......................................................................... 38 39 39 41 82 3,610 2,820 2,505 2,488 109 109 105 108Ukraine7...................................................................... 50 52 50 49 84 3,592 3,991 — 1,961 102 89 — 93United Kingdom7 ........................................................ 56 58 60 59 244 4,911 4,533 4,596 10 4,536 103 104 99 10 100
North AmericaCanada ....................................................................... 25 28 31 31 3 2,185 2,376 2,456 8,10 2,482 99 103 100 8,10 101Cuba ........................................................................... 10 11 — — — 1,469 888 1,007 925 106 98 102 98Guatemala .................................................................. 7 9 11 12 111 803 1,165 1,909 2,076 71 78 102 106Mexico ........................................................................ 68 83 98 101 53 14,666 14,402 14,793 14,857 120 114 113 110United States .............................................................. 230 254 282 288 31 20,420 22,429 25,298 10 24,855 99 102 101 10 98
South AmericaArgentina .................................................................... 28 33 37 38 14 3,917 4,965 4,898 4,914 106 106 120 119Brazil........................................................................... 122 148 170 174 21 22,598 28,944 20,212 19,380 98 106 155 147Chile ........................................................................... 11 13 15 16 21 2,185 1,991 1,799 16 1,714 109 100 103 16 98Colombia .................................................................... 27 33 42 44 42 4,168 4,247 5,221 5,193 112 102 112 110Ecuador ...................................................................... 8 10 13 13 47 1,534 1,846 1,955 1,987 117 116 115 117Peru ............................................................................ 17 22 26 27 21 3,161 3,855 4,338 4,283 114 118 127 118Venezuela ................................................................... 15 20 24 25 28 3,158 4,053 3,347 3,450 93 96 102 104
OceaniaAustralia7 .................................................................... 15 17 19 20 3 1,718 1,583 1,906 1,934 112 108 102 104
DIGEST OF EDUCATION STATISTICS 2005

CHAPTER 6: International Comparisons of Education 639
17Excludes nonuniversity institutions (such as teacher training colleges and technical col-leges) and excludes distance-learning universities.18General education enrollment only. Excludes teacher training and vocational educationenrollments.19Data for 1981–82.20Does not include professional schools.21Includes initiation classes where students learn Portuguese.22Estimated.23Data for 1992–93.24Data for 1993–94.25Not including the former Independent States of Transke, Bophuthatswana, Venda, andCiskei.26Data refer to government aided and maintained schools only.27Data for 2004–05.28Day schools only.29Data for 1985–86.
30Includes preprimary education.31Excludes some nonuniversity institutions.32Includes full-time students only.33Data include both former East and West Germany.34As from 1980, change in structure.35Not including part-time students at community colleges.36Not including former ISCED level 7.37Including vocational education.38Data do not include Vocational Education and Training Institutes (VETS).NOTE: Some data have been revised from previously published figures. Detail may not sumto totals because of rounding.SOURCE: United Nations Educational, Scientific, and Cultural Organization (UNESCO), Sta-tistical Yearbook, 1999 and Global Education Digest, 2003, 2005. World Bank, World Devel-opment Indicators, 2000 and World Development Report, 2002, 2004. U.S. Department ofCommerce, Census Bureau, International Data Base. Retrieved on May 6, 2005 from http://www.census.gov/ipc/www/idbnew.html. (This table was prepared September 2005.)
Table 386. Selected population and enrollment statistics for countries with populations over 10 million, by continent: Selected years, 1980 through 2002—Continued
Second level3 Third level4
Enrollment in thousands Gross enrollment ratio5 Enrollment in thousands Gross enrollment ratio5
1980 1990 2000 2002 1980 1990 2000 2002 1980 1990 2000 2002 1980 1990 2000 2002
15 16 17 18 19 20 21 22 23 24 25 26 27 28 29 30
264,379 315,008 390,616 495,989 47 52 65 80 51,037 68,613 87,090 119,332 12 14 14 19
1,029 2,176 2,991 3,548 33 61 71 80 79 286 — 8 683 6 11 — 8 21191 186 8 400 10 414 21 12 8 18 10 19 2 7 — 13 # 1 — 1
28 99 199 237 3 7 10 11 2 5 — 8 16 # 1 — 8 1234 500 — 820 18 28 — 31 12 33 68 81 2 3 5 5198 361 8 664 — 19 22 8 23 — 20 13 30 — — 3 — — —862 13 1,097 — — 24 13 21 — — 28 80 — — 1 2 — —
2,929 5,507 8 8,324 8 8,384 50 76 8 86 8 85 716 14,15 628 — 2,154 16 16 — 29426 866 8 1,495 1,858 9 14 8 18 20 14 34 87 148 # 1 2 2693 — 1,031 16 1,277 41 36 36 16 42 8 17 10 64 16 70 2 1 3 16 3428 18 618 8 1,251 1,390 20 24 8 31 33 13 17 35 99 8,10 99 1 2 3 8,10 3
— 18 323 — — — 18 — — 23 36 31 33 3 3 2 226 61 8 488 8 518 5 8 8 36 8 33 3 5 — 5 1 1 — —— 84 — 351 8 7 — 20 19 4 5 — 8 28 1 1 — 8 2
20 797 1,194 — 1,758 20 26 35 — 45 112 256 310 336 6 11 10 1118 90 160 352 499 5 8 12 16 22 1 23 5 8 10 — # # 8 1 —
39 77 8 108 125 5 7 8 6 7 1 — 13 8,10 14 # 1 1 8,10 11,865 2,908 — 6,313 18 25 — 36 150 17,24 208 — 948 3 23,24 4 — 8
96 — 8 263 310 11 16 8 18 19 14 19 8 — — 3 3 — —— 2,742 4,142 8 4,312 — 74 87 8 88 — 25 439 645 675 — 13 15 15
384 732 — 1,291 16 24 — 35 29 14 60 — — 2 3 — —293 565 8 1,143 1,149 27 45 78 78 32 69 207 263 5 9 22 27
18,26 73 18,26 245 — 8 688 5 13 — 8 20 6 18 63 8 74 1 1 3 8 379 167 8 279 — 3 5 8 6 — — 13 7 22 31 0 0 — 1
102 190 8 283 351 16 24 8 24 28 — 15 8 25 — 1 2 8 2 —75 661 844 16 758 8 50 44 16 36 8 49 8 49 8,16 56 1 5 8 4 8,16 4
137 182 — 10 362 10 9 — 10 12 — 24 20 — — 2 1 —2,659 3,593 10,329 11,024 18 19 46 47 240 434 879 877 3 4 7 618 18 264 397 560 — 32 19 25 1 7 25 43 — 1 3 3
56,778 52,386 90,723 95,625 46 49 68 70 1,663 3,822 12,144 15,186 2 3 13 16469 18,28 431 478 8,10 480 64 80 78 8,10 78 17 12 13 85 128 10 134 10 13 19 25 10 26
32,748 18 54,180 — 81,240 30 44 — 53 3,545 4,951 — 11,295 5 6 — 125,722 10,965 14,828 15,873 29 44 57 61 543 13 1,773 3,018 3,441 4 9 15 162,718 5,085 9,091 10,024 29 45 55 78 78 14,29 184 14 312 734 1,714 29 5 10 10 211,033 18 1,024 — 1,478 57 47 — 43 107 29 170 — 8,10 318 9 29 12 — 8,10 149,558 11,026 8,606 10 8,394 93 97 102 10 103 2,412 13 2,899 3,972 10 3,967 31 30 48 10 491,996 2,144 2,032 2,067 93 98 88 92 525 537 8 446 603 34 40 8 31 45
— — 2,032 — — — — — — — — — — — — —4,286 4,560 3,959 3,662 78 90 94 90 648 1,691 3,003 3,210 15 39 78 851,084 1,456 2,205 2,300 48 56 70 70 58 121 549 632 4 7 28 291,066 1,281 8 2,318 2,383 22 23 8 39 39 163 13 196 553 8,10 555 5 4 12 8,10 12
512 709 8 1,350 1,822 22 33 8 51 45 14 34 94 103 125 3 5 5 52,166 4,345 12 5,772 5,734 14 23 12 25 23 29 268 — — 401 29 2 3 — 32,929 4,034 5,386 6,069 64 73 77 84 1,276 1,709 2,432 2,427 24 28 31 30
349 893 1,914 1,995 29 44 68 67 62 154 — 525 7 12 — 251,267 2,082 — 8,16 2,320 55 74 — 8,16 87 29 59 13,31 55 — — 3 5 — —
604 914 1,125 1,284 46 52 43 48 140 222 — — 17 18 — —1,920 2,230 5,577 16 5,010 29 30 82 16 77 19 911 23 1,156 2,096 16 2,251 15 23 19 35 16 392,218 3,808 — 8 5,742 35 47 — 8 79 246 750 1,607 1,918 5 13 24 282,879 3,195 — 4,161 105 99 — 95 516 603 — 394 28 30 — 16
18 3,847 6 3,236 8,321 9,266 42 32 67 72 115 130 750 8 797 2 2 10 8 10— 24 212 — 1,373 — 24 23 — 47 — 13 53 — — — 13 4 — —
760 968 8 981 998 98 93 8 84 91 340 335 438 489 39 48 56 62836 769 — 1,181 91 103 — 161 196 276 359 375 26 40 58 61
29 1,161 1,268 1,004 1,000 99 91 95 97 32 118 32 118 260 287 17 16 30 365,014 5,522 5,876 5,859 85 99 108 109 1,077 1,699 2,032 2,119 25 40 54 568,457 7,398 8,388 8,447 — 98 99 100 1,624 2,049 — 2,335 27 34 — 51
740 851 743 — 81 93 98 — 121 283 478 528 17 36 63 68357 514 — 1,030 70 79 — 106 101 102 331 390 14 14 40 51
5,308 5,118 4,473 4,528 72 83 96 99 1,118 1,452 1,812 1,913 27 32 50 571,391 1,402 1,403 1,415 93 120 124 122 360 479 504 527 29 40 55 581,674 1,888 3,974 — 77 81 101 — 589 545 1,775 10 1,906 18 22 56 10 60
34 398 670 813 10 797 37 67 114 10 115 92 186 388 10 397 11 23 50 10 531,148 2,838 2,249 2,218 94 92 82 85 193 193 533 644 12 10 27 35
12,991 13,956 13,858 8 14,486 96 93 83 8 95 5,700 5,100 7,224 8 8,151 46 52 64 8 693,977 4,755 3,183 3,053 87 104 116 117 698 1,222 1,834 1,841 23 37 59 623,406 3,408 — 4,824 94 93 — 97 1,684 1,652 — 2,296 42 47 — 625,342 4,336 8,374 10 9,577 83 85 156 10 178 827 1,258 2,067 10 2,241 19 30 60 10 64
2,323 2,292 2,621 8,10 2,622 88 101 106 8,10 105 35 1,173 1,917 1,212 8,10 1,193 57 95 59 8,10 581,146 1,002 837 938 81 89 85 93 152 242 178 236 17 21 25 34
172 13 295 504 608 19 13 23 37 43 51 23 70 — 112 8 23 8 — 94,742 6,704 9,357 10,188 49 53 75 79 930 1,311 2,048 2,237 14 15 21 22
21,585 19,270 23,087 10 23,196 91 93 95 10 93 12,097 13,710 13,596 10 15,928 56 75 73 10 81
1,327 2,160 3,832 3,976 56 71 97 100 491 13 1,008 — 2,027 22 13 38 — 602,819 3,499 26,097 26,789 33 38 108 110 1,409 36 1,540 2,781 3,579 11 11 17 21
538 720 1,391 16 1,557 53 73 85 16 91 145 13 262 452 16 567 12 13 21 38 16 451,733 13 2,378 3,569 3,723 39 50 70 71 272 487 934 990 9 13 23 24
592 18,37 786 936 973 53 55 57 59 270 207 — — 35 20 — —1,203 1,698 8 2,376 2,540 59 67 8 86 90 306 678 — 8 831 17 30 — 8 32
222 281 8 1,544 1,866 21 35 59 70 307 550 8 681 8 983 21 29 8 29 8 40
1,100 1,278 2,589 2,514 71 82 161 154 38 324 38 485 845 1,012 25 36 63 74
DIGEST OF EDUCATION STATISTICS 2005

640 CHAPTER 6: International Comparisons of Education
_
—Not available.1Data are for the 5- to 13-year-old population.2Data are for the 14- to 17-year-old population.
3Data for 1985 are for the former West Germany.SOURCE: Organization for Economic Cooperation and Development (OECD), Educationat a Glance, selected years, 1987 through 2004. (This table was prepared April 2005.)
Table 387. School-age populations as a percentage of total population, by age group and country: Selected years,1985 through 2002
Country
5- to 14-year-olds as a percent of total population 15- to 19-year-olds as a percent of total population
19851 19901 19951 1996 1998 1999 2002 19852 19902 19952 1996 1998 1999 2002
1 2 3 4 5 6 7 8 9 10 11 12 13 14 15
Australia..................................... 14 13 13 14 14 14 14 7 6 6 7 7 7 7Belgium...................................... 11 11 11 12 12 12 12 6 5 5 6 6 6 6Canada ...................................... 13 12 12 13 14 14 — 6 5 5 7 7 7 —Czech Republic.......................... — — 12 13 13 12 12 — — 6 8 8 7 7Denmark .................................... 12 10 10 11 11 12 12 6 6 5 6 6 5 5
Finland....................................... 11 12 11 13 13 13 12 6 5 5 6 6 6 6France........................................ 13 12 12 13 13 13 12 6 6 5 7 7 7 7Germany3 .................................. 9 9 10 11 11 11 11 6 4 4 5 6 6 6Greece....................................... — — 11 12 11 11 10 — 5 6 7 7 7 6Iceland ....................................... 16 15 14 16 16 16 16 7 7 6 8 8 8 7
Ireland........................................ 18 18 15 17 16 15 14 8 8 8 9 9 9 8Italy ............................................ 13 10 9 10 10 10 10 6 6 5 6 6 5 5Japan......................................... 14 12 10 11 11 10 10 6 7 5 7 6 6 6Korea, Republic of ..................... — — 14 15 14 14 14 — — 7 9 9 8 7Luxembourg............................... 10 10 11 12 12 12 13 5 4 4 5 6 6 6
Netherlands ............................... 12 11 11 12 12 12 12 7 5 5 6 6 6 6New Zealand.............................. 15 13 13 15 15 15 15 7 7 6 7 7 7 7Norway....................................... 13 11 11 13 13 13 13 6 6 5 6 6 6 6Russian Federation.................... — — 14 16 — 14 12 — — 6 7 — 8 8Spain ......................................... 15 13 10 11 11 10 10 7 7 6 8 7 7 6
Sweden...................................... 11 10 11 12 13 13 13 5 5 5 6 6 6 6Switzerland ................................ 11 10 10 12 12 12 12 6 5 5 6 6 6 6Turkey ........................................ 21 21 20 20 21 21 — 9 9 9 11 11 11 —United Kingdom ......................... 11 11 12 13 13 13 13 6 5 5 6 6 6 6United States ............................. 13 13 13 15 14 15 15 6 5 6 7 7 7 7
DIGEST OF EDUCATION STATISTICS 2005

CHAPTER 6: International Comparisons of Education 641
—Not available.1Includes full-time and part-time enrollment.2Data for Flemish Belgium only.3Data for 1985 are for the former West Germany.4Postsecondary includes higher education only.NOTE: Data in this table refer to programs classified by the Organization for EconomicCooperation and Development (OECD) as International Standard Classification of Edu-cation (ISCED) level 3, level 5A (first and second award), level 5B, and level 6. Itincludes both full-time and part-time students. ISCED 3 corresponds to secondary edu-cation in the United States. ISCED 5A (first and second award), ISCED 5B, and ISCED6 correspond to 2-year and 4-year college undergraduate and graduate programs in the
United States. Some increases in enrollment rates may be due to more completereporting by countries. Enrollment figures may not be directly comparable due to differ-ing definitions of postsecondary education and the age at which postsecondary educa-tion begins. Differences in reference dates between enrollment and population data canresult in enrollment rates that exceed 100 percent.SOURCE: Organization for Economic Cooperation and Development (OECD), Educa-tion at a Glance, selected years, 1987 through 2004; and Education Online Database,2002. Retrieved May 25, 2005 from http://stats.oecd.org/WBOS/Default/aspx. U.S.Department of Commerce, Census Bureau, Current Population Survey (CPS), October2000 through October 2003. (This table was prepared July 2005.)
Table 388. Percentage of population enrolled in secondary and postsecondary institutions, by age group and country: Selected years, 1985 through 2002
Country
Secondaryschools, 16years old,1
2002
Secondaryschools, 17years old,1
2002
Postsecondary institutions
18 to 21 years old 22 to 25 years old 26 to 29 years old
1985 1990 1999 2002 1985 1990 1999 2002 1985 1990 1999 2002
1 2 3 4 5 6 7 8 9 10 11 12 13 14 15
Australia................................. 92 80 — — 31 35 — — 15 20 — — 8 10Austria ................................... 91 78 — — 15 14 — — 20 17 — — 12 8Belgium2 ................................ 99 101 25 — 42 42 7 — 15 18 2 — 3 5Canada .................................. — — — — 27 — — — 18 — — — 7 —Czech Republic...................... 100 98 — — 17 20 — — 12 16 — — 4 5
Denmark ................................ 91 83 7 7 8 10 16 18 27 29 8 9 15 16Finland................................... 96 94 9 14 23 21 17 21 35 39 8 10 18 19France.................................... 97 89 19 25 35 35 10 12 20 20 4 4 5 5Germany3 .............................. 99 93 9 9 11 12 — 16 19 20 9 10 11 12Greece................................... 93 70 — — 54 46 — — 7 24 — — 2 11
Hungary................................. 90 85 — — 20 24 — — 14 18 — — 5 7Iceland ................................... 91 81 — — 7 10 — — 21 23 — — 9 11Ireland.................................... 92 72 — 21 33 — — — 11 — — — 3 —Italy ........................................ 86 79 — — 22 24 — — 21 21 — — 7 8Japan..................................... 97 93 — — — — — — — — — — — —
Korea, Republic of ................. 95 89 — — 51 56 — — 26 32 — — 6 7Mexico ................................... 47 34 — — 12 15 — — 8 7 — — 1 3Netherlands ........................... 100 83 14 18 26 28 12 13 20 22 6 5 5 6New Zealand.......................... 85 65 — 21 29 30 — 15 14 17 — — 8 8Norway................................... 94 93 9 14 19 17 14 17 28 27 6 8 12 13
Poland.................................... 94 91 — — 21 26 — — 21 26 — — 5 7Portugal ................................. 81 70 6 — 25 25 5 — 17 20 2 — 6 8Spain ..................................... 95 82 15 21 32 35 11 14 24 24 4 5 8 8Sweden.................................. 97 96 8 9 16 17 11 11 25 28 7 6 12 13Switzerland ............................ 89 85 6 6 10 10 11 12 17 18 5 6 9 9
Turkey .................................... — — — 7 14 — — 4 9 — — 2 4 —United Kingdom ..................... 87 74 15 16 29 30 7 11 12 12 — — 6 6United States4 ....................... 84 79 37 41 44 46 15 17 18 25 8 9 11 11
DIGEST OF EDUCATION STATISTICS 2005

642C
HA
PT
ER
6: International Com
parisons of Education
DIG
ES
T O
F E
DU
CAT
ION
STAT
IST
ICS
2005
grades 1 through 6; junior high school corresponds to grades 7through 12.lopment (OECD), Education Online Database; Annual Nationalugh 2005. (This table was prepared October 2005.)
003
Senior high school (upper secondary)
1990 1996 2000 2001 2002 2003
17 18 19 20 21 22
— — — — 12.5 2 12.412.4 8.5 — 9.9 10.3 10.2
— — — — 9.3 9.615.3 19.5 19.5 17.2 — —13.3 12.1 14.4 13.9 14.2 13.4
— — 10.4 11.2 10.6 10.621.0 13.1 13.9 13.7 13.6 13.7
8.3 — — — 14.3 13.710.7 9.8 10.2 10.4 10.3 10.816.2 15.6 14.0 14.0 13.7 13.5
— — — — 15.9 15.7— 14.1 13.1 12.8 13.8 10.9— — 9.7 9.2 9.2 1 9.2— — 7.9 8.0 7.5 —
14.8 14.2 — — 8.3 7.9
11.9 15.2 15.2 16.6 14.1 14.112.1 — 14.0 17.2 17.7 18.013.9 15.3 2 12.5 2 12.3 2 12.5 2 12.615.8 14.7 14.1 14.8 15.6 15.6
_
—Not available.1Public schools only.2Includes only general programs in lower and upper secondary education.3Data for 1985 are for the former West Germany.
NOTE: In this table, U.S. data for elementary correspond to through 9; and senior high school corresponds to grades 10 SOURCE: Organization for Economic Cooperation and DeveAccounts, Vol. 1, 1997; and Education at a Glance, 2002 thro
Table 389. Pupils per teacher in public and private elementary and secondary schools, by level of education and country: Selected years, 1985 to 2
Country
Elementary Junior high school (lower secondary)
1985 1990 1996 2000 2001 2002 2003 1985 1990 1996 2000 2001 2002 2003 1985
1 2 3 4 5 6 7 8 9 10 11 12 13 14 15 16
Australia.......................................... 1 13.8 — 18.1 17.3 17.0 16.9 16.6 — — — — — 12.5 2 12.4 3.2Austria ............................................ 11.3 11.6 12.7 — 14.3 14.4 14.4 9.2 7.7 9.2 — 9.8 9.8 10.0 15.2Belgium........................................... — — — 15.0 13.4 13.1 13.1 — — — — — 9.3 10.6 —Canada ........................................... 18.1 17.1 17.0 18.1 18.3 — — 16.0 15.5 20.0 18.1 18.4 — — 16.0Denmark ......................................... 12.7 11.2 11.2 10.4 10.0 10.9 10.8 10.2 9.3 10.1 11.4 11.1 10.9 10.8 14.8
France............................................. — — 19.5 19.8 19.5 19.4 19.4 — — — 14.7 13.5 13.7 13.7 —Germany3 ....................................... 20.7 20.3 20.9 19.8 19.4 18.9 18.7 16.9 14.6 16.0 15.7 15.7 15.7 15.6 23.7Ireland............................................. — — 22.6 21.5 20.3 19.5 18.7 — — — 15.9 15.2 14.3 13.7 7.2Italy ................................................. 12.8 10.7 11.2 11.0 10.8 10.6 10.9 9.6 8.5 10.8 10.4 9.9 9.9 10.3 10.8Japan.............................................. — 1 20.8 19.7 20.9 20.6 20.3 19.9 — 18.6 16.2 16.8 16.6 16.2 15.7 —
Netherlands .................................... 20.2 19.2 20.0 16.8 17.2 17.0 16.0 12.7 12.4 — — — 15.9 15.7 —New Zealand................................... 20.1 19.1 22.0 20.6 19.6 19.6 19.9 — — 18.1 19.9 18.7 19.4 18.8 —Norway............................................ — — — 12.4 11.6 11.5 1 11.7 — — — 9.9 9.3 10.3 1 10.4 —Portugal .......................................... — — — 12.1 11.6 11.0 — — — — 10.4 9.9 9.3 — —Spain .............................................. 26.8 21.2 18.0 14.9 14.7 14.6 14.3 21.4 18.8 17.8 — — 13.7 13.3 15.3
Sweden........................................... 11.6 10.6 12.7 12.8 12.4 12.5 12.3 10.8 10.2 12.2 12.8 12.4 12.2 12.1 13.1Turkey ............................................. 31.1 30.6 — 30.5 29.8 27.5 25.9 41.3 48.4 — — — — — 11.0United Kingdom .............................. 19.7 22.0 21.3 21.2 20.5 19.9 2 20.0 — 18.5 16.0 2 17.6 2 17.3 2 17.6 2 17.4 11.1United States .................................. 17.0 15.6 16.9 15.8 16.3 15.5 15.5 16.5 15.9 17.5 16.3 17.0 15.5 15.5 16.2

CHAPTER 6: International Comparisons of Education 643
_
1Overall participation rate less than 85 percent.2National Desired Population does not cover all International Desired Population.3Did not meet age/grade specification.
NOTE: The international mean for these scales was set at 100 with a standard deviation of20. Standard errors appear in parentheses.SOURCE: International Association for the Evaluation of Educational Achievement (IEA),IEA Civic Education Study, 2001. (This table was prepared August 2002.)
Table 390. Civic knowledge and civic engagement of 14-year-old students, by country: 1999
Country Civics scale score
Percentage ofstudents
who say that theyare very likely or
likely to vote innational elections
Percentage of students who believe that it is important or very important that a good citizen:
Votes in everyelection
Joins a politicalparty
Engagesin political
discussions
Participates inactivities to benefit
people in thecommunity
Takes part inactivities
to protect theenvironment
1 2 3 4 5 6 7 8
OECD countries
Australia............................................................... 102 (0.8) 85 (1.0) 89 (0.8) 17 (1.0) 34 (1.1) 80 (1.0) 74 (1.1)Belgium (French)1................................................ 95 (0.9) 69 (2.0) 82 (1.4) 24 (1.0) 39 (1.4) 54 (2.0) 71 (1.7)Czech Republic.................................................... 103 (0.8) 65 (1.7) 66 (1.1) 18 (1.0) 29 (1.4) 78 (0.9) 84 (1.0)Denmark1 ............................................................ 100 (0.5) 91 (0.7) 60 (1.0) 17 (0.8) 44 (0.9) 86 (0.8) 83 (0.7)England ............................................................... 99 (0.6) 80 (1.0) 76 (1.1) 20 (0.9) 42 (1.3) 78 (1.0) 76 (1.1)
Finland................................................................. 109 (0.7) 87 (0.7) 59 (1.2) 13 (0.8) 23 (1.1) 60 (1.0) 74 (1.0)Germany2 ............................................................ 100 (0.5) 67 (1.1) 69 (0.9) 18 (0.7) 43 (1.2) 85 (0.9) 72 (1.2)Greece................................................................. 108 (0.8) 86 (0.9) 94 (0.6) 49 (1.0) 59 (1.0) 90 (0.7) 89 (0.7)Hungary............................................................... 102 (0.6) 91 (0.7) 81 (0.9) 29 (0.9) 21 (0.8) 89 (0.6) 77 (1.0)Italy ...................................................................... 105 (0.8) 80 (1.1) 84 (0.7) 32 (1.0) 49 (1.0) 82 (0.7) 79 (0.8)
Norway1 ............................................................... 103 (0.5) 87 (0.7) 71 (0.9) 21 (0.8) 37 (1.0) 83 (0.8) 91 (0.6)Poland.................................................................. 111 (1.7) 88 (1.2) 91 (0.8) 35 (1.2) 53 (1.4) 90 (0.8) 77 (0.8)Portugal ............................................................... 96 (0.7) 88 (0.8) 71 (0.9) 36 (1.1) 40 (1.0) 94 (0.6) 92 (0.6)Slovak Republic ................................................... 105 (0.7) 93 (0.6) 91 (0.7) 23 (1.3) 51 (1.0) 87 (0.8) 87 (0.8)Sweden................................................................ 99 (0.8) 75 (1.4) 78 (1.0) 21 (0.9) 37 (1.5) 83 (1.2) 81 (1.3)
Switzerland .......................................................... 98 (0.8) 55 (1.3) 68 (1.2) 23 (1.1) 42 (1.2) 76 (0.9) 70 (1.2)United States ....................................................... 106 (1.2) 85 (1.0) 83 (0.9) 48 (1.4) 58 (1.1) 88 (0.8) 83 (0.8)
Non-OECD countries
Chile .................................................................... 88 (0.7) 74 (1.0) 91 (0.6) 46 (1.0) 34 (1.1) 88 (0.7) 90 (0.5)Russian Federation3 ............................................ 100 (1.3) 82 (1.0) 80 (1.2) 22 (1.4) 28 (1.4) 83 (1.1) 81 (1.3)Slovenia ............................................................... 101 (0.5) 84 (1.0) 80 (0.8) 30 (0.9) 38 (1.0) 78 (0.8) 73 (1.0)
DIGEST OF EDUCATION STATISTICS 2005

644C
HA
PT
ER
6: International Com
parisons of Education
DIG
ES
T O
F E
DU
CAT
ION
STAT
IST
ICS
2005
oints and standard deviation of 100. Possible scores range from 0 to
lopment (OECD), Program for International Student Assessmentm Solving for Tomorrow's World, 2003. U.S. Department of Educa-ational Outcomes of Learning in Mathematics Literacy and Problem
Problem solving
Female Total Male Female
10 11 12 13
(1.3) 490 (1.2) 489 (1.4) 490 (1.3)(0.8) 500 (0.6) 499 (0.8) 501 (0.8)
(2.8) 530 (2.0) 527 (2.7) 533 (2.5)(4.2) 506 (3.2) 505 (3.9) 508 (3.8)(3.5) 525 (2.2) 524 (3.1) 527 (3.2)(2.2) 529 (1.7) 533 (2.0) 532 (1.8)(4.1) 516 (3.4) 520 (4.1) 513 (4.3)
(3.2) 517 (2.5) 519 (3.1) 514 (2.9)(2.2) 548 (1.9) 543 (2.5) 553 (2.2)(3.5) 519 (2.7) 519 (3.8) 520 (2.9)(4.2) 513 (3.2) 511 (3.9) 517 (3.7)(3.9) 449 (4.0) 449 (4.9) 448 (4.1)
(3.3) 501 (2.9) 499 (3.4) 503 (3.4)(2.4) 505 (1.4) 490 (2.2) 520 (2.5)(3.9) 498 (2.3) 499 (2.8) 498 (3.5)(3.6) 470 (3.1) 467 (5.0) 471 (3.5)(4.1) 547 (4.1) 546 (5.7) 548 (4.1)
(5.5) 550 (3.1) 554 (4.0) 546 (4.8)(1.9) 494 (1.4) 495 (2.4) 492 (1.9)(4.2) 384 (4.3) 387 (5.0) 382 (4.7)(3.6) 520 (3.0) 522 (3.6) 518 (3.6)(3.4) 533 (2.2) 531 (2.6) 534 (3.1)
(3.3) 490 (2.6) 486 (3.1) 494 (3.2)(3.4) 487 (2.8) 486 (3.4) 487 (3.0)(3.6) 470 (3.9) 470 (4.6) 470 (3.9)(3.9) 492 (3.4) 495 (4.1) 488 (3.6)(2.6) 482 (2.7) 479 (3.6) 485 (2.6)
(3.5) 509 (2.4) 504 (3.0) 514 (2.8)(3.9) 521 (3.0) 520 (4.0) 523 (3.3)(6.4) 408 (6.0) 408 (7.3) 406 (5.8)(4.0) 510 (2.4) 506 (3.0) 514 (3.5)(3.5) 477 (3.1) 477 (3.4) 478 (3.5)
(4.3) 371 (4.8) 374 (6.0) 368 (4.3)(4.2) 548 (4.2) 545 (6.2) 550 (4.0)(3.8) 361 (3.3) 358 (3.1) 365 (4.0)(3.9) 483 (3.9) 481 (5.1) 484 (4.0)(7.3) 529 (3.9) 535 (6.6) 524 (5.9)(4.0) 532 (2.5) 538 (4.3) 527 (3.2)(4.0) 479 (4.6) 480 (5.9) 477 (4.4)(4.2) 420 (3.3) 416 (3.8) 424 (3.9)(3.1) 425 (2.7) 418 (3.9) 431 (3.1)(3.0) 345 (2.1) 346 (2.5) 343 (2.5)(3.6) 411 (3.7) 412 (4.6) 409 (4.2)
1Illustrates how a country compares with the OECD area as a whole. Computed taking the OECD countries as a single entity, towhich each country contributes in proportion to the number of 15-year-olds enrolled in its schools.2Refers to the mean of the data values for all OECD countries, to which each country contributes equally, regardless of the absolutesize of the student population of each country.3Response rate is too low to ensure comparability with other countries.
NOTE: Scales were designed to have an average score of 500 p1000. Standard errors appear in parentheses.SOURCE: Organization for Economic Cooperation and Deve(PISA), 2003, Learning for Tomorrow's World, 2003, and Probletion, National Center for Education Statistics, PISA, 2003, InternSolving, 2003. (This table was prepared March 2005.)
Table 391. Average mathematics literacy, reading literacy, science literacy, and problem-solving scores of 15-year-olds, by sex and country: 2003
Country
Mathematics literacy Reading literacy Science literacy
Total Male Female Total Male Female Total Male
1 2 3 4 5 6 7 8 9
OECD total1 ........................................ 489 (1.1) 494 (1.3) 484 (1.3) 488 (1.2) 472 (1.4) 503 (1.3) 496 (1.1) 499 (1.3) 493OECD average2 .................................. 500 (0.6) 506 (0.8) 494 (0.8) 494 (0.6) 477 (0.7) 511 (0.7) 500 (0.6) 503 (0.7) 497
Australia.................................................... 524 (2.1) 527 (3.0) 522 (2.7) 525 (2.1) 506 (2.8) 545 (2.6) 525 (2.1) 525 (2.9) 525Austria ...................................................... 506 (3.3) 509 (4.0) 502 (4.0) 491 (3.8) 467 (4.5) 514 (4.2) 491 (3.4) 490 (4.3) 492Belgium..................................................... 529 (2.3) 533 (3.4) 525 (3.2) 507 (2.6) 489 (3.8) 526 (3.3) 509 (2.5) 509 (3.6) 509Canada ..................................................... 532 (1.8) 541 (2.1) 530 (1.9) 528 (1.7) 514 (2.0) 546 (1.8) 519 (2.0) 527 (2.3) 516Czech Republic......................................... 516 (3.5) 524 (4.3) 509 (4.4) 489 (3.5) 473 (4.1) 504 (4.4) 523 (3.4) 526 (4.3) 520
Denmark ................................................... 514 (2.7) 523 (3.4) 506 (3.0) 492 (2.8) 479 (3.3) 505 (3.0) 475 (3.0) 484 (3.6) 467Finland...................................................... 544 (1.9) 548 (2.5) 541 (2.1) 543 (1.6) 521 (2.2) 565 (2.0) 548 (1.9) 545 (2.6) 551France....................................................... 511 (2.5) 515 (3.6) 507 (2.9) 496 (2.7) 476 (3.8) 514 (3.2) 511 (3.0) 511 (4.1) 511Germany................................................... 503 (3.3) 508 (4.0) 499 (3.9) 491 (3.4) 471 (4.2) 513 (3.9) 502 (3.6) 506 (4.5) 500Greece...................................................... 445 (3.9) 455 (4.8) 436 (3.8) 472 (4.1) 453 (5.1) 490 (4.0) 481 (3.8) 487 (4.8) 475
Hungary.................................................... 490 (2.8) 494 (3.3) 486 (3.3) 482 (2.5) 467 (3.2) 498 (3.0) 503 (2.8) 503 (3.3) 504Iceland ...................................................... 515 (1.4) 508 (2.3) 523 (2.2) 492 (1.6) 464 (2.3) 522 (2.2) 495 (1.5) 490 (2.4) 500Ireland....................................................... 503 (2.4) 510 (3.0) 495 (3.4) 515 (2.6) 501 (3.3) 530 (3.7) 505 (2.7) 506 (3.1) 504Italy ........................................................... 466 (3.1) 475 (4.6) 457 (3.8) 476 (3.0) 455 (5.1) 495 (3.4) 486 (3.1) 490 (5.2) 484Japan........................................................ 534 (4.0) 539 (5.8) 530 (4.0) 498 (3.9) 487 (5.5) 509 (4.1) 548 (4.1) 550 (6.0) 546
Korea, Republic of .................................... 542 (3.2) 552 (4.4) 528 (5.3) 534 (3.1) 525 (3.7) 547 (4.3) 538 (3.5) 546 (4.7) 527Luxembourg.............................................. 493 (1.0) 502 (1.9) 485 (1.5) 479 (1.5) 463 (2.6) 496 (1.8) 483 (1.5) 489 (2.5) 477Mexico ...................................................... 385 (3.6) 391 (4.3) 380 (4.1) 400 (4.1) 389 (4.6) 410 (4.6) 405 (3.5) 410 (3.9) 400Netherlands .............................................. 538 (3.1) 540 (4.1) 535 (3.5) 513 (2.9) 503 (3.7) 524 (3.2) 524 (3.1) 527 (4.2) 522New Zealand............................................. 523 (2.3) 531 (2.8) 516 (3.2) 522 (2.5) 508 (3.1) 535 (3.3) 521 (2.4) 529 (3.0) 513
Norway...................................................... 495 (2.4) 498 (2.8) 492 (2.9) 500 (2.8) 475 (3.4) 525 (3.4) 484 (2.9) 485 (3.5) 483Poland....................................................... 490 (2.5) 493 (3.0) 487 (2.9) 497 (2.9) 477 (3.6) 516 (3.2) 498 (2.9) 501 (3.2) 494Portugal .................................................... 466 (3.4) 472 (4.2) 460 (3.4) 478 (3.7) 459 (4.3) 495 (3.7) 468 (3.5) 471 (4.0) 465Slovak Republic ........................................ 498 (3.3) 507 (3.9) 489 (3.6) 469 (3.1) 453 (3.8) 486 (3.3) 495 (3.7) 502 (4.3) 487Spain ........................................................ 485 (2.4) 490 (3.4) 481 (2.2) 481 (2.6) 461 (3.8) 500 (2.5) 487 (2.6) 489 (3.9) 485
Sweden..................................................... 509 (2.6) 512 (3.0) 506 (3.1) 514 (2.4) 496 (2.8) 533 (2.9) 506 (2.7) 509 (3.1) 504Switzerland ............................................... 527 (3.4) 535 (4.7) 518 (3.6) 499 (3.3) 482 (4.4) 517 (3.1) 513 (3.7) 518 (5.0) 508Turkey ....................................................... 423 (6.7) 430 (7.9) 415 (6.7) 441 (5.8) 426 (6.8) 459 (6.1) 434 (5.9) 434 (6.7) 434United Kingdom3 ...................................... 508 (2.4) 512 (2.9) 505 (3.9) 507 (2.5) 492 (3.1) 520 (3.6) 518 (2.5) 520 (3.1) 517United States ............................................ 483 (2.9) 486 (3.3) 480 (3.2) 495 (3.2) 479 (3.7) 511 (3.5) 491 (3.1) 494 (3.5) 489
Non-OECD countriesBrazil ..................................................... 356 (4.8) 365 (6.1) 348 (4.4) 403 (4.6) 384 (5.8) 419 (4.1) 390 (4.3) 393 (5.3) 387Hong Kong-China ................................. 550 (4.5) 552 (6.5) 548 (4.6) 510 (3.7) 494 (5.3) 525 (3.5) 539 (4.3) 538 (6.1) 541Indonesia .............................................. 360 (3.9) 362 (3.9) 358 (4.6) 382 (3.4) 369 (3.4) 394 (3.9) 395 (3.2) 396 (3.1) 394Latvia .................................................... 483 (3.7) 485 (4.8) 482 (3.6) 491 (3.7) 470 (4.5) 509 (3.7) 489 (3.9) 487 (5.1) 491Liechtenstein......................................... 536 (4.1) 550 (7.2) 521 (6.3) 525 (3.6) 517 (7.2) 534 (6.5) 525 (4.3) 538 (7.7) 512Macao-China ........................................ 527 (2.9) 538 (4.8) 517 (3.3) 498 (2.2) 491 (3.6) 504 (2.8) 525 (3.0) 529 (5.0) 521Russian Federation............................... 468 (4.2) 473 (5.3) 463 (4.2) 442 (3.9) 428 (4.7) 456 (3.7) 489 (4.1) 494 (5.3) 485Serbia and Montenegro ........................ 437 (3.8) 437 (4.2) 436 (4.5) 412 (3.6) 390 (3.7) 433 (3.9) 436 (3.5) 434 (3.7) 439Thailand ................................................ 417 (3.0) 415 (4.0) 419 (3.4) 420 (2.8) 396 (3.7) 439 (3.0) 429 (2.7) 425 (3.7) 433Tunisia................................................... 359 (2.5) 365 (2.7) 353 (2.9) 375 (2.8) 362 (3.3) 387 (3.3) 385 (2.6) 380 (2.7) 390Uruguay ................................................ 422 (3.3) 428 (4.0) 416 (3.8) 434 (3.4) 414 (4.5) 453 (3.7) 438 (2.9) 441 (3.7) 436

CHAPTER 6: International Comparisons of Education 645
_
†Not applicable.#Rounds to zero.1Less than or equal to 357.77 score points. Does not meet the requirements for proficiencyat level 1.2A score greater than 357.77 and less than or equal to 420.07. Indicates an ability toanswer questions involving familiar contexts where all relevant information is present andthe questions are clearly defined.3A score greater than 420.07 and less than or equal to 482.38. Indicates an ability to inter-pret and recognize situations in contexts that require no more than direct inference, extractrelevant information from a single source, and employ direct reasoning for literal interpreta-tions of results.4A score greater than 482.38 and less than or equal to 544.68. Indicates an ability to exe-cute clearly described procedures, interpret and use representations based on differentinformation sources, and develop short communications reporting their interpretations,results, and reasoning.5A score greater than 544.68 and less than or equal to 606.99. Indicates an ability to workeffectively with explicit models for complex concrete situations that may involve constraintsor call for making assumptions, select and integrate different representations, reason withsome insight, and construct and communicate explanations and arguments based on theirinterpretations and actions.
6A score greater than 606.99 and less than or equal to 669.3. Indicates an ability to developand work with models for complex situations, work strategically using broad, well-developedthinking and reasoning skills, and communicate their interpretations and reasoning.7A score greater than 669.3. Indicates an ability to conceptualize, generalize, and utilizeinformation, link different information sources and representations, and formulate and pre-cisely communicate actions and reflections regarding findings and interpretations.8Illustrates how a country compares with the OECD area as a whole. Computed by takingthe OECD countries as a single entity to which each country contributes in proportion to thenumber of 15-year-olds enrolled in its schools.9Refers to the mean of the data values for all OECD countries, to which each country con-tributes equally, regardless of the absolute size of the student population of each country.10Response rate was too low to ensure comparability with other countries.NOTE: Mean score was designed to have an average of 500 points, and a standard devia-tion of 100. Standard errors appear in parentheses. Possible scores range from 0 to 1000.Detail may not sum to totals because of rounding.SOURCE: Organization for Economic Cooperation and Development, Program for Interna-tional Student Assessment (PISA), 2003, Learning for Tomorrow's World, 2003. U.S.Department of Education, National Center for Education Statistics, PISA, 2003, Interna-tional Outcomes of Learning in Mathematics Literacy and Problem Solving: PISA 2003Results From the U.S. Perspective. (This table was prepared March 2005.)
Table 392. Mean scores and percentage distribution of 15-year-olds scoring at each mathematics literacy proficiency level, by country: 2003
Country Mean score
Percentage distribution at levels of proficiency
Below Level 11 Level 12 Level 23 Level 34 Level 45 Level 56 Level 67
1 2 3 4 5 6 7 8 9
OECD total8 .............................. 489 (1.07) 11.0 (0.32) 14.6 (0.32) 21.2 (0.28) 22.4 (0.32) 17.6 (0.25) 9.6 (0.19) 3.5 (0.19)OECD average9 ........................ 500 (0.63) 8.2 (0.17) 13.2 (0.16) 21.1 (0.15) 23.7 (0.18) 19.1 (0.17) 10.6 (0.13) 4.0 (0.10)
Australia.......................................... 524 (2.15) 4.3 (0.45) 10.0 (0.51) 18.6 (0.62) 24.0 (0.71) 23.3 (0.64) 14.0 (0.53) 5.8 (0.45)Austria ............................................ 506 (3.27) 5.6 (0.70) 13.2 (0.84) 21.6 (0.90) 24.9 (1.14) 20.5 (0.84) 10.5 (0.85) 3.7 (0.52)Belgium........................................... 529 (2.29) 7.2 (0.56) 9.3 (0.49) 15.9 (0.65) 20.1 (0.71) 21.0 (0.62) 17.5 (0.69) 9.0 (0.48)Canada ........................................... 532 (1.82) 2.4 (0.26) 7.7 (0.36) 18.3 (0.61) 26.2 (0.67) 25.1 (0.60) 14.8 (0.55) 5.5 (0.45)Czech Republic............................... 516 (3.55) 5.0 (0.69) 11.6 (0.90) 20.1 (0.96) 24.3 (0.95) 20.8 (0.87) 12.9 (0.80) 5.3 (0.53)
Denmark ......................................... 514 (2.74) 4.7 (0.50) 10.7 (0.62) 20.6 (0.89) 26.2 (0.88) 21.9 (0.83) 11.8 (0.86) 4.1 (0.50)Finland............................................ 544 (1.87) 1.5 (0.23) 5.3 (0.38) 16.0 (0.57) 27.7 (0.65) 26.1 (0.89) 16.7 (0.64) 6.7 (0.46)France............................................. 511 (2.50) 5.6 (0.68) 11.0 (0.77) 20.2 (0.82) 25.9 (0.99) 22.1 (0.97) 11.6 (0.72) 3.5 (0.40)Germany......................................... 503 (3.32) 9.2 (0.84) 12.4 (0.81) 19.0 (1.05) 22.6 (0.82) 20.6 (1.02) 12.2 (0.87) 4.1 (0.48)Greece............................................ 445 (3.90) 17.8 (1.21) 21.2 (1.15) 26.3 (1.04) 20.2 (1.01) 10.6 (0.87) 3.4 (0.53) 0.6 (0.17)
Hungary.......................................... 490 (2.84) 7.8 (0.80) 15.2 (0.81) 23.8 (1.05) 24.3 (0.93) 18.2 (0.90) 8.2 (0.73) 2.5 (0.42)Iceland ............................................ 515 (1.42) 4.5 (0.40) 10.5 (0.55) 20.2 (1.02) 26.1 (0.88) 23.2 (0.81) 11.7 (0.61) 3.7 (0.36)Ireland............................................. 503 (2.45) 4.7 (0.57) 12.1 (0.84) 23.6 (0.83) 28.0 (0.82) 20.2 (1.06) 9.1 (0.76) 2.2 (0.33)Italy ................................................. 466 (3.08) 13.2 (1.19) 18.7 (0.93) 24.7 (1.03) 22.9 (0.84) 13.4 (0.73) 5.5 (0.43) 1.5 (0.19)Japan.............................................. 534 (4.02) 4.7 (0.65) 8.6 (0.72) 16.3 (0.80) 22.4 (1.02) 23.6 (1.24) 16.1 (0.96) 8.2 (1.14)
Korea, Republic of .......................... 542 (3.24) 2.5 (0.32) 7.1 (0.65) 16.6 (0.80) 24.1 (0.98) 25.0 (1.08) 16.7 (0.81) 8.1 (0.93)Luxembourg.................................... 493 (0.97) 7.4 (0.41) 14.3 (0.65) 22.9 (0.87) 25.9 (0.79) 18.7 (0.85) 8.5 (0.59) 2.4 (0.31)Mexico ............................................ 385 (3.64) 38.1 (1.71) 27.9 (1.02) 20.8 (0.87) 10.1 (0.84) 2.7 (0.39) 0.4 (0.10) # (†)Netherlands .................................... 538 (3.13) 2.6 (0.65) 8.4 (0.95) 18.0 (1.11) 23.0 (1.14) 22.6 (1.34) 18.2 (1.09) 7.3 (0.58)New Zealand................................... 523 (2.26) 4.9 (0.44) 10.1 (0.63) 19.2 (0.71) 23.2 (0.90) 21.9 (0.80) 14.1 (0.60) 6.6 (0.44)
Norway............................................ 495 (2.38) 6.9 (0.50) 13.9 (0.82) 23.7 (1.16) 25.2 (1.01) 18.9 (1.00) 8.7 (0.57) 2.7 (0.35)Poland............................................. 490 (2.50) 6.8 (0.61) 15.2 (0.76) 24.8 (0.75) 25.3 (0.94) 17.7 (0.89) 7.8 (0.49) 2.3 (0.31)Portugal .......................................... 466 (3.40) 11.3 (1.11) 18.8 (0.99) 27.1 (0.99) 24.0 (1.03) 13.4 (0.94) 4.6 (0.47) 0.8 (0.16)Slovak Republic .............................. 498 (3.35) 6.7 (0.85) 13.2 (0.86) 23.5 (0.88) 24.9 (1.08) 18.9 (0.82) 9.8 (0.68) 2.9 (0.38)Spain .............................................. 485 (2.41) 8.1 (0.66) 14.9 (0.87) 24.7 (0.78) 26.7 (1.02) 17.7 (0.65) 6.5 (0.62) 1.4 (0.25)
Sweden........................................... 509 (2.56) 5.6 (0.52) 11.7 (0.60) 21.7 (0.84) 25.5 (0.95) 19.8 (0.81) 11.6 (0.57) 4.1 (0.49)Switzerland ..................................... 527 (3.38) 4.9 (0.45) 9.6 (0.57) 17.5 (0.80) 24.3 (0.98) 22.5 (0.72) 14.2 (1.05) 7.0 (0.90)Turkey ............................................. 423 (6.74) 27.7 (2.01) 24.6 (1.33) 22.1 (1.12) 13.5 (1.27) 6.8 (1.05) 3.1 (0.82) 2.4 (1.02)United Kingdom10........................... 508 (2.43) 5.2 (0.54) 12.5 (0.67) 21.2 (1.20) 25.6 (0.88) 20.6 (0.73) 11.0 (0.73) 3.9 (0.43)United States .................................. 483 (2.95) 10.2 (0.80) 15.5 (0.81) 23.9 (0.80) 23.8 (0.79) 16.6 (0.73) 8.0 (0.53) 2.0 (0.36)
Non-OECD countriesBrazil ........................................... 356 (4.83) 53.3 (1.94) 21.9 (1.09) 14.1 (0.86) 6.8 (0.78) 2.7 (0.47) 0.9 (0.36) 0.3 (0.16)Hong Kong-China ....................... 550 (4.54) 3.9 (0.72) 6.5 (0.64) 13.9 (1.00) 20.0 (1.25) 25.0 (1.17) 20.2 (1.00) 10.5 (0.94)Indonesia .................................... 360 (3.91) 50.5 (2.08) 27.6 (1.05) 14.8 (1.07) 5.5 (0.71) 1.4 (0.39) 0.2 (0.09) # (†)Latvia .......................................... 483 (3.69) 7.6 (0.86) 16.1 (1.08) 25.5 (1.17) 26.3 (1.15) 16.6 (1.17) 6.3 (0.70) 1.6 (0.36)Liechtenstein............................... 536 (4.12) 4.8 (1.33) 7.5 (1.66) 17.3 (2.78) 21.6 (2.54) 23.2 (3.09) 18.3 (3.22) 7.3 (1.73)Macao-China .............................. 527 (2.89) 2.3 (0.60) 8.8 (1.34) 19.6 (1.40) 26.8 (1.77) 23.7 (1.71) 13.8 (1.55) 4.8 (0.96)Russian Federation..................... 468 (4.20) 11.4 (1.03) 18.8 (1.09) 26.4 (1.13) 23.1 (1.02) 13.2 (0.92) 5.4 (0.58) 1.6 (0.38)Serbia and Montenegro .............. 437 (3.75) 17.6 (1.35) 24.5 (1.08) 28.6 (1.16) 18.9 (1.11) 8.1 (0.88) 2.1 (0.41) 0.2 (0.10)Thailand ...................................... 417 (3.00) 23.8 (1.28) 30.2 (1.25) 25.4 (1.12) 13.7 (0.85) 5.3 (0.53) 1.5 (0.31) 0.2 (0.10)Tunisia......................................... 359 (2.54) 51.1 (1.37) 26.9 (0.95) 14.7 (0.75) 5.7 (0.61) 1.4 (0.30) 0.2 (0.12) # (†)Uruguay ...................................... 422 (3.29) 26.3 (1.30) 21.8 (0.80) 24.2 (0.89) 16.8 (0.68) 8.2 (0.65) 2.3 (0.33) 0.5 (0.17)
DIGEST OF EDUCATION STATISTICS 2005

646C
HA
PT
ER
6: International Com
parisons of Education
DIG
ES
T O
F E
DU
CAT
ION
STAT
IST
ICS
2005
an 85 percent of the students, with missing data having not been
r replacement schools were included.
ational Desired Population.s than 70 percent of the students, with missing data having not
t grade is called “First grade/preschool.”r fourth-grade students or equivalent in most countries. Possiblecause of rounding. Standard errors appear in parentheses.cational Achievement (IEA), Trends in International Mathematicsal Mathematics Report, by Ina V. S. Mullis et al. (This table was
hool week, and country: 2003
mathematics homework (TMH) in a normal school week
Medium TMH7 Low TMH8
Percent Mean score Percent Mean score
10 11 12 13
(0.3) 500 (0.9) 26 (0.3) 494 (1.6)
(1.3) 465 (3.5) 2 (0.3) ‡ (†)(2.1) 500 (4.6) 50 (2.1) 505 (4.4)(1.7) 549 (2.7) 43 (2.0) 557 (2.0)(1.1) 569 (2.0) 27 (1.2) 561 (2.7)(0.9) 521 (2.4) 10 (0.6) 497 (5.3)
(1.8) 531 (4.8) 59 (1.9) 540 (4.2)(0.9) 580 (3.2) 5 (0.5) 530 (5.6)(1.1) 538 (3.1) 5 (0.9) 535 (10.6)(1.8) 391 (5.0) 17 (2.3) 376 (8.1)(1.1) 504 (4.5) 24 (1.6) 512 (3.6)
(1.8) 568 (2.3) 35 (2.1) 565 (2.7)(1.1) 546 (2.7) 4 (0.6) 517 (9.1)(1.3) 545 (3.1) 5 (0.6) 510 (10.7)(1.9) 504 (5.4) 3 (0.6) 494 (10.9)(1.9) 365 (4.8) 20 (2.1) 353 (12.3)
(0.8) 508 (6.6) 89 (0.9) 546 (1.8)(1.1) 491 (3.3) 52 (1.3) 504 (3.1)(1.8) 462 (3.2) 32 (2.1) 467 (4.0)(1.7) 362 (6.7) 31 (1.9) 372 (15.7)(1.2) 537 (4.7) 2 (0.4) ‡ (†)
(2.0) 488 (4.2) 54 (2.2) 498 (3.4)(1.3) 595 (5.8) 11 (0.6) 575 (7.2)(1.2) 490 (2.6) 10 (0.9) 455 (8.6)(2.8) 365 (6.3) 28 (3.0) 365 (8.0)(1.3) 524 (2.7) 25 (1.5) 520 (3.5)
†Not applicable.‡Reporting standards not met.1Topic includes whole numbers; fractions and decimals; integers; and ratio, proportion, and percent.2Topic includes patterns, equations and formulas, and relationships.3Topic includes attributes and units and tools, techniques, and formulas.4Topic includes lines and angles, two- and three-dimensional shapes, congruence and similarity, locations and spatial rela-tionships, and symmetry and transformations.5Topic includes data collection and organization, data representation, and data interpretation.6High level indicates more than 30 minutes of mathematics homework assigned 3–4 times a week.7Medium level includes all possible combinations of responses not included in the high or low level categories (see below fordetails on the low level).8Low level indicates no more than 30 minutes of mathematics homework assigned no more than twice a week.
9Response rate for the TMH index was at least 70 but less thexplicitly accounted for in the analysis.10Met international guidelines for participation rates only afte11SAR=Special Administrative Region.12National Desired Population does not cover all of the Intern13Response rate for the TMH index was at least 50 but lesbeen explicitly accounted for in the analysis.14Students had received 4 years of formal schooling, but firsNOTE: TMH index data are provided by students. Data are foscores range from 1 to 1,000. Detail may not sum to totals beSOURCE: International Association for the Evaluation of Eduand Science Study (TIMSS), 2003, TIMSS 2003 Internationprepared March 2005.)
Table 393. Average fourth-grade mathematics scores, by content areas, index of time students spend doing mathematics homework in a normal sc
Country
Average score by content area Index of time students spend doing
Mathematicsoverall Number1
Patterns andrelationships2 Measurement3 Geometry4 Data5
High TMH6
Percent Mean score
1 2 3 4 5 6 7 8 9
International average ...................... 495 (0.8) 495 (0.7) 495 (0.7) 495 (0.7) 495 (0.7) 495 (0.6) 18 (0.2) 489 (1.3) 56
Armenia9................................................... 456 (3.5) 473 (3.0) 461 (4.1) 465 (3.1) 431 (3.8) 417 (3.6) 33 (1.3) 467 (5.1) 65Australia10................................................. 499 (3.9) 479 (4.3) 495 (3.7) 514 (3.7) 524 (3.7) 525 (3.6) 7 (0.8) 486 (13.0) 43Belgium (Flemish)..................................... 551 (1.8) 549 (1.9) 542 (1.9) 550 (1.4) 533 (1.8) 548 (2.2) 9 (0.7) 538 (3.9) 48Chinese Taipei .......................................... 564 (1.8) 568 (1.8) 555 (2.4) 557 (1.6) 553 (2.5) 564 (2.3) 11 (0.6) 546 (3.5) 62Cyprus ...................................................... 510 (2.4) 514 (2.7) 519 (2.4) 506 (2.3) 505 (2.3) 509 (2.3) 14 (0.6) 494 (4.6) 76
England10 ................................................. 531 (3.7) 519 (4.1) 523 (3.9) 535 (3.3) 542 (3.7) 552 (3.4) 4 (0.6) 489 (14.3) 37Hong Kong, SAR10,11 ............................... 575 (3.2) 574 (3.3) 568 (3.5) 563 (2.7) 557 (2.9) 562 (2.3) 24 (1.0) 575 (3.8) 71Hungary.................................................... 529 (3.1) 524 (2.9) 545 (3.7) 532 (2.7) 514 (3.3) 513 (3.2) 17 (0.9) 515 (4.9) 78Iran, Islamic Republic of ........................... 389 (4.2) 410 (3.7) 394 (3.9) 398 (3.2) 416 (3.9) 356 (4.4) 31 (2.3) 404 (5.1) 52Italy ........................................................... 503 (3.7) 502 (3.6) 496 (4.3) 504 (3.4) 522 (3.5) 497 (3.0) 24 (1.1) 496 (5.2) 52
Japan........................................................ 565 (1.6) 556 (2.0) 554 (1.4) 568 (1.6) 559 (1.9) 593 (1.6) 8 (0.6) 543 (4.6) 57Latvia ........................................................ 536 (2.8) 531 (2.6) 532 (3.4) 545 (2.6) 523 (2.2) 526 (2.7) 25 (1.1) 525 (4.1) 71Lithuania12................................................ 534 (2.8) 535 (2.9) 531 (3.0) 540 (2.7) 524 (2.2) 517 (2.5) 29 (1.2) 527 (3.8) 66Moldova, Rep. of....................................... 504 (4.9) 507 (4.7) 521 (5.1) 505 (4.0) 501 (4.9) 477 (4.3) 31 (2.0) 518 (6.3) 66Morocco13................................................. 347 (5.1) 359 (4.7) 360 (4.7) 345 (5.5) 362 (4.9) 355 (5.0) 22 (1.3) 362 (5.9) 58
Netherlands10 ........................................... 540 (2.1) 536 (2.2) 527 (2.4) 545 (2.2) 521 (3.2) 553 (2.4) 1 (0.2) ‡ (†) 10New Zealand............................................. 493 (2.2) 475 (2.3) 495 (2.9) 503 (2.0) 517 (1.8) 522 (2.0) 7 (0.4) 489 (6.7) 41Norway14 .................................................. 451 (2.3) 440 (2.2) 439 (2.7) 475 (2.2) 478 (2.2) 479 (2.3) 12 (1.0) 447 (4.7) 56Philippines ................................................ 358 (7.9) 380 (7.4) 382 (7.0) 330 (7.8) 335 (8.8) 384 (7.5) 17 (0.8) 349 (7.0) 52Russian Federation................................... 532 (4.7) 532 (4.6) 531 (5.0) 538 (3.8) 528 (4.8) 505 (4.1) 38 (1.3) 531 (5.3) 59
Scotland10 ................................................ 490 (3.3) 475 (3.3) 495 (2.9) 499 (3.1) 511 (2.5) 516 (2.7) 6 (0.8) 477 (6.8) 40Singapore ................................................. 594 (5.6) 612 (6.0) 579 (5.4) 566 (4.6) 570 (5.5) 575 (3.9) 40 (1.5) 604 (6.0) 49Slovenia .................................................... 479 (2.6) 461 (2.7) 490 (2.7) 497 (2.8) 498 (2.2) 486 (2.7) 14 (0.9) 466 (6.7) 76Tunisia13 ................................................... 339 (4.7) 360 (4.1) 330 (4.7) 308 (5.5) 346 (5.1) 308 (4.7) 22 (2.2) 373 (8.6) 50United States10......................................... 518 (2.4) 516 (2.6) 524 (2.7) 500 (2.1) 518 (2.2) 549 (2.0) 12 (0.6) 504 (4.0) 63

CH
AP
TE
R 6: International C
omparisons of E
ducation647
DIG
ES
T O
F E
DU
CAT
ION
STAT
IST
ICS
2005
hool week, and country: 2003
mathematics homework (TMH) in a normal school week
Medium TMH7 Low TMH8
Percent Mean score Percent Mean score
10 11 12 13
(0.2) 471 (0.6) 19 (0.2) 456 (1.0)
(1.2) 478 (3.7) 4 (0.4) 475 (7.5)(1.5) 509 (5.4) 31 (2.0) 497 (5.5)(1.2) 409 (2.0) 13 (1.1) 398 (4.9)(1.4) 546 (3.2) 44 (2.0) 532 (3.7)(0.8) 368 (2.6) 22 (0.9) 355 (3.0)
(1.5) 478 (4.6) 14 (1.5) 469 (5.4)(1.0) 389 (3.8) 47 (1.4) 388 (3.7)(1.2) 594 (4.4) 37 (2.0) 563 (5.6)(0.7) 469 (1.8) 9 (0.6) 438 (5.3)(1.0) 418 (3.6) 14 (0.7) 419 (4.7)
(†) ‡ (†) ‡ (†) ‡ (†)(1.3) 538 (3.2) 7 (1.2) 523 (10.3)(0.9) 280 (4.5) 20 (1.0) 275 (7.5)(1.5) 587 (3.6) 19 (1.5) 566 (7.6)(1.2) 537 (3.1) 3 (0.5) 501 (14.1)
(0.8) 406 (5.3) 15 (0.8) 391 (7.3)(0.9) 414 (2.8) 25 (1.1) 403 (3.4)(1.3) 505 (4.1) 12 (0.9) 479 (6.3)(1.1) 487 (3.6) 7 (0.7) 471 (8.0)(1.5) 566 (2.8) 58 (1.9) 576 (2.1)
(1.1) 437 (4.1) 11 (0.9) 411 (4.9)(1.6) 592 (2.6) 43 (2.0) 590 (2.8)(1.3) 516 (3.0) 6 (0.7) 508 (9.3)(1.7) 437 (3.5) 5 (0.6) 412 (7.6)(1.3) 509 (3.0) 5 (0.8) 490 (8.7)
(1.3) 444 (3.9) 13 (1.3) 439 (6.0)(1.1) 510 (4.5) 11 (0.8) 485 (5.9)(1.3) 458 (4.6) 5 (0.5) 437 (8.3)(1.1) 392 (3.2) 14 (1.0) 380 (4.8)(1.4) 542 (4.4) 19 (1.7) 518 (6.5)
(1.8) 505 (6.0) 37 (2.1) 492 (7.2)(1.3) 466 (2.5) 22 (1.3) 472 (3.5)(1.1) 398 (3.5) 8 (0.6) 371 (6.6)(1.0) 382 (5.5) 22 (1.2) 361 (6.6)(1.4) 451 (6.4) 3 (0.4) 437 (13.0)
_
Table 394. Average eighth-grade mathematics scores, by content areas, index of time students spend doing mathematics homework in a normal sc
Country
Average score by content area Index of time students spend doing
Mathematicsoverall Number1 Algebra2 Measurement3 Geometry4 Data5
High TMH6
Percent Mean score
1 2 3 4 5 6 7 8 9
International average9 .................... 467 (0.5) 467 (0.5) 467 (0.5) 467 (0.5) 467 (0.5) 467 (0.5) 26 (0.2) 468 (0.8) 54
Armenia .................................................... 478 (3.0) 473 (3.1) 489 (2.6) 488 (3.3) 481 (3.1) 419 (2.7) 35 (1.3) 490 (3.9) 60Australia.................................................... 505 (4.6) 498 (4.6) 499 (4.4) 511 (4.3) 491 (4.8) 531 (3.8) 19 (1.6) 520 (6.0) 50Bahrain ..................................................... 401 (1.7) 380 (1.9) 411 (2.5) 388 (2.1) 438 (2.1) 414 (2.1) 18 (0.8) 387 (3.3) 69Belgium (Flemish)..................................... 537 (2.8) 539 (2.7) 523 (2.8) 535 (2.5) 527 (3.1) 546 (2.9) 13 (1.1) 542 (4.5) 42Botswana .................................................. 366 (2.6) 382 (2.2) 377 (2.7) 377 (2.0) 335 (3.9) 375 (2.7) 25 (0.8) 385 (3.9) 53
Bulgaria .................................................... 476 (4.3) 477 (4.1) 481 (4.0) 473 (4.6) 484 (4.5) 458 (3.9) 33 (1.8) 482 (6.4) 54Chile ......................................................... 387 (3.3) 390 (3.1) 384 (3.1) 404 (2.9) 378 (3.3) 412 (3.4) 10 (0.7) 387 (6.9) 43Chinese Taipei .......................................... 585 (4.6) 585 (4.6) 585 (4.9) 574 (4.4) 588 (5.1) 568 (3.4) 18 (1.5) 611 (6.0) 45Cyprus ...................................................... 459 (1.7) 464 (1.5) 455 (1.7) 459 (2.2) 457 (2.4) 458 (1.7) 21 (0.8) 459 (2.8) 70Egypt......................................................... 406 (3.5) 421 (3.0) 408 (3.9) 401 (3.3) 408 (3.6) 393 (3.2) 26 (0.8) 402 (4.3) 60
England10 ................................................. ‡ (†) ‡ (†) ‡ (†) ‡ (†) ‡ (†) ‡ (†) ‡ (†) ‡ (†) ‡Estonia...................................................... 531 (3.0) 523 (3.1) 528 (2.6) 528 (3.0) 540 (2.6) 535 (2.8) 28 (1.3) 519 (4.0) 66Ghana....................................................... 276 (4.7) 289 (5.1) 288 (4.8) 262 (3.7) 278 (4.3) 293 (4.1) 24 (0.9) 288 (5.8) 56Hong Kong, SAR11,12 ............................... 586 (3.3) 586 (3.2) 580 (3.2) 584 (3.3) 588 (3.6) 566 (3.0) 32 (1.9) 600 (3.5) 49Hungary.................................................... 529 (3.2) 529 (3.6) 534 (3.1) 525 (3.1) 515 (3.1) 526 (2.9) 20 (1.2) 516 (5.8) 77
Indonesia13............................................... 411 (4.8) 421 (4.6) 418 (4.5) 394 (4.9) 413 (4.6) 418 (4.0) 37 (1.1) 435 (4.3) 48Iran, Islamic Republic of ........................... 411 (2.4) 416 (2.3) 412 (3.1) 399 (2.6) 437 (3.1) 404 (2.6) 24 (1.2) 420 (3.8) 52Israel14...................................................... 496 (3.4) 504 (3.3) 498 (3.2) 480 (3.4) 488 (3.7) 492 (3.3) 33 (1.4) 498 (3.9) 55Italy ........................................................... 484 (3.2) 480 (3.2) 477 (3.4) 500 (3.2) 469 (3.5) 490 (3.0) 54 (1.4) 484 (3.8) 40Japan........................................................ 570 (2.1) 557 (2.3) 568 (2.0) 559 (2.0) 587 (2.1) 573 (1.9) 6 (0.7) 565 (10.1) 36
Jordan....................................................... 424 (4.1) 413 (4.4) 434 (4.4) 418 (4.4) 446 (4.0) 430 (3.5) 25 (0.8) 425 (4.7) 64Korea, Republic of15 ................................. 589 (2.2) 586 (2.1) 597 (2.2) 577 (2.0) 598 (2.6) 569 (2.0) 11 (1.0) 582 (4.3) 46Latvia ........................................................ 508 (3.2) 507 (3.2) 508 (3.2) 500 (3.0) 515 (3.3) 506 (3.8) 33 (1.3) 502 (4.7) 61Lebanon.................................................... 433 (3.1) 430 (3.3) 448 (3.1) 430 (3.7) 459 (3.0) 394 (4.0) 42 (1.7) 436 (3.5) 52Lithuania13................................................ 502 (2.5) 500 (2.7) 501 (2.4) 492 (3.0) 506 (2.5) 502 (2.5) 32 (1.4) 493 (3.1) 63
Macedonia, Republic of14 ......................... 435 (3.5) 438 (3.5) 442 (3.6) 434 (3.6) 442 (3.7) 419 (3.6) 26 (1.1) 440 (4.5) 61Malaysia.................................................... 508 (4.1) 524 (4.0) 495 (3.9) 504 (4.5) 495 (4.8) 505 (3.2) 33 (1.3) 515 (4.4) 56Moldova .................................................... 460 (4.0) 463 (3.8) 464 (4.2) 468 (4.0) 463 (4.7) 428 (3.4) 38 (1.4) 472 (4.3) 57Morocco13,16,17......................................... 387 (2.5) 384 (2.7) 400 (2.8) 376 (3.4) 415 (2.3) 374 (2.5) 34 (1.5) 390 (4.5) 52Netherlands11 ........................................... 536 (3.8) 539 (3.6) 514 (4.0) 549 (3.7) 513 (4.1) 560 (3.1) 19 (1.3) 540 (5.2) 62
New Zealand............................................. 494 (5.3) 481 (6.0) 490 (5.2) 500 (4.8) 488 (4.6) 526 (5.1) 14 (1.1) 488 (5.1) 49Norway...................................................... 461 (2.5) 456 (2.3) 428 (2.7) 481 (2.9) 461 (2.8) 498 (2.5) 26 (1.3) 454 (4.0) 52Palestinian National Authority ................... 390 (3.1) 385 (3.6) 392 (3.5) 386 (2.8) 423 (3.1) 390 (2.8) 27 (1.1) 393 (3.5) 65Philippines ................................................ 378 (5.2) 393 (5.1) 400 (5.2) 372 (4.8) 344 (5.3) 390 (4.5) 24 (0.9) 390 (5.4) 54Romania ................................................... 475 (4.8) 474 (4.9) 480 (4.7) 485 (4.7) 476 (4.9) 445 (4.6) 68 (1.6) 492 (4.5) 28
See notes at end of table.

648C
HA
PT
ER
6: International Com
parisons of Education
DIG
ES
T O
F E
DU
CAT
ION
STAT
IST
ICS
2005
lacement schools were included.
nal Desired Population.f National Desired Population.s, but later in 2003, at the beginning of the next school year.ly after replacement schools were included.
s than 85 percent of the students, with missing data having not
or eighth grade or equivalent in most countries. Possible scoress. Detail may not sum to totals because of rounding.cational Achievement (IEA), Trends in International Mathematicsal Mathematics Report, by Ina V. S. Mullis et al. (This table was
(1.2) 511 (3.4) 2 (0.2) ‡ (†)(1.6) 335 (4.6) 23 (1.6) 345 (5.7)(2.1) 507 (4.5) 46 (2.5) 496 (4.1)(1.2) 481 (3.5) 20 (1.7) 497 (3.5)(0.9) 604 (3.8) 11 (0.8) 566 (7.8)(1.4) 511 (3.4) 8 (1.3) 500 (7.7)(1.2) 500 (2.5) 4 (0.8) 463 (8.8)(0.8) 270 (6.3) 20 (1.0) 260 (5.4)(1.4) 494 (3.5) 58 (1.5) 509 (2.7)(1.1) 414 (2.2) 11 (0.9) 414 (4.3)(0.9) 506 (3.2) 9 (0.9) 461 (6.3)
hool week, and country: 2003—Continued
mathematics homework (TMH) in a normal school week
Medium TMH7 Low TMH8
Percent Mean score Percent Mean score
10 11 12 13
†Not applicable.‡Reporting standards not met.1Topic includes whole numbers; fractions and decimals; integers; and ratio, proportion, and percent.2Topic includes patterns, algebraic expressions, equations and formulas, and relationships.3Topic includes attributes and units and tools, techniques, and formulas.4Topic includes lines and angles, two- and three-dimensional shapes, congruence and similarity, locations and spatial rela-tionships, and symmetry and transformations.5Topic includes data collection and organization, data representation, data interpretation, and uncertainty and probability.6High level indicates more than 30 minutes of mathematics homework assigned 3–4 times a week.7Medium level includes all possible combinations of responses not included in the high or low level categories (see below fordetails on the low level).8Low level indicates no more than 30 minutes of mathematics homework assigned no more than twice a week.9The international average of 467 may sometimes appear as 466. In that case, the TIMSS 2003 average for eighth-graderspublished in the National Center for Education Statistics report reflects the deletion of England from the average.
10Did not satisfy guidelines for sample participation rates.11Met guidelines for sample participation rates only after rep12SAR=Special Administrative Region.13National Desired Population does not cover all of Internatio14National Defined Population covers less than 90 percent o15Korea tested the same cohort of students as other countrie16Nearly satisfied guidelines for sample participation rates on17Response rate for the TMH index was at least 70 but lesbeen explicitly accounted for in the analysis.NOTE: TMH index data are provided by students. Data are frange from 1 to 1,000. Standard errors appear in parentheseSOURCE: International Association for the Evaluation of Eduand Science Study (TIMSS), 2003, TIMSS 2003 Internationprepared April 2005.)
Russian Federation................................... 508 (3.7) 505 (4.0) 516 (3.2) 507 (3.9) 515 (4.2) 484 (3.2) 53 (1.2) 509 (4.4) 45Saudi Arabia ............................................. 332 (4.6) 307 (5.3) 331 (4.7) 338 (3.4) 382 (4.3) 339 (3.8) 15 (1.0) 315 (8.1) 62Scotland11 ................................................ 498 (3.7) 484 (4.2) 488 (3.9) 508 (3.6) 491 (3.3) 531 (3.7) 8 (0.8) 493 (5.8) 46Serbia13 .................................................... 477 (2.6) 477 (2.8) 488 (2.5) 475 (2.5) 471 (3.0) 456 (2.6) 25 (1.3) 466 (4.1) 54Singapore ................................................. 605 (3.6) 618 (3.5) 590 (3.5) 611 (3.6) 580 (3.7) 579 (3.2) 38 (1.1) 621 (3.1) 51Slovak Republic ........................................ 508 (3.3) 514 (3.3) 505 (3.3) 508 (3.7) 501 (3.6) 495 (2.9) 11 (0.9) 495 (6.4) 81Slovenia .................................................... 493 (2.2) 498 (2.0) 487 (2.3) 496 (2.3) 483 (2.5) 494 (2.3) 25 (1.1) 482 (2.9) 71South Africa .............................................. 264 (5.5) 274 (5.4) 275 (5.1) 298 (4.7) 247 (5.4) 296 (5.3) 21 (0.8) 275 (8.1) 58Sweden..................................................... 499 (2.6) 496 (2.6) 480 (3.0) 512 (2.6) 467 (3.4) 539 (3.0) 4 (0.5) 453 (7.0) 38Tunisia....................................................... 410 (2.2) 419 (2.3) 405 (2.4) 407 (2.2) 427 (2.0) 387 (2.2) 39 (1.1) 410 (2.7) 50United States16......................................... 504 (3.3) 508 (3.4) 510 (3.1) 495 (3.2) 472 (3.1) 527 (3.2) 31 (1.0) 518 (4.1) 60
Table 394. Average eighth-grade mathematics scores, by content areas, index of time students spend doing mathematics homework in a normal sc
Country
Average score by content area Index of time students spend doing
Mathematicsoverall Number1 Algebra2 Measurement3 Geometry4 Data5
High TMH6
Percent Mean score
1 2 3 4 5 6 7 8 9

CH
AP
TE
R 6: International C
omparisons of E
ducation649
DIG
ES
T O
F E
DU
CAT
ION
STAT
IST
ICS
2005
l time as a percentage of total instructional time
Students’average yearly
mathematicsinstructional
time, in hours
Mathematicsinstructional time
as a percent oftotal instructional time
Otherstudent activities
9 10 11
4 (0.1) 123 (0.4) 12 (#)1 4 (0.3) ‡ (†) ‡ (†)
3 (0.4) 1 136 (2.9) 1 13 (0.3)6 (0.3) 142 (0.8) 16 (0.1)2 (0.2) 2 123 (2.2) 13 (0.3)
1 5 (0.4) ‡ (†) ‡ (†)
2 (0.3) 1 96 (1.7) 1 11 (0.2)3 (0.3) 1 160 (4.1) 1 14 (0.4)3 (0.3) 141 (2.0) 13 (0.2)
1 2 (0.2) 2 75 (0.4) 8 (0.1)7 (0.4) ‡ (†) ‡ (†)
2 ‡ (†) ‡ (†) ‡ (†)2 (0.3) 125 (1.2) 12 (0.2)
1 6 (0.3) ‡ (†) ‡ (†)4 (0.4) 2 145 (5.2) 15 (0.5)3 (0.3) 2 112 (2.0) 11 (0.2)
1 3 (0.5) 2 169 (4.4) 13 (0.4)6 (0.6) 2 115 (3.5) 12 (0.4)
1 3 (0.3) ‡ (†) ‡ (†)2 (0.3) 1 132 (1.7) 1 13 (0.2)2 (0.4) 107 (2.6) 10 (0.2)
6 (0.5) 110 (0.9) 12 (0.2)2 3 (0.5) 2 109 (1.2) 9 (0.1)1 4 (0.4) 2 122 (1.4) 13 (0.3)2 4 (0.4) ‡ (†) ‡ (†)
2 (0.2) 1 122 (0.9) 11 (0.2)
4 (0.3) 1 80 (1.2) 9 (0.2)6 (0.4) 120 (1.4) 12 (0.1)
2 5 (0.6) ‡ (†) ‡ (†)‡ (†) ‡ (†) ‡ (†)4 (0.4) 2 94 (1.4) 9 (0.1)
4 (0.5) 136 (1.7) 14 (0.2)3 (0.4) 114 (2.3) 13 (0.3)
1 6 (0.4) 2 127 (2.3) 14 (0.3)1 6 (0.4) 193 (3.6) 17 (0.4)
2 (0.2) 1 120 (2.1) 1 13 (0.3)
3 (0.3) 1 128 (2.1) 1 15 (0.3)1 7 (0.8) 2 110 (1.0) 11 (0.2)1 3 (0.5) 2 142 (2.2) 14 (0.2)
5 (0.5) 2 107 (1.5) 13 (0.2)4 (0.4) 114 (1.6) 13 (0.2)
_
Table 395. Percentage of lesson time spent on various mathematics activities, yearly mathematics instructional time, and mathematics instructionain eighth grade, by country: 2003
Country
Percentage of time in mathematics lessons students spend on various activities in a typical week
Reviewing homeworkListening to lecture-style presentations
Workingproblems with
teacher's guidance
Working problems ontheir own without
teacher's guidance
Listening to teachersreteach and clarify
content/proceduresTaking testsand quizzes
Participatingin classroommanagement
tasks not relatedto the lesson’s
content/purpose
1 2 3 4 5 6 7 8
International average........... 11 (0.1) 19 (0.1) 22 (0.2) 18 (0.2) 11 (0.1) 10 (0.1) 5 (0.1)
Armenia ..................................... 1 10 (0.5) 1 14 (0.8) 1 26 (1.1) 1 19 (0.9) 1 13 (0.6) 1 11 (0.6) 1 4 (0.3)Australia..................................... 8 (0.5) 15 (0.8) 23 (1.2) 28 (1.2) 9 (0.4) 7 (0.4) 7 (0.6)Bahrain ...................................... 13 (0.5) 24 (0.9) 17 (0.5) 12 (0.5) 12 (0.3) 13 (0.5) 6 (0.5)Belgium (Flemish)...................... 7 (0.4) 14 (1.0) 26 (1.0) 20 (0.9) 16 (0.8) 11 (0.4) 4 (0.3)Botswana ................................... 1 13 (0.9) 1 16 (1.1) 1 19 (1.1) 1 21 (1.2) 1 11 (0.8) 1 10 (0.7) 1 6 (0.5)
Bulgaria ..................................... 10 (0.6) 18 (1.3) 26 (1.0) 16 (0.8) 17 (0.9) 8 (0.5) 3 (0.4)Chile .......................................... 10 (0.4) 18 (0.8) 21 (0.9) 18 (0.8) 14 (0.7) 11 (0.5) 6 (0.4)Chinese Taipei ........................... 12 (0.5) 42 (1.3) 13 (0.6) 7 (0.5) 9 (0.4) 10 (0.4) 4 (0.3)Cyprus ....................................... 1 22 (0.4) 1 16 (0.5) 1 20 (0.5) 1 14 (0.4) 1 12 (0.4) 1 10 (0.5) 1 5 (0.2)Egypt.......................................... 11 (0.4) 18 (1.0) 17 (0.8) 15 (0.7) 15 (0.8) 11 (0.4) 6 (0.3)
England3.................................... 2 ‡ (†) 2 ‡ (†) 2 ‡ (†) 2 ‡ (†) 2 ‡ (†) 2 ‡ (†) 2 ‡ (†)Estonia....................................... 10 (0.4) 12 (0.6) 25 (1.0) 25 (0.8) 11 (0.5) 13 (0.6) 3 (0.3)Ghana........................................ 1 11 (0.4) 1 16 (0.9) 1 20 (0.8) 1 18 (0.7) 1 12 (0.7) 1 12 (0.4) 1 7 (0.4)Hong Kong, SAR4,5 ................... 8 (0.4) 36 (1.5) 18 (0.7) 16 (0.8) 9 (0.7) 6 (0.3) 4 (0.5)Hungary..................................... 12 (0.4) 13 (0.7) 25 (0.9) 25 (1.0) 10 (0.4) 10 (0.4) 3 (0.3)
Indonesia6 ................................. 1 12 (0.5) 1 25 (1.1) 1 20 (0.9) 1 14 (0.9) 1 12 (0.5) 1 12 (0.7) 1 3 (0.4)Iran, Islamic Republic of ............ 12 (0.6) 17 (0.8) 18 (0.7) 14 (0.7) 15 (0.7) 11 (0.5) 6 (0.3)Israel7 ........................................ 1 14 (0.6) 1 15 (0.8) 1 22 (0.7) 1 21 (0.8) 1 11 (0.4) 1 10 (0.5) 1 5 (0.5)Italy ............................................ 15 (0.6) 22 (0.6) 19 (0.6) 13 (0.6) 13 (0.4) 11 (0.5) 4 (0.3)Japan......................................... 7 (0.6) 29 (1.3) 28 (1.1) 11 (1.0) 15 (0.9) 6 (0.4) 2 (0.2)
Jordan........................................ 15 (0.7) 23 (1.0) 17 (0.8) 13 (0.8) 11 (0.5) 9 (0.4) 6 (0.4)Korea, Republic of8.................... 2 6 (0.3) 2 30 (1.2) 2 19 (0.6) 2 20 (0.7) 2 9 (0.4) 2 8 (0.4) 2 5 (0.3)Latvia ......................................... 1 8 (0.6) 1 12 (0.7) 1 25 (1.1) 1 22 (0.9) 1 11 (0.6) 1 15 (0.7) 1 2 (0.2)Lebanon..................................... 2 24 (1.6) 2 17 (0.9) 2 23 (1.1) 2 8 (0.8) 2 10 (0.6) 2 11 (0.6) 2 4 (0.4)Lithuania6 .................................. 9 (0.5) 7 (0.6) 30 (1.2) 26 (0.9) 11 (0.7) 14 (0.6) 1 (0.2)
Macedonia, Republic of7............ 7 (0.3) 37 (1.1) 19 (0.7) 15 (0.7) 6 (0.4) 8 (0.4) 3 (0.3)Malaysia..................................... 13 (0.7) 21 (1.0) 21 (0.9) 16 (0.8) 9 (0.5) 8 (0.4) 6 (0.4)Moldova ..................................... 2 9 (0.6) 2 15 (1.0) 2 23 (1.0) 2 18 (0.9) 2 11 (0.8) 2 14 (0.8) 2 4 (0.7)Morocco6,9................................. ‡ (†) ‡ (†) ‡ (†) ‡ (†) ‡ (†) ‡ (†) ‡ (†)Netherlands4.............................. 15 (1.1) 13 (0.7) 21 (2.0) 28 (2.5) 7 (0.5) 8 (0.5) 5 (0.5)
New Zealand.............................. 7 (0.4) 17 (0.8) 24 (1.1) 23 (1.3) 9 (0.4) 8 (0.4) 7 (0.5)Norway....................................... 8 (0.4) 19 (0.6) 26 (1.2) 25 (1.5) 10 (0.4) 6 (0.3) 4 (0.3)Palestinian National Authority .... 1 13 (0.6) 1 23 (1.0) 1 18 (0.8) 1 16 (0.9) 1 11 (0.5) 1 9 (0.3) 1 6 (0.3)Philippines ................................. 1 9 (0.4) 1 20 (0.9) 1 16 (0.8) 1 15 (1.0) 1 11 (0.5) 1 16 (0.7) 1 7 (0.3)Romania .................................... 9 (0.4) 24 (0.8) 29 (1.0) 15 (0.7) 10 (0.4) 9 (0.5) 3 (0.3)
Russian Federation.................... 11 (0.2) 20 (0.7) 20 (0.7) 18 (0.7) 8 (0.4) 18 (0.5) 1 (0.2)Saudi Arabia .............................. 1 15 (1.0) 1 16 (1.6) 1 13 (1.0) 1 8 (0.7) 1 23 (2.2) 1 12 (1.0) 1 6 (0.4)Scotland4 ................................... 1 8 (0.3) 1 22 (0.7) 1 26 (1.3) 1 22 (1.5) 1 8 (0.5) 1 4 (0.3) 1 6 (0.5)Serbia6....................................... 7 (0.4) 25 (1.4) 23 (1.2) 20 (1.2) 9 (0.5) 7 (0.4) 3 (0.3)Singapore .................................. 11 (0.4) 27 (0.7) 19 (0.6) 15 (0.5) 9 (0.3) 8 (0.3) 6 (0.4)
See notes at end of table.

650C
HA
PT
ER
6: International Com
parisons of Education
DIG
ES
T O
F E
DU
CAT
ION
STAT
IST
ICS
2005
National Desired Population., but later in 2003, at the beginning of the next school year.
ly after replacement schools were included. spend on various activities in a typical week provided by teach- total instructional time provided by schools. Data are for eighth
totals because of rounding. Standard errors appear in parenthe-
cational Achievement (IEA), Trends in International Mathematicsal Mathematics Report, by Ina V. S. Mullis et al. (This table was
3 (0.3) 1 126 (1.9) 1 14 (0.3)4 (0.4) 116 (1.3) 11 (0.1)
2 5 (0.4) ‡ (†) ‡ (†)3 (0.4) 1 91 (1.6) 1 10 (0.2)
1 4 (0.5) ‡ (†) ‡ (†)4 (0.4) 2 135 (2.2) 13 (0.2)
l time as a percentage of total instructional time
Students’average yearly
mathematicsinstructional
time, in hours
Mathematicsinstructional time
as a percent oftotal instructional time
Otherstudent activities
9 10 11
†Not applicable.#Rounds to zero.‡Reporting standards not met.1Data available for at least 70 but less than 85 percent of students, with missing data having not been explicitly accounted forin the analysis.2Data available for at least 50 but less than 70 percent of students, with missing data having not been explicitly accounted forin the analysis.3Did not satisfy guidelines for sample participation rates.4Met guidelines for sample participation rates only after replacement schools were included.5SAR=Special Administrative Region.6National Desired Population does not cover all of International Desired Population.
7National Defined Population covers less than 90 percent of 8Korea tested the same cohort of students as other countries9Nearly satisfied guidelines for sample participation rates onNOTE: Percentage of time in mathematics lessons studentsers. Mathematics instructional time provided by teachers andgrade or equivalent in most countries. Detail may not sum toses.SOURCE: International Association for the Evaluation of Eduand Science Study (TIMSS), 2003, TIMSS 2003 Internationprepared April 2005.)
Slovak Republic ......................... 8 (0.3) 17 (0.7) 27 (0.9) 17 (0.7) 13 (0.5) 12 (0.4) 3 (0.3)Slovenia ..................................... 11 (0.4) 21 (0.8) 24 (0.7) 22 (0.9) 10 (0.6) 6 (0.3) 2 (0.2)South Africa ............................... 2 15 (0.9) 2 13 (0.7) 2 19 (0.9) 2 18 (0.9) 2 11 (0.6) 2 12 (0.6) 2 7 (0.4)Sweden...................................... 4 (0.4) 11 (0.6) 37 (1.8) 28 (1.8) 9 (0.3) 6 (0.3) 3 (0.3)Tunisia........................................ 1 18 (0.9) 1 14 (1.0) 1 17 (0.9) 1 18 (0.9) 1 14 (0.8) 1 13 (0.7) 1 4 (0.4)United States9 ........................... 13 (0.5) 18 (0.7) 21 (0.6) 18 (0.6) 11 (0.3) 11 (0.4) 5 (0.3)
Table 395. Percentage of lesson time spent on various mathematics activities, yearly mathematics instructional time, and mathematics instructionain eighth grade, by country: 2003—Continued
Country
Percentage of time in mathematics lessons students spend on various activities in a typical week
Reviewing homeworkListening to lecture-style presentations
Workingproblems with
teacher's guidance
Working problems ontheir own without
teacher's guidance
Listening to teachersreteach and clarify
content/proceduresTaking testsand quizzes
Participatingin classroommanagement
tasks not relatedto the lesson’s
content/purpose
1 2 3 4 5 6 7 8

CH
AP
TE
R 6: International C
omparisons of E
ducation651
DIG
ES
T O
F E
DU
CAT
ION
STAT
IST
ICS
2005
untry: 2003
chers' Emphasis on Mathematics Homework (EMH)1
Medium EMH3 Low EMH4
ore Percent Mean score Percent Mean score
12 13 14 15 16
1.4) 51 (0.6) 469 (0.9) 19 (0.4) 453 (1.7)
4.2) 31 (4.7) 474 (6.6) 4 (2.1) 467 (11.5)9.7) 56 (4.1) 518 (5.9) 34 (3.8) 475 (9.5)6.1) 72 (3.7) 404 (2.3) 14 (3.1) 396 (8.7)6.5) 30 (3.8) 555 (5.8) 60 (3.9) 529 (5.6)4.0) 49 (4.5) 368 (4.0) 7 (2.5) 379 (7.0)
6.1) 38 (4.2) 467 (7.7) 9 (2.5) 469 (15.6)4.9) 49 (3.6) 388 (5.1) 40 (3.3) 383 (5.5)8.6) 39 (3.9) 588 (6.3) 32 (3.9) 570 (7.6)3.2) 65 (3.1) 462 (2.3) # (†) ‡ (†)8.6) 57 (3.8) 409 (4.8) 20 (3.2) 406 (8.1)
(†) ‡ (†) ‡ (†) ‡ (†) ‡ (†)9.9) 78 (3.2) 532 (3.3) 9 (2.5) 518 (14.1)7.9) 37 (5.0) 275 (7.1) 15 (3.0) 284 (10.2)6.0) 50 (4.6) 593 (6.0) 24 (4.0) 566 (10.0)8.9) 90 (2.2) 530 (3.5) 2 (0.9) ‡ (†)
7.4) 45 (4.4) 402 (9.4) 10 (2.6) 412 (15.3)3.2) 26 (4.0) 406 (7.2) 12 (2.8) 399 (9.3)5.4) 44 (4.1) 500 (6.1) 6 (1.7) 438 (17.8)3.2) 25 (3.2) 489 (8.4) 4 (1.5) 480 (11.2)3.4) 29 (3.8) 573 (6.9) 64 (3.9) 567 (2.5)
5.5) 55 (4.4) 430 (6.3) 14 (2.8) 410 (8.6)0.8) 31 (3.6) 589 (4.7) 60 (3.5) 591 (3.5)8.8) 75 (3.8) 505 (3.5) 9 (2.6) 500 (11.7)4.6) 45 (4.4) 436 (5.8) 6 (1.9) 401 (13.1)7.7) 76 (3.6) 501 (3.4) 11 (2.6) 477 (11.3)
8.1) 66 (3.9) 428 (5.2) 12 (2.6) 432 (13.8)5.0) 34 (4.2) 515 (8.5) 5 (1.9) 466 (10.1)6.1) 52 (5.0) 463 (7.9) 5 (1.9) 468 (10.1)5.9) 37 (6.4) 383 (5.2) 9 (4.1) 389 (11.1)5.3) 82 (3.7) 541 (4.9) 11 (3.1) 495 (14.1)
5.6) 67 (4.1) 510 (6.6) 25 (4.2) 471 (5.3)6.5) 46 (4.3) 465 (3.8) 29 (4.3) 455 (5.0)6.4) 58 (4.3) 391 (4.6) 12 (2.5) 388 (14.9)0.9) 61 (4.8) 384 (7.1) 15 (3.7) 377 (19.1)5.5) 21 (3.3) 463 (10.1) 1 (0.7) ‡ (†)
4.3) 43 (3.5) 499 (4.7) 1 (0.5) ‡ (†)8.9) 69 (3.9) 332 (4.6) 17 (3.0) 346 (15.0)0.6) 45 (4.6) 527 (5.7) 51 (4.5) 477 (6.2)4.9) 45 (4.3) 481 (4.5) 22 (3.7) 470 (5.6)4.2) 33 (2.5) 592 (6.6) 8 (1.3) 563 (13.1)
_
Table 396. Average size and scores of eighth-grade mathematics classes and Index of Teachers’ Emphasis on Mathematics Homework (EMH), by co
Country
Overallaverage
class size
Percentage distribution and mean scores of mathematics classes, by average class size Index of Tea
1 to 24 students 25 to 32 students 33 to 40 students 41 or more students High EMH2
Percent Mean score Percent Mean score Percent Mean score Percent Mean score Percent Mean sc
1 2 3 4 5 6 7 8 9 10 11
International average............... 30 (0.1) 29 (0.5) 461 (1.9) 35 (0.5) 473 (1.4) 24 (0.5) 470 (2.1) 13 (0.3) 448 (1.7) 30 (0.5) 473 (
Armenia ......................................... 5 27 (0.9) 39 (4.4) 474 (5.6) 43 (4.3) 485 (5.0) 7 (1.8) 460 (9.9) 11 (2.8) 462 (8.4) 6 65 (4.6) 481 (Australia......................................... 26 (0.5) 31 (4.2) 482 (9.4) 65 (4.7) 518 (5.9) 4 (2.2) 492 (14.2) # (†) ‡ (†) 10 (3.0) 544 (1Bahrain .......................................... 32 (0.1) 6 (0.7) 451 (5.8) 52 (2.7) 402 (2.1) 40 (2.6) 395 (3.5) 3 (0.0) 412 (3.8) 15 (2.5) 389 (Belgium (Flemish).......................... 20 (0.3) 90 (2.3) 538 (3.3) 10 (2.3) 553 (10.5) # (†) ‡ (†) # (†) ‡ (†) 9 (2.5) 555 (Botswana ....................................... 37 (0.4) 1 (0.7) ‡ (†) 14 (2.6) 392 (9.1) 60 (4.3) 360 (3.7) 25 (4.1) 362 (4.1) 44 (4.6) 364 (
Bulgaria ......................................... 22 (0.5) 64 (4.2) 468 (4.9) 32 (3.9) 503 (8.0) 3 (2.4) 423 (5.0) 1 (0.0) ‡ (†) 53 (4.2) 483 (Chile .............................................. 35 (0.4) 9 (1.5) 385 (17.0) 22 (2.6) 384 (8.1) 47 (3.6) 390 (5.7) 23 (3.0) 389 (6.9) 10 (2.2) 401 (1Chinese Taipei ............................... 37 (0.4) 4 (1.5) 598 (28.9) 14 (2.8) 567 (11.5) 65 (4.0) 575 (4.7) 17 (3.2) 636 (8.7) 29 (3.9) 602 (Cyprus ........................................... 26 (0.1) 21 (1.9) 463 (3.2) 79 (1.9) 460 (2.0) # (†) ‡ (†) # (†) ‡ (†) 35 (3.1) 455 (Egypt.............................................. 38 (0.6) 3 (1.2) 422 (13.8) 9 (2.1) 428 (11.3) 61 (4.1) 403 (4.3) 27 (3.7) 407 (7.5) 23 (3.3) 401 (
England7........................................ 8 ‡ (†) ‡ (†) ‡ (†) ‡ (†) ‡ (†) ‡ (†) ‡ (†) ‡ (†) ‡ (†) 6 ‡ (†) ‡Estonia........................................... 27 (0.5) 32 (3.4) 523 (5.1) 41 (4.2) 530 (4.3) 27 (3.8) 550 (5.4) # (†) ‡ (†) 12 (2.3) 540 (Ghana............................................ 5 37 (1.0) 16 (2.7) 232 (7.4) 18 (3.1) 249 (8.9) 29 (4.0) 292 (9.0) 37 (4.7) 289 (9.1) 48 (5.0) 271 (Hong Kong, SAR9,10...................... 39 (0.3) 3 (1.1) 504 (28.1) 6 (1.6) 513 (21.3) 49 (4.1) 575 (5.7) 43 (4.1) 612 (4.7) 26 (3.7) 598 (Hungary......................................... 22 (0.4) 64 (3.9) 522 (4.2) 35 (4.0) 540 (6.5) 2 (0.9) ‡ (†) # (†) ‡ (†) 8 (2.0) 532 (
Indonesia11.................................... 40 (0.5) 3 (1.7) 413 (8.6) 10 (2.8) 366 (20.0) 38 (4.1) 413 (8.3) 48 (4.3) 421 (6.7) 45 (3.9) 421 (Iran, Islamic Rebuplic of ................ 29 (0.4) 23 (2.9) 397 (5.7) 50 (4.0) 413 (4.5) 25 (3.3) 420 (6.0) 3 (1.4) 431 (13.7) 63 (4.4) 417 (Israel12........................................... 5 34 (0.4) 9 (2.2) 512 (18.3) 23 (3.7) 500 (9.2) 64 (4.5) 490 (4.9) 4 (1.7) 531 (4.5) 50 (3.8) 501 (Italy ................................................ 22 (0.3) 78 (3.1) 483 (3.4) 22 (3.1) 488 (8.3) # (†) ‡ (†) # (†) ‡ (†) 71 (3.5) 482 (Japan............................................. 35 (0.2) 3 (1.2) 561 (6.1) 18 (2.6) 557 (4.5) 78 (2.6) 571 (2.7) 1 (1.0) ‡ (†) 7 (2.2) 583 (2
Jordan............................................ 35 (0.7) 14 (2.8) 430 (9.4) 26 (3.6) 424 (13.3) 32 (4.4) 417 (5.9) 28 (3.8) 428 (7.4) 30 (3.8) 422 (Korea, Republic of13 ...................... 8 37 (0.4) 1 (0.9) ‡ (†) 20 (3.0) 569 (4.6) 57 (4.6) 594 (2.9) 22 (3.5) 600 (7.0) 14 9 (2.1) 582 (1Latvia ............................................. 24 (0.7) 52 (3.5) 497 (4.4) 42 (3.4) 519 (5.5) 3 (1.0) 527 (20.3) 3 (1.7) 506 (12.6) 17 (2.9) 523 (Lebanon......................................... 29 (0.9) 32 (3.9) 429 (6.0) 44 (4.8) 429 (5.1) 16 (3.1) 443 (10.4) 8 (3.1) 464 (8.7) 49 (4.6) 433 (Lithuania12..................................... 25 (0.3) 39 (3.2) 486 (4.2) 61 (3.2) 510 (3.0) # (†) ‡ (†) # (†) ‡ (†) 13 (2.7) 512 (
Macedonia, Republic of12 .............. 28 (0.4) 24 (3.5) 439 (9.2) 58 (4.3) 435 (5.9) 17 (3.6) 429 (13.7) 1 (1.0) ‡ (†) 22 (3.3) 450 (Malaysia......................................... 37 (0.4) 1 (0.7) ‡ (†) 18 (3.3) 514 (11.0) 56 (4.4) 503 (5.1) 25 (3.5) 515 (8.8) 60 (4.5) 508 (Moldova ......................................... 5 24 (0.5) 56 (4.5) 449 (6.0) 38 (4.6) 460 (7.0) 5 (2.5) 485 (25.2) 1 (0.6) ‡ (†) 6 43 (4.8) 451 (Morocco11,15.................................. ‡ (†) ‡ (†) ‡ (†) ‡ (†) ‡ (†) ‡ (†) ‡ (†) ‡ (†) ‡ (†) 14 54 (6.2) 391 (Netherlands9.................................. 26 (0.3) 33 (3.9) 514 (9.4) 66 (4.1) 546 (5.8) 1 (1.0) ‡ (†) # (†) ‡ (†) 7 (2.4) 550 (1
New Zealand.................................. 27 (0.4) 22 (3.0) 469 (8.9) 72 (4.1) 500 (5.7) 6 (3.2) 538 (17.8) # (†) ‡ (†) 7 (2.1) 479 (1Norway........................................... 25 (0.3) 34 (3.8) 467 (4.3) 65 (3.6) 460 (3.5) 1 (0.7) ‡ (†) 1 (0.7) ‡ (†) 25 (3.4) 460 (Palestinian National Authority ........ 39 (0.6) 6 (2.0) 398 (20.0) 17 (2.8) 393 (7.4) 27 (3.9) 394 (8.9) 50 (3.7) 385 (4.2) 30 (4.0) 389 (Philippines ..................................... 54 (0.7) 1 (0.6) ‡ (†) 1 (0.7) ‡ (†) 7 (2.0) 448 (23.4) 91 (2.1) 372 (5.4) 24 (4.0) 358 (1Romania ........................................ 24 (0.5) 51 (4.5) 469 (6.7) 46 (4.5) 480 (7.4) 3 (1.4) 534 (34.7) 1 (0.0) ‡ (†) 78 (3.3) 478 (
Russian Federation........................ 24 (0.6) 47 (4.2) 500 (5.1) 47 (3.6) 515 (5.0) 6 (3.4) 533 (11.0) # (†) ‡ (†) 56 (3.5) 514 (Saudi Arabia .................................. 28 (0.9) 36 (5.3) 333 (7.5) 26 (4.8) 340 (8.1) 29 (5.8) 330 (5.6) 8 (3.0) 325 (4.1) 14 (3.0) 331 (Scotland9 ....................................... 5 27 (0.5) 33 (3.9) 457 (7.2) 56 (4.4) 520 (6.2) 11 (3.4) 548 (10.1) 1 (0.7) ‡ (†) 3 (1.7) 549 (1Serbia11 ......................................... 26 (0.4) 38 (3.7) 464 (4.4) 51 (4.0) 483 (3.8) 11 (2.9) 489 (8.2) # (†) ‡ (†) 34 (4.1) 474 (Singapore ...................................... 38 (0.2) 2 (0.6) ‡ (†) 8 (1.6) 613 (18.0) 63 (2.7) 606 (5.0) 26 (2.5) 607 (5.7) 59 (2.4) 620 (
See notes at end of table.

652C
HA
PT
ER
6: International Com
parisons of Education
DIG
ES
T O
F E
DU
CAT
ION
STAT
IST
ICS
2005
ercent of students, with missing data having not been explicitly
cement schools were included.
nal Desired Population.f National Desired Population.s, but later in 2003, at the beginning of the next school year.cent of students, with missing data having not been explicitly
ly after replacement schools were included.8th grade or equivalent in most countries. Possible scores rangeding. Standard errors appear in parentheses.cational Achievement (IEA), Trends in International Mathematicsal Mathematics Report, by Ina V. S. Mullis et al. (This table was
2.4) 79 (2.9) 511 (4.0) 16 (2.7) 492 (6.3)9.2) 85 (3.1) 495 (2.5) 3 (1.0) 473 (9.7)9.2) 54 (3.9) 267 (9.6) 20 (3.3) 250 (9.1)7.0) 25 (3.2) 506 (6.0) 59 (3.7) 494 (4.0)9.1) 84 (3.0) 407 (2.2) 4 (1.6) 442 (11.3)8.0) 62 (2.9) 504 (3.8) 11 (2.2) 471 (9.5)
untry: 2003—Continued
chers' Emphasis on Mathematics Homework (EMH)1
Medium EMH3 Low EMH4
ore Percent Mean score Percent Mean score
12 13 14 15 16
†Not applicable.#Rounds to zero.‡Reporting standards not met.1Index based on teachers’ responses to two questions about how often they usually assign mathematics homework and howmany minutes of mathematics homework they usually assign.2High EMH indicates the assignment of more than 30 minutes of homework in about half of the lessons or more.3Medium level includes all possible combinations of responses not included in the high or low level categories (see below fordetails on the low level).4Low level indicates no assignment or the assignment of less than 30 minutes of homework in about half the lessons or less.5Class size data available for at least 70 but less than 85 percent of students, with missing data having not been explicitlyaccounted for in the analysis.6EMH data available for at least 70 but less than 85 percent of students, with missing data having not been explicitlyaccounted for in the analysis.7Did not satisfy guidelines for sample participation rates.
8Class size data available for at least 50 but less than 70 paccounted for in the analysis.9Met guidelines for sample participation rates only after repla10SAR=Special Administrative Region.11National Desired Population does not cover all of Internatio12National Defined Population covers less than 90 percent o13Korea tested the same cohort of students as other countrie14EMH data available for at least 50 but less than 70 peraccounted for in the analysis.15Nearly satisfied guidelines for sample participation rates onNOTE: Background data provided by teachers. Data are for from 0 to 1000. Detail may not sum to totals because of rounSOURCE: International Association for the Evaluation of Eduand Science Study (TIMSS), 2003, TIMSS 2003 Internationprepared April 2005.)
Slovak Republic ............................. 25 (0.4) 42 (4.6) 498 (4.7) 53 (4.7) 512 (5.4) 5 (1.8) 543 (19.7) # (†) ‡ (†) 5 (1.5) 510 (1Slovenia ......................................... 22 (0.3) 70 (4.1) 491 (3.0) 30 (4.1) 500 (4.1) # (†) ‡ (†) # (†) ‡ (†) 13 (2.9) 490 (South Africa ................................... 8 45 (1.3) 4 (1.2) 309 (35.8) 14 (3.0) 290 (23.8) 30 (3.7) 265 (11.7) 52 (4.1) 249 (8.7) 6 26 (3.4) 266 (Sweden.......................................... 21 (0.4) 71 (3.6) 491 (3.3) 27 (3.7) 522 (5.5) 1 (1.0) ‡ (†) # (†) ‡ (†) 17 (2.8) 503 (Tunisia............................................ 34 (0.3) 1 (1.0) ‡ (†) 26 (3.3) 404 (3.6) 71 (3.5) 412 (3.2) 2 (1.1) ‡ (†) 12 (2.5) 423 (United States15.............................. 5 24 (0.4) 56 (2.9) 504 (3.9) 39 (2.7) 510 (5.1) 4 (1.2) 531 (16.4) 1 (0.7) ‡ (†) 27 (2.5) 531 (
Table 396. Average size and scores of eighth-grade mathematics classes and Index of Teachers’ Emphasis on Mathematics Homework (EMH), by co
Country
Overallaverage
class size
Percentage distribution and mean scores of mathematics classes, by average class size Index of Tea
1 to 24 students 25 to 32 students 33 to 40 students 41 or more students High EMH2
Percent Mean score Percent Mean score Percent Mean score Percent Mean score Percent Mean sc
1 2 3 4 5 6 7 8 9 10 11

CH
AP
TE
R 6: International C
omparisons of E
ducation653
DIG
ES
T O
F E
DU
CAT
ION
STAT
IST
ICS
2005
ent each day2
Playing sportsReading
for enjoymentUsing
the InternetWorking
at a paid job
12 13 14 15
‡ (†) ‡ (†) ‡ (†) ‡ (†)1.6 (0.03) 0.7 (0.02) 1.3 (0.04) 0.4 (0.03)1.5 (0.03) 0.9 (0.02) 1.4 (0.03) 0.6 (0.02)1.6 (0.03) 0.5 (0.01) 1.3 (0.03) 0.2 (0.02)1.5 (0.02) 1.8 (0.03) 0.7 (0.02) 0.6 (0.03)
1.2 (0.04) 0.7 (0.03) 1.0 (0.04) 0.3 (0.02)1.8 (0.03) 0.6 (0.01) 0.7 (0.02) 0.3 (0.02)1.0 (0.02) 1.0 (0.02) 1.4 (0.04) 0.2 (0.01)1.7 (0.03) 0.9 (0.02) 1.2 (0.02) 0.6 (0.02)1.1 (0.02) 1.0 (0.02) 0.6 (0.02) 0.6 (0.02)
‡ (†) ‡ (†) ‡ (†) ‡ (†)1.4 (0.03) 0.7 (0.02) 1.5 (0.04) 0.4 (0.02)1.3 (0.02) 1.7 (0.03) 0.8 (0.03) 0.8 (0.03)1.0 (0.02) 1.1 (0.02) 2.0 (0.03) 0.1 (0.01)1.5 (0.03) 0.8 (0.02) 0.6 (0.03) 0.2 (0.02)
1.1 (0.02) 1.1 (0.02) 0.3 (0.02) 0.8 (0.03)1.4 (0.04) 1.0 (0.02) 0.2 (0.02) 0.7 (0.05)1.6 (0.03) 0.9 (0.02) 1.8 (0.04) 0.6 (0.02)1.8 (0.03) 0.7 (0.02) 0.6 (0.02) 0.9 (0.02)1.3 (0.03) 0.9 (0.02) 0.6 (0.02) 0.1 (0.01)
1.2 (0.03) 0.9 (0.02) 0.6 (0.03) 0.6 (0.03)0.7 (0.02) 0.6 (0.01) 1.7 (0.03) 0.1 (0.01)1.3 (0.03) 0.8 (0.03) 0.8 (0.03) 0.5 (0.02)1.6 (0.03) 1.0 (0.02) 1.0 (0.03) 0.8 (0.03)1.1 (0.03) 0.6 (0.02) 0.7 (0.03) 0.3 (0.02)
1.8 (0.03) 1.0 (0.02) 0.9 (0.03) 0.7 (0.03)1.1 (0.02) 1.2 (0.02) 0.6 (0.02) 0.3 (0.02)1.3 (0.03) 1.1 (0.03) 0.7 (0.03) 0.5 (0.03)1.5 (0.03) ‡ (†) ‡ (†) ‡ (†)1.7 (0.04) 0.5 (0.02) 1.5 (0.04) 0.8 (0.05)
1.5 (0.03) 0.7 (0.03) 1.3 (0.04) 0.6 (0.03)1.8 (0.03) 0.6 (0.02) 1.2 (0.03) 0.7 (0.02)1.1 (0.03) 1.0 (0.02) 0.5 (0.02) 0.6 (0.03)1.4 (0.02) 1.2 (0.02) 0.5 (0.03) 0.8 (0.04)1.3 (0.03) 1.0 (0.03) 0.8 (0.04) 0.5 (0.04)
1.3 (0.02) 1.1 (0.03) 0.4 (0.02) 0.2 (0.02)1.2 (0.04) 0.9 (0.02) 0.8 (0.05) 0.8 (0.03)1.7 (0.03) 0.6 (0.02) 1.4 (0.03) 0.5 (0.03)1.7 (0.03) 0.8 (0.02) 0.6 (0.03) 0.3 (0.02)1.4 (0.02) 0.9 (0.02) 1.6 (0.02) 0.2 (0.02)
Table 397. Eighth-grade students’ perceptions about mathematics and hours spent on leisure activities, by country: 2003
Country
Index of students’ self-confidence in learning mathematics (SCM)1 Average hours sp
High SCM Medium SCM Low SCM
WatchingTV or videos
Playingcomputer
games
Playingor talking
with friendsDoing
jobs at homePercentAverage
achievement PercentAverage
achievement PercentAverage
achievement
1 2 3 4 5 6 7 8 9 10 11
Armenia ................................. 41 (1.1) 505 (4.0) 40 (1.0) 468 (3.7) 19 (0.9) 462 (4.1) 1.8 (0.03) ‡ (†) ‡ (†) ‡ (†)Australia................................. 50 (1.7) 542 (4.5) 31 (1.1) 483 (3.7) 19 (1.2) 451 (6.4) 2.0 (0.03) 0.9 (0.02) 1.7 (0.04) 1.0 (0.02)Bahrain .................................. 44 (0.9) 437 (2.0) 38 (0.9) 379 (2.4) 18 (0.6) 366 (3.2) 2.0 (0.03) 1.2 (0.02) 1.6 (0.03) 1.2 (0.02)Belgium (Flemish).................. 45 (0.9) 556 (3.2) 30 (0.7) 526 (3.0) 25 (0.8) 518 (3.5) 2.1 (0.03) 1.0 (0.03) 1.9 (0.03) 0.9 (0.02)Botswana ............................... 38 (0.9) 390 (2.8) 45 (0.8) 361 (2.5) 17 (0.8) 352 (3.4) 1.4 (0.03) 0.5 (0.02) 2.1 (0.04) 2.3 (0.03)
Bulgaria .................................. 33 (1.3) 519 (5.5) 39 (1.4) 467 (4.2) 28 (1.2) 445 (4.8) 2.5 (0.04) 1.1 (0.04) 2.6 (0.05) 1.5 (0.03)Chile ...................................... 35 (0.9) 427 (3.9) 42 (0.7) 369 (3.4) 23 (0.7) 361 (3.9) 2.2 (0.02) 0.7 (0.02) 2.3 (0.02) 1.5 (0.02)Chinese Taipei ....................... 26 (1.0) 661 (4.1) 30 (0.7) 593 (5.1) 44 (1.1) 534 (4.0) 1.7 (0.03) 1.4 (0.04) 1.4 (0.03) 0.7 (0.01)Cyprus ................................... 46 (0.8) 503 (2.0) 32 (0.8) 437 (2.2) 22 (0.7) 407 (3.6) 2.1 (0.03) 1.3 (0.02) 2.1 (0.03) 1.0 (0.03)Egypt...................................... 58 (1.0) 437 (3.3) 35 (0.9) 383 (3.7) 7 (0.4) 374 (5.3) 0.8 (0.02) 0.7 (0.02) 0.8 (0.02) 1.3 (0.03)
England3................................. ‡ (†) ‡ (†) ‡ (†) ‡ (†) ‡ (†) ‡ (†) ‡ (†) ‡ (†) ‡ (†) ‡ (†)Estonia................................... 41 (0.9) 569 (3.2) 32 (0.7) 520 (3.1) 28 (0.8) 489 (3.5) 2.3 (0.03) 1.1 (0.03) 2.8 (0.03) 1.1 (0.02)Ghana.................................... — (†) — (†) — (†) — (†) — (†) — (†) 0.7 (0.02) 0.6 (0.02) 1.2 (0.03) 1.5 (0.03)Hong Kong, SAR4.................. 30 (0.9) 627 (2.9) 38 (0.7) 581 (4.1) 33 (0.9) 556 (4.0) 2.3 (0.03) 2.0 (0.04) 1.6 (0.03) 0.7 (0.01)Hungary................................. 44 (1.0) 574 (3.3) 32 (1.0) 507 (3.9) 24 (0.8) 479 (3.9) 2.1 (0.03) 1.1 (0.03) 2.2 (0.03) 1.1 (0.02)
Indonesia ................................ 27 (1.1) 420 (6.6) 59 (0.8) 408 (4.5) 15 (0.9) 416 (4.7) 1.5 (0.03) 0.5 (0.02) 1.3 (0.03) 2.2 (0.03)Iran, Islamic Republic of ........ 35 (0.9) 447 (3.5) 49 (0.8) 399 (2.6) 16 (0.7) 377 (3.4) 1.6 (0.03) 0.4 (0.02) 1.4 (0.03) 1.5 (0.03)Israel ...................................... 59 (1.2) 526 (3.5) 30 (0.9) 461 (3.8) 11 (0.7) 451 (5.7) 2.5 (0.04) 1.9 (0.03) 2.3 (0.03) 1.4 (0.03)Italy ........................................ 46 (0.9) 521 (3.3) 29 (0.9) 466 (3.6) 25 (1.0) 439 (3.4) 1.8 (0.03) 1.0 (0.02) 2.6 (0.03) 1.1 (0.03)Japan..................................... 17 (0.6) 634 (3.1) 38 (0.7) 580 (2.7) 45 (0.8) 538 (2.3) 2.7 (0.03) 0.9 (0.02) 1.6 (0.04) 0.6 (0.01)
Jordan..................................... 49 (1.2) 463 (4.7) 38 (1.0) 400 (3.7) 13 (0.7) 390 (4.4) 1.5 (0.03) 0.9 (0.03) 1.2 (0.03) 1.3 (0.03)Korea, Republic of5................ 30 (0.7) 650 (2.8) 36 (0.6) 592 (2.5) 34 (0.8) 534 (2.3) 1.7 (0.03) 1.5 (0.03) 1.8 (0.03) 0.7 (0.01)Latvia ..................................... 34 (1.0) 555 (3.4) 33 (0.9) 499 (3.2) 33 (1.0) 473 (3.4) 2.4 (0.03) 1.0 (0.02) 2.8 (0.03) 1.6 (0.03)Lebanon................................. 43 (1.4) 462 (3.6) 44 (1.1) 416 (3.1) 13 (0.7) 403 (4.4) 1.8 (0.04) 1.3 (0.03) 1.6 (0.04) 1.3 (0.03)Lithuania ................................ 36 (1.0) 552 (3.1) 37 (0.9) 486 (2.8) 26 (0.9) 456 (2.7) 2.1 (0.03) 1.1 (0.03) 2.6 (0.04) 1.6 (0.04)
Macedonia, Republic of .......... 33 (1.0) 482 (4.0) 37 (1.0) 418 (4.7) 31 (1.0) 424 (3.9) 2.3 (0.04) 1.3 (0.03) 2.2 (0.03) 1.6 (0.03)Malaysia................................. 39 (1.2) 546 (4.2) 45 (1.0) 490 (3.7) 16 (0.7) 471 (4.4) 2.1 (0.04) 0.8 (0.03) 1.5 (0.03) 1.7 (0.02)Moldova, Republic of ............. 30 (1.2) 494 (5.0) 50 (0.9) 451 (4.5) 20 (1.1) 441 (5.3) 1.9 (0.04) 0.7 (0.03) 2.0 (0.04) 2.2 (0.06)Morocco................................. ‡ (†) ‡ (†) ‡ (†) ‡ (†) ‡ (†) ‡ (†) 1.3 (0.04) 2.3 (0.06) 1.3 (0.03) 1.8 (0.03)Netherlands ........................... 45 (1.4) 557 (4.4) 33 (1.0) 527 (4.7) 23 (1.0) 511 (4.8) 2.1 (0.05) 1.2 (0.04) 2.0 (0.05) 0.8 (0.02)
New Zealand........................... 43 (1.4) 534 (6.4) 36 (1.1) 475 (5.4) 21 (0.9) 452 (4.1) 2.1 (0.04) 1.0 (0.04) 1.8 (0.05) 1.0 (0.02)Norway................................... 46 (1.1) 502 (2.0) 32 (0.8) 445 (2.9) 21 (0.8) 405 (3.4) 2.2 (0.03) 1.2 (0.03) 2.7 (0.03) 1.0 (0.03)Palestinian National Authority 43 (1.0) 428 (3.9) 41 (0.9) 370 (2.9) 16 (0.6) 355 (3.6) 1.2 (0.02) 0.7 (0.02) 1.3 (0.03) 1.5 (0.03)Philippines ............................. 29 (0.7) 405 (6.1) 59 (0.7) 369 (4.8) 12 (0.5) 366 (6.5) 1.6 (0.04) 0.6 (0.02) 1.7 (0.03) 1.9 (0.03)Romania ................................ 30 (1.2) 533 (4.6) 45 (1.1) 465 (4.5) 25 (0.9) 442 (5.4) 2.0 (0.04) 0.9 (0.03) 2.1 (0.03) 1.7 (0.05)
Russian Federation................. 43 (1.1) 548 (3.0) 30 (0.8) 492 (4.1) 27 (0.8) 466 (4.6) 2.0 (0.03) 1.0 (0.03) 2.5 (0.04) 1.6 (0.03)Saudi Arabia .......................... 41 (1.4) 361 (4.8) 43 (1.1) 321 (5.4) 16 (0.9) 303 (5.8) 1.6 (0.05) 1.1 (0.03) 1.3 (0.03) 1.5 (0.04)Scotland................................. 52 (1.5) 524 (3.9) 32 (1.0) 477 (3.8) 15 (0.9) 456 (5.0) 2.2 (0.03) 1.4 (0.04) 2.7 (0.03) 0.8 (0.02)Serbia .................................... 44 (1.1) 530 (2.8) 26 (0.7) 458 (3.2) 30 (1.1) 422 (3.4) 2.1 (0.03) 1.0 (0.03) 2.1 (0.03) 1.3 (0.03)Singapore .............................. 39 (0.8) 639 (3.0) 34 (0.7) 594 (3.9) 27 (0.7) 571 (4.6) 2.3 (0.02) 1.4 (0.02) 1.7 (0.02) 0.7 (0.02)
See notes at end of table.

654C
HA
PT
ER
6: International Com
parisons of Education
DIG
ES
T O
F E
DU
CAT
ION
STAT
IST
ICS
2005
0.5; 1–2 hours = 1.5; More than 2, but less than 4 hours = 3; 4 students may have reported engaging in more than one activity
.
, but later in 2003, at the beginning of the next school year.ries. Detail may not sum to totals because of rounding. Standard
cational Achievement (IEA), Trends in International Mathematicsal Mathematics Report, by Ina V. S. Mullis et al. (This table was
1.9 (0.04) 0.9 (0.02) 0.6 (0.03) 0.4 (0.02)1.7 (0.03) 0.8 (0.02) 1.1 (0.03) 0.4 (0.02)1.6 (0.02) 1.6 (0.03) 0.8 (0.02) 0.8 (0.02)1.6 (0.03) 0.6 (0.02) 1.7 (0.04) 0.4 (0.02)1.5 (0.02) 1.3 (0.02) 0.7 (0.02) 0.6 (0.02)1.8 (0.02) 0.7 (0.01) 1.8 (0.03) 0.6 (0.02)
ent each day2
Playing sportsReading
for enjoymentUsing
the InternetWorking
at a paid job
12 13 14 15
—Not available.†Not applicable.‡Reporting standards not met.1Index based on students’ responses to four statements about mathematics: 1) I usually do well in mathematics; 2) Mathe-matics is more difficult for me than for many of my classmates; 3) Mathematics is not one of my strengths; 4) I learn thingsquickly in mathematics. Average is computed across the four items based on a 4-point scale: 1. Agree a lot; 2. Agree a lit-tle; 3. Disagree a little; 4. Disagree a lot. Students showing positive attitudes a little or a lot of the time across the four state-ments were assigned to the high level. Students showing negative attitudes a little or a lot of the time across the fourstatements were assigned to the low level. Students showing mixed attitudes across the four statements were assigned tothe middle level.
2Number of hours based on: No time = 0; Less than 1 hour =or more hours = 4.5. Activities are not necessarily exclusive;at the same time.3Did not satisfy guidelines for international participation rates4SAR=Special Administrative Region.5Korea tested the same cohort of students as other countriesNOTE: Data are for eighth grade or equivalent in most counterrors appear in parentheses.SOURCE: International Association for the Evaluation of Eduand Science Study (TIMSS), 2003, TIMSS 2003 Internationprepared April 2005.)
Slovak Republic ...................... 40 (1.1) 556 (3.7) 35 (1.0) 487 (3.9) 25 (1.0) 462 (4.1) 2.5 (0.03) 1.1 (0.03) 2.8 (0.03) 1.5 (0.03)Slovenia ................................. 40 (0.9) 533 (3.2) 39 (1.0) 474 (2.5) 20 (0.9) 453 (2.8) 2.2 (0.03) 1.3 (0.03) 2.0 (0.03) 1.2 (0.03)South Africa ........................... 37 (0.9) 300 (8.3) 48 (0.9) 242 (3.9) 15 (0.8) 255 (9.9) 1.5 (0.03) 0.7 (0.02) 2.0 (0.03) 1.8 (0.03)Sweden.................................. 49 (1.3) 534 (2.6) 36 (0.9) 477 (3.1) 16 (0.9) 446 (3.4) 2.1 (0.03) 1.1 (0.03) 2.8 (0.03) 1.0 (0.02)Tunisia.................................... 44 (1.0) 436 (2.7) 36 (0.8) 399 (2.5) 20 (0.9) 384 (2.2) 1.4 (0.02) 0.8 (0.03) 1.5 (0.02) 1.9 (0.03)United States ......................... 51 (0.8) 534 (3.3) 29 (0.6) 483 (3.5) 20 (0.6) 461 (3.6) 2.2 (0.03) 1.1 (0.02) 2.4 (0.03) 1.2 (0.02)
Table 397. Eighth-grade students’ perceptions about mathematics and hours spent on leisure activities, by country: 2003—Continued
Country
Index of students’ self-confidence in learning mathematics (SCM)1 Average hours sp
High SCM Medium SCM Low SCM
WatchingTV or videos
Playingcomputer
games
Playingor talking
with friendsDoing
jobs at homePercentAverage
achievement PercentAverage
achievement PercentAverage
achievement
1 2 3 4 5 6 7 8 9 10 11

CHAPTER 6: International Comparisons of Education 655
—Not available.†Not applicable.#Rounds to zero.1Average hours based on: No time = 0; Less than 1 hour =.5; 1–2 hours = 1.5; 3–5 hours =4; More than 5 hours = 7.2Countries did not meet all International Association for the Evaluation of EducationAchievement’s sampling specifications.
NOTE: End of secondary school is equivalent to 12th grade in the United States and a fewother countries, but ranges from 9th to 14th grades among the survey countries. Possiblescores range from 1 to 1,000. Detail may not sum to totals because of rounding. Standarderrors appear in parentheses.SOURCE: International Association for the Evaluation of Educational Achievement (IEA),Mathematics and Science Achievement in the Final Year of Secondary School: IEA'sTrends in International Mathematics and Science Study, 1998, by Ina V. S. Mullis et. al.(This table was prepared October 1998.)
Table 398. Average mathematics scores at the end of secondary school, by sex, average time spent studying mathematics out of school, and country: 1995
Country
Average score in mathematics Amount of daily out-of-school study time in mathematics
Total Males Females
Less than 1 hour One to two hours Three or more hours
Average hours1Percent Mean score Percent Mean score Percent Mean score
1 2 3 4 5 6 7 8 9 10 11
Australia2 ................................... 522 (9.3) 540 (10.3) 510 (9.3) 59 (2.2) 521 (8.3) 36 (2.2) 557 (10.2) 5 (0.8) 534 (13.4) 1.0 (0.04)Austria2...................................... 518 (5.3) 545 (7.2) 503 (5.5) 77 (1.7) 526 (5.8) 19 (1.6) 533 (9.4) 4 (0.8) 502 (13.7) 0.6 (0.04)Canada2 .................................... 519 (2.8) 537 (3.8) 504 (3.5) 56 (2.1) 539 (5.1) 38 (1.9) 547 (5.0) 7 (1.0) 526 (14.6) 1.1 (0.05)Cyprus2...................................... 446 (2.5) 454 (4.9) 439 (3.7) 63 (2.1) 435 (4.3) 29 (1.8) 471 (4.8) 8 (1.3) 451 (9.0) 1.0 (0.05)Czech Republic.......................... 466 (12.3) 488 (11.3) 443 (16.8) 92 (1.5) 464 (13.8) 8 (1.4) 482 (17.8) # (†) — (†) 0.4 (0.03)
Denmark2 .................................. 547 (3.3) 575 (4.0) 523 (4.0) 68 (2.0) 571 (4.9) 28 (1.6) 563 (4.7) 4 (0.7) 562 (11.9) 0.9 (0.04)France2 ...................................... 523 (5.1) 544 (5.6) 506 (5.3) 59 (2.3) 517 (5.1) 35 (2.3) 539 (6.7) 5 (0.7) 505 (14.7) 1.0 (0.04)Germany2 .................................. 495 (5.9) 509 (8.7) 480 (8.8) — (†) — (†) — (†) — (†) — (†) — (†) — (†)Hungary..................................... 483 (3.2) 485 (4.9) 481 (4.8) 74 (0.9) 480 (3.2) 24 (0.8) 496 (5.5) 2 (0.2) — (†) 0.7 (0.02)Iceland2 ..................................... 534 (2.0) 558 (3.4) 514 (2.2) 79 (1.1) 553 (3.2) 19 (1.1) 542 (7.0) 2 (0.4) — (†) 0.7 (0.02)
Italy2 .......................................... 476 (5.5) 490 (7.4) 464 (6.0) 55 (2.6) 479 (6.3) 40 (2.2) 486 (7.2) 5 (0.9) 477 (11.2) 1.0 (0.05)Lithuania2 .................................. 469 (6.1) 485 (7.3) 461 (7.7) 67 (1.8) 472 (5.8) 29 (1.7) 480 (5.2) 4 (0.5) 484 (11.5) 0.8 (0.03)Netherlands2.............................. 560 (4.7) 585 (5.6) 533 (5.9) 82 (1.7) 606 (6.2) 16 (1.6) 581 (11.1) 1 (0.3) — (†) 0.7 (0.03)New Zealand.............................. 522 (4.5) 536 (4.9) 507 (6.2) 75 (1.4) 544 (6.1) 23 (1.4) 552 (5.9) 2 (0.3) — (†) 0.7 (0.03)Norway2 ..................................... 528 (4.1) 555 (5.3) 501 (4.8) 85 (1.4) 541 (5.1) 14 (1.3) 558 (9.5) 1 (0.3) — (†) 0.5 (0.03)
Russian Federation2 .................. 471 (6.2) 488 (6.5) 460 (6.6) 56 (2.0) 463 (5.9) 33 (1.4) 484 (7.5) 11 (1.2) 494 (8.1) 1.2 (0.06)Slovenia2 ................................... 512 (8.3) 535 (12.7) 490 (8.0) 72 (2.7) 521 (9.4) 25 (2.6) 518 (9.5) 2 (0.6) — (†) 0.7 (0.05)South Africa2 ............................. 356 (8.3) 365 (9.3) 348 (10.8) 33 (1.8) 394 (17.1) 51 (1.8) 375 (10.9) 17 (1.2) 344 (7.2) 1.7 (0.05)Sweden...................................... 552 (4.3) 573 (5.9) 531 (3.9) 90 (0.9) 579 (5.4) 9 (0.9) 580 (7.8) 1 (0.2) — (†) 0.4 (0.02)Switzerland ................................ 540 (5.8) 555 (6.4) 522 (7.4) 67 (1.6) 569 (4.9) 28 (1.3) 550 (5.6) 5 (0.9) 522 (10.6) 0.9 (0.04)United States2 ........................... 461 (3.2) 466 (4.1) 456 (3.6) 76 (1.5) 475 (3.8) 22 (1.5) 486 (5.9) 2 (0.2) — (†) 0.7 (0.02)
DIGEST OF EDUCATION STATISTICS 2005

656 CHAPTER 6: International Comparisons of Education
_
—Not available.†Not applicable.‡Does not meet reporting standards.1Computed as the ratio of science instructional time to the total instructional time averagedacross students.2Met guidelines for participation rates only after replacement schools were included.3Data are available for at least 50 but less than 70 percent of the students.4SAR=Special Administrative Region.5Data are available for at least 70 but less than 85 percent of the students.
6Korea tested the same cohort of students as other countries, but later in 2003, at thebeginning of the next school year.7National Desired Population does not cover all of International Desired Population.NOTE: Data are for fourth grade or equivalent in most countries. Detail may not sum tototals because of rounding. Standard errors appear in parentheses.SOURCE: International Association for the Evaluation of Educational Achievement (IEA),Trends in International Mathematics and Science Study (TIMSS), 2003, TIMSS 2003 Inter-national Science Report, by Ina V. S. Mullis et al. (This table was prepared October 2005.)
Table 399. Average fourth-grade science scores in content areas and average time spent teaching science in school, by country: 2003
Country
Average score by content area Average yearlyscience instructional
time in hours
Science instructionaltime as a percent of total
instructional time1Science overall Life science Physical science Earth science
1 2 3 4 5 6 7
Armenia ........................................... 437 (4.3) 435 (4.4) 429 (4.3) 450 (3.6) ‡ (†) ‡ (†)Australia........................................... 2 521 (4.2) 2 523 (3.8) 2 518 (3.9) 2 518 (4.1) 3 45 (2.6) 5 (0.3)Austria ............................................. — (†) — (†) — (†) — (†) — (†) — (†)Belgium (Flemish)............................ 518 (1.8) 524 (1.7) 507 (2.3) 522 (1.7) ‡ (†) ‡ (†)Canada ............................................ — (†) — (†) — (†) — (†) — (†) — (†)
Chinese Taipei ................................. 551 (1.7) 540 (1.6) 554 (2.0) 559 (2.6) 84 (1.0) 11 (0.2)Cyprus ............................................. 480 (2.4) 482 (2.1) 479 (2.3) 487 (2.5) 3 46 (1.4) 5 (0.2)Czech Republic................................ — (†) — (†) — (†) — (†) — (†) — (†)England ........................................... 2 540 (3.6) 2 532 (3.1) 2 546 (3.2) 2 535 (3.5) ‡ (†) ‡ (†)Greece............................................. — (†) — (†) — (†) — (†) — (†) — (†)
Hong Kong, SAR4............................ 2 542 (3.1) 2 535 (2.6) 2 548 (2.7) 2 536 (2.7) 3 77 (5.4) 8 (0.5)Hungary........................................... 530 (3.0) 536 (2.5) 526 (2.7) 526 (3.7) 3 54 (1.0) 6 (0.1)Iceland ............................................. — (†) — (†) — (†) — (†) — (†) — (†)Iran, Islamic Republic of .................. 414 (4.1) 424 (4.6) 419 (4.5) 428 (3.0) ‡ (†) ‡ (†)Ireland.............................................. — (†) — (†) — (†) — (†) — (†) — (†)
Israel ................................................ — (†) — (†) — (†) — (†) — (†) — (†)Italy .................................................. 516 (3.8) 521 (3.5) 512 (3.5) 519 (3.7) 5 73 (2.3) 5 8 (0.3)Japan............................................... 543 (1.5) 530 (1.3) 557 (1.7) 535 (1.9) 81 (1.2) 8 (0.2)Korea, Republic of6.......................... — (†) — (†) — (†) — (†) — (†) — (†)Kuwait .............................................. — (†) — (†) — (†) — (†) — (†) — (†)
Latvia ............................................... 532 (2.5) 531 (2.3) 532 (2.6) 534 (2.9) ‡ (†) ‡ (†)Lithuania .......................................... 512 (2.6) 2,7 516 (2.0) 2,7 512 (2.5) 2,7 503 (3.2) 53 (1.6) 6 (0.2)Netherlands ..................................... 2 525 (2.0) 2 547 (1.8) 2 505 (1.9) 2 503 (2.3) 3 33 (1.8) 3 (0.2)New Zealand.................................... 520 (2.5) 520 (2.3) 516 (2.3) 522 (2.3) 3 65 (3.5) 7 (0.4)Norway............................................. 466 (2.6) 480 (2.2) 456 (2.3) 473 (2.8) 5 38 (1.8) 5 4 (0.2)
Philippines ....................................... 332 (9.4) 330 (9.0) 343 (9.6) 324 (9.2) 5 176 (3.2) 5 16 (0.4)Portugal ........................................... — (†) — (†) — (†) — (†) — (†) — (†)Russian Federation.......................... 526 (5.2) 526 (4.7) 527 (5.2) 527 (6.0) 3 33 (1.2) 5 (0.2)Scotland........................................... 2 502 (2.9) 2 506 (3.1) 2 503 (2.6) 2 498 (2.6) ‡ (†) ‡ (†)Singapore ........................................ 565 (5.5) 506 (3.1) 503 (2.6) 498 (2.6) 64 (0.6) 7 (0.1)
Slovenia ........................................... 490 (2.5) 489 (2.9) 497 (2.3) 490 (2.7) 5 75 (2.2) 5 9 (0.3)Thailand........................................... — (†) — (†) — (†) — (†) — (†) — (†)Tunisia.............................................. 314 (5.7) 290 (5.9) 324 (5.3) 336 (4.8) ‡ (†) ‡ (†)United States ................................... 2 536 (2.5) 2 537 (2.2) 2 531 (2.3) 2 535 (2.5) 5 83 (3.0) 5 8 (0.3)
DIGEST OF EDUCATION STATISTICS 2005

CH
AP
TE
R 6: International C
omparisons of E
ducation657
DIG
ES
T O
F E
DU
CAT
ION
STAT
IST
ICS
2005
science homework (TSH) in a normal school week 1
Medium TSH Low TSH
PercentAverage
achievement PercentAverage
achievement
10 11 12 13
(0.2) 466 (0.9) 43 (0.3) 467 (0.9)
(†) — (†) — (†) — (†)(1.6) 530 (3.3) 56 (2.0) 530 (4.4)(1.3) 441 (2.5) 31 (1.4) 445 (2.6)
(†) — (†) — (†) — (†)(1.0) 368 (3.2) 40 (1.2) 366 (3.6)
(†) — (†) — (†) — (†)(†) — (†) — (†) — (†)
(1.3) 4 581 (4.0) 4 51 (2.1) 4 561 (3.5)(†) — (†) — (†) — (†)(†) ‡ (†) ‡ (†) ‡ (†)
(0.8) 436 (4.0) 13 (0.6) 430 (6.6)(†) — (†) — (†) — (†)
(1.0) 262 (6.0) 22 (1.0) 258 (8.1)(1.4) 563 (2.9) 50 (1.4) 554 (3.9)
(†) — (†) — (†) — (†)
(†) — (†) — (†) — (†)(1.4) 457 (2.9) 49 (1.7) 452 (2.7)(1.6) 485 (4.3) 44 (2.0) 505 (3.4)(1.1) 487 (3.7) 45 (1.4) 496 (3.7)
(†) — (†) — (†) — (†)
(1.2) 478 (3.9) 29 (1.5) 499 (5.0)(1.7) 562 (2.4) 70 (2.0) 559 (1.9)
(†) — (†) — (†) — (†)(†) — (†) — (†) — (†)(†) — (†) — (†) — (†)
(†) — (†) — (†) — (†)(0.9) 510 (3.6) 31 (1.3) 510 (4.6)
(†) — (†) — (†) — (†)(1.1) 12 396 (3.4) 12 39 (1.3) 12 408 (3.5)
(†) — (†) — (†) — (†)
(1.6) 531 (6.9) 48 (2.0) 518 (5.1)(1.2) 493 (3.1) 43 (1.7) 503 (2.3)(1.3) 442 (3.4) 23 (1.3) 441 (4.8)(0.8) 379 (5.7) 33 (1.2) 381 (7.2)
(†) — (†) — (†) — (†)
(†) — (†) — (†) — (†)(1.5) 402 (4.6) 31 (1.7) 403 (4.6)(1.4) 508 (5.0) 71 (1.5) 517 (3.4)
(†) — (†) — (†) — (†)(0.7) 585 (4.4) 34 (0.9) 564 (5.5)
_
Table 400. Average eighth-grade science scores in content areas and average time spent studying out of school, by country: 2003
Country
Average score by content area Index of time students spend doing
Science overall Life science Chemistry Physics Earth scienceEnvironmental
science
High TSH
PercentAverage
achievement
1 2 3 4 5 6 7 8 9
International average................. 473 (0.5) 474 (0.5) 474 (0.5) 474 (0.5) 474 (0.5) 474 (0.5) 13 (0.2) 458 (1.3) 44
Armenia ........................................... 461 (3.5) 2 453 (3.3) 2 466 (4.2) 479 (3.2) 2 460 (3.7) 2 417 (4.4) — (†) — (†) —Australia........................................... 527 (3.8) 3 532 (3.8) 3 506 (3.8) 3 521 (3.7) 3 531 (4.2) 3 536 (3.4) 9 (0.8) 520 (6.4) 35Bahrain ............................................ 438 (1.8) 2 445 (1.9) 2 441 (2.6) 2 443 (2.0) 2 440 (2.4) 2 439 (3.1) 13 (0.7) 426 (4.1) 56Belgium (Flemish)............................ 516 (2.5) 3 526 (2.4) 3 503 (2.0) 3 514 (2.5) 3 508 (2.5) 3 523 (2.7) — (†) — (†) —Botswana ......................................... 365 (2.8) 2 370 (2.7) 2 348 (3.1) 2 371 (3.2) 2 361 (3.1) 2 381 (3.3) 14 (0.7) 378 (6.1) 45
Bulgaria ........................................... 479 (5.2) 474 (5.2) 482 (5.7) 3 485 (5.0) 3 491 (4.9) 2 464 (5.0) — (†) — (†) —Chile ................................................ 413 (2.9) 2 427 (2.7) 2 405 (3.3) 2 401 (3.1) 2 435 (3.1) 2 436 (2.9) — (†) — (†) —Chinese Taipei ................................. 571 (3.5) 3 563 (3.1) 3 584 (4.0) 3 569 (3.3) 3 548 (3.1) 3 560 (3.1) 4 12 (1.2) 4 588 (4.6) 4 37Cyprus ............................................. 441 (2.0) 2 437 (2.2) 2 443 (2.6) 2 450 (1.7) 2 447 (2.1) 2 441 (2.3) — (†) — (†) —England5.......................................... ‡ (†) ‡ (†) ‡ (†) ‡ (†) ‡ (†) ‡ (†) ‡ (†) ‡ (†) ‡
Egypt................................................ 421 (3.9) 2 425 (3.7) 2 442 (3.8) 2 414 (4.1) 2 403 (4.4) 2 430 (4.0) 23 (0.7) 416 (4.4) 64Estonia............................................. 552 (2.5) 3 547 (2.4) 3 552 (2.1) 3 544 (2.4) 3 558 (2.9) 3 540 (2.2) — (†) — (†) —Ghana.............................................. 255 (5.9) 2 256 (5.6) 2 276 (6.6) 2 239 (5.4) 2 254 (5.6) 2 267 (6.2) 25 (1.2) 267 (8.5) 54Hong Kong, SAR6,7 ......................... 556 (3.0) 3 551 (2.9) 3 542 (2.6) 3 555 (2.8) 3 549 (2.9) 3 555 (2.6) 6 (0.5) 548 (4.6) 43Hungary........................................... 543 (2.8) 3 536 (2.7) 3 560 (3.1) 3 536 (2.7) 3 537 (3.1) 3 528 (2.9) — (†) — (†) —
Indonesia8 ....................................... 420 (4.1) 2 424 (3.9) 2 391 (3.8) 2 430 (4.0) 2 431 (3.8) 2 454 (3.4) — (†) — (†) —Iran, Islamic Rebuplic of .................. 453 (2.3) 2 447 (2.6) 2 445 (2.7) 2 445 (3.0) 2 468 (2.9) 3 487 (2.1) 8 (0.7) 451 (5.6) 42Israel9 .............................................. 10 488 (3.1) 3 491 (3.0) 3 499 (3.4) 3 484 (2.9) 3 485 (3.0) 3 486 (2.9) 13 (0.9) 480 (4.7) 43Italy .................................................. 491 (3.1) 3 498 (3.2) 3 487 (3.3) 470 (3.2) 3 513 (3.2) 3 497 (3.0) 14 (1.0) 489 (5.9) 41Japan............................................... 552 (1.7) 3 549 (2.0) 3 552 (2.1) 3 564 (1.9) 3 530 (2.1) 3 537 (2.0) — (†) — (†) —
Jordan.............................................. 475 (3.8) 475 (4.0) 478 (4.4) 2 465 (3.8) 472 (4.0) 3 492 (3.2) 19 (0.9) 466 (4.2) 52Korea, Rep. of11............................... 558 (1.6) 3 558 (1.6) 3 529 (2.5) 3 579 (1.6) 3 540 (1.9) 3 544 (1.4) 4 (0.4) 549 (6.3) 26Latvia ............................................... 513 (2.9) 3 511 (2.5) 3 514 (3.2) 3 512 (2.4) 3 514 (2.8) 3 508 (3.3) — (†) — (†) —Lebanon........................................... 393 (4.3) 2 360 (5.0) 2 433 (4.9) 2 419 (4.0) 2 395 (4.0) 2 374 (5.1) — (†) — (†) —Lithuania8 ........................................ 519 (2.1) 517 (2.4) 3 534 (2.3) 3 519 (2.7) 3 512 (2.7) 3 507 (2.0) — (†) — (†) —
Macedonia9 ..................................... 449 (3.6) 2 448 (3.8) 2 467 (3.9) 2 458 (3.1) 2 440 (4.3) 2 442 (3.7) — (†) — (†) —Malaysia........................................... 510 (3.7) 3 504 (3.7) 3 514 (3.8) 3 519 (3.6) 3 502 (3.8) 3 513 (3.2) 20 (1.0) 513 (4.4) 49Moldova ........................................... 472 (3.4) 2 466 (3.7) 479 (3.9) 479 (3.7) 475 (4.0) 2 454 (3.8) — (†) — (†) —Morocco7,8....................................... 10 396 (2.5) 2 390 (2.6) 2 402 (2.7) 2 410 (2.7) 2 397 (3.4) 2 396 (3.3) 12 14 (0.7) 12 391 (5.3) 12 47Netherlands7.................................... 536 (3.1) 3 536 (3.3) 3 514 (2.6) 3 538 (3.4) 3 534 (3.2) 3 539 (2.8) — (†) — (†) —
New Zealand.................................... 520 (5.0) 3 523 (5.1) 3 501 (5.6) 3 515 (4.7) 3 525 (4.8) 3 525 (3.9) 10 (1.3) 519 (6.2) 41Norway............................................. 494 (2.2) 3 496 (2.5) 3 485 (3.0) 3 488 (2.6) 3 517 (2.7) 3 496 (2.2) 13 (0.8) 485 (3.7) 44Palestinian National Authority .......... 435 (3.2) 2 435 (3.6) 2 444 (3.9) 2 432 (3.6) 2 439 (3.0) 2 444 (3.7) 21 (1.1) 433 (4.4) 56Philippines13 .................................... 377 (5.8) 2 387 (5.8) 2 342 (6.1) 2 380 (4.7) 2 377 (5.7) 2 403 (5.4) 17 (0.7) 381 (7.5) 50Romania .......................................... 470 (4.9) 471 (4.8) 474 (4.9) 473 (4.1) 469 (5.2) 472 (4.7) — (†) — (†) —
Russian Federation.......................... 514 (3.7) 3 514 (3.3) 3 527 (4.0) 3 511 (3.4) 3 518 (3.3) 3 491 (3.2) — (†) — (†) —Saudi Arabia .................................... 398 (4.0) 2 412 (3.9) 2 382 (4.8) 2 394 (3.9) 2 394 (4.0) 2 410 (3.8) 8 (0.7) 382 (6.0) 61Scotland7 ......................................... 512 (3.4) 3 512 (3.3) 3 499 (3.2) 3 515 (3.0) 3 515 (3.8) 3 511 (3.5) 3 (0.4) 487 (14.2) 27Serbia8............................................. 468 (2.5) 2 468 (2.6) 474 (3.2) 471 (2.6) 471 (3.0) 2 457 (2.4) — (†) — (†) —Singapore ........................................ 578 (4.3) 3 569 (4.0) 3 582 (4.2) 3 579 (3.4) 3 549 (3.9) 3 568 (3.8) 18 (0.7) 595 (4.1) 48
See notes at end of table.

658C
HA
PT
ER
6: International Com
parisons of Education
DIG
ES
T O
F E
DU
CAT
ION
STAT
IST
ICS
2005
al Desired Population.National Desired Population.
s, but later in 2003, at the beginning of the next school year.lacement schools were included.
ries. Detail may not sum to totals because of rounding. Standard
cational Achievement (IEA), Trends in International Mathematicsal Science Report, by Ina V. S. Mullis et al. (This table was pre-
(†) — (†) — (†) — (†)(†) — (†) — (†) — (†)
(0.9) 246 (7.9) 32 (0.9) 263 (7.4)(†) — (†) — (†) — (†)
(0.9) 400 (2.8) 56 (1.2) 411 (2.6)(1.4) 530 (3.4) 45 (1.7) 531 (3.7)
science homework (TSH) in a normal school week 1
Medium TSH Low TSH
PercentAverage
achievement PercentAverage
achievement
10 11 12 13
—Not available.†Not applicable.‡Reporting standards not met.1Index based on students’ reports on the frequency and amount of science homework they are given. High level indicatesmore than 30 minutes of science homework assigned 3–4 times a week. Low level indicates no more than 30 minutes of sci-ence homework no more than twice a week. Medium level includes all other possible combinations of responses.2Country average significantly lower than international average.3Country average significantly higher than international average.4Students were asked about natural science; data pertain to grade 8 physics/chemistry course.5Did not satisfy guidelines for sample participation rates.6SAR=Special Administrative Region.7Met guidelines for sample participation rates only after replacement schools were included.
8National Desired Population does not cover all of Internation9National Defined Population covers less than 90 percent of 10Did not meet international sampling or other guidelines.11Korea tested the same cohort of students as other countrie12Met guidelines for sample participation rates only after rep13Students study only biology at grade 8.NOTE: Data are for eighth grade or equivalent in most counterrors appear in parentheses.SOURCE: International Association for the Evaluation of Eduand Science Study (TIMSS), 2003, TIMSS 2003 Internationpared October 2005.)
Slovak Republic ............................... 517 (3.2) 3 514 (2.9) 3 519 (3.6) 3 519 (2.9) 3 523 (3.3) 3 509 (2.8) — (†) — (†) —Slovenia ........................................... 520 (1.8) 3 521 (2.2) 3 532 (2.6) 3 509 (1.8) 3 523 (2.2) 3 515 (2.2) — (†) — (†) —South Africa ..................................... 244 (6.7) 2 250 (6.0) 2 285 (5.9) 2 244 (6.2) 2 247 (6.3) 2 261 (6.6) 17 (0.7) 234 (9.6) 52Sweden............................................ 524 (2.7) 3528 (2.7) 3 526 (2.6) 3 525 (2.9) 3 532 (3.3) 3 499 (2.6) — (†) — (†) —Tunisia.............................................. 404 (2.1) 2 417 (2.0) 2 413 (2.5) 2 386 (2.5) 2 408 (2.0) 2 436 (2.2) 9 (0.6) 398 (4.0) 35United States9 ................................. 10 527 (3.1) 3 537 (3.0) 3 513 (3.2) 3 515 (2.9) 3 532 (2.9) 3 533 (2.9) 13 (0.7) 519 (4.3) 43
Table 400. Average eighth-grade science scores in content areas and average time spent studying out of school, by country: 2003—Continued
Country
Average score by content area Index of time students spend doing
Science overall Life science Chemistry Physics Earth scienceEnvironmental
science
High TSH
PercentAverage
achievement
1 2 3 4 5 6 7 8 9

CH
AP
TE
R 6: International C
omparisons of E
ducation659
DIG
ES
T O
F E
DU
CAT
ION
STAT
IST
ICS
2005
ience instructional time as a percent of total instructional time 1
Generalegratedscience
Earthscience Chemistry Biology Physics
13 14 15 16 17
(0.1) 6 (0.1) 7 (0.1) 6 (0.1) 7 (0.1)
(0.4) — (†) — (†) — (†) — (†)(0.1) — (†) — (†) — (†) — (†)
(†) 5 (0.3) — (†) 6 (0.3) 6 (0.3)(†) — (†) — (†) — (†) — (†)(†) 3 6 (0.2) 3 8 (0.4) 8 (0.4) 3 8 (0.4)
(0.3) — (†) — (†) — (†) — (†)(†) — (†) — (†) — (†) 5 12 (0.2)(†) 6 (0.1) 4 (0.2) — (†) 6 (0.1)(†) — (†) — (†) — (†) — (†)(†) — (†) — (†) — (†) — (†)
(†) 5 (0.3) 6 (0.4) 8 (0.5) 6 (0.2)(†) — (†) — (†) — (†) — (†)
(0.4) — (†) — (†) — (†) — (†)(†) 6 (0.2) 5 (0.2) 6 (0.2) 5 (0.2)(†) — (†) — (†) 7 (0.3) 7 (0.3)
(0.4) — (†) — (†) — (†) — (†)(†) — (†) — (†) — (†) — (†)
(0.1) — (†) — (†) — (†) — (†)(0.1) — (†) — (†) — (†) — (†)(0.2) — (†) — (†) — (†) — (†)
(0.2) — (†) — (†) — (†) — (†)(†) — (†) ‡ (†) 7 (0.4) 6 (0.4)(†) — (†) — (†) — (†) — (†)(†) 3 6 (0.1) 3 6 (0.2) 3 4 (0.4) 3 6 (0.1)(†) 3 6 (0.2) 3 7 (0.3) 3 7 (0.3) 3 9 (0.2)
(0.2) — (†) — (†) — (†) — (†)(†) — (†) — (†) — (†) — (†)(†) 7 — (†) 8 — (†) 7 ‡ (†) 8 ‡ (†)(†) 5 (0.1) 8 — (†) 5 (0.2) 8 6 (0.2)
(0.3) — (†) — (†) — (†) — (†)
(0.3) — (†) — (†) — (†) — (†)(0.2) — (†) — (†) — (†) — (†)(0.5) — (†) — (†) — (†) — (†)
(†) 36 (0.2) 3 7 (0.2) 3 4 (0.3) 3 7 (0.3)(†) 3 6 (0.1) 3 7 (0.2) 3 6 (0.1) 3 6 (0.1)
_
Table 401. Instructional practices and time spent teaching science in eighth grade, by country: 2003
Country
Percent of students reported doing the same activity about half the lessons or more Students’ average yearly instructional time in hours Sc
Watch theteacher
demonstratean
experimentor
investigation
Design orplan an
experimentor investi-
gation
Conduct anexperiment
orinvestigation
Work insmall groups
on anexperiment
orinvestigation
Writeexplana-
tions aboutwhat wasobserved
and why ithappened
Relate whatis being
learned inscience to
our dailylives
Generalintegrated
scienceEarth
science Chemistry Biology Physicsint
1 2 3 4 5 6 7 8 9 10 11 12
International average.............. 64 (0.2) 49 (0.2) 57 (0.3) 59 (0.3) 66 (0.2) 57 (0.2) 117 (0.7) 55 (0.6) 61 (0.8) 61 (0.8) 68 (0.6) 12
Australia........................................ 54 (1.6) 49 (1.7) 60 (2.2) 68 (2.1) 75 (1.5) 42 (1.1) 2 132 (3.6) — (†) — (†) — (†) — (†) 13Bahrain ......................................... 83 (0.8) 63 (0.8) 64 (0.8) 66 (1.1) 68 (0.9) 64 (0.9) 119 (1.1) — (†) — (†) — (†) — (†) 14Belgium (Flemish)......................... — (†) — (†) — (†) — (†) — (†) — (†) — (†) 2 52 (3.2) — (†) 2 55 (3.3) 2 58 (2.7) --—Botswana ...................................... 61 (0.9) 45 (0.8) 48 (1.0) 50 (1.1) 61 (0.9) 71 (0.8) ‡ (†) — (†) — (†) — (†) — (†) ‡Bulgaria ........................................ — (†) — (†) — (†) — (†) — (†) — (†) — (†) 3 53 (2.2) 3 63 (2.9) 2 65 (3.2) 3 64 (3.3) --—
Chile ............................................. 57 (1.3) 56 (1.4) 54 (1.5) 61 (1.4) 69 (1.0) 62 (0.7) 3 118 (2.2) — (†) — (†) — (†) — (†) 3 11Chinese Taipei .............................. 4 48 (1.1) 424 (0.9) 4 36 (1.3) 4 37 (1.5) 4 37 (1.1) 4 40 (1.0) — (†) — (†) — (†) — (†) 5 134 (2.0) —Cyprus .......................................... — (†) — (†) — (†) — (†) — (†) — (†) — (†) 2 53 (0.7) 2 34 (1.6) — (†) 2 52 (0.8) —England ........................................ ‡ (†) ‡ (†) ‡ (†) ‡ (†) ‡ (†) ‡ (†) ‡ (†) — (†) — (†) — (†) — (†) ‡Egypt............................................. 80 (0.7) 61 (1.0) 62 (1.0) 60 (0.8) 71 (0.7) 73 (0.7) ‡ (†) — (†) — (†) — (†) — (†) ‡
Estonia.......................................... — (†) — (†) — (†) — (†) --— (†) — (†) ‡ (†) 55 (2.9) 65 (3.9) 80 (4.8) 59 (1.8) ‡Ghana........................................... 73 (1.2) 54 (1.3) 55 (1.3) 54 (1.5) 64 (1.5) 75 (1.0) ‡ (†) — (†) — (†) — (†) — (†) ‡Hong Kong, SAR6......................... 66 (1.2) 35 (1.0) 71 (1.5) 75 (1.2) 67 (1.2) 61 (0.8) 2 103 (4.0) — (†) — (†) — (†) — (†) 11Hungary........................................ — (†) — (†) — (†) — (†) — (†) — (†) — (†) 2 58 (2.5) 2 59 (2.1) 2 61 (2.8) 2 57 (2.5) —Indonesia ...................................... — (†) — (†) — (†) — (†) — (†) — (†) — (†) — (†) — (†) 2 93 (3.6) 2 93 (3.3) —
Iran, Islamic Rebuplic of ............... 87 (1.0) 66 (1.4) 77 (1.2) 73 (1.5) 78 (1.0) 70 (1.0) 2 106 (3.7) — (†) — (†) — (†) — (†) 11Israel ............................................. 73 (1.6) 56 (1.4) 63 (1.6) 52 (1.8) 76 (1.3) 56 (1.0) ‡ (†) — (†) — (†) — (†) — (†) ‡Italy ............................................... 26 (1.3) 16 (0.9) 13 (0.8) 12 (0.8) 32 (1.4) 35 (1.1) 2 69 (1.1) — (†) — (†) — (†) — (†) 7Japan............................................ 66 (1.5) 51 (1.7) 75 (1.7) 79 (1.6) 69 (1.5) 27 (1.1) 3 99 (1.5) — (†) — (†) — (†) — (†) 3 9Jordan........................................... 67 (1.5) 56 (1.4) 55 (1.7) 53 (1.6) 66 (1.3) 70 (1.1) 135 (0.8) — (†) — (†) — (†) — (†) 15
Korea, Rep. of............................... 31 (1.0) 14 (0.8) 20 (1.1) 39 (1.3) 44 (1.3) 36 (0.9) 2 103 (2.7) — (†) — (†) — (†) — (†) 9Latvia ............................................ — (†) — (†) — (†) — (†) — (†) — (†) — (†) — (†) ‡ (†) 2 64 (4.2) 2 56 (4.1) —Lebanon........................................ — (†) — (†) — (†) — (†) — (†) — (†) ‡ (†) — (†) — (†) — (†) — (†) ‡Lithuania ....................................... — (†) — (†) — (†) — (†) — (†) — (†) — (†) 3 59 (0.4) 3 65 (1.2) 3 46 (3.5) 3 60 (0.8) —Macedonia .................................... — (†) — (†) — (†) — (†) — (†) — (†) — (†) 3 53 (1.4) 3 64 (2.5) 3 59 (2.0) 3 79 (1.5) —
Malaysia........................................ 83 (1.1) 46 (1.3) 71 (1.7) 77 (1.3) 73 (1.0) 72 (1.0) 119 (1.8) — (†) — (†) — (†) — (†) 12Moldova ........................................ — (†) — (†) — (†) — (†) — (†) — (†) ‡ (†) — (†) — (†) — (†) — (†) ‡Morocco........................................ 82 (1.2) 62 (1.3) 3 61 (1.2) 50 (1.3) 74 (1.0) 3 65 (1.2) — (†) 7 — (†) 8 — (†) 7 ‡ (†) 8 ‡ (†) —Netherlands .................................. — (†) — (†) — (†) — (†) — (†) — (†) — (†) 2 54 (1.7) 8 — (†) 2 58 (1.8) 2,8 68 (2.4) —New Zealand................................. 60 (2.0) 50 (2.1) 56 (2.5) 66 (2.3) 73 (1.8) 45 (1.3) 132 (2.4) — (†) — (†) — (†) — (†) 14
Norway.......................................... 40 (1.5) 34 (1.6) 49 (2.2) 49 (2.2) 56 (1.9) 31 (0.9) 92 (2.5) — (†) — (†) — (†) — (†) 11Palestinian National Authority ....... 70 (1.2) 56 (1.2) 57 (1.0) 54 (1.5) 66 (1.2) 69 (0.9) 2 101 (1.8) — (†) — (†) — (†) — (†) 11Philipines9..................................... 74 (0.9) 58 (1.2) 57 (1.0) 62 (1.1) 72 (1.0) 76 (0.8) 202 (4.2) — (†) — (†) — (†) — (†) 18Romania ....................................... — (†) — (†) — (†) — (†) — (†) — (†) — (†) 3 60 (1.1) 3 67 (2.4) 3 38 (2.6) 3 67 (2.4) —Russian Federation....................... — (†) — (†) — (†) — (†) — (†) — (†) — (†) 3 49 (0.7) 3 59 (1.2) 3 49 (0.8) 3 49 (0.9) —
See notes at end of table.

660C
HA
PT
ER
6: International Com
parisons of Education
DIG
ES
T O
F E
DU
CAT
ION
STAT
IST
ICS
2005
science teachers.istry teachers.
ies. Standard errors appear in parentheses. Detail may not sum
cational Achievement (IEA), Trends In International Mathematicsl Science Report, by Michael O. Martin et al. (This table was pre-
(†) — (†) — (†) — (†) — (†)(†) — (†) — (†) — (†) — (†)(†) 7 (0.3) 8 (0.5) 7 (0.1) 7 (0.3)
(0.2) — (†) — (†) (†) — (†)(†) 3 7 (0.4) 3 8 (0.4) 3 8 (0.5) 3 7 (0.4)
(†) — (†) 6 (0.1) 5 (0.1) 3 5 (0.1)(†) — (†) — (†) — (†) — (†)
(0.8) — (†) — (†) — (†) — (†)(†) — (†) — (†) — (†) — (†)
(0.2) — (†) — (†) — (†) — (†)
ience instructional time as a percent of total instructional time 1
Generalegratedscience
Earthscience Chemistry Biology Physics
13 14 15 16 17
—Not available.†Not applicable.‡Reporting standards not met.1Computed as the relation of science instructional time to the total instructional time averaged across students.2Data are available for at least 50 but less than 70 percent of the students.3Data are available for at least 70 but less than 85 percent of the students.4Students who reported doing science investigations were asked about natural science; data pertain to grade 8 physics/chemistry courses for these students as well.5Data reported in the physics panel are for grade 8 science and chemistry teachers.6SAR = Special Administrative Region.
7Data reported in biology panel are for grade 8 biology/earth8Data reported in physics panel are for grade 8 physics/chem9Students study only biology at grade 8.NOTE: Data are for eighthgrade or equivalent in most countrto totals because of rounding.SOURCE: International Association for the Evaluation of Eduand Science Study (TIMSS) 2003, TIMSS 2003 Internationapared April 2005.)
Saudi Arabia ................................. 68 (1.3) 50 (1.3) 51 (1.4) 43 (1.4) 60 (1.3) 67 (1.0) 2 106 (1.6) — (†) — (†) — (†) — (†) 11Scotland........................................ 69 (1.4) 54 (1.3) 74 (1.4) 81 (1.2) 83 (1.1) 47 (1.0) ‡ (†) — (†) — (†) — (†) — (†) ‡Serbia ........................................... — (†) — (†) — (†) — (†) — (†) — (†) — (†) 2 53 (2.2) 2 61 (3.7) 2 53 (1.0) 2 56 (2.5) —Singapore ..................................... 49 (0.9) 31 (0.6) 55 (1.0) 57 (0.8) 68 (0.8) 58 (0.7) 107 (1.9) — (†) — (†) — (†) — (†) 12Slovak Republic ............................ — (†) — (†) — (†) — (†) — (†) — (†) — (†) 3 66 (3.9) 3 76 (3.8) 3 72 (5.2) 3 70 (4.5) —
Slovenia ........................................ — (†) — (†) — (†) — (†) — (†) — (†) — (†) — (†) 59 (1.1) 56 (0.7) 3 57 (0.5) —South Africa .................................. 72 (1.1) 64 (1.2) 63 (1.1) 70 (1.1) 73 (0.7) 77 (0.7) ‡ (†) — (†) — (†) — (†) — (†) ‡Sweden......................................... — (†) — (†) — (†) — (†) — (†) — (†) 3 131 (7.6) — (†) — (†) — (†) — (†) 14Tunisia........................................... 79 (0.7) 65 (1.0) 69 (1.0) 55 (1.2) 73 (0.8) 54 (0.9) ‡ (†) — (†) — (†) — (†) — (†) ‡United States ................................ 57 (1.3) 48 (1.2) 55 (1.4) 65 (1.5) 65 (1.4) 51 (0.9) 2 135 (2.2) — (†) — (†) — (†) — (†) 2 13
Table 401. Instructional practices and time spent teaching science in eighth grade, by country: 2003—Continued
Country
Percent of students reported doing the same activity about half the lessons or more Students’ average yearly instructional time in hours Sc
Watch theteacher
demonstratean
experimentor
investigation
Design orplan an
experimentor investi-
gation
Conduct anexperiment
orinvestigation
Work insmall groups
on anexperiment
orinvestigation
Writeexplana-
tions aboutwhat wasobserved
and why ithappened
Relate whatis being
learned inscience to
our dailylives
Generalintegrated
scienceEarth
science Chemistry Biology Physicsint
1 2 3 4 5 6 7 8 9 10 11 12
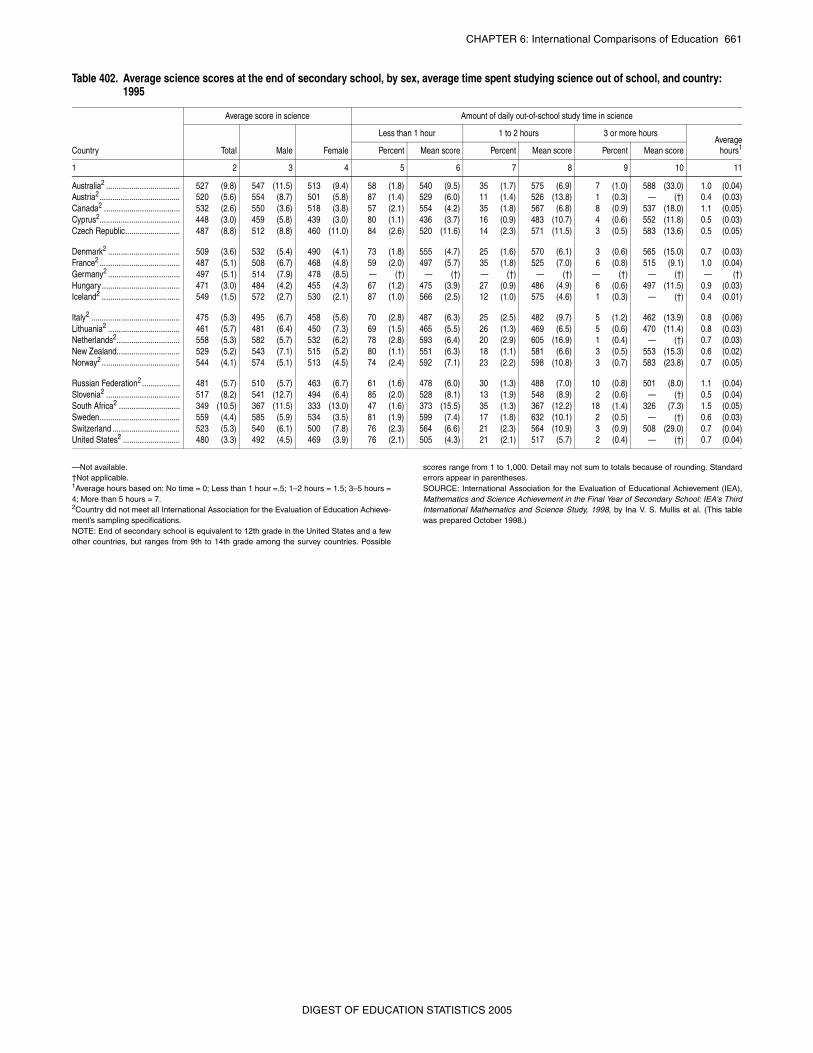
CHAPTER 6: International Comparisons of Education 661
—Not available.†Not applicable.1Average hours based on: No time = 0; Less than 1 hour =.5; 1–2 hours = 1.5; 3–5 hours =4; More than 5 hours = 7.2Country did not meet all International Association for the Evaluation of Education Achieve-ment’s sampling specifications.NOTE: End of secondary school is equivalent to 12th grade in the United States and a fewother countries, but ranges from 9th to 14th grade among the survey countries. Possible
scores range from 1 to 1,000. Detail may not sum to totals because of rounding. Standarderrors appear in parentheses.SOURCE: International Association for the Evaluation of Educational Achievement (IEA),Mathematics and Science Achievement in the Final Year of Secondary School: IEA's ThirdInternational Mathematics and Science Study, 1998, by Ina V. S. Mullis et al. (This tablewas prepared October 1998.)
Table 402. Average science scores at the end of secondary school, by sex, average time spent studying science out of school, and country: 1995
Country
Average score in science Amount of daily out-of-school study time in science
Total Male Female
Less than 1 hour 1 to 2 hours 3 or more hoursAverage
hours1Percent Mean score Percent Mean score Percent Mean score
1 2 3 4 5 6 7 8 9 10 11
Australia2 ................................... 527 (9.8) 547 (11.5) 513 (9.4) 58 (1.8) 540 (9.5) 35 (1.7) 575 (6.9) 7 (1.0) 588 (33.0) 1.0 (0.04)Austria2...................................... 520 (5.6) 554 (8.7) 501 (5.8) 87 (1.4) 529 (6.0) 11 (1.4) 526 (13.8) 1 (0.3) — (†) 0.4 (0.03)Canada2 .................................... 532 (2.6) 550 (3.6) 518 (3.8) 57 (2.1) 554 (4.2) 35 (1.8) 567 (6.8) 8 (0.9) 537 (18.0) 1.1 (0.05)Cyprus2...................................... 448 (3.0) 459 (5.8) 439 (3.0) 80 (1.1) 436 (3.7) 16 (0.9) 483 (10.7) 4 (0.6) 552 (11.8) 0.5 (0.03)Czech Republic.......................... 487 (8.8) 512 (8.8) 460 (11.0) 84 (2.6) 520 (11.6) 14 (2.3) 571 (11.5) 3 (0.5) 583 (13.6) 0.5 (0.05)
Denmark2 .................................. 509 (3.6) 532 (5.4) 490 (4.1) 73 (1.8) 555 (4.7) 25 (1.6) 570 (6.1) 3 (0.6) 565 (15.0) 0.7 (0.03)France2 ...................................... 487 (5.1) 508 (6.7) 468 (4.8) 59 (2.0) 497 (5.7) 35 (1.8) 525 (7.0) 6 (0.8) 515 (9.1) 1.0 (0.04)Germany2 .................................. 497 (5.1) 514 (7.9) 478 (8.5) — (†) — (†) — (†) — (†) — (†) — (†) — (†)Hungary..................................... 471 (3.0) 484 (4.2) 455 (4.3) 67 (1.2) 475 (3.9) 27 (0.9) 486 (4.9) 6 (0.6) 497 (11.5) 0.9 (0.03)Iceland2 ..................................... 549 (1.5) 572 (2.7) 530 (2.1) 87 (1.0) 566 (2.5) 12 (1.0) 575 (4.6) 1 (0.3) — (†) 0.4 (0.01)
Italy2 .......................................... 475 (5.3) 495 (6.7) 458 (5.6) 70 (2.8) 487 (6.3) 25 (2.5) 482 (9.7) 5 (1.2) 462 (13.9) 0.8 (0.06)Lithuania2 .................................. 461 (5.7) 481 (6.4) 450 (7.3) 69 (1.5) 465 (5.5) 26 (1.3) 469 (6.5) 5 (0.6) 470 (11.4) 0.8 (0.03)Netherlands2.............................. 558 (5.3) 582 (5.7) 532 (6.2) 78 (2.8) 593 (6.4) 20 (2.9) 605 (16.9) 1 (0.4) — (†) 0.7 (0.03)New Zealand.............................. 529 (5.2) 543 (7.1) 515 (5.2) 80 (1.1) 551 (6.3) 18 (1.1) 581 (6.6) 3 (0.5) 553 (15.3) 0.6 (0.02)Norway2 ..................................... 544 (4.1) 574 (5.1) 513 (4.5) 74 (2.4) 592 (7.1) 23 (2.2) 598 (10.8) 3 (0.7) 583 (23.8) 0.7 (0.05)
Russian Federation2 .................. 481 (5.7) 510 (5.7) 463 (6.7) 61 (1.6) 478 (6.0) 30 (1.3) 488 (7.0) 10 (0.8) 501 (8.0) 1.1 (0.04)Slovenia2 ................................... 517 (8.2) 541 (12.7) 494 (6.4) 85 (2.0) 528 (8.1) 13 (1.9) 548 (8.9) 2 (0.6) — (†) 0.5 (0.04)South Africa2 ............................. 349 (10.5) 367 (11.5) 333 (13.0) 47 (1.6) 373 (15.5) 35 (1.3) 367 (12.2) 18 (1.4) 326 (7.3) 1.5 (0.05)Sweden...................................... 559 (4.4) 585 (5.9) 534 (3.5) 81 (1.9) 599 (7.4) 17 (1.8) 632 (10.1) 2 (0.5) — (†) 0.6 (0.03)Switzerland ................................ 523 (5.3) 540 (6.1) 500 (7.8) 76 (2.3) 564 (6.6) 21 (2.3) 564 (10.9) 3 (0.9) 508 (29.0) 0.7 (0.04)United States2 ........................... 480 (3.3) 492 (4.5) 469 (3.9) 76 (2.1) 505 (4.3) 21 (2.1) 517 (5.7) 2 (0.4) — (†) 0.7 (0.04)
DIGEST OF EDUCATION STATISTICS 2005

662 CHAPTER 6: International Comparisons of Education
—Not available.1Data for Flemish Belgium only.NOTE: The recipients per 100 persons ratio relates the number of people of all ages earn-ing bachelor’s degrees in a particular year to the number of people in the population at thetypical age of graduation. The typical age is based on full-time attendance and normal pro-
gression through the education system (without repeating a year, taking a year off, etc.);this age varies across countries because of differences in their education systems.SOURCE: Organization for Economic Cooperation and Development (OECD), EducationOnline Database. Retrieved November 1, 2005, from http://stats.oecd.org/WBOS/Default.aspx.(This table was prepared November 2005.)
Table 403. Number of bachelor’s degree recipients per 100 persons of the typical age of graduation, by sex and country: 2002 and 2003
Country
Male and female Male Female
2002 2003 2002 2003 2002 2003
1 2 3 4 5 6 7
Australia........................................................................... 50.7 54.8 43.0 46.7 58.8 63.4Austria ............................................................................. 18.0 19.0 17.9 18.7 18.1 19.4Belgium1 .......................................................................... 19.2 — 18.7 — 19.7 —Canada ............................................................................ — — — — — —Czech Republic................................................................ 15.4 17.3 14.3 15.9 16.6 18.8
Denmark .......................................................................... 34.4 38.6 23.4 25.1 45.7 52.3Finland............................................................................. 51.8 55.8 37.7 40.4 66.4 72.2France.............................................................................. 39.0 41.5 32.9 34.9 45.3 48.4Germany.......................................................................... 19.2 19.5 19.3 19.3 19.1 19.7Hungary........................................................................... 31.1 33.6 23.2 24.6 39.3 43.2
Iceland ............................................................................. 40.0 44.2 27.2 29.4 53.1 59.1Ireland.............................................................................. 30.9 36.8 25.6 29.7 36.2 44.0Italy .................................................................................. 22.4 27.8 19.2 24.0 25.6 31.6Japan............................................................................... 34.1 34.4 40.2 40.1 27.6 28.5Korea, Republic of ........................................................... 31.5 31.7 31.6 32.1 31.3 31.2
Mexico ............................................................................. 16.5 14.3 15.6 13.3 17.4 15.3Netherlands ..................................................................... 38.6 42.5 34.4 36.4 42.9 48.7New Zealand.................................................................... 41.6 39.0 31.8 29.1 51.3 49.1Norway............................................................................. 41.1 42.0 29.7 30.0 52.8 54.2Portugal ........................................................................... — — — — — —
Spain ............................................................................... 33.1 32.0 26.4 25.5 40.0 38.9Sweden............................................................................ 35.2 38.4 26.5 28.6 44.1 48.5Switzerland ...................................................................... 20.8 20.9 23.3 23.5 18.3 18.4Turkey .............................................................................. — — — — — —United Kingdom ............................................................... — — — — — —United States ................................................................... 36.1 33.4 29.7 27.6 42.9 39.4
DIGEST OF EDUCATION STATISTICS 2005

CHAPTER 6: International Comparisons of Education 663
_
—Not available.1Includes life sciences, physical sciences, mathematics/statistics, computer science, andengineering.2Includes life sciences and physical sciences.3Includes mathematics/statistics and computer science.4Data for Flemish Belgium only.5Data for 1985 are for the former West Germany.
NOTE: Data in this table refer to degrees classified by the Organization for EconomicCooperation and Development (OECD) as International Standard Classification of Educa-tion (ISCED), level 5A, first award. This level corresponds to the bachelor’s degree in theUnited States.SOURCE: Organization for Economic Cooperation and Development (OECD), EducationOnline Database. Retrieved October 31, 2005, from http://stats.oecd.org/WBOS/Default.aspx.(This table was prepared November 2005.)
Table 404. Percentage of bachelor’s degrees awarded in science, by field and country: Selected years, 1985 through 2003
Country
All science degrees1 Natural sciences2 Mathematics and computer science3 Engineering
1985 1990 1995 2000 2003 1985 1990 1995 2000 2003 1985 1990 1995 2000 2003 1985 1990 1995 2000 2003
1 2 3 4 5 6 7 8 9 10 11 12 13 14 15 16 17 18 19 20 21
Australia............................. — — 19.3 21.1 23.7 — — 9.9 7.6 5.5 — — 3.8 5.1 10.2 — — 5.6 8.5 8.0Austria ............................... 16.8 19.6 21.1 25.7 26.5 5.0 5.3 6.0 5.0 5.3 4.1 5.2 5.3 3.4 3.4 7.7 9.0 9.9 17.3 17.8Belgium4 ............................ — — — — 24.6 4.6 — — — 7.0 1.7 — — — 2.8 — — — — 14.9Canada .............................. 17.1 16.4 16.7 20.0 — 4.9 6.0 6.5 8.1 — 4.5 4.2 3.8 4.3 — 7.7 6.2 6.4 7.6 —Czech Republic.................. — — — 29.5 30.2 — — — 4.2 4.7 — — — 8.4 4.2 — — — 16.9 21.4
Denmark ............................ — — — 10.5 11.4 6.3 4.4 2.5 6.8 3.2 — — — 3.1 1.1 16.2 21.7 17.0 0.6 7.1Finland............................... 39.3 33.5 37.2 32.2 28.8 7.7 4.1 4.0 3.9 2.6 6.3 5.9 6.9 3.3 4.5 25.3 23.4 26.3 24.9 21.8France................................ — — — 30.1 27.1 — — — 12.2 9.0 — — — 5.5 4.7 — — — 12.5 13.4Germany5 .......................... 23.8 31.3 31.6 31.7 30.1 5.0 7.2 6.7 6.4 6.0 2.3 3.5 5.2 4.9 5.8 16.5 20.5 19.7 20.3 18.3Hungary............................. — — — 12.6 — — — — 1.1 — — — — 1.2 — — — — 10.4 —
Iceland ............................... — — — 16.5 17.3 — — — 6.0 4.7 — — — 4.0 6.6 — — — 6.5 6.1Ireland................................ 28.8 34.1 32.3 29.3 27.0 12.8 14.1 16.9 11.5 8.4 4.0 6.3 4.7 7.2 9.6 12.0 13.7 10.7 10.6 8.9Italy .................................... 19.5 19.7 19.5 27.5 25.6 8.1 7.6 6.8 5.9 5.1 3.1 3.9 3.8 3.2 2.9 8.3 8.3 8.9 18.4 17.6Japan................................. 22.7 23.5 22.8 18.9 18.2 2.4 2.4 3.4 — 0.0 — — — — 0.0 20.3 21.0 19.3 18.9 18.2Korea, Republic of ............. — — — 36.9 37.8 — — — 6.3 6.6 — — — 4.3 3.9 — — — 26.3 27.3
Mexico ............................... — — — 23.0 28.1 — — — 2.2 2.5 — — — 6.7 8.9 — — — 14.1 16.8Netherlands ....................... 21.8 21.1 — 16.2 — 8.5 7.1 — 3.2 — 1.2 1.6 1.6 1.9 — 12.1 12.4 — 11.1 —New Zealand...................... 20.5 19.5 — 17.8 20.4 11.7 8.2 — 11.2 5.8 5.5 5.5 — 1.9 8.7 3.3 5.8 3.2 4.7 5.8Norway............................... — 12.9 16.8 11.6 16.5 2.5 2.1 3.1 0.7 0.4 1.8 0.6 0.5 3.4 6.5 — 10.2 13.2 7.5 9.7Poland................................ — — — 16.7 17.0 — — — 2.7 2.6 — — — 2.0 3.0 — — — 12.0 11.4
Portugal ............................. — — 15.0 17.5 18.2 6.5 6.7 2.2 1.7 2.9 — — 2.8 3.6 2.4 — 10.5 9.9 12.2 12.9Spain ................................. 13.9 15.0 18.2 22.7 24.7 5.5 5.7 4.3 5.3 4.7 1.3 2.6 4.5 4.3 4.6 7.0 6.7 9.4 13.1 15.4Sweden.............................. 15.4 24.0 26.4 27.7 — 2.6 4.1 3.9 3.7 — 1.6 4.7 5.5 3.7 — 11.3 15.2 17.0 20.3 —Switzerland ........................ 20.2 23.0 22.3 25.1 23.9 10.3 11.2 10.4 6.0 5.6 2.1 3.7 3.7 1.8 3.6 7.9 8.1 8.3 17.3 14.7Turkey ................................ 23.0 20.6 20.9 24.1 21.7 3.6 4.6 5.1 7.4 6.4 1.6 2.1 2.7 3.6 3.8 17.8 13.8 13.1 13.1 11.5
United Kingdom ................. — — — 28.5 31.2 — — — 12.5 13.0 — — — 5.8 8.5 — — — 10.2 9.7United States ..................... 21.7 16.9 — 17.1 17.6 6.3 5.1 — 6.6 6.0 5.5 4.0 3.3 3.9 5.2 9.8 7.8 6.7 6.6 6.4
DIGEST OF EDUCATION STATISTICS 2005

664C
HA
PT
ER
6: International Com
parisons of Education
DIG
ES
T O
F E
DU
CAT
ION
STAT
IST
ICS
2005
anization for Economic Cooperation and Development (OECD) asl 5A, second award and ISCED 6. ISCED 5A, second award, corre-States, and ISCED 6 corresponds to doctor’s degrees.elopment (OECD), Education Online Database. Retrieved Octo-; and previously unpublished tabulations. (This table was pre-
Engineering
2003 1985 1990 1996 1999 2000 2003
19 20 21 22 23 24 25
7.2 — — 4.7 7.7 6.3 4.75.3 21.7 20.8 16.6 19.8 17.7 15.14.9 — — — 8.3 — 4.4— 9.4 8.8 11.2 11.5 10.9 —
2.2 — — — 9.3 7.7 6.7
4.1 9.2 11.6 7.8 — 15.4 15.73.5 17.2 10.5 12.7 18.7 14.9 14.38.5 — — — 13.0 7.3 8.94.2 7.2 7.4 9.5 9.8 9.5 9.61.1 — — — 7.6 7.5 4.9
1.0 — — — 10.7 16.5 9.210.0 9.9 9.3 9.2 4.8 6.0 6.0
3.9 — — — 5.6 5.7 6.10.0 40.5 45.1 44.4 42.4 41.9 38.53.1 — — — 35.4 34.3 32.3
2.5 — — — 6.4 8.4 10.80.7 7.5 9.7 10.6 8.8 1.2 19.76.0 15.1 4.0 3.0 9.4 7.5 4.15.6 18.7 23.3 27.7 — 2.5 4.70.6 — — — 1.7 1.9 2.7
— — — — — 18.2 —5.7 5.1 5.7 7.1 11.1 6.8 7.33.8 20.0 19.9 17.1 23.0 22.2 17.0
12.6 7.6 6.5 10.1 13.1 11.6 10.23.2 26.3 13.2 — 18.7 15.2 12.7
6.2 — — — 11.0 9.2 8.44.0 6.3 6.9 6.7 6.8 6.2 6.4
—Not available.1Includes life sciences, physical sciences, mathematics/statistics, computer science, and engineering.2Includes life sciences and physical sciences.3Includes mathematics/statistics and computer science.4Data for Flemish Belgium only.5Data for 1985 are for the former West Germany.
NOTE: Data in this table refer to degrees classified by the OrgInternational Standard Classification of Education (ISCED), levesponds to master’s and first-professional degrees in the United SOURCE: Organization for Economic Cooperation and Devber 31, 2005, from http://stats.oecd.org/WBOS/Default.aspxpared November 2005.)
Table 405. Percentage of graduate degrees awarded in science, by field and country: Selected years, 1985 through 2003
Country
All science degrees1 Natural sciences2 Mathematics and computer science3
1985 1990 1996 1999 2000 2003 1985 1990 1996 1999 2000 2003 1985 1990 1996 1999 2000
1 2 3 4 5 6 7 8 9 10 11 12 13 14 15 16 17 18
Australia................................... — — 14.0 17.9 15.2 15.5 — — 5.4 6.3 4.0 3.6 — — 3.8 3.8 4.9Austria ..................................... 43.3 37.7 38.8 38.4 39.2 35.4 14.2 12.3 17.5 15.0 16.7 14.9 7.3 4.6 4.7 3.6 4.7Belgium4 .................................. — — — 17.6 — 18.8 — — — 7.0 — 9.5 — — — 2.4 —Canada .................................... 19.7 20.0 22.3 23.0 22.4 — 7.5 7.8 7.7 7.9 7.4 — 2.8 3.4 3.5 3.6 4.1Czech Republic........................ — — — 21.3 21.0 12.4 — — — 5.6 5.3 3.5 — — — 6.3 7.9
Denmark .................................. 16.0 22.2 12.3 — 30.2 27.8 4.1 5.8 3.1 — 9.8 8.1 2.7 4.8 1.5 — 2.5Finland..................................... 47.6 30.6 28.3 31.1 28.7 28.1 24.0 14.7 11.6 8.5 11.3 10.3 6.3 5.4 4.0 3.9 2.4France...................................... — — — 21.0 26.4 34.4 — — — 6.4 13.5 17.1 — — — 1.6 5.6Germany5 ................................ 27.7 33.2 38.6 38.9 38.1 36.0 18.7 23.5 25.5 25.2 24.9 22.2 1.8 2.3 3.5 4.0 3.7Hungary................................... — — — 13.5 9.9 7.7 — — — 4.8 1.7 1.7 — — — 1.2 0.7
Iceland ..................................... — — — 30.7 35.9 20.5 — — — 20.0 19.4 10.3 — — — — —Ireland...................................... 31.4 34.5 23.1 24.8 28.1 21.0 18.9 19.5 10.9 4.0 6.9 5.1 2.6 5.8 3.0 16.0 15.2Italy .......................................... — — — 13.1 11.7 12.8 — — — 1.0 0.3 2.8 — — — 6.5 5.8Japan....................................... 50.1 54.6 — 42.4 51.7 38.5 9.5 9.5 10.2 — — 0.0 — — — — 0.0Korea, Republic of ................... — — — 48.3 48.4 45.6 — — — 8.8 8.5 10.2 — — — 4.1 5.7
Mexico ..................................... — — — 22.7 31.4 20.0 — — — 14.3 18.9 6.8 — — — 2.0 4.1Netherlands ............................. — 28.9 18.6 17.6 — 24.2 20.6 17.7 4.4 — — 3.9 — 1.5 3.7 8.7 —New Zealand............................ 45.1 22.6 16.7 24.4 20.5 16.7 24.6 13.8 12.7 13.4 11.6 6.7 5.4 4.7 1.1 1.5 1.4Norway..................................... 40.1 33.4 38.3 21.0 22.0 22.0 17.9 8.0 8.7 15.0 14.9 11.8 3.5 2.1 1.9 4.3 4.6Poland...................................... — — — 3.1 3.3 4.1 — — — 0.6 0.7 0.8 — — — 0.9 0.7
Portugal ................................... — — — — 39.3 — — — — — 11.7 — — — — — 9.4Spain ....................................... 35.6 26.9 36.0 40.1 36.1 35.8 28.6 19.7 24.8 24.8 23.9 22.7 1.8 1.4 4.1 4.2 5.4Sweden.................................... 48.0 48.5 32.3 41.5 40.5 32.2 21.2 19.4 9.2 14.4 14.3 11.4 6.8 9.2 5.9 4.1 4.0Switzerland .............................. 30.7 30.2 40.1 41.5 42.7 32.6 20.3 22.0 25.8 11.4 11.7 9.8 2.8 1.7 4.1 17.0 19.5Turkey ...................................... 35.8 24.0 — 29.8 25.7 22.9 6.6 7.6 — 8.0 7.6 6.9 2.8 3.3 — 3.0 3.0
United Kingdom ....................... — — — 21.8 21.7 22.1 — — — 6.0 7.4 7.5 — — — 4.7 5.0United States ........................... 13.5 14.5 13.8 13.7 13.0 13.7 4.5 4.2 4.0 3.8 3.4 3.4 2.8 3.4 3.2 3.1 3.4
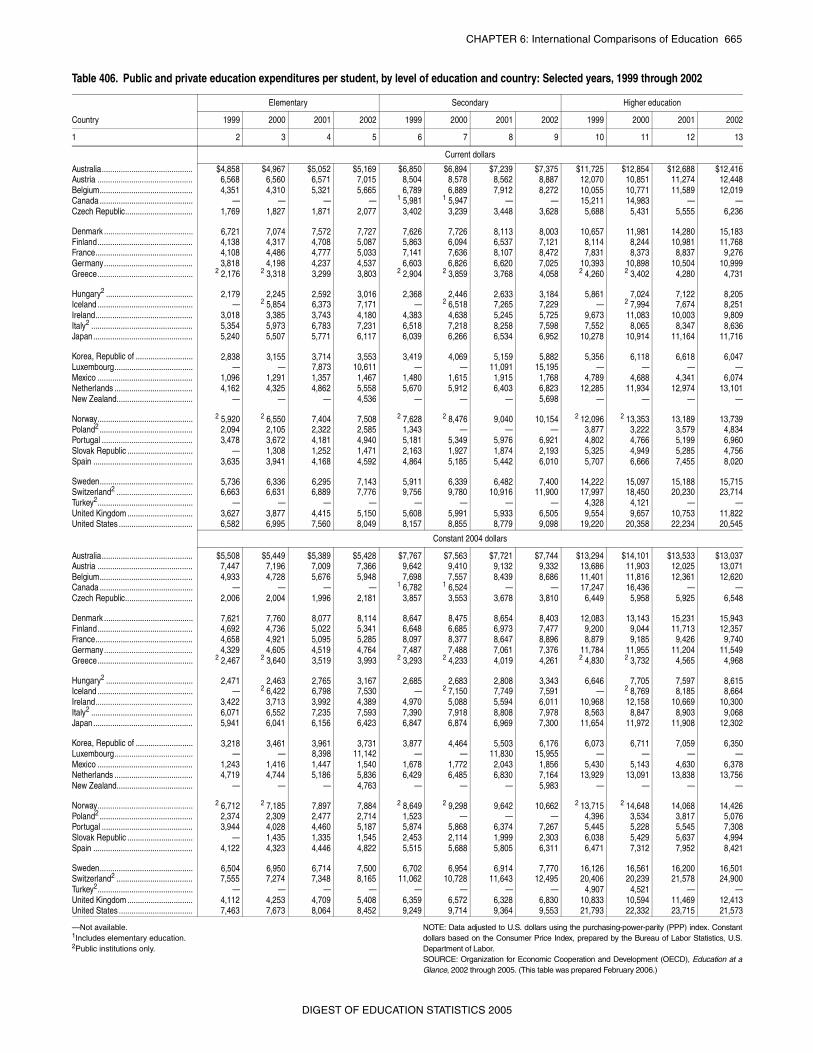
CHAPTER 6: International Comparisons of Education 665
_
—Not available.1Includes elementary education.2Public institutions only.
NOTE: Data adjusted to U.S. dollars using the purchasing-power-parity (PPP) index. Constantdollars based on the Consumer Price Index, prepared by the Bureau of Labor Statistics, U.S.Department of Labor. SOURCE: Organization for Economic Cooperation and Development (OECD), Education at aGlance, 2002 through 2005. (This table was prepared February 2006.)
Table 406. Public and private education expenditures per student, by level of education and country: Selected years, 1999 through 2002
Country
Elementary Secondary Higher education
1999 2000 2001 2002 1999 2000 2001 2002 1999 2000 2001 2002
1 2 3 4 5 6 7 8 9 10 11 12 13
Current dollars
Australia........................................... $4,858 $4,967 $5,052 $5,169 $6,850 $6,894 $7,239 $7,375 $11,725 $12,854 $12,688 $12,416Austria ............................................. 6,568 6,560 6,571 7,015 8,504 8,578 8,562 8,887 12,070 10,851 11,274 12,448Belgium............................................ 4,351 4,310 5,321 5,665 6,789 6,889 7,912 8,272 10,055 10,771 11,589 12,019Canada ............................................ — — — — 1 5,981 1 5,947 — — 15,211 14,983 — —Czech Republic................................ 1,769 1,827 1,871 2,077 3,402 3,239 3,448 3,628 5,688 5,431 5,555 6,236
Denmark .......................................... 6,721 7,074 7,572 7,727 7,626 7,726 8,113 8,003 10,657 11,981 14,280 15,183Finland............................................. 4,138 4,317 4,708 5,087 5,863 6,094 6,537 7,121 8,114 8,244 10,981 11,768France.............................................. 4,108 4,486 4,777 5,033 7,141 7,636 8,107 8,472 7,831 8,373 8,837 9,276Germany.......................................... 3,818 4,198 4,237 4,537 6,603 6,826 6,620 7,025 10,393 10,898 10,504 10,999Greece............................................. 2 2,176 2 3,318 3,299 3,803 2 2,904 2 3,859 3,768 4,058 2 4,260 2 3,402 4,280 4,731
Hungary2 ......................................... 2,179 2,245 2,592 3,016 2,368 2,446 2,633 3,184 5,861 7,024 7,122 8,205Iceland ............................................. — 2 5,854 6,373 7,171 — 2 6,518 7,265 7,229 — 2 7,994 7,674 8,251Ireland.............................................. 3,018 3,385 3,743 4,180 4,383 4,638 5,245 5,725 9,673 11,083 10,003 9,809Italy2 ................................................ 5,354 5,973 6,783 7,231 6,518 7,218 8,258 7,598 7,552 8,065 8,347 8,636Japan............................................... 5,240 5,507 5,771 6,117 6,039 6,266 6,534 6,952 10,278 10,914 11,164 11,716
Korea, Republic of ........................... 2,838 3,155 3,714 3,553 3,419 4,069 5,159 5,882 5,356 6,118 6,618 6,047Luxembourg..................................... — — 7,873 10,611 — — 11,091 15,195 — — — —Mexico ............................................. 1,096 1,291 1,357 1,467 1,480 1,615 1,915 1,768 4,789 4,688 4,341 6,074Netherlands ..................................... 4,162 4,325 4,862 5,558 5,670 5,912 6,403 6,823 12,285 11,934 12,974 13,101New Zealand.................................... — — — 4,536 — — — 5,698 — — — —
Norway............................................. 2 5,920 2 6,550 7,404 7,508 2 7,628 2 8,476 9,040 10,154 2 12,096 2 13,353 13,189 13,739Poland2 ............................................ 2,094 2,105 2,322 2,585 1,343 — — — 3,877 3,222 3,579 4,834Portugal ........................................... 3,478 3,672 4,181 4,940 5,181 5,349 5,976 6,921 4,802 4,766 5,199 6,960Slovak Republic ............................... — 1,308 1,252 1,471 2,163 1,927 1,874 2,193 5,325 4,949 5,285 4,756Spain ............................................... 3,635 3,941 4,168 4,592 4,864 5,185 5,442 6,010 5,707 6,666 7,455 8,020
Sweden............................................ 5,736 6,336 6,295 7,143 5,911 6,339 6,482 7,400 14,222 15,097 15,188 15,715Switzerland2 .................................... 6,663 6,631 6,889 7,776 9,756 9,780 10,916 11,900 17,997 18,450 20,230 23,714Turkey2............................................. — — — — — — — — 4,328 4,121 — —United Kingdom ............................... 3,627 3,877 4,415 5,150 5,608 5,991 5,933 6,505 9,554 9,657 10,753 11,822United States ................................... 6,582 6,995 7,560 8,049 8,157 8,855 8,779 9,098 19,220 20,358 22,234 20,545
Constant 2004 dollars
Australia........................................... $5,508 $5,449 $5,389 $5,428 $7,767 $7,563 $7,721 $7,744 $13,294 $14,101 $13,533 $13,037Austria ............................................. 7,447 7,196 7,009 7,366 9,642 9,410 9,132 9,332 13,686 11,903 12,025 13,071Belgium............................................ 4,933 4,728 5,676 5,948 7,698 7,557 8,439 8,686 11,401 11,816 12,361 12,620Canada ............................................ — — — — 1 6,782 1 6,524 — — 17,247 16,436 — —Czech Republic................................ 2,006 2,004 1,996 2,181 3,857 3,553 3,678 3,810 6,449 5,958 5,925 6,548
Denmark .......................................... 7,621 7,760 8,077 8,114 8,647 8,475 8,654 8,403 12,083 13,143 15,231 15,943Finland............................................. 4,692 4,736 5,022 5,341 6,648 6,685 6,973 7,477 9,200 9,044 11,713 12,357France.............................................. 4,658 4,921 5,095 5,285 8,097 8,377 8,647 8,896 8,879 9,185 9,426 9,740Germany.......................................... 4,329 4,605 4,519 4,764 7,487 7,488 7,061 7,376 11,784 11,955 11,204 11,549Greece............................................. 2 2,467 2 3,640 3,519 3,993 2 3,293 2 4,233 4,019 4,261 2 4,830 2 3,732 4,565 4,968
Hungary2 ......................................... 2,471 2,463 2,765 3,167 2,685 2,683 2,808 3,343 6,646 7,705 7,597 8,615Iceland ............................................. — 2 6,422 6,798 7,530 — 2 7,150 7,749 7,591 — 2 8,769 8,185 8,664Ireland.............................................. 3,422 3,713 3,992 4,389 4,970 5,088 5,594 6,011 10,968 12,158 10,669 10,300Italy2 ................................................ 6,071 6,552 7,235 7,593 7,390 7,918 8,808 7,978 8,563 8,847 8,903 9,068Japan............................................... 5,941 6,041 6,156 6,423 6,847 6,874 6,969 7,300 11,654 11,972 11,908 12,302
Korea, Republic of ........................... 3,218 3,461 3,961 3,731 3,877 4,464 5,503 6,176 6,073 6,711 7,059 6,350Luxembourg..................................... — — 8,398 11,142 — — 11,830 15,955 — — — —Mexico ............................................. 1,243 1,416 1,447 1,540 1,678 1,772 2,043 1,856 5,430 5,143 4,630 6,378Netherlands ..................................... 4,719 4,744 5,186 5,836 6,429 6,485 6,830 7,164 13,929 13,091 13,838 13,756New Zealand.................................... — — — 4,763 — — — 5,983 — — — —
Norway............................................. 2 6,712 2 7,185 7,897 7,884 2 8,649 2 9,298 9,642 10,662 2 13,715 2 14,648 14,068 14,426Poland2 ............................................ 2,374 2,309 2,477 2,714 1,523 — — — 4,396 3,534 3,817 5,076Portugal ........................................... 3,944 4,028 4,460 5,187 5,874 5,868 6,374 7,267 5,445 5,228 5,545 7,308Slovak Republic ............................... — 1,435 1,335 1,545 2,453 2,114 1,999 2,303 6,038 5,429 5,637 4,994Spain ............................................... 4,122 4,323 4,446 4,822 5,515 5,688 5,805 6,311 6,471 7,312 7,952 8,421
Sweden............................................ 6,504 6,950 6,714 7,500 6,702 6,954 6,914 7,770 16,126 16,561 16,200 16,501Switzerland2 .................................... 7,555 7,274 7,348 8,165 11,062 10,728 11,643 12,495 20,406 20,239 21,578 24,900Turkey2............................................. — — — — — — — — 4,907 4,521 — —United Kingdom ............................... 4,112 4,253 4,709 5,408 6,359 6,572 6,328 6,830 10,833 10,594 11,469 12,413United States ................................... 7,463 7,673 8,064 8,452 9,249 9,714 9,364 9,553 21,793 22,332 23,715 21,573
DIGEST OF EDUCATION STATISTICS 2005

666 CHAPTER 6: International Comparisons of Education
—Not available.1Includes preprimary and other expenditures not classified by level.2Includes public subsidies to households attributable for educational institutions andincludes direct expenditure on educational institutions from international sources.3Data are for Flemish Belgium only.4Direct expenditure on higher education institutions from international sources exceeds 1.5percent of all public expenditure.5Public subsidies to households not included in public expenditure.6Postsecondary non-higher education included in both secondary and higher education.7Data for 1985 are for the former West Germany.
NOTE: Direct public expenditure on educational services includes both amounts spentdirectly by governments to hire educational personnel and to procure other resources,and amounts provided by governments to public or private institutions, or households.Figures for 1985 also include transfers and payments to private entities, and thus arenot strictly comparable with later figures. Some data have been revised from previouslypublished figures.SOURCE: Organization for Economic Cooperation and Development (OECD), EducationOnline Database; Annual National Accounts, Vol. 1, 1997; and Education at a Glance, 2002through 2005. (This table was prepared October 2005.)
Table 407. Total public direct expenditures on education as a percentage of the gross domestic product, by level and country: Selected years, 1985 through 2002
Country
All institutions1 Primary and secondary institutions Higher education institutions
1985 1990 1995 2000 2001 20022 1985 1990 1995 2000 2001 20022 1985 1990 1995 2000 2001 20022
1 2 3 4 5 6 7 8 9 10 11 12 13 14 15 16 17 18 19
Average for year................................ 5.3 4.9 4.9 5.2 5.1 4.9 3.7 3.5 3.5 3.5 3.6 3.6 1.1 1.0 0.9 1.2 1.1 1.0Average for countries reporting
data for all years............................ 5.4 5.2 5.3 5.4 5.2 5.3 3.7 3.7 3.6 3.6 3.6 3.7 1.1 1.1 1.1 1.4 1.1 1.1
Australia.................................................. 5.4 4.3 4.5 5.1 4.5 4.4 3.5 3.2 3.2 3.9 3.6 3.6 1.7 1.0 1.2 1.2 0.8 0.8Austria .................................................... 5.6 5.2 5.3 5.8 5.6 5.4 3.7 3.6 3.8 3.8 3.8 3.7 1.0 1.0 0.9 1.4 1.2 1.1Belgium3 ................................................. 6.3 4.8 5.0 5.2 6.0 6.1 4.0 3.4 3.4 3.4 4.0 4 4.1 1.0 0.8 0.9 1.3 1.2 4 1.2Canada ................................................... 6.1 5.4 5.8 5.5 4.9 — 4.1 3.7 4.0 3.3 3.1 — 2.0 1.5 1.5 2.0 1.5 —Czech Republic....................................... — — 4.8 4.4 4.2 4.2 — — 3.4 3.0 2.8 2.8 — — 0.7 0.8 0.8 0.8
Denmark ................................................. 6.2 6.2 6.5 8.4 6.8 5 6.8 4.7 4.4 4.2 4.8 4.2 5,6 4.1 1.2 1.3 1.3 2.5 1.8 5,6 1.9Finland.................................................... 5.8 6.4 6.6 6.0 5.7 5.9 — 4.3 4.2 3.6 3.7 3.8 — 1.2 1.7 2.0 1.7 1.7France..................................................... — 5.1 5.8 5.8 5.6 5.7 — 3.7 4.1 4.1 4.0 4.0 — 0.8 1.0 1.0 1.0 1.0Germany7 ............................................... 4.6 — 4.5 4.5 4.3 4.4 2.8 — 2.9 3.0 2.9 3.0 1.0 — 1.0 1.1 1.0 1.0Greece.................................................... — — 3.7 3.8 3.8 5 3.9 — — 2.8 2.7 2.4 5 2.5 — — 0.8 0.9 1.1 5 1.2
Hungary.................................................. — 5.0 4.9 4.9 4.6 5.0 — 3.5 3.3 3.1 2.8 3.1 — 0.8 0.8 1.0 0.9 1.0Iceland .................................................... — 4.3 4.5 6.0 6.1 6.8 — 3.3 3.4 4.7 5.0 5,6 5.4 — 0.6 0.7 1.1 0.9 5,6 1.0Ireland..................................................... 5.6 4.7 4.7 4.4 4.1 5 4.1 4.0 3.3 3.3 3.0 2.9 4 3.0 0.9 0.9 0.9 1.3 1.1 4 1.1Italy ......................................................... 4.7 5.8 4.5 4.6 4.9 4.6 3.2 4.1 3.2 3.2 3.6 3.4 0.6 1.0 0.7 0.8 0.8 0.8Japan...................................................... — 3.6 3.6 3.6 3.5 3.5 — 2.9 2.8 2.7 2.7 6 2.7 — 0.4 0.4 0.5 0.5 6 0.4
Korea, Republic of .................................. — — 3.6 4.3 4.8 4.2 — — 3.0 3.3 3.5 3.3 — — 0.3 0.7 0.4 0.3Luxembourg............................................ — — 4.3 — 3.6 — — — 4.2 — 3.6 6 3.9 — — 0.1 — — 6 —Mexico .................................................... — 3.2 4.6 4.9 5.1 5.1 — 2.2 3.4 3.4 3.8 3.5 — 0.7 0.8 0.9 0.7 1.0Netherlands ............................................ 6.2 5.7 4.6 4.8 4.5 4.6 4.1 3.6 3.0 3.2 3.1 3.3 1.5 1.6 1.1 1.3 1.0 1.0New Zealand........................................... — 5.5 5.3 7.0 5.5 5.6 — 3.9 3.8 4.9 4.3 4.4 — 1.2 1.1 1.7 0.9 0.9
Norway.................................................... 5.1 6.2 6.8 6.7 6.1 6.7 4.0 4.1 4.1 3.9 4.6 4.2 0.7 1.1 1.5 1.7 1.3 1.4Poland..................................................... — — 5.2 5.2 5.6 5 5.5 — — 3.3 3.8 4.0 5 4.0 — — 0.8 0.8 1.1 5 1.1Portugal .................................................. — — 5.4 5.7 5.8 5 5.7 — — 4.1 4.2 4.2 5 4.2 — — 1.0 1.0 1.0 5 0.9Russian Federation................................. — — 3.4 3.0 3.0 4.0 — — 1.9 1.7 1.7 4,5 2.7 — — 0.7 0.5 0.5 4,5 0.7Spain ...................................................... 3.6 4.2 4.8 4.4 4.3 4.3 2.9 3.2 3.5 3.1 3.0 2.9 0.4 0.7 0.8 1.0 1.0 1.0
Sweden................................................... — 5.3 6.6 7.4 6.3 6.7 — 4.4 4.4 4.9 4.3 4 4.6 — 1.0 1.6 2.0 1.5 4 1.6Switzerland ............................................. 4.9 5.0 5.5 5.4 5.4 5.7 4.0 3.7 4.1 3.9 3.9 4.0 0.9 1.0 1.1 1.2 1.3 1.4Turkey ..................................................... — 3.2 2.2 3.5 3.5 5 3.4 — 2.3 1.4 2.4 2.5 5 2.3 — 0.9 0.8 1.1 1.0 5 1.0United Kingdom ...................................... 4.9 4.3 4.6 4.8 4.7 5.0 3.1 3.5 3.8 3.4 3.4 3.7 1.0 0.7 0.7 1.0 0.8 0.8United States .......................................... 4.7 5.3 5.0 5.0 5.1 5.3 3.2 3.8 3.5 3.5 3.8 3.8 1.3 1.4 1.1 1.1 0.9 1.2
DIGEST OF EDUCATION STATISTICS 2005

CHAPTER 6: International Comparisons of Education 667
—Not available.#Rounds to zero.1Data for 1980–81 and 1985–86 are for West Germany (Federal Republic of Germanybefore unification).2Excludes Mexico and Central America, which are included with Latin America.3Home country unknown or undeclared.
NOTE: Totals and subtotals include other countries not shown separately. Data are for“nonimmigrants” (i.e., students who have not migrated to this country). Detail may notsum to totals because of rounding.SOURCE: Institute of International Education, Open Doors: Report on InternationalEducational Exchange, various years. (This table was prepared March 2005.)
Table 408. Foreign students enrolled in institutions of higher education in the United States and other jurisdictions, by continent, region, and selected countries of origin: Selected years, 1980-81 through 2003-04
Continent, region, and country
1980–81 1985–86 1990–91 1995–96 2000–01 2001–02 2002–03 2003–04
Number Percent Number Percent Number Percent Number Percent Number Percent Number Percent Number Percent Number Percent
1 2 3 4 5 6 7 8 9 10 11 12 13 14 15 16 17
Total ........................................ 311,880 100.0 343,780 100.0 407,530 100.0 453,787 100.00 547,867 100.0 582,996 100.0 586,323 100.0 572,509 100.0
Africa .............................................. 38,180 12.2 34,190 9.9 23,800 5.8 20,844 4.59 34,217 6.2 37,724 6.5 40,193 6.9 38,150 6.7Eastern Africa ............................. 6,260 2.0 6,730 2.0 7,590 1.9 7,596 1.67 13,516 2.5 15,331 2.6 15,996 2.7 14,831 2.6Central Africa .............................. 1,130 0.4 1,540 0.4 1,650 0.4 1,346 0.30 1,859 0.3 1,972 0.3 2,371 0.4 2,331 0.4North Africa................................. 7,310 2.3 5,980 1.7 4,540 1.1 3,422 0.75 5,184 0.9 5,593 1.0 5,218 0.9 4,487 0.8Southern Africa........................... 1,480 0.5 2,360 0.7 2,840 0.7 2,657 0.59 3,304 0.6 3,443 0.6 3,017 0.5 2,679 0.5West Africa.................................. 22,000 7.1 17,580 5.1 7,180 1.8 5,818 1.28 10,346 1.9 11,385 2.0 13,590 2.3 13,821 2.4
Nigeria..................................... 17,350 5.6 13,710 4.0 3,710 0.9 2,093 0.46 3,820 0.7 4,499 0.8 5,816 1.0 6,140 1.1
Asia................................................. 94,640 30.3 156,830 45.6 229,830 56.4 259,893 57.27 302,058 55.1 324,812 55.7 332,298 56.7 324,006 56.6East Asia..................................... 51,650 16.6 80,720 23.5 146,020 35.8 166,717 36.74 189,371 34.6 196,813 33.8 199,666 34.1 189,874 33.2
China....................................... 2,770 0.9 13,980 4.1 39,600 9.7 39,613 8.73 59,939 10.9 63,211 10.8 64,757 11.0 61,765 10.8Hong Kong .............................. 9,660 3.1 10,710 3.1 12,630 3.1 12,018 2.65 7,627 1.4 7,757 1.3 8,076 1.4 7,353 1.3Japan ...................................... 13,500 4.3 13,360 3.9 36,610 9.0 45,531 10.03 46,497 8.5 46,810 8.0 45,960 7.8 40,835 7.1Korea, Republic of................... 6,150 2.0 18,660 5.4 23,360 5.7 36,231 7.98 45,685 8.3 49,046 8.4 51,519 8.8 52,484 9.2Taiwan ..................................... 19,460 6.2 23,770 6.9 33,530 8.2 32,702 7.21 28,566 5.2 28,930 5.0 28,017 4.8 26,178 4.6
South and Central Asia ............... 14,540 4.7 25,800 7.5 42,370 10.4 45,401 10.00 71,765 13.1 86,131 14.8 93,767 16.0 98,138 17.1India ........................................ 9,250 3.0 16,070 4.7 28,860 7.1 31,743 7.00 54,664 10.0 66,836 11.5 74,603 12.7 79,736 13.9Pakistan .................................. 2,990 1.0 5,440 1.6 7,730 1.9 6,427 1.42 6,948 1.3 8,644 1.5 8,123 1.4 7,325 1.3
South East Asia .......................... 28,450 9.1 50,310 14.6 41,440 10.2 47,774 10.53 40,916 7.5 41,868 7.2 38,865 6.6 35,994 6.3Indonesia ................................ 3,250 1.0 8,210 2.4 9,520 2.3 12,820 2.83 11,625 2.1 11,614 2.0 10,432 1.8 8,880 1.6Malaysia .................................. 6,010 1.9 23,020 6.7 13,610 3.3 14,015 3.09 7,795 1.4 7,395 1.3 6,595 1.1 6,483 1.1Philippines............................... — — 3,920 1.1 4,270 1.0 3,127 0.69 3,139 0.6 3,295 0.6 3,576 0.6 3,467 0.6Singapore................................ — — 3,930 1.1 4,500 1.1 4,098 0.90 4,166 0.8 4,141 0.7 4,189 0.7 3,955 0.7Thailand .................................. 6,550 2.1 6,940 2.0 7,090 1.7 12,165 2.68 11,187 2.0 11,606 2.0 9,982 1.7 8,937 1.6
Europe ............................................ 25,330 8.1 34,310 10.0 49,640 12.2 67,358 14.84 80,584 14.7 81,579 14.0 78,001 13.3 74,134 12.9Eastern Europe........................... 1,670 0.5 1,770 0.5 4,780 1.2 18,032 3.97 27,674 5.1 29,591 5.1 29,167 5.0 27,710 4.8Western Europe.......................... 23,660 7.6 32,540 9.5 44,860 11.0 49,326 10.87 52,910 9.7 51,988 8.9 48,834 8.3 46,424 8.1
France ..................................... — — 3,680 1.1 5,630 1.4 5,710 1.26 7,273 1.3 7,401 1.3 7,223 1.2 6,818 1.2Germany1................................ 3,310 1.1 4,730 1.4 7,000 1.7 9,017 1.99 10,128 1.8 9,613 1.6 9,302 1.6 8,745 1.5Greece .................................... 3,750 1.2 4,440 1.3 4,360 1.1 3,365 0.74 2,768 0.5 2,599 0.4 2,341 0.4 2,126 0.4Spain ....................................... — — 1,740 0.5 4,300 1.1 4,809 1.06 4,156 0.8 4,048 0.7 3,633 0.6 3,631 0.6United Kingdom ...................... 4,440 1.4 5,940 1.7 7,300 1.8 7,799 1.72 8,139 1.5 8,414 1.4 8,326 1.4 8,439 1.5
Latin America.................................. 49,810 16.0 45,480 13.2 47,580 11.7 47,253 10.41 63,634 11.6 68,358 11.7 68,950 11.8 69,658 12.2Caribbean ................................... 10,650 3.4 11,100 3.2 12,610 3.1 10,737 2.37 14,423 2.6 13,879 2.4 14,895 2.5 15,606 2.7Central America .......................... 12,970 4.2 12,740 3.7 15,950 3.9 14,220 3.13 16,764 3.1 18,826 3.2 18,856 3.2 19,264 3.4
Mexico..................................... 6,730 2.2 5,460 1.6 6,740 1.7 8,687 1.91 10,670 1.9 12,518 2.1 12,801 2.2 13,329 2.3South America ............................ 26,190 8.4 21,640 6.3 19,020 4.7 22,296 4.91 32,447 5.9 35,653 6.1 35,199 6.0 34,788 6.1
Brazil ....................................... — — 2,840 0.8 3,900 1.0 5,497 1.21 8,846 1.6 8,972 1.5 8,388 1.4 7,799 1.4Colombia ................................. — — 4,010 1.2 3,180 0.8 3,462 0.76 6,765 1.2 8,068 1.4 7,771 1.3 7,533 1.3Venezuela ............................... 11,750 3.8 7,040 2.0 2,890 0.7 4,456 0.98 5,217 1.0 5,627 1.0 5,333 0.9 5,575 1.0
Middle East..................................... 84,710 27.2 52,720 15.3 33,420 8.2 30,563 6.74 36,858 6.7 38,545 6.6 34,803 5.9 31,852 5.6Iran.............................................. 47,550 15.2 14,210 4.1 6,260 1.5 2,628 0.58 1,844 0.3 2,216 0.4 2,258 0.4 2,321 0.4Jordan......................................... 6,140 2.0 6,590 1.9 4,320 1.1 2,222 0.49 2,187 0.4 2,417 0.4 2,173 0.4 1,853 0.3Lebanon...................................... 6,770 2.2 7,090 2.1 3,900 1.0 1,554 0.34 2,005 0.4 2,435 0.4 2,364 0.4 2,179 0.4Saudi Arabia ............................... 10,440 3.3 6,900 2.0 3,590 0.9 4,191 0.92 5,273 1.0 5,579 1.0 4,175 0.7 3,521 0.6Turkey ......................................... — — 2,460 0.7 4,080 1.0 7,678 1.69 10,983 2.0 12,091 2.1 11,601 2.0 11,398 2.0
North America2............................... 14,790 4.7 16,030 4.7 18,950 4.6 23,644 5.21 25,888 4.7 27,039 4.6 27,227 4.6 27,650 4.8Canada ....................................... 14,320 4.6 15,410 4.5 18,350 4.5 23,005 5.07 25,279 4.6 26,514 4.5 26,513 4.5 27,017 4.7
Oceania .......................................... 4,180 1.3 4,030 1.2 4,230 1.0 4,202 0.93 4,624 0.8 4,852 0.8 4,811 0.8 4,534 0.8
Stateless3 ....................................... 240 0.1 190 0.1 80 # 30 # 10 # 87 # 33 # 19 #
DIGEST OF EDUCATION STATISTICS 2005
