international mortality comparisons
DESCRIPTION
International Mortality Comparisons. Richard MacMinn Edmondson-Miller Chair Katie School College of Business Illinois State University. Opening comments. Data The Human Mortality Database Perspectives on international mortality data Period data Select birth cohorts - PowerPoint PPT PresentationTRANSCRIPT
June 23, 2003 AVW06230311
International Mortality Comparisons
Richard MacMinnEdmondson-Miller Chair
Katie SchoolCollege of Business
Illinois State University
June 23, 2003 2
Opening comments
Data The Human Mortality Database
Perspectives on international mortality data
Period data Select birth cohorts
Rationales for mortality improvements
June 23, 2003 3
Objectives Look for common trends in mortality
improvement data Identify select birth cohorts Seek causal links for mortality
improvements Compare immediate annuity costs using
historical mortality data

June 23, 2003 4
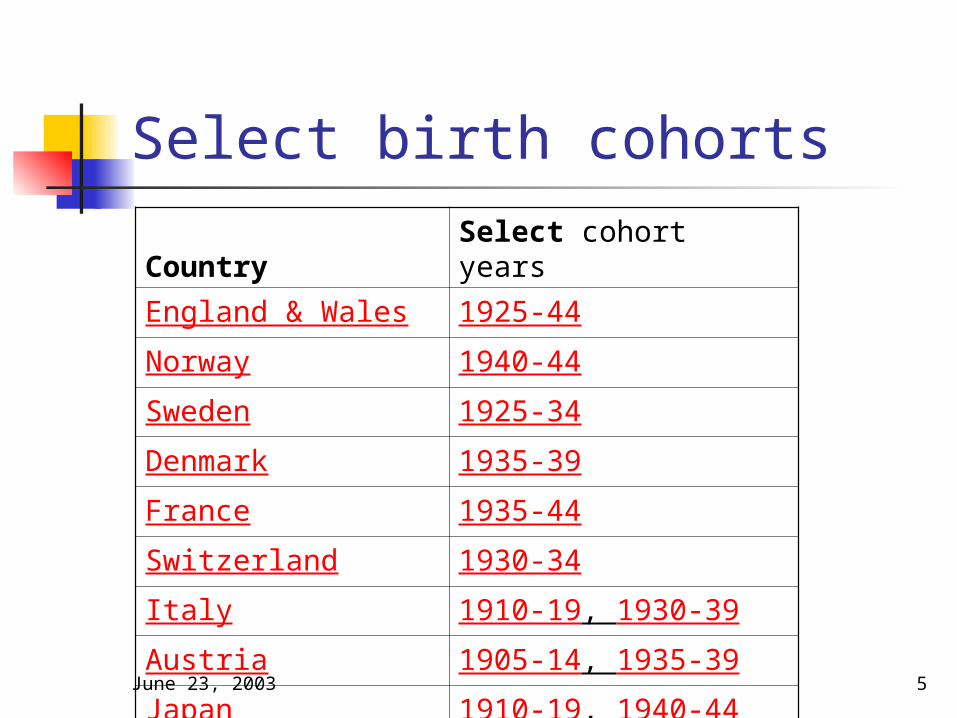
Select birth cohorts A select cohort is a birth cohort
characterized by greater rates of mortality improvement that previous and subsequent generations.
A number of select birth cohorts have been identified in the literature England & Wales (1925-45), Sweden (1900-
10), and Japan (1910-20) More select birth cohorts are noted
here.
June 23, 2003 5
Select birth cohortsCountry Select cohort years
England & Wales 1925-44
Norway 1940-44
Sweden 1925-34
Denmark 1935-39
France 1935-44
Switzerland 1930-34
Italy 1910-19, 1930-39
Austria 1905-14, 1935-39
Japan 1910-19, 1940-44
United States 1910-19, 1930-39
June 23, 2003 6
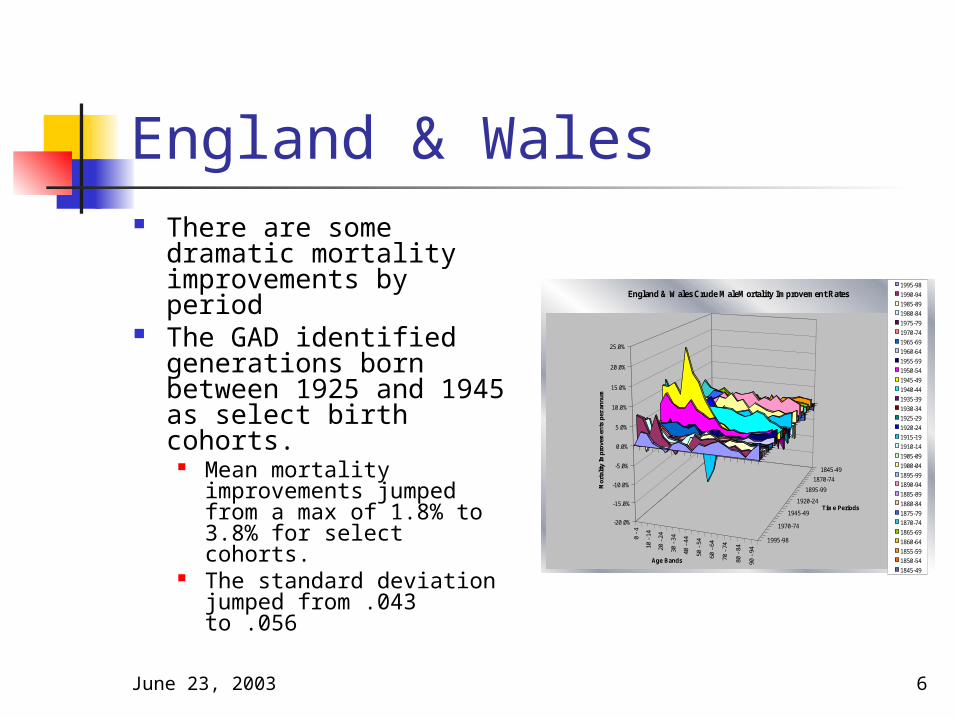
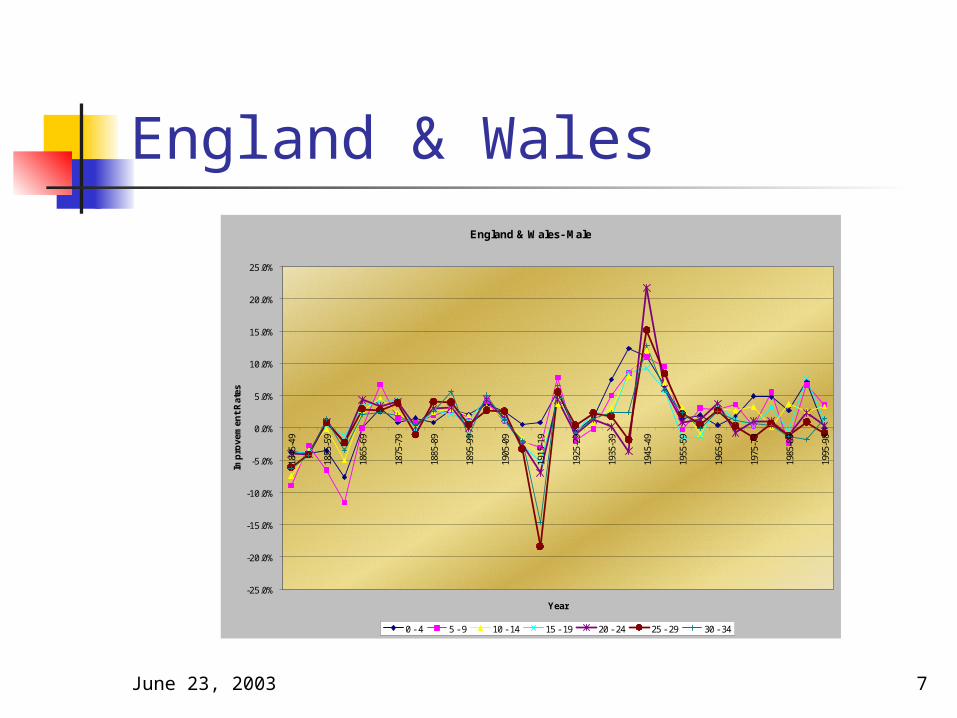
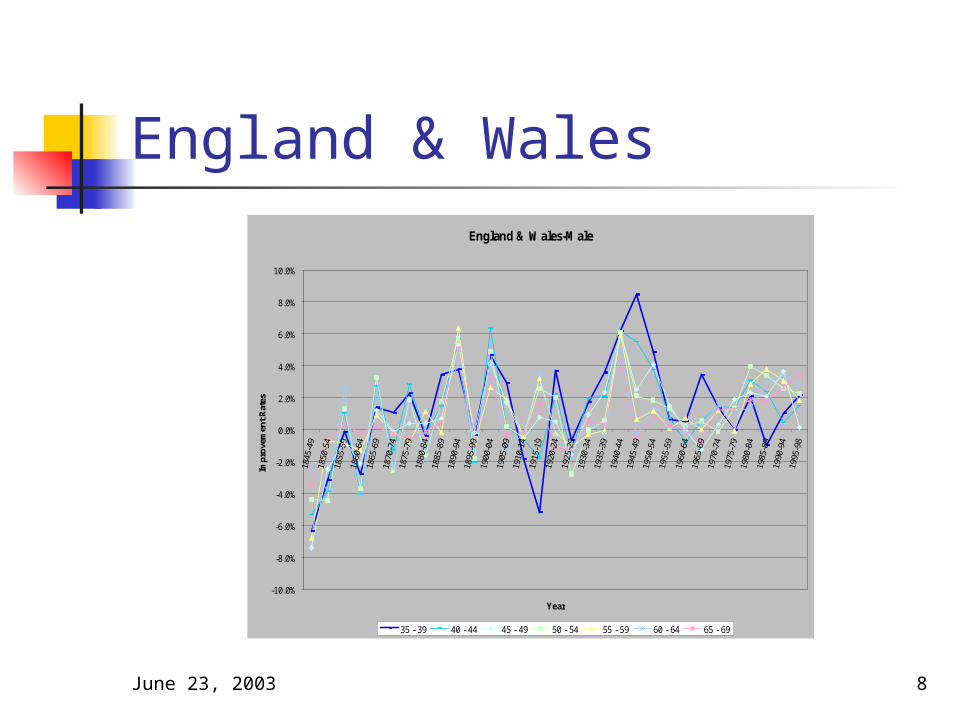
England & Wales There are some
dramatic mortality improvements by period
The GAD identified generations born between 1925 and 1945 as select birth cohorts.
Mean mortality improvements jumped from a max of 1.8% to 3.8% for select cohorts.
The standard deviation jumped from .043 to .056
0 -
4
10 -
14
20 -
24
30 -
34
40 -
44
50 -
54
60 -
64
70 -
74
80 -
84
90 -
94
1995-98
1970-74
1945-49
1920-24
1895-99
1870-74
1845-49
-20.0%
-15.0%
-10.0%
-5.0%
0.0%
5.0%
10.0%
15.0%
20.0%
25.0%
Mo
rtal
ity
Imp
rove
men
ts p
er a
nn
um
Age Bands
Time Periods
England & Wales Crude MaleMortality Improvement Rates1995-98
1990-94
1985-89
1980-84
1975-79
1970-74
1965-69
1960-64
1955-59
1950-54
1945-49
1940-44
1935-39
1930-34
1925-29
1920-24
1915-19
1910-14
1905-09
1900-04
1895-99
1890-94
1885-89
1880-84
1875-79
1870-74
1865-69
1860-64
1855-59
1850-54
1845-49
June 23, 2003 7
England & WalesEngland & Wales- Male
-25.0%
-20.0%
-15.0%
-10.0%
-5.0%
0.0%
5.0%
10.0%
15.0%
20.0%
25.0%
1995
-98
1985
-89
1975
-79
1965
-69
1955
-59
1945
-49
1935
-39
1925
-29
1915
-19
1905
-09
1895
-99
1885
-89
1875
-79
1865
-69
1855
-59
1845
-49
Year
Imp
rove
men
t R
ates
0 - 4 5 - 9 10 - 14 15 - 19 20 - 24 25 - 29 30 - 34
June 23, 2003 8
England & WalesEngland & Wales-Male
-10.0%
-8.0%
-6.0%
-4.0%
-2.0%
0.0%
2.0%
4.0%
6.0%
8.0%
10.0%
Year
Imp
rove
men
t R
ates
35 - 39 40 - 44 45 - 49 50 - 54 55 - 59 60 - 64 65 - 69
p

June 23, 2003 9
England & WalesEngland & Wales (Male Cohort )
-5.0%
0.0%
5.0%
10.0%
15.0%
20.0%
25.0%
1920-24 1930-34 1940-44 1950-54 1960-64 1970-74 1980-85 1990-94
Date
Impr
ovem
ent
Rat
es
1920-24
1925-29
1930-34
1935-39
1940-44
1945-49
1950-54
June 23, 2003 10
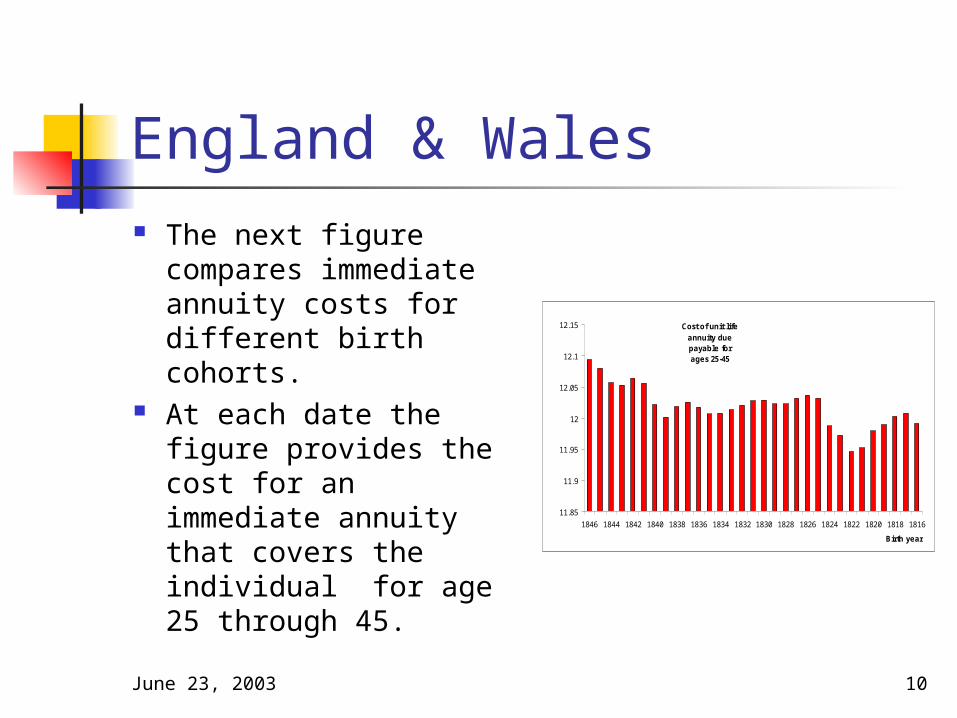
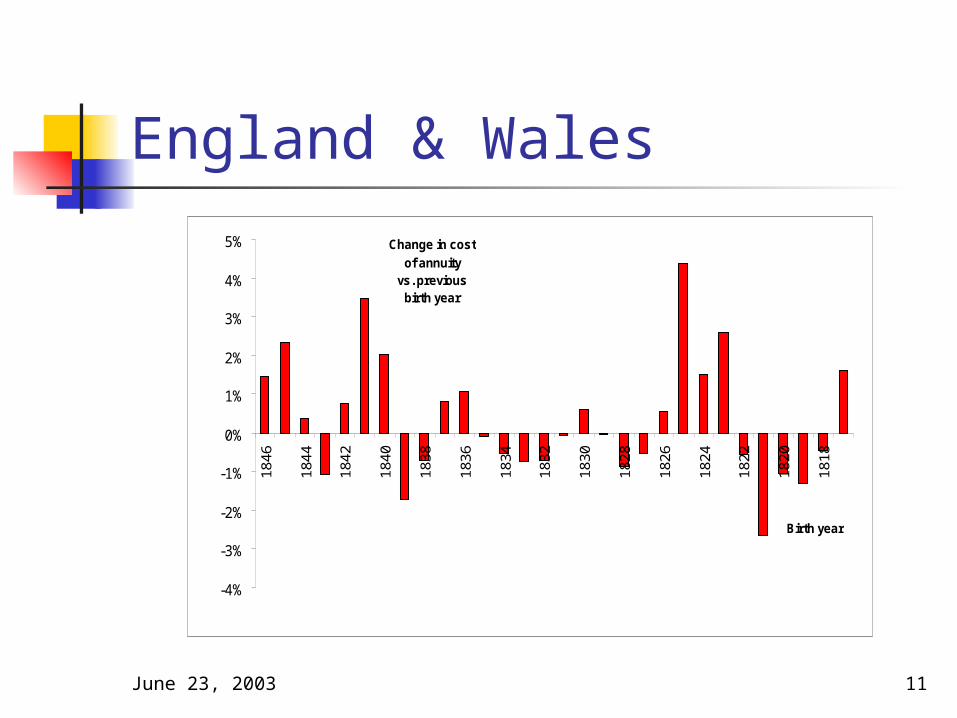
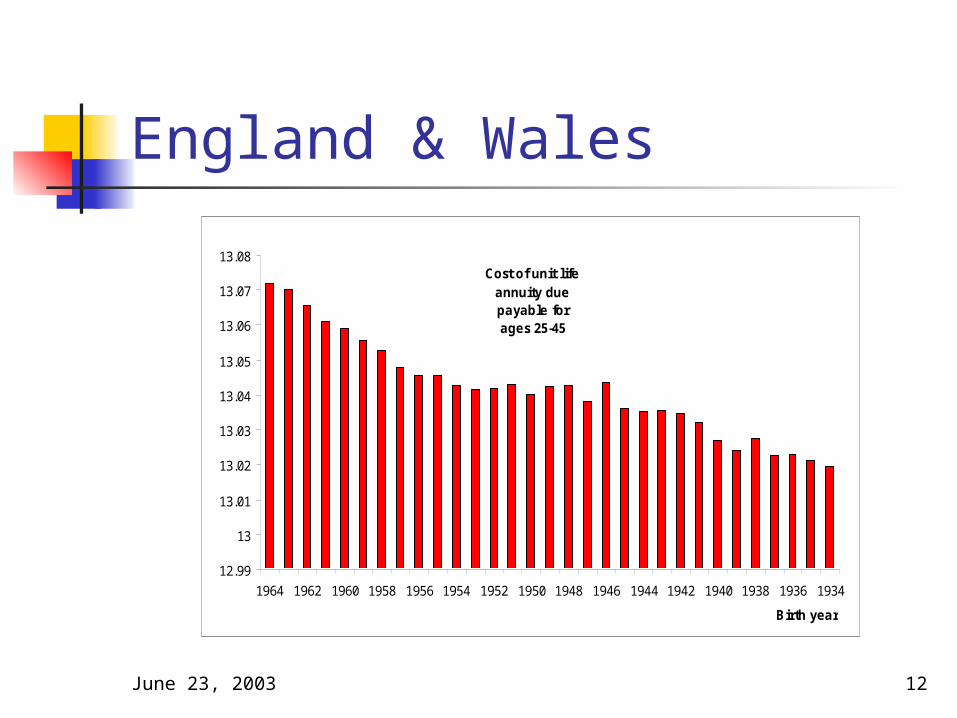
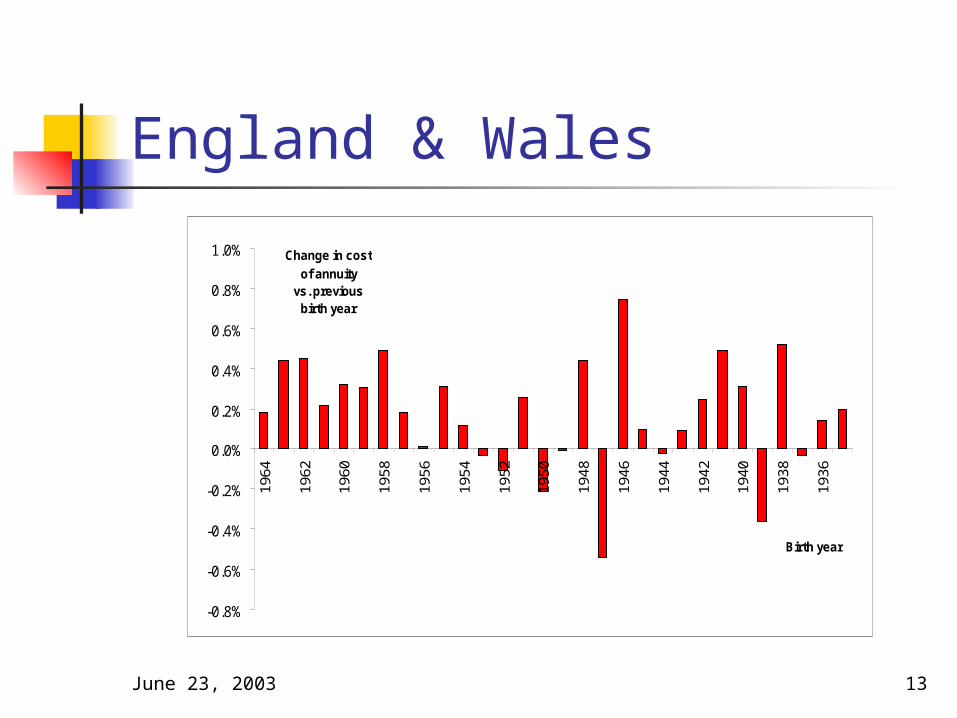
England & Wales The next figure
compares immediate annuity costs for different birth cohorts.
At each date the figure provides the cost for an immediate annuity that covers the individual for age 25 through 45.
11.85
11.9
11.95
12
12.05
12.1
12.15
1846 1844 1842 1840 1838 1836 1834 1832 1830 1828 1826 1824 1822 1820 1818 1816
Birth year
Cost of unit life annuity due payable for ages 25-45
June 23, 2003 11
England & Wales
-4%
-3%
-2%
-1%
0%
1%
2%
3%
4%
5%
1846
1844
1842
1840
1838
1836
1834
1832
1830
1828
1826
1824
1822
1820
1818
Birth year
Change in cost of annuity
vs. previous birth year
June 23, 2003 12
England & Wales
12.99
13
13.01
13.02
13.03
13.04
13.05
13.06
13.07
13.08
1964 1962 1960 1958 1956 1954 1952 1950 1948 1946 1944 1942 1940 1938 1936 1934
Birth year
Cost of unit life annuity due payable for ages 25-45
June 23, 2003 13
England & Wales
-0.8%
-0.6%
-0.4%
-0.2%
0.0%
0.2%
0.4%
0.6%
0.8%
1.0%19
64
1962
1960
1958
1956
1954
1952
1950
1948
1946
1944
1942
1940
1938
1936
Birth year
Change in cost of annuity
vs. previous birth year
June 23, 2003 14
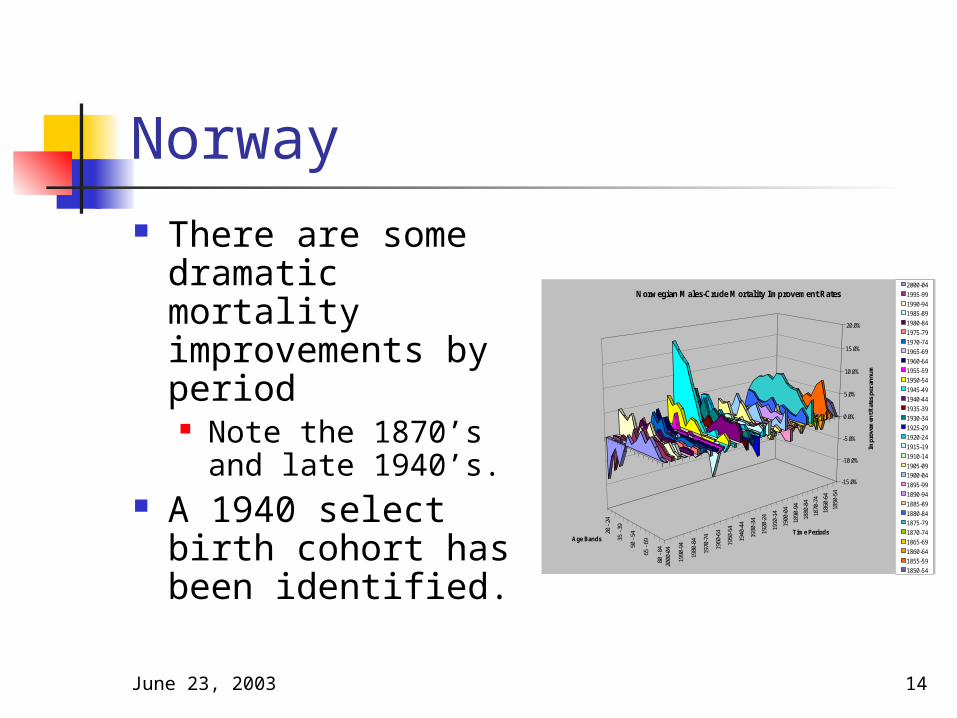
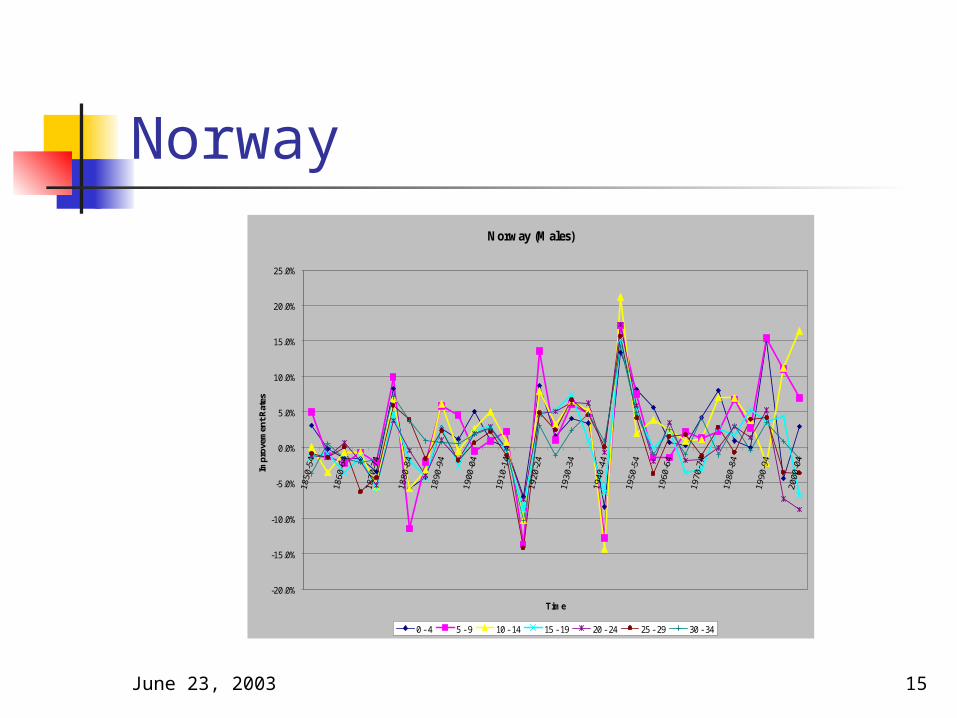
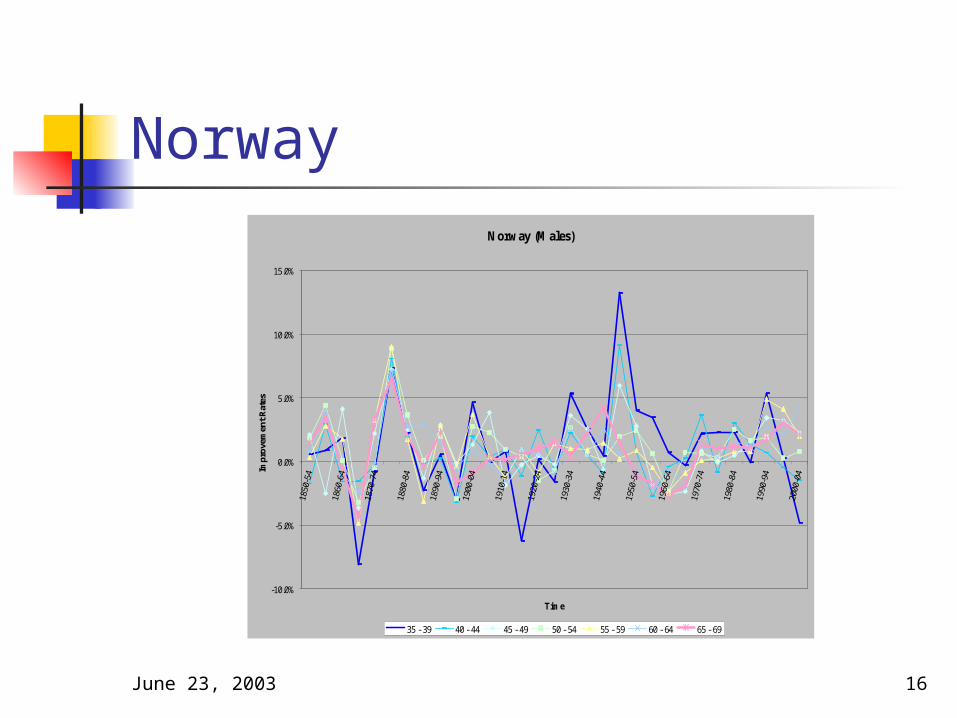
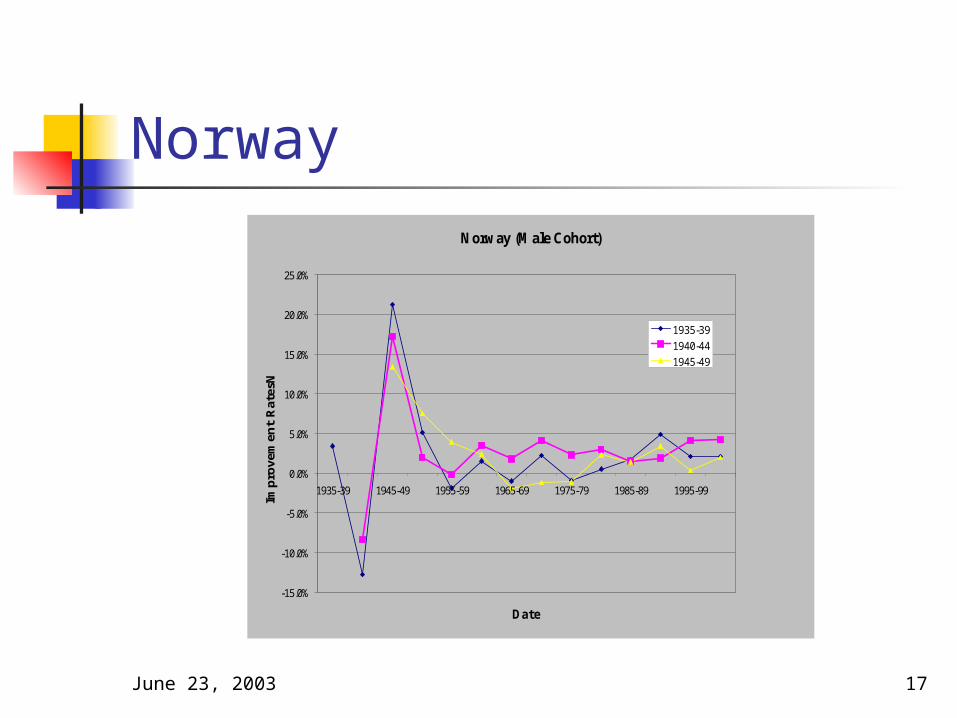
Norway There are some
dramatic mortality improvements by period Note the 1870’s
and late 1940’s. A 1940 select
birth cohort has been identified.
20 -
24
35 -
39
50 -
54
65 -
69
80 -
8420
00-0
4
1990
-94
1980
-84
1970
-74
1960
-64
1950
-54
1940
-44
1930
-34
1920
-24
1910
-14
1900
-04
1890
-94
1880
-84
1870
-74
1860
-64
1850
-54
-15.0%
-10.0%
-5.0%
0.0%
5.0%
10.0%
15.0%
20.0%
Impr
ovem
ent R
ates
per
ann
um
Age BandsTime Periods
Norwegian Males-Crude Mortality Improvement Rates2000-04
1995-99
1990-94
1985-89
1980-84
1975-79
1970-74
1965-69
1960-64
1955-59
1950-54
1945-49
1940-44
1935-39
1930-34
1925-29
1920-24
1915-19
1910-14
1905-09
1900-04
1895-99
1890-94
1885-89
1880-84
1875-79
1870-74
1865-69
1860-64
1855-59
1850-54
June 23, 2003 15
NorwayNorway (Males)
-20.0%
-15.0%
-10.0%
-5.0%
0.0%
5.0%
10.0%
15.0%
20.0%
25.0%
Time
Imp
rove
men
t R
ates
0 - 4 5 - 9 10 - 14 15 - 19 20 - 24 25 - 29 30 - 34
June 23, 2003 16
NorwayNorway (Males)
-10.0%
-5.0%
0.0%
5.0%
10.0%
15.0%
Time
Imp
rove
men
t R
ates
35 - 39 40 - 44 45 - 49 50 - 54 55 - 59 60 - 64 65 - 69
June 23, 2003 17
NorwayNorway (Male Cohort)
-15.0%
-10.0%
-5.0%
0.0%
5.0%
10.0%
15.0%
20.0%
25.0%
1935-39 1945-49 1955-59 1965-69 1975-79 1985-89 1995-99
Date
Impr
ovem
ent
Rat
esN
1935-39
1940-44
1945-49
June 23, 2003 18
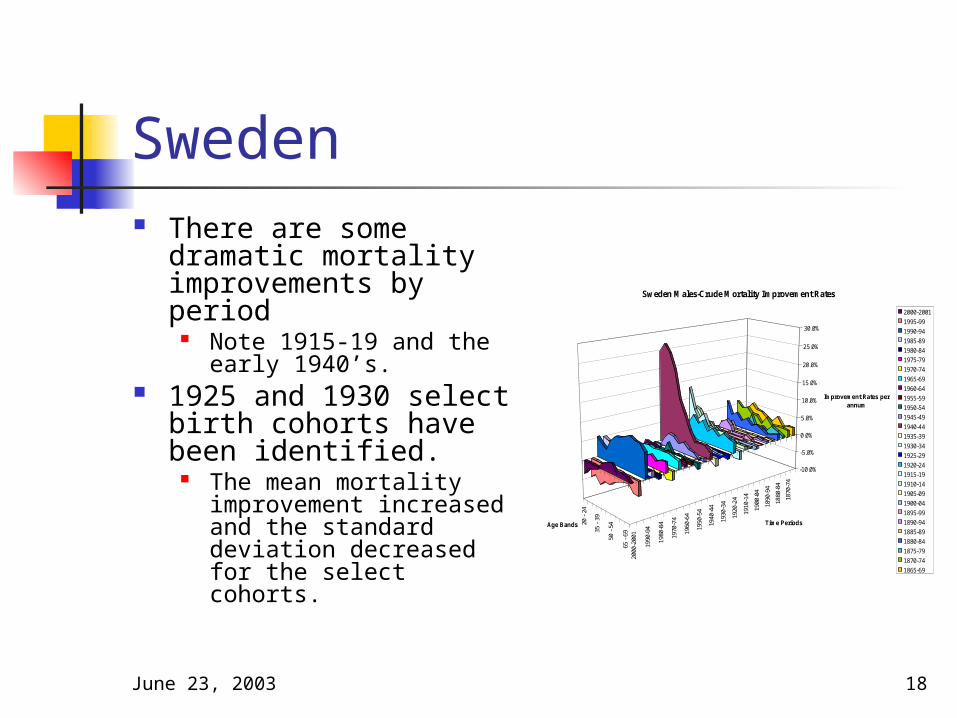
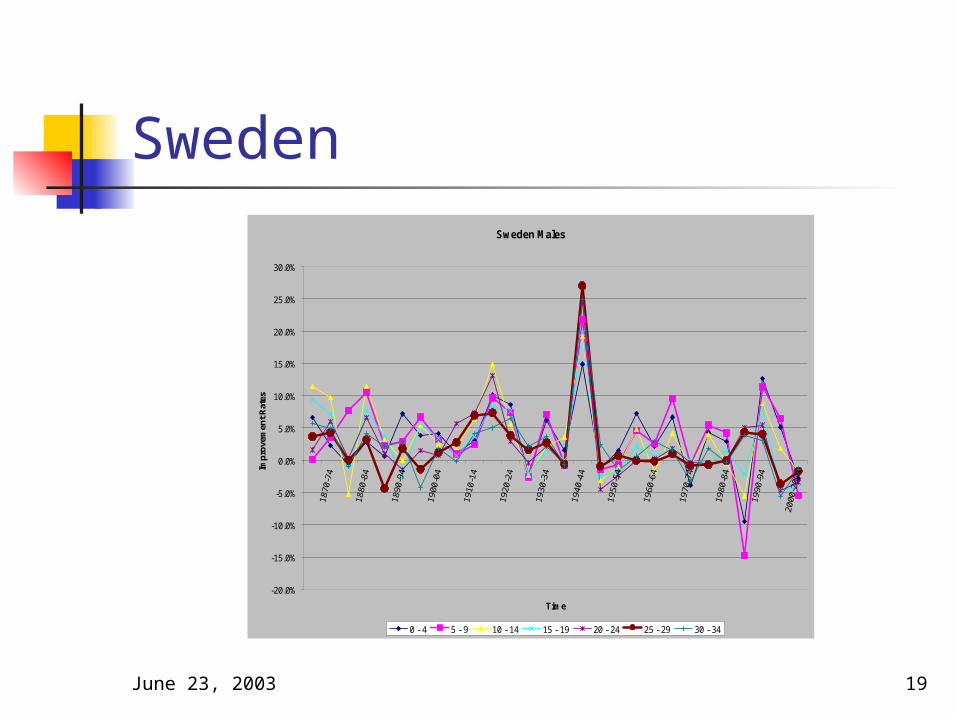
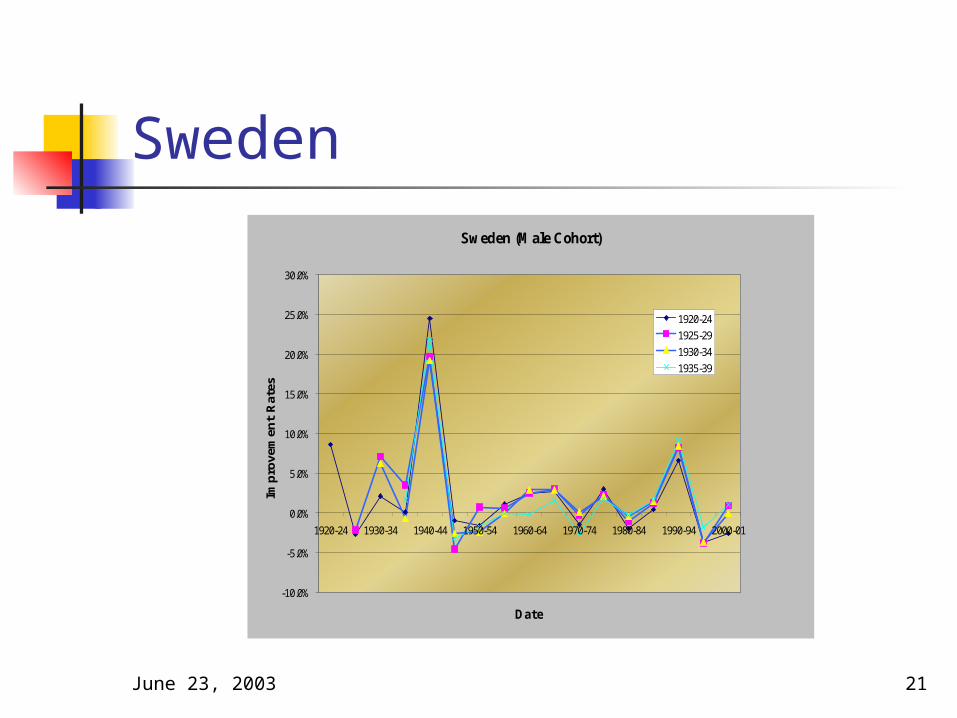
Sweden There are some
dramatic mortality improvements by period
Note 1915-19 and the early 1940’s.
1925 and 1930 select birth cohorts have been identified.
The mean mortality improvement increased and the standard deviation decreased for the select cohorts.
20 -
24
35 -
39
50 -
54
65 -
69
2000
-200
1
1990
-94
1980
-84
1970
-74
1960
-64
1950
-54
1940
-44
1930
-34
1920
-24
1910
-14
1900
-04
1890
-94
1880
-84
1870
-74
-10.0%
-5.0%
0.0%
5.0%
10.0%
15.0%
20.0%
25.0%
30.0%
Improvement Rates per annum
Age Bands Time Periods
Sweden Males-Crude Mortality Improvement Rates
2000-2001
1995-99
1990-94
1985-89
1980-84
1975-79
1970-74
1965-69
1960-64
1955-59
1950-54
1945-49
1940-44
1935-39
1930-34
1925-29
1920-24
1915-19
1910-14
1905-09
1900-04
1895-99
1890-94
1885-89
1880-84
1875-79
1870-74
1865-69
June 23, 2003 19
SwedenSweden Males
-20.0%
-15.0%
-10.0%
-5.0%
0.0%
5.0%
10.0%
15.0%
20.0%
25.0%
30.0%
Time
Imp
rove
men
t R
ates
0 - 4 5 - 9 10 - 14 15 - 19 20 - 24 25 - 29 30 - 34

June 23, 2003 20
SwedenSweden Males
-10.0%
-5.0%
0.0%
5.0%
10.0%
15.0%
20.0%
25.0%
Time
Imp
rove
men
t R
ates
35 - 39 40 - 44 45 - 49 50 - 54 55 - 59 60 - 64 65 - 69
June 23, 2003 21
SwedenSweden (Male Cohort)
-10.0%
-5.0%
0.0%
5.0%
10.0%
15.0%
20.0%
25.0%
30.0%
1920-24 1930-34 1940-44 1950-54 1960-64 1970-74 1980-84 1990-94 2000-01
Date
Impr
ovem
ent
Rat
es
1920-24
1925-29
1930-34
1935-39
June 23, 2003 22
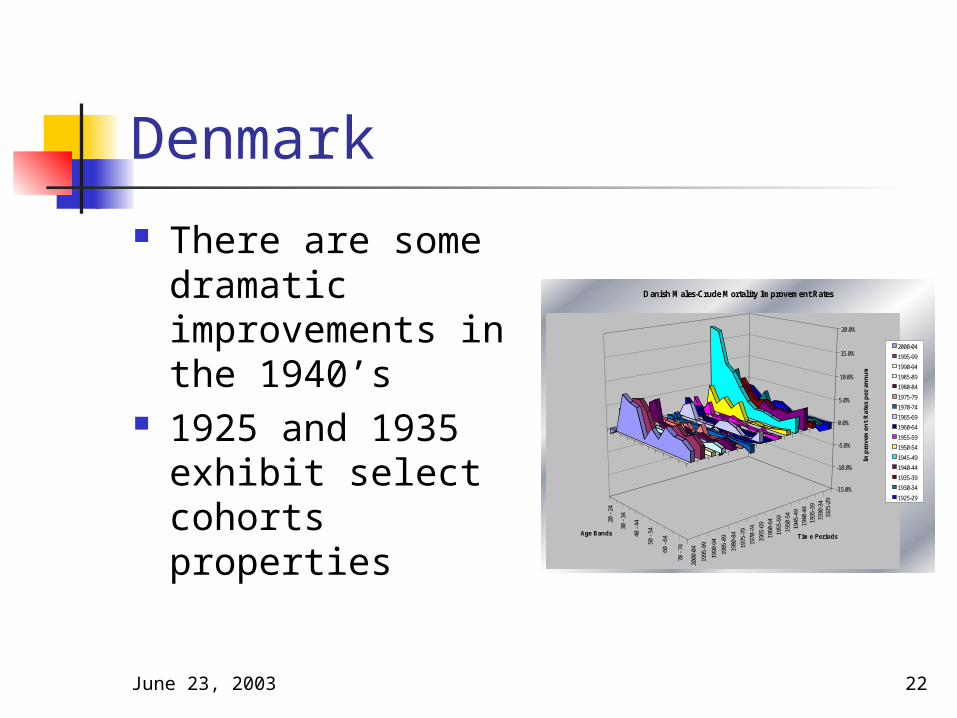
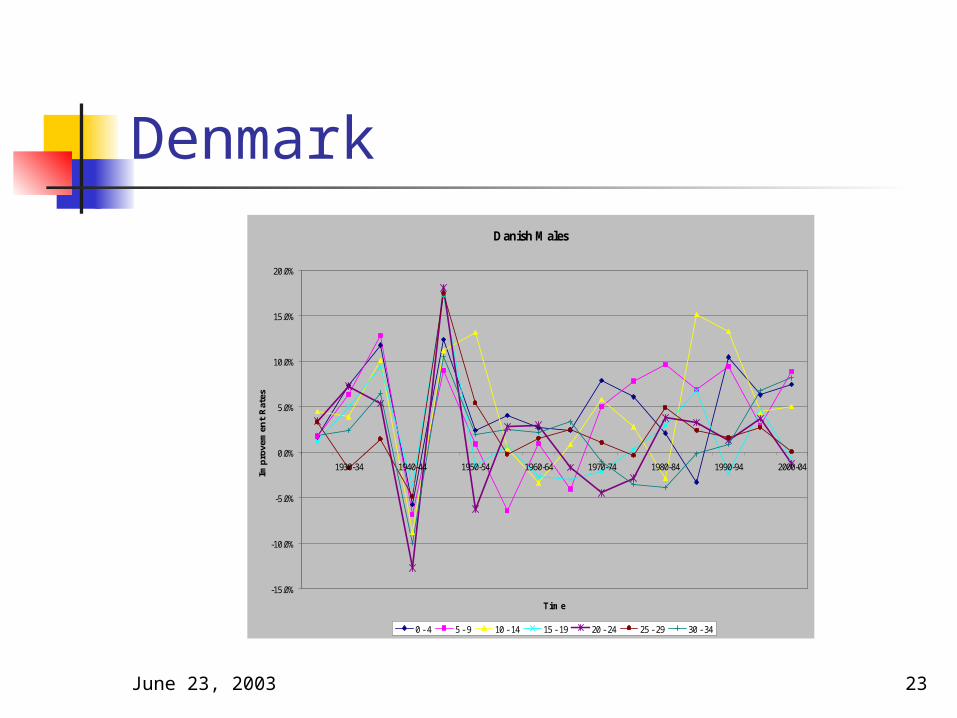
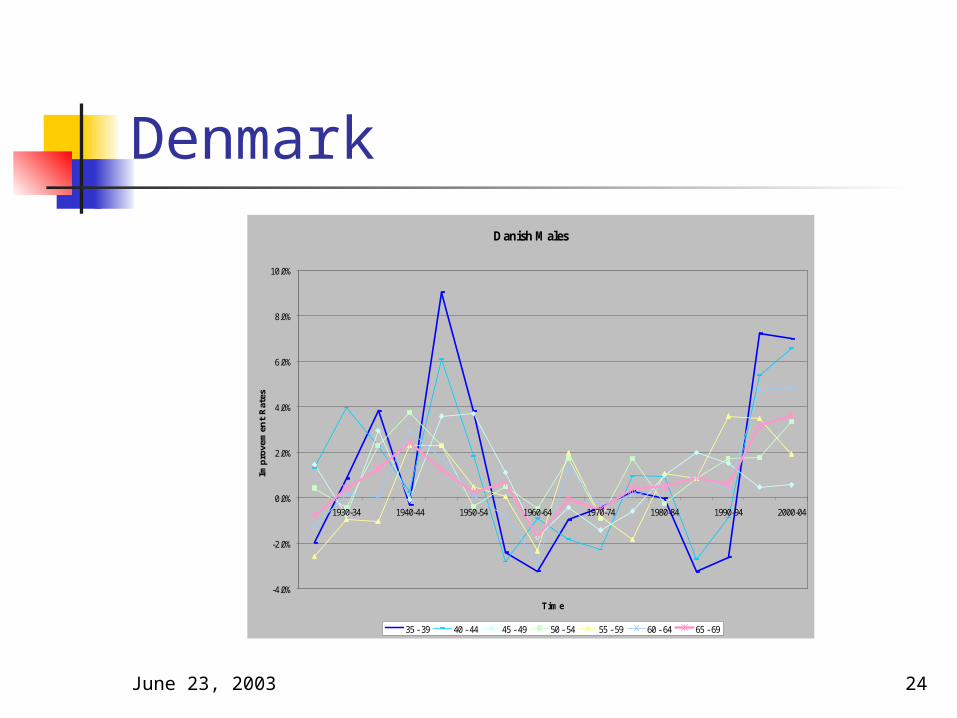
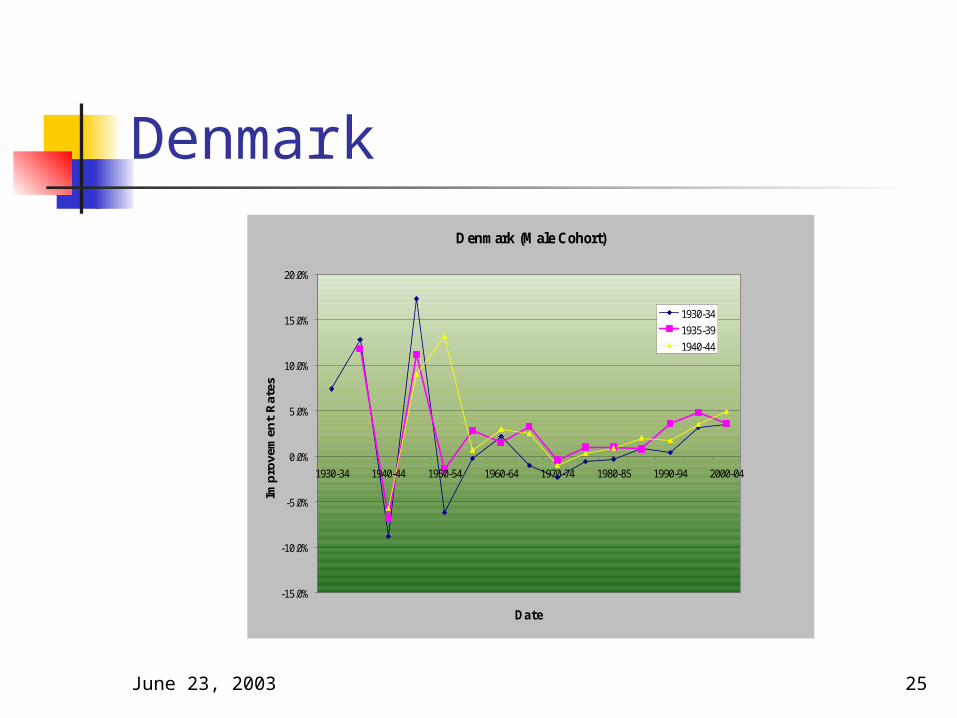
Denmark There are some
dramatic improvements in the 1940’s
1925 and 1935 exhibit select cohorts properties 20
- 24
30 -
34
40 -
44
50 -
54
60 -
64
70 -
74
2000
-04
1995
-99
1990
-94
1985
-89
1980
-84
1975
-79
1970
-74
1965
-69
1960
-64
1955
-59
1950
-54
1945
-49
1940
-44
1935
-39
1930
-34
1925
-29
-15.0%
-10.0%
-5.0%
0.0%
5.0%
10.0%
15.0%
20.0%
Impr
ovem
ent
Rat
es p
er a
nnum
Age Bands Time Periods
Danish Males-Crude Mortality Improvement Rates
2000-04
1995-99
1990-94
1985-89
1980-84
1975-79
1970-74
1965-69
1960-64
1955-59
1950-54
1945-49
1940-44
1935-39
1930-34
1925-29
June 23, 2003 23
DenmarkDanish Males
-15.0%
-10.0%
-5.0%
0.0%
5.0%
10.0%
15.0%
20.0%
2000-041990-941980-841970-741960-641950-541940-441930-34
Time
Impro
vem
ent
Rat
es
0 - 4 5 - 9 10 - 14 15 - 19 20 - 24 25 - 29 30 - 34
June 23, 2003 24
DenmarkDanish Males
-4.0%
-2.0%
0.0%
2.0%
4.0%
6.0%
8.0%
10.0%
2000-041990-941980-841970-741960-641950-541940-441930-34
Time
Impro
vem
ent
Rat
es
35 - 39 40 - 44 45 - 49 50 - 54 55 - 59 60 - 64 65 - 69
June 23, 2003 25
DenmarkDenmark (Male Cohort)
-15.0%
-10.0%
-5.0%
0.0%
5.0%
10.0%
15.0%
20.0%
1930-34 1940-44 1950-54 1960-64 1970-74 1980-85 1990-94 2000-04
Date
Impr
ovem
ent
Rat
es
1930-34
1935-39
1940-44
June 23, 2003 26
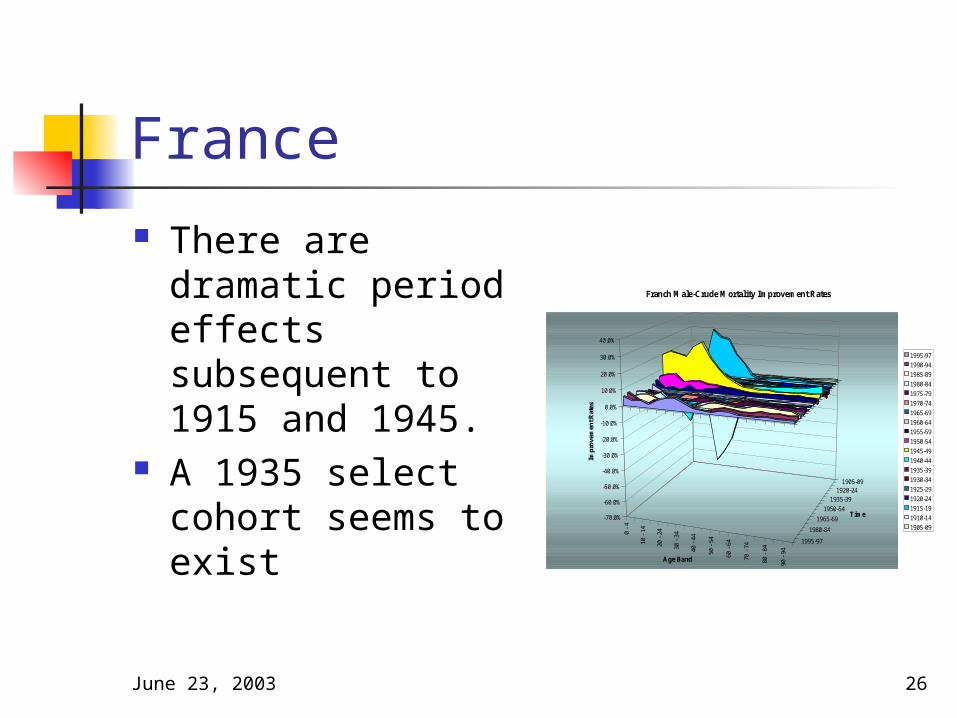
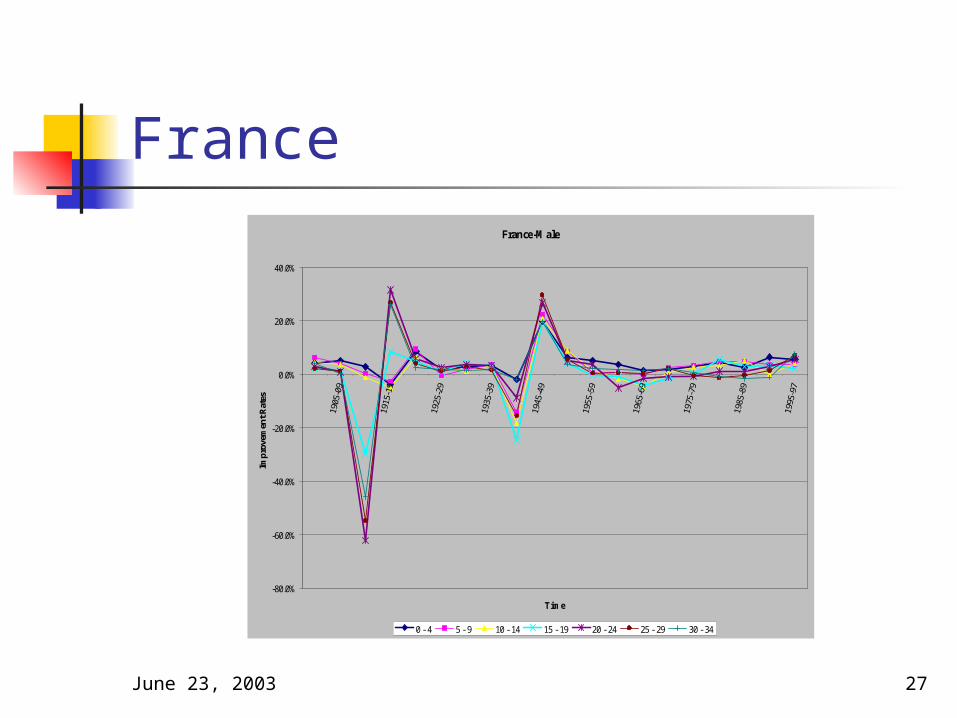
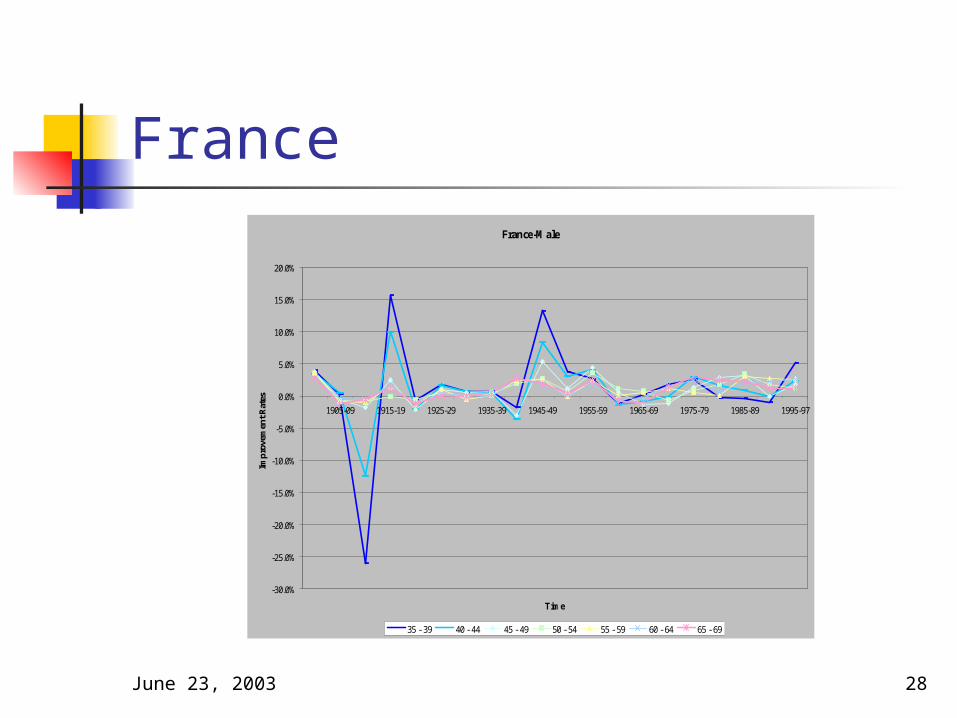
France There are
dramatic period effects subsequent to 1915 and 1945.
A 1935 select cohort seems to exist
0 -
4
10 -
14
20 -
24
30 -
34
40 -
44
50 -
54
60 -
64
70 -
74
80 -
84
90 -
94
1995-97
1980-84
1965-69
1950-54
1935-391920-24
1905-09
-70.0%
-60.0%
-50.0%
-40.0%
-30.0%
-20.0%
-10.0%
0.0%
10.0%
20.0%
30.0%
40.0%
Impr
ovem
ent R
ates
Age Band
Time
Franch Male-Crude Mortality Improvement Rates
1995-97
1990-94
1985-89
1980-84
1975-79
1970-74
1965-69
1960-64
1955-59
1950-54
1945-49
1940-44
1935-39
1930-34
1925-29
1920-24
1915-19
1910-14
1905-09
June 23, 2003 27
FranceFrance-Male
-80.0%
-60.0%
-40.0%
-20.0%
0.0%
20.0%
40.0%
Time
Impr
ovem
ent R
ates
0 - 4 5 - 9 10 - 14 15 - 19 20 - 24 25 - 29 30 - 34
June 23, 2003 28
FranceFrance-Male
-30.0%
-25.0%
-20.0%
-15.0%
-10.0%
-5.0%
0.0%
5.0%
10.0%
15.0%
20.0%
1995-971985-891975-791965-691955-591945-491935-391925-291915-191905-09
Time
Impr
ovem
ent R
ates
35 - 39 40 - 44 45 - 49 50 - 54 55 - 59 60 - 64 65 - 69
June 23, 2003 29
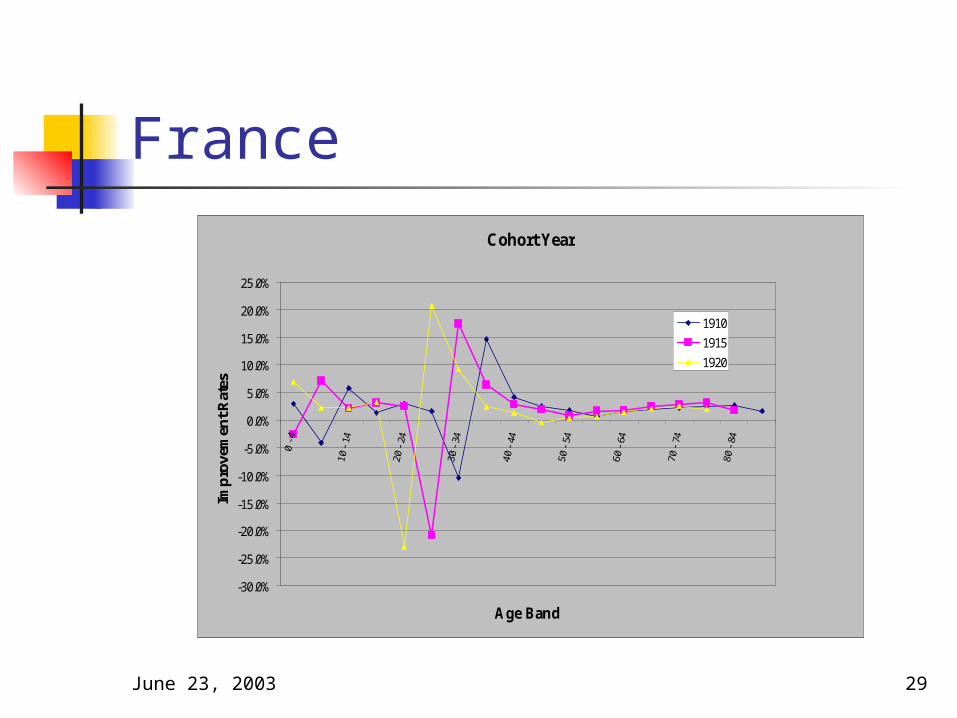
FranceCohort Year
-30.0%
-25.0%
-20.0%
-15.0%
-10.0%
-5.0%
0.0%
5.0%
10.0%
15.0%
20.0%
25.0%
Age Band
Impr
ovem
ent R
ates
1910
1915
1920
June 23, 2003 30
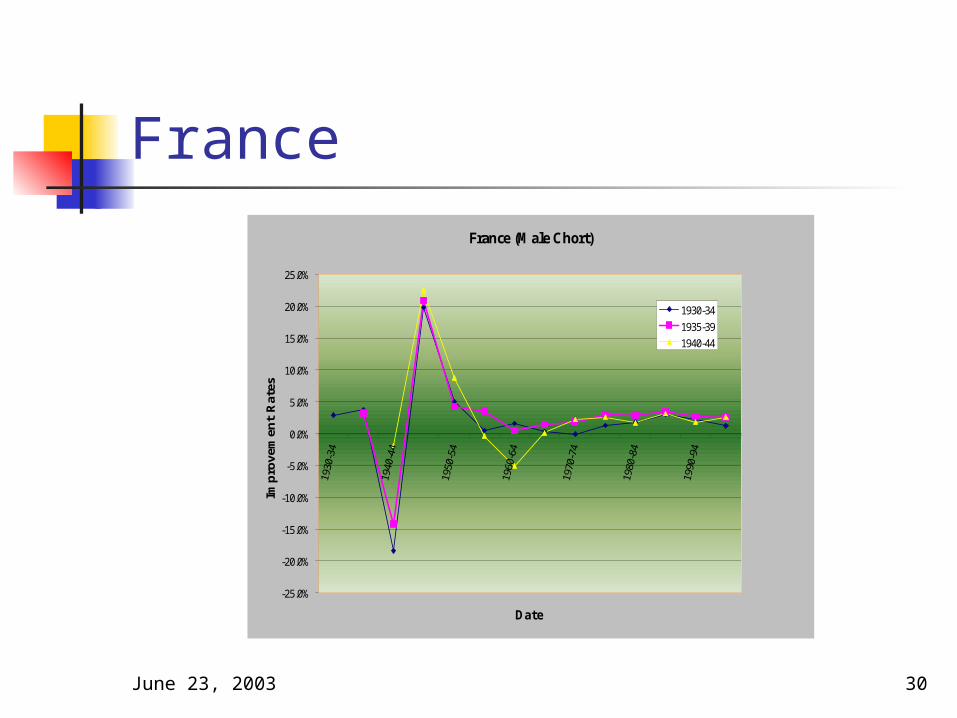
FranceFrance (Male Chort)
-25.0%
-20.0%
-15.0%
-10.0%
-5.0%
0.0%
5.0%
10.0%
15.0%
20.0%
25.0%
Date
Impr
ovem
ent
Rat
es
1930-34
1935-39
1940-44
June 23, 2003 31
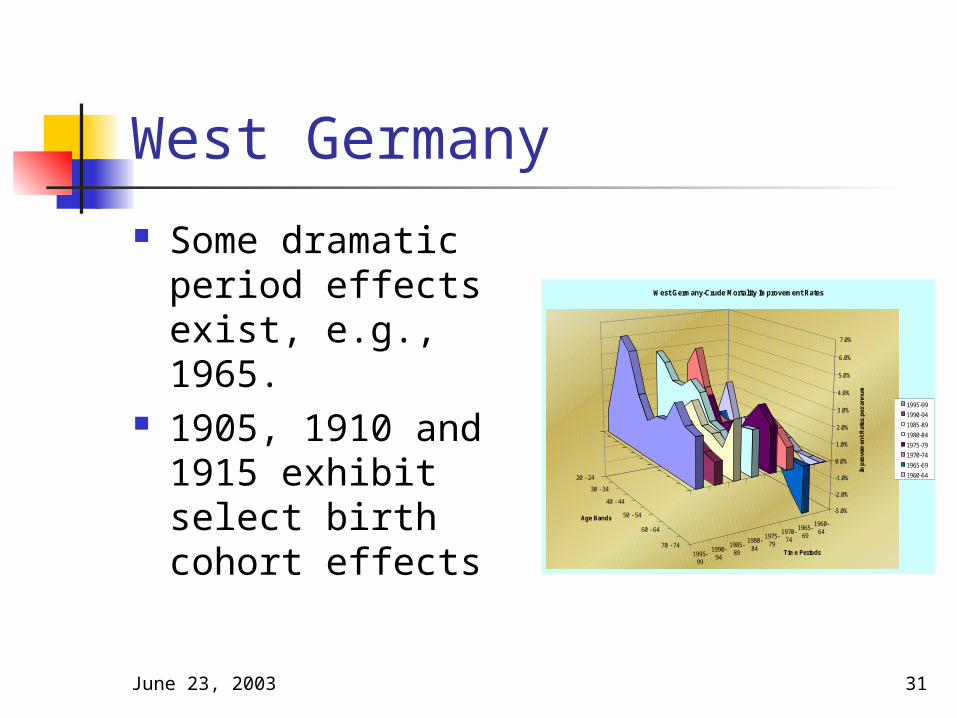
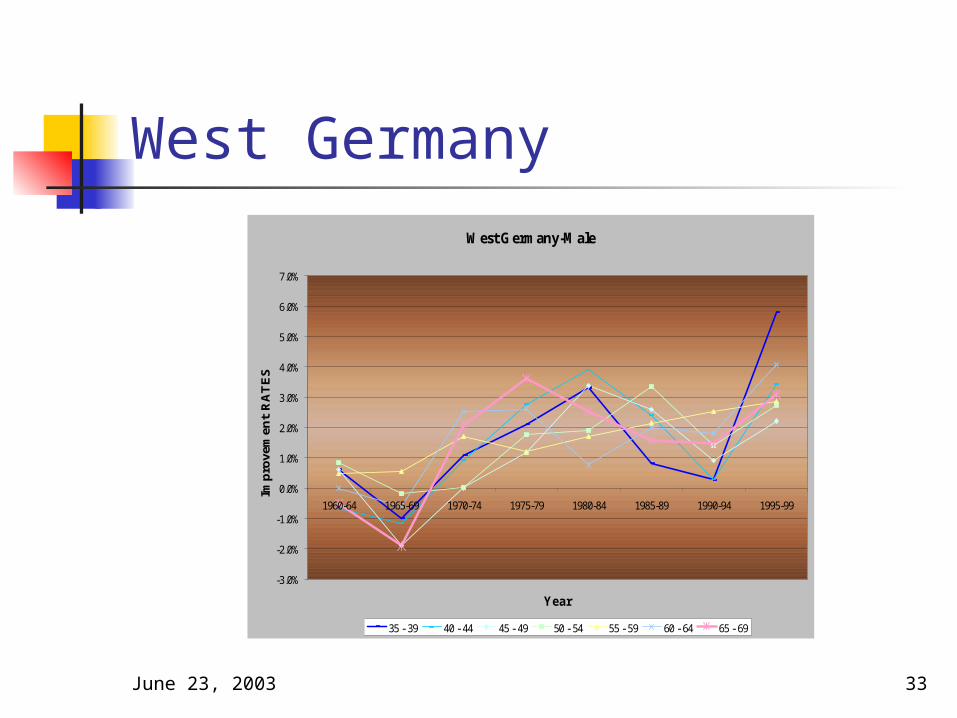
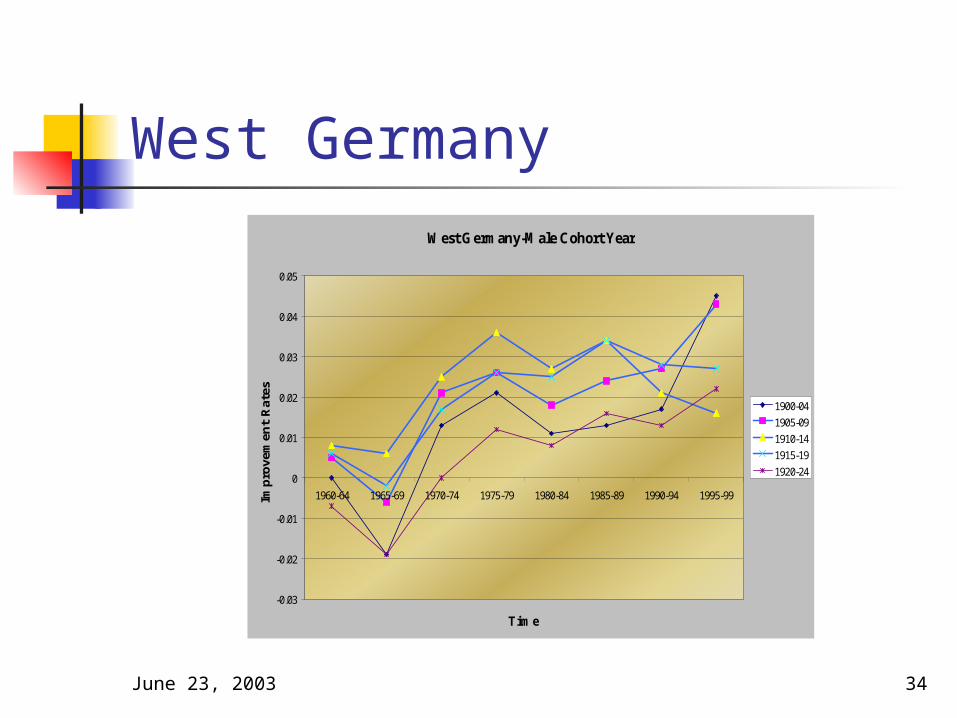
West Germany Some dramatic
period effects exist, e.g., 1965.
1905, 1910 and 1915 exhibit select birth cohort effects
20 - 24
30 - 34
40 - 44
50 - 54
60 - 64
70 - 741995-
99
1990-94
1985-89
1980-84
1975-79
1970-74
1965-69
1960-64
-3.0%
-2.0%
-1.0%
0.0%
1.0%
2.0%
3.0%
4.0%
5.0%
6.0%
7.0%
Imp
rove
men
t R
ates
per
an
nu
m
Age Bands
Time Periods
West Germany-Crude Mortality Improvement Rates
1995-99
1990-94
1985-89
1980-84
1975-79
1970-74
1965-69
1960-64
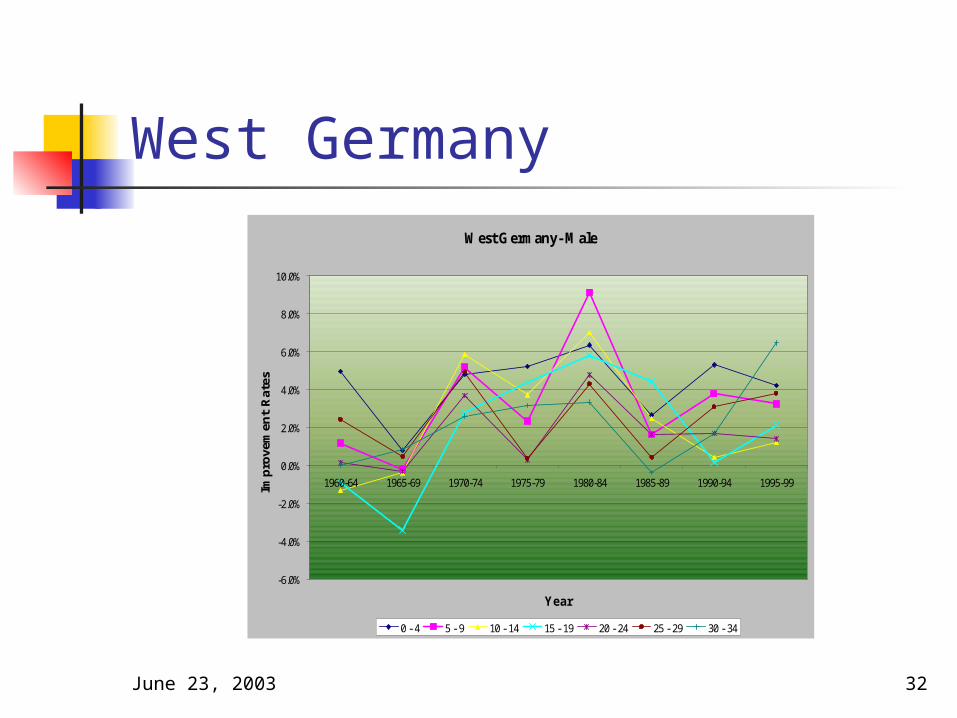
June 23, 2003 32
West GermanyWest Germany- Male
-6.0%
-4.0%
-2.0%
0.0%
2.0%
4.0%
6.0%
8.0%
10.0%
1995-991990-941985-891980-841975-791970-741965-691960-64
Year
Impr
ovem
ent
Rat
es
0 - 4 5 - 9 10 - 14 15 - 19 20 - 24 25 - 29 30 - 34
June 23, 2003 33
West GermanyWest Germany-Male
-3.0%
-2.0%
-1.0%
0.0%
1.0%
2.0%
3.0%
4.0%
5.0%
6.0%
7.0%
1995-991990-941985-891980-841975-791970-741965-691960-64
Year
Impr
ovem
ent
RA
TE
S
35 - 39 40 - 44 45 - 49 50 - 54 55 - 59 60 - 64 65 - 69
June 23, 2003 34
West GermanyWest Germany-Male Cohort Year
-0.03
-0.02
-0.01
0
0.01
0.02
0.03
0.04
0.05
1960-64 1965-69 1970-74 1975-79 1980-84 1985-89 1990-94 1995-99
Time
Impr
ovem
ent
Rat
es
1900-04
1905-09
1910-14
1915-19
1920-24

June 23, 2003 35
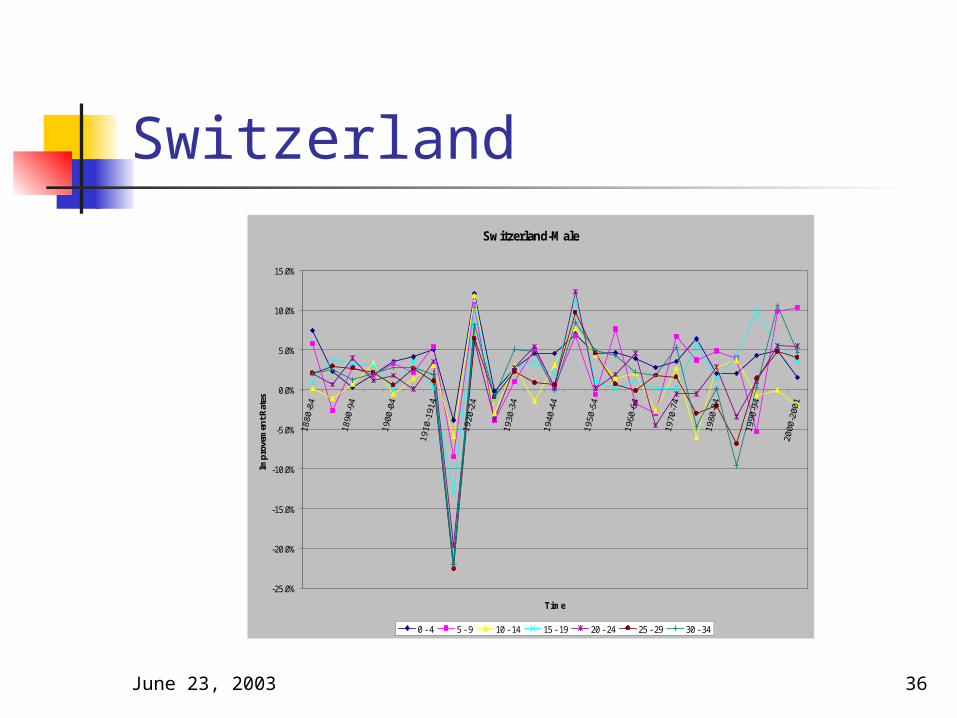
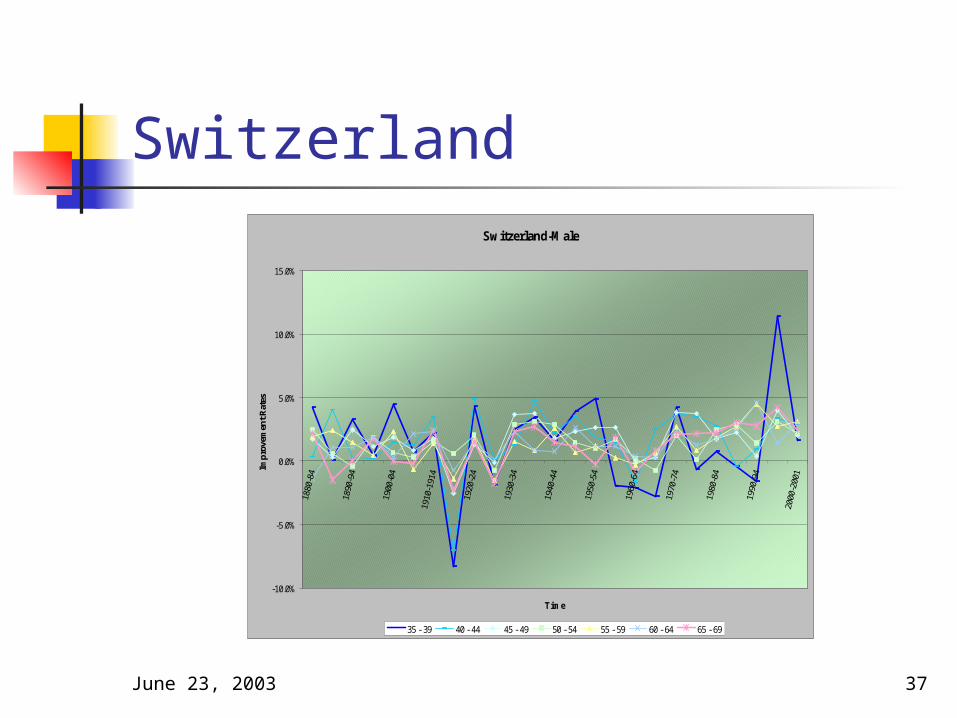
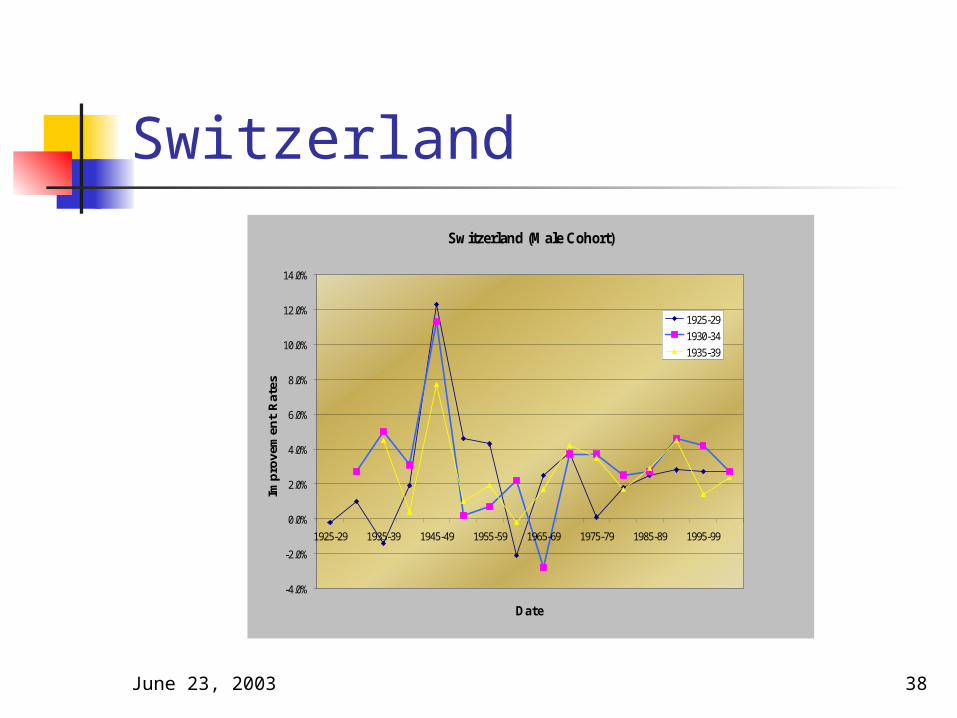
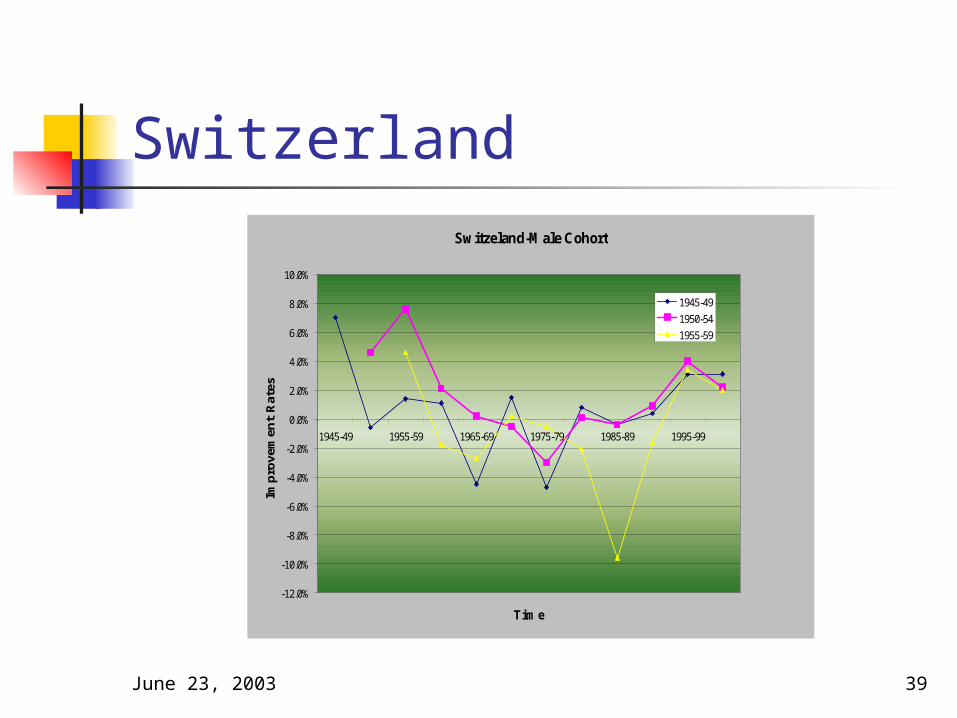
Switzerland There are quite
dramatic period effects for the 1920’s and 1940’s
1930 and 1950 exhibit select cohort properties
10 -
14
20 -
24
30 -
34
40 -
44
50 -
54
60 -
64
2000
-200
1
1990
-94
1980
-84
1970
-74
1960
-64
1950
-54
1940
-44
1930
-34
1920
-24
1910
-191
4
1900
-04
1890
-94
1880
-84
-25.0%
-20.0%
-15.0%
-10.0%
-5.0%
0.0%
5.0%
10.0%
15.0%
Impr
ovem
ent R
ates
per
ann
um
Age Bands
Time Periods
Switzerland Males-Crude Mortality Improvement Rates
2000-2001
1995-99
1990-94
1985-89
1980-84
1975-79
1970-74
1965-69
1960-64
1955-59
1950-54
1945-49
1940-44
1935-39
1930-34
1925-29
1920-24
1915-1919
1910-1914
1905-09
1900-04
1895-99
1890-94
1885-89
1880-84
June 23, 2003 36
SwitzerlandSwitzerland-Male
-25.0%
-20.0%
-15.0%
-10.0%
-5.0%
0.0%
5.0%
10.0%
15.0%
Time
Impr
ovem
ent R
ates
0 - 4 5 - 9 10 - 14 15 - 19 20 - 24 25 - 29 30 - 34
June 23, 2003 37
SwitzerlandSwitzerland-Male
-10.0%
-5.0%
0.0%
5.0%
10.0%
15.0%
Time
Impr
ovem
ent R
ates
35 - 39 40 - 44 45 - 49 50 - 54 55 - 59 60 - 64 65 - 69
June 23, 2003 38
SwitzerlandSwitzerland (Male Cohort)
-4.0%
-2.0%
0.0%
2.0%
4.0%
6.0%
8.0%
10.0%
12.0%
14.0%
1925-29 1935-39 1945-49 1955-59 1965-69 1975-79 1985-89 1995-99
Date
Impr
ovem
ent
Rat
es
1925-29
1930-34
1935-39
June 23, 2003 39
SwitzerlandSwitzeland-Male Cohort
-12.0%
-10.0%
-8.0%
-6.0%
-4.0%
-2.0%
0.0%
2.0%
4.0%
6.0%
8.0%
10.0%
1945-49 1955-59 1965-69 1975-79 1985-89 1995-99
Time
Impr
ovem
ent
Rat
es
1945-49
1950-54
1955-59
June 23, 2003 40
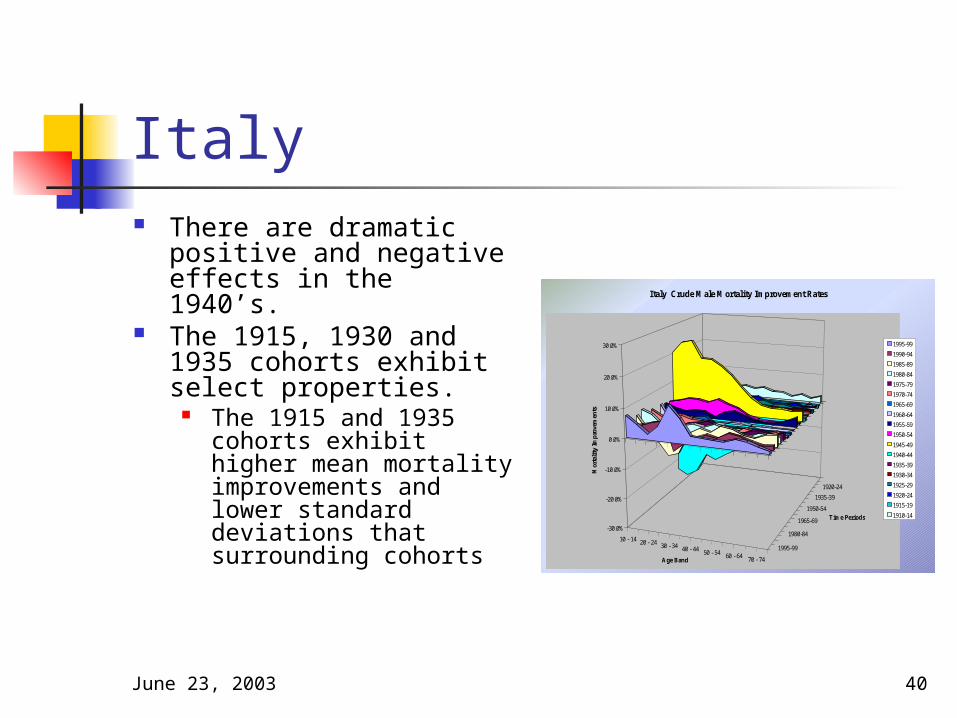
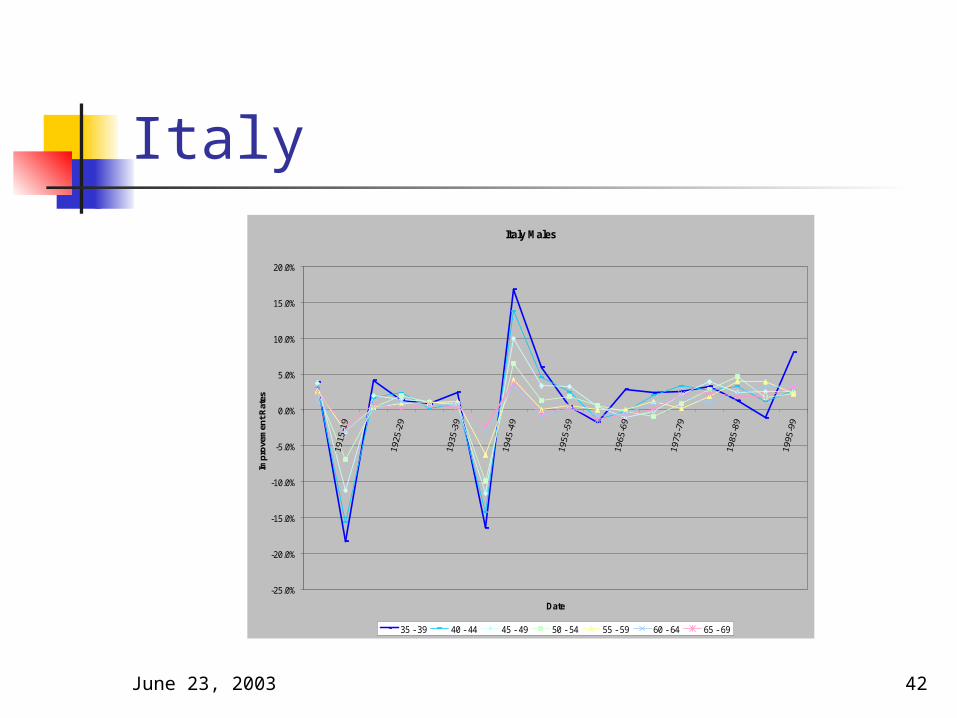
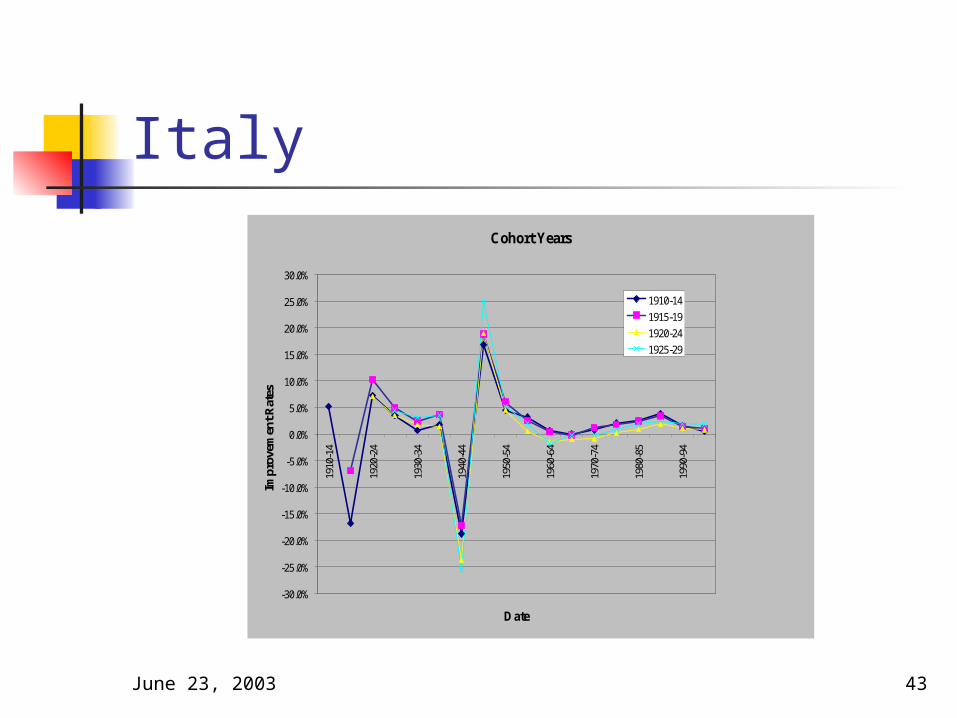
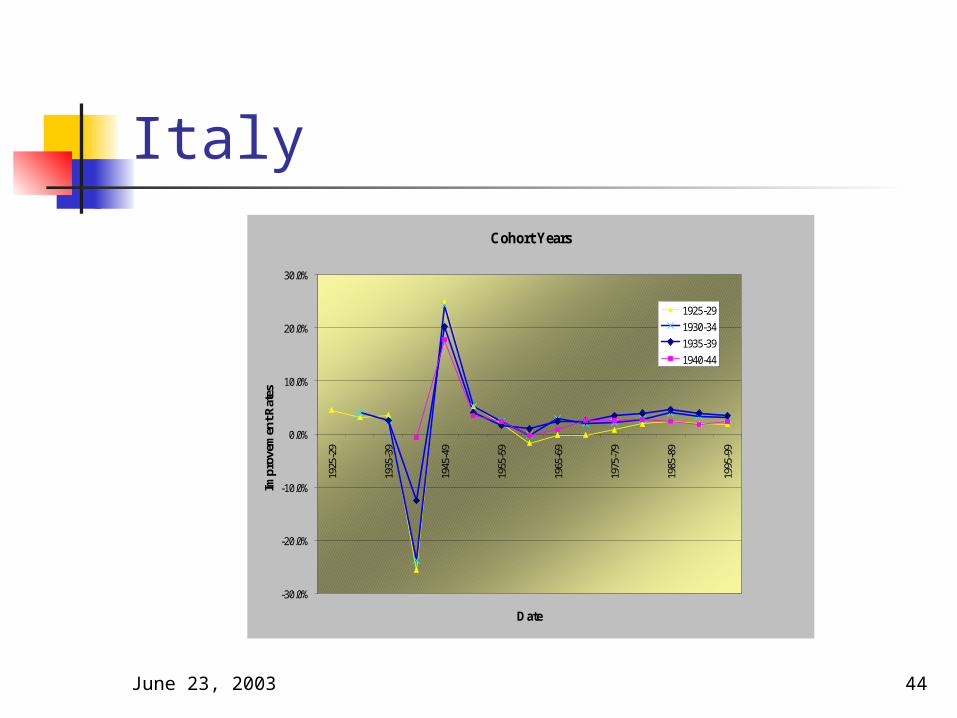
Italy There are dramatic
positive and negative effects in the 1940’s.
The 1915, 1930 and 1935 cohorts exhibit select properties.
The 1915 and 1935 cohorts exhibit higher mean mortality improvements and lower standard deviations that surrounding cohorts
10 - 14 20 - 24 30 - 34 40 - 44 50 - 54 60 - 64 70 - 74
1995-99
1980-84
1965-69
1950-54
1935-39
1920-24
-30.0%
-20.0%
-10.0%
0.0%
10.0%
20.0%
30.0%
Mor
tality
Im
prov
emen
ts
Age Band
Time Periods
Italy Crude Male Mortality Improvement Rates
1995-99
1990-94
1985-89
1980-84
1975-79
1970-74
1965-69
1960-64
1955-59
1950-54
1945-49
1940-44
1935-39
1930-34
1925-29
1920-24
1915-19
1910-14
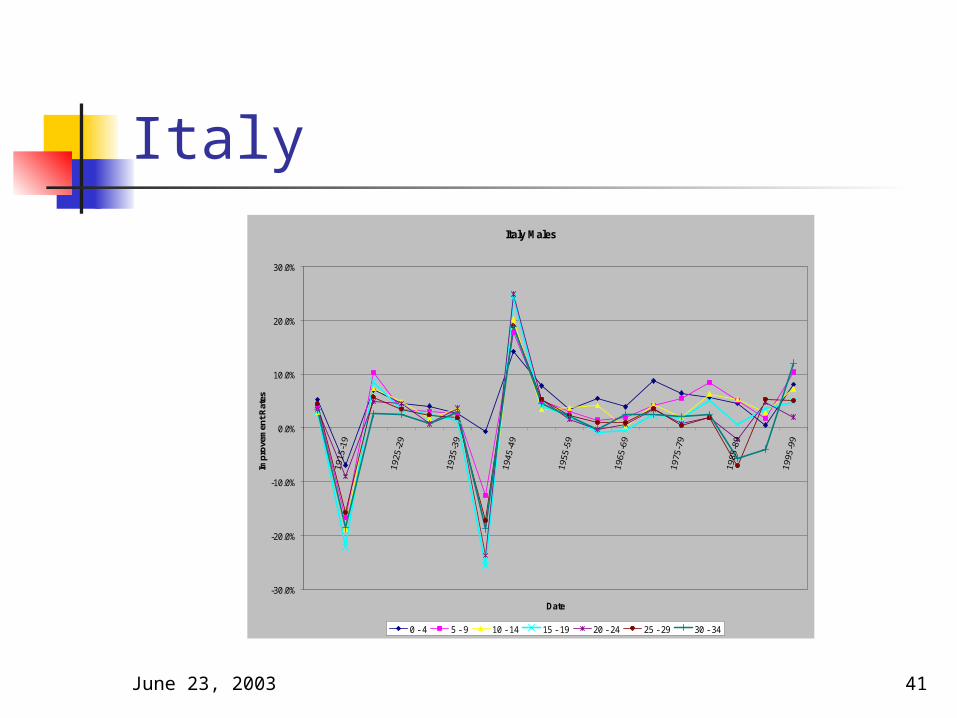
June 23, 2003 41
ItalyItaly Males
-30.0%
-20.0%
-10.0%
0.0%
10.0%
20.0%
30.0%
Date
Imp
rove
men
t R
ates
0 - 4 5 - 9 10 - 14 15 - 19 20 - 24 25 - 29 30 - 34
June 23, 2003 42
ItalyItaly Males
-25.0%
-20.0%
-15.0%
-10.0%
-5.0%
0.0%
5.0%
10.0%
15.0%
20.0%
Date
Imp
rove
men
t R
ates
35 - 39 40 - 44 45 - 49 50 - 54 55 - 59 60 - 64 65 - 69
June 23, 2003 43
ItalyCohort Years
-30.0%
-25.0%
-20.0%
-15.0%
-10.0%
-5.0%
0.0%
5.0%
10.0%
15.0%
20.0%
25.0%
30.0%
1910
-14
1920
-24
1930
-34
1940
-44
1950
-54
1960
-64
1970
-74
1980
-85
1990
-94
Date
Impr
ovem
ent R
ates
1910-14
1915-19
1920-24
1925-29
June 23, 2003 44
ItalyCohort Years
-30.0%
-20.0%
-10.0%
0.0%
10.0%
20.0%
30.0%
1925
-29
1935
-39
1945
-49
1955
-59
1965
-69
1975
-79
1985
-89
1995
-99
Date
Impr
ovem
ent R
ates
1925-29
1930-34
1935-39
1940-44
June 23, 2003 45
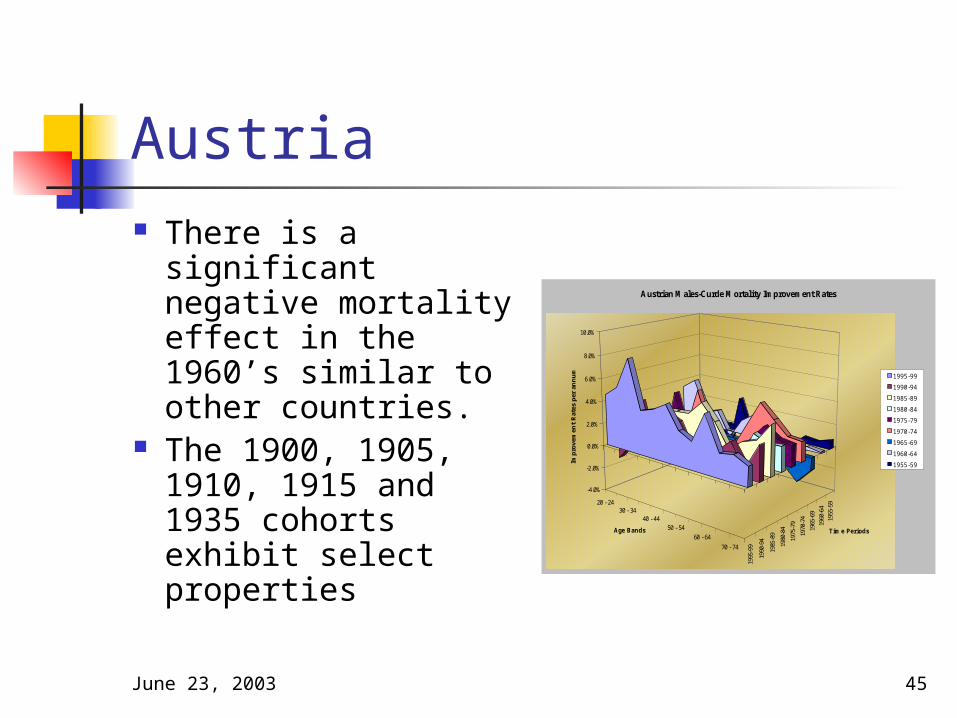
Austria There is a
significant negative mortality effect in the 1960’s similar to other countries.
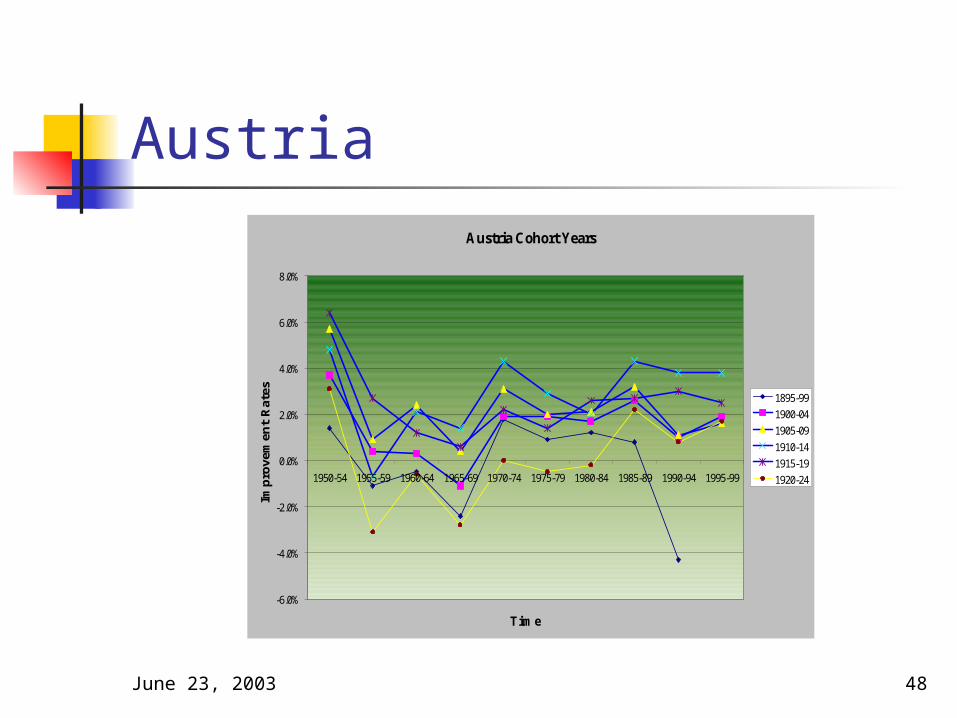
The 1900, 1905, 1910, 1915 and 1935 cohorts exhibit select properties
20 - 2430 - 34
40 - 4450 - 54
60 - 64
70 - 74
1995
-99
1990
-94
1985
-89
1980
-84
1975
-79
1970
-74
1965
-69
1960
-64
1955
-59
-4.0%
-2.0%
0.0%
2.0%
4.0%
6.0%
8.0%
10.0%
Impr
ovem
ent
Rat
es p
er a
nnum
Age Bands Time Periods
Austrian Males-Curde Mortality Improvement Rates
1995-99
1990-94
1985-89
1980-84
1975-79
1970-74
1965-69
1960-64
1955-59
June 23, 2003 46
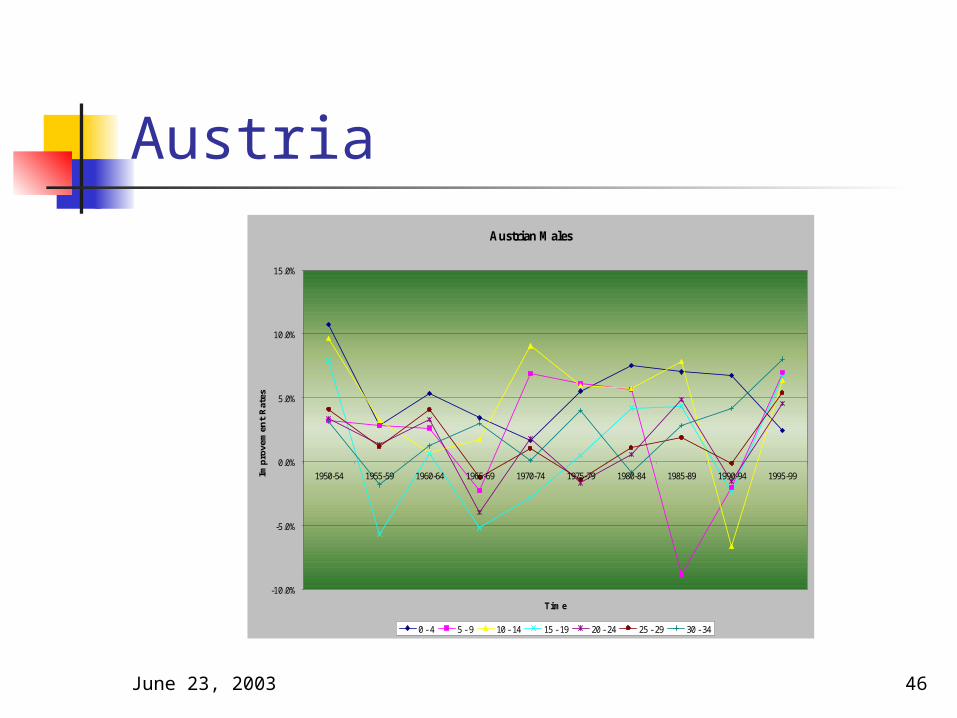
AustriaAustrian Males
-10.0%
-5.0%
0.0%
5.0%
10.0%
15.0%
1995-991990-941985-891980-841975-791970-741965-691960-641955-591950-54
Time
Impro
vem
ent
Rat
es
0 - 4 5 - 9 10 - 14 15 - 19 20 - 24 25 - 29 30 - 34
June 23, 2003 47
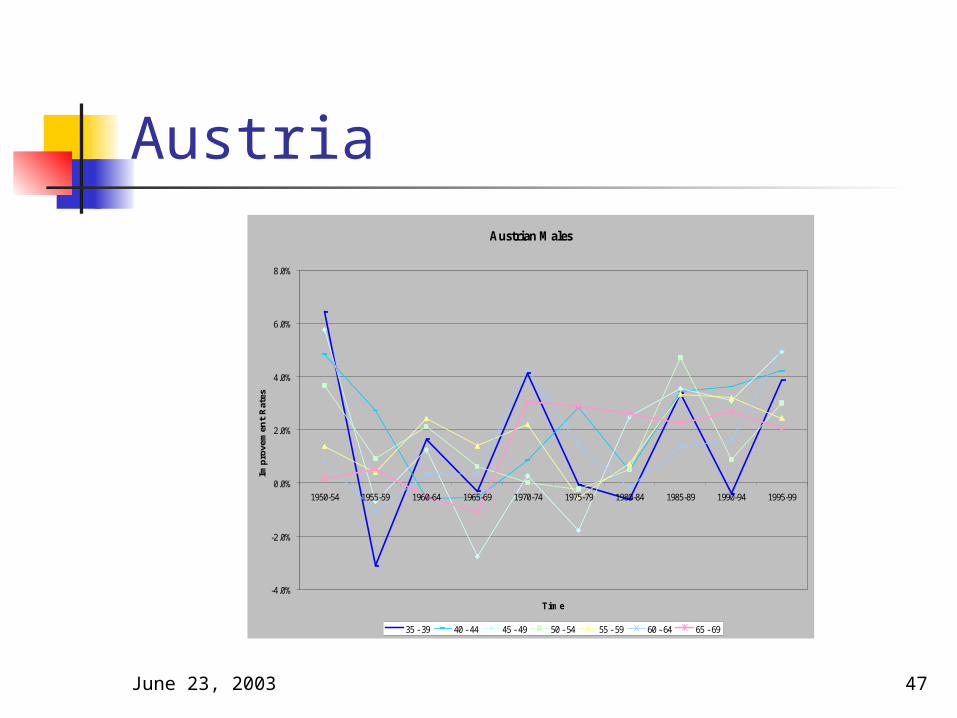
AustriaAustrian Males
-4.0%
-2.0%
0.0%
2.0%
4.0%
6.0%
8.0%
1995-991990-941985-891980-841975-791970-741965-691960-641955-591950-54
Time
Impro
vem
ent
Rat
es
35 - 39 40 - 44 45 - 49 50 - 54 55 - 59 60 - 64 65 - 69
June 23, 2003 48
AustriaAustria Cohort Years
-6.0%
-4.0%
-2.0%
0.0%
2.0%
4.0%
6.0%
8.0%
1950-54 1955-59 1960-64 1965-69 1970-74 1975-79 1980-84 1985-89 1990-94 1995-99
Time
Impr
ovem
ent
Rat
es 1895-99
1900-04
1905-09
1910-14
1915-19
1920-24
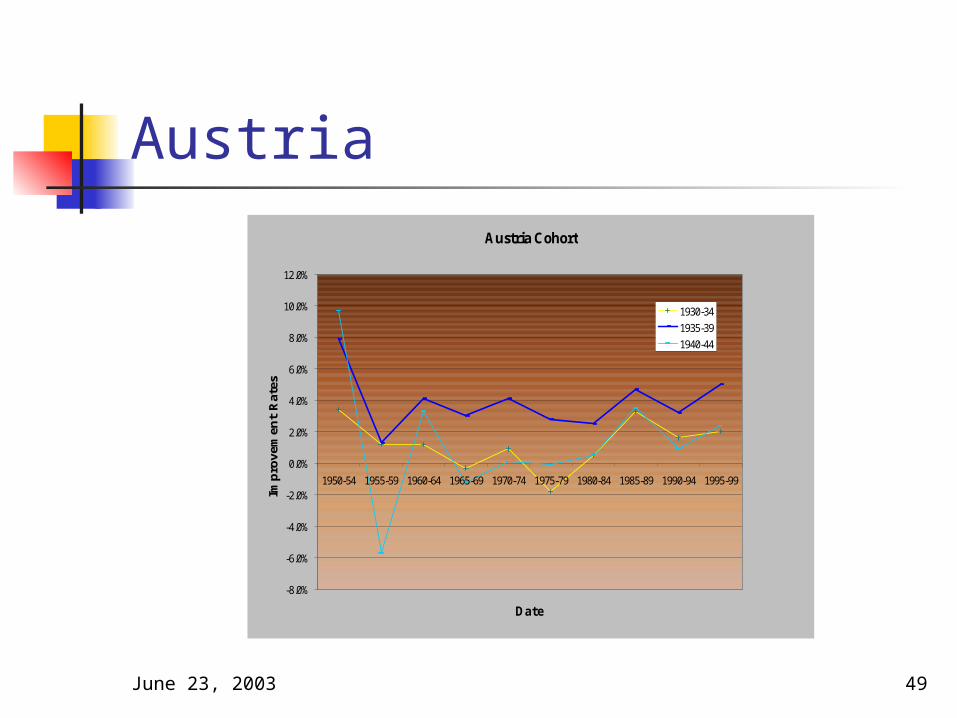
June 23, 2003 49
AustriaAustria Cohort
-8.0%
-6.0%
-4.0%
-2.0%
0.0%
2.0%
4.0%
6.0%
8.0%
10.0%
12.0%
1950-54 1955-59 1960-64 1965-69 1970-74 1975-79 1980-84 1985-89 1990-94 1995-99
Date
Impr
ovem
ent
Rat
es
1930-34
1935-39
1940-44
June 23, 2003 50
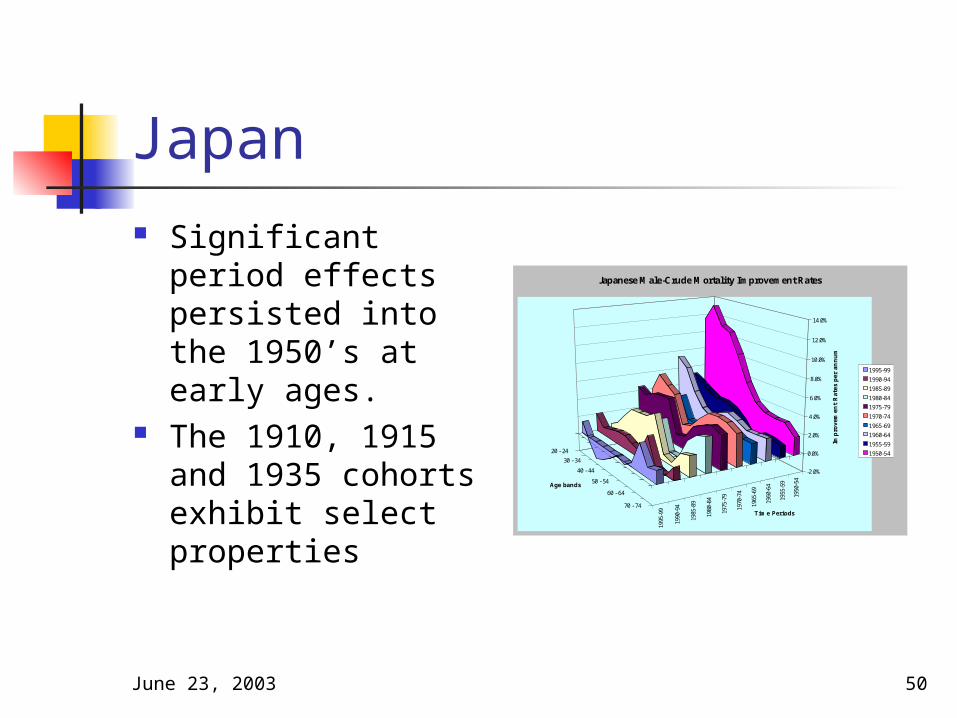
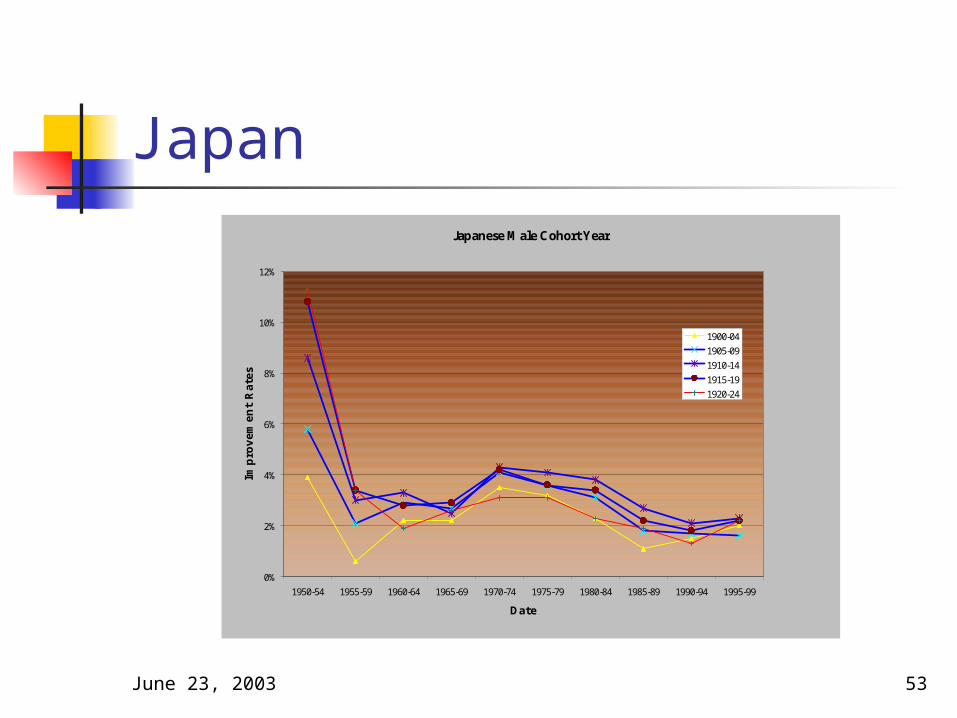
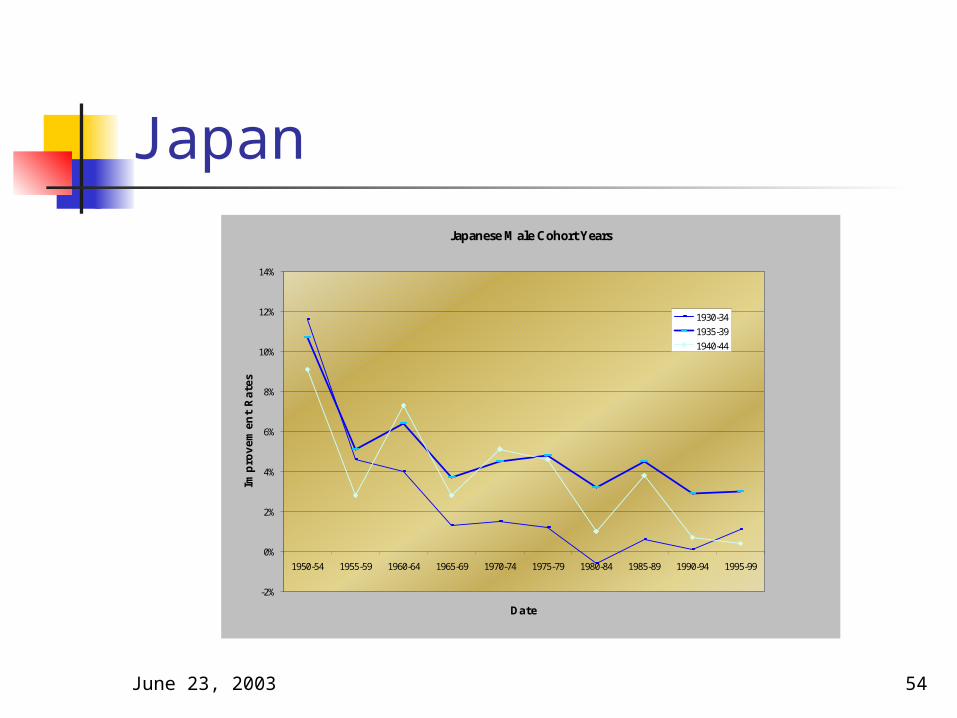
Japan Significant period
effects persisted into the 1950’s at early ages.
The 1910, 1915 and 1935 cohorts exhibit select properties
20 - 24
30 - 34
40 - 44
50 - 54
60 - 64
70 - 74
1995
-99
1990
-94
1985
-89
1980
-84
1975
-79
1970
-74
1965
-69
1960
-64
1955
-59
1950
-54
-2.0%
0.0%
2.0%
4.0%
6.0%
8.0%
10.0%
12.0%
14.0%
Impro
vem
ent
Rat
es p
er a
nnum
Age bands
Time Periods
Japanese Male-Crude Mortality Improvement Rates
1995-99
1990-94
1985-89
1980-84
1975-79
1970-74
1965-69
1960-64
1955-59
1950-54
June 23, 2003 51
JapanJapanese-Male
-4%
-2%
0%
2%
4%
6%
8%
10%
12%
14%
16%
1995-991990-941985-891980-841975-791970-741965-691960-641955-591950-54
Time Period
Impro
vem
ent
Rat
es
0 - 4 5 - 9 10 - 14 15 - 19 20 - 24 25 - 29 30 - 34
June 23, 2003 52
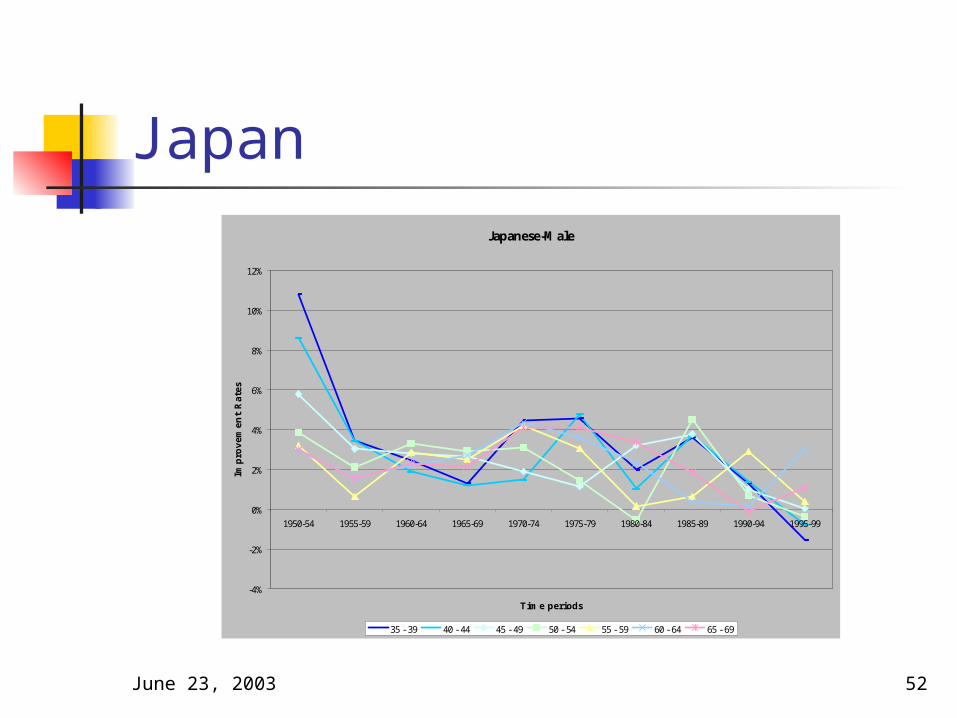
JapanJapanese-Male
-4%
-2%
0%
2%
4%
6%
8%
10%
12%
1995-991990-941985-891980-841975-791970-741965-691960-641955-591950-54
Time periods
Impro
vem
ent
Rat
es
35 - 39 40 - 44 45 - 49 50 - 54 55 - 59 60 - 64 65 - 69
June 23, 2003 53
JapanJapanese Male Cohort Year
0%
2%
4%
6%
8%
10%
12%
1950-54 1955-59 1960-64 1965-69 1970-74 1975-79 1980-84 1985-89 1990-94 1995-99
Date
Impro
vem
ent
Rat
es
1900-04
1905-09
1910-14
1915-19
1920-24
June 23, 2003 54
JapanJapanese Male Cohort Years
-2%
0%
2%
4%
6%
8%
10%
12%
14%
1950-54 1955-59 1960-64 1965-69 1970-74 1975-79 1980-84 1985-89 1990-94 1995-99
Date
Impro
vem
ent
Rat
es
1930-34
1935-39
1940-44

June 23, 2003 55
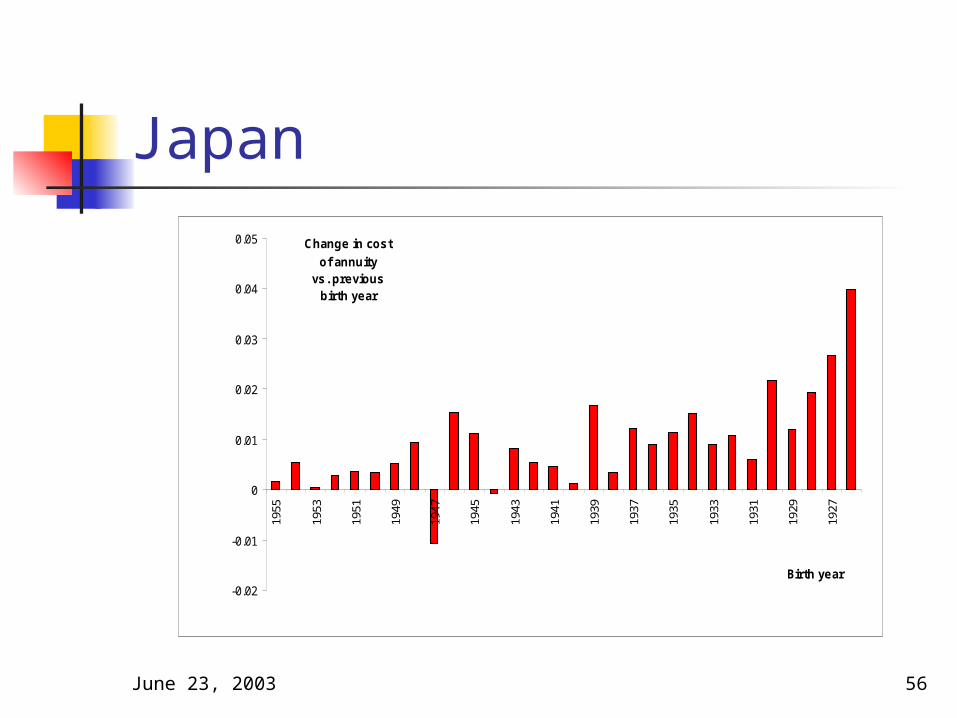
Japan The next figure
compares immediate annuity costs for different birth cohorts.
At each date the figure provides the cost for an immediate annuity that covers the individual for age 25 through 45.
12.6
12.65
12.7
12.75
12.8
12.85
12.9
12.95
13
13.05
13.1
1955 1953 1951 1949 1947 1945 1943 1941 1939 1937 1935 1933 1931 1929 1927 1925
Birth year
Cost of unit life annuity due payable for
ages 25-45
June 23, 2003 56
Japan
-0.02
-0.01
0
0.01
0.02
0.03
0.04
0.05
1955
1953
1951
1949
1947
1945
1943
1941
1939
1937
1935
1933
1931
1929
1927
Birth year
Change in cost of annuity
vs. previous birth year

June 23, 2003 57
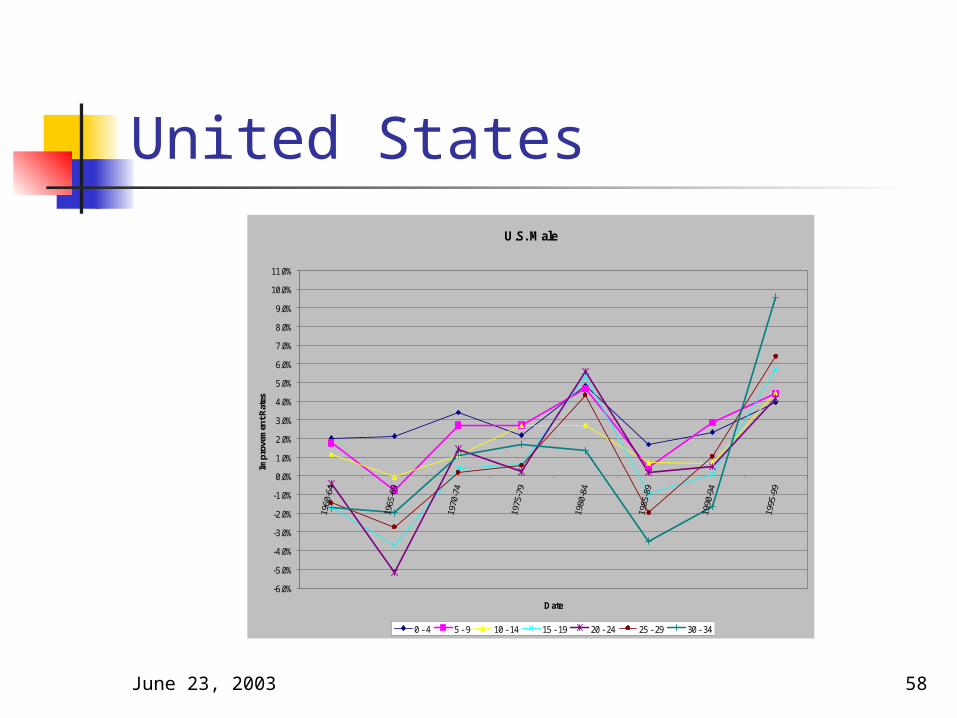
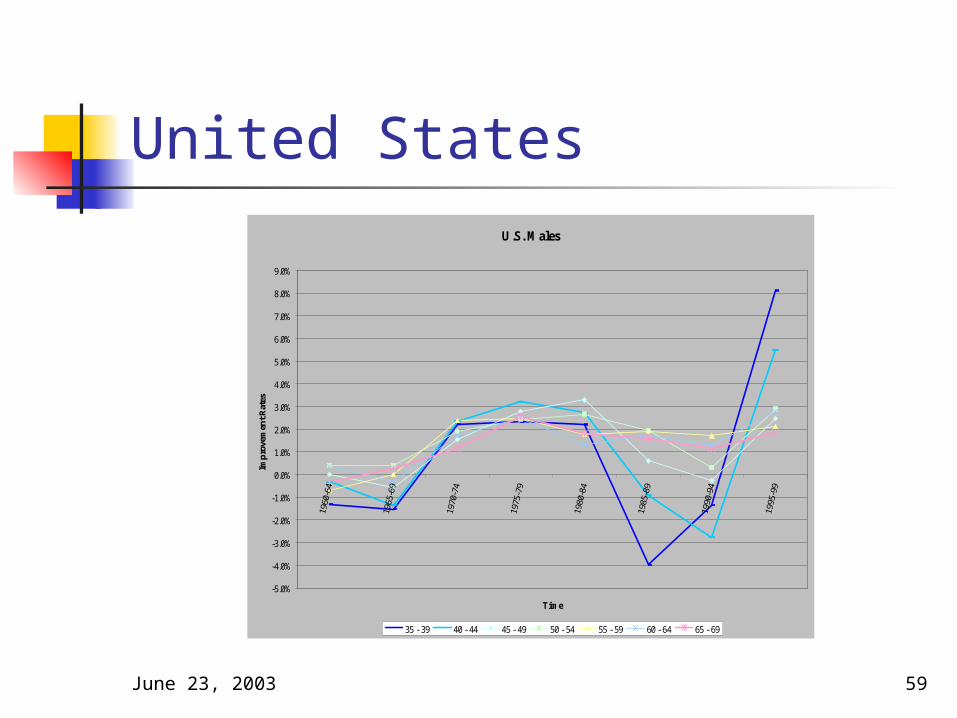
United States Significant period
effects occurred in the 1960’s and 1980’s.
The 1915, 1930 and 1935 cohorts exhibit select properties
1995
-99
1985
-89
1975
-79
1965
-69
-6.0%
-4.0%
-2.0%
0.0%
2.0%
4.0%
6.0%
8.0%
10.0%
Mor
tali
ty Im
prov
emen
ts p
er a
nnum
Age Bands
Time Periods
The U.S Males-Crude Mortality Improvement Rates
1995-99
1990-94
1985-89
1980-84
1975-79
1970-74
1965-69
1960-64
June 23, 2003 58
United StatesU.S. Male
-6.0%
-5.0%
-4.0%
-3.0%
-2.0%
-1.0%
0.0%
1.0%
2.0%
3.0%
4.0%
5.0%
6.0%
7.0%
8.0%
9.0%
10.0%
11.0%
Date
Impr
ovem
ent R
ates
0 - 4 5 - 9 10 - 14 15 - 19 20 - 24 25 - 29 30 - 34
June 23, 2003 59
United StatesU.S. Males
-5.0%
-4.0%
-3.0%
-2.0%
-1.0%
0.0%
1.0%
2.0%
3.0%
4.0%
5.0%
6.0%
7.0%
8.0%
9.0%
Time
Impr
ovem
ent R
ates
35 - 39 40 - 44 45 - 49 50 - 54 55 - 59 60 - 64 65 - 69
June 23, 2003 60
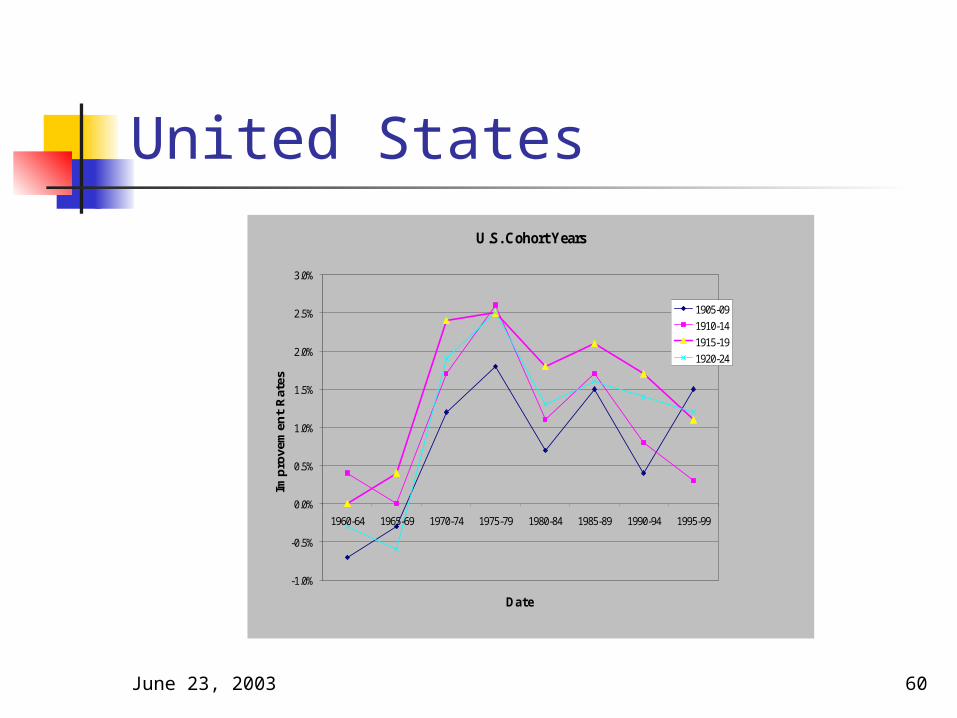
United StatesU.S. Cohort Years
-1.0%
-0.5%
0.0%
0.5%
1.0%
1.5%
2.0%
2.5%
3.0%
1960-64 1965-69 1970-74 1975-79 1980-84 1985-89 1990-94 1995-99
Date
Impr
ovem
ent
Rat
es
1905-09
1910-14
1915-19
1920-24
June 23, 2003 61
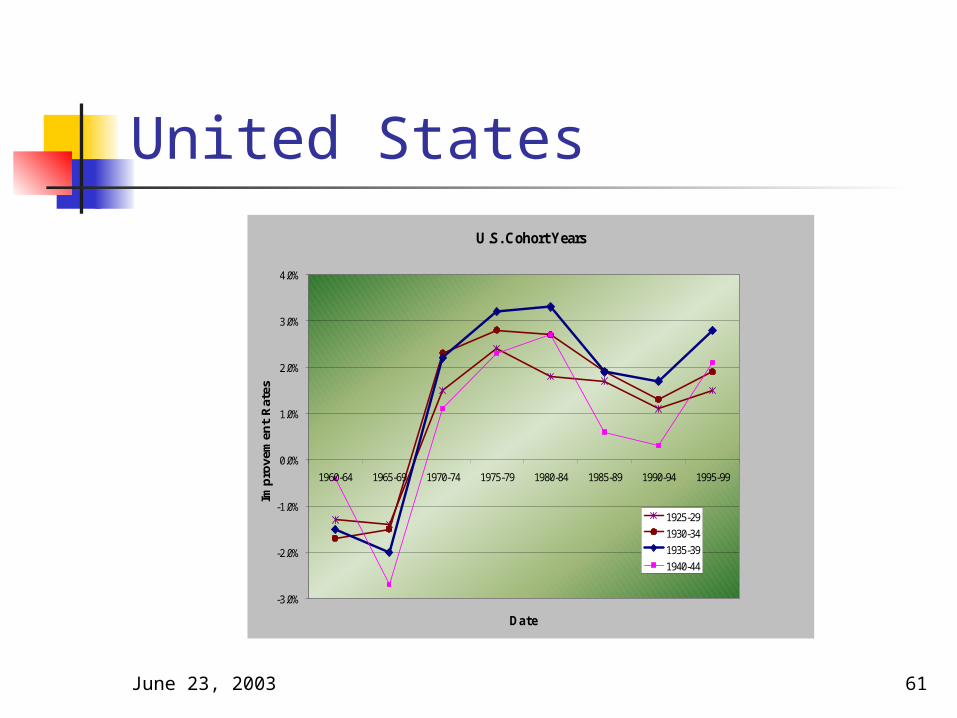
United StatesU.S. Cohort Years
-3.0%
-2.0%
-1.0%
0.0%
1.0%
2.0%
3.0%
4.0%
1960-64 1965-69 1970-74 1975-79 1980-84 1985-89 1990-94 1995-99
Date
Impr
ovem
ent
Rat
es
1925-29
1930-34
1935-39
1940-44
June 23, 2003 62
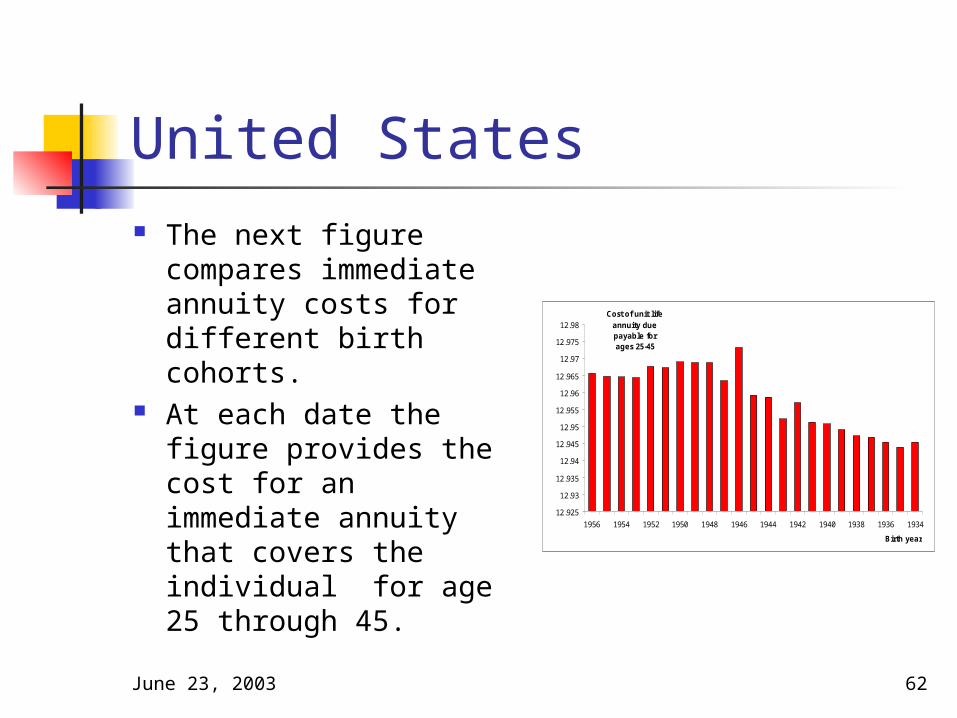
United States The next figure
compares immediate annuity costs for different birth cohorts.
At each date the figure provides the cost for an immediate annuity that covers the individual for age 25 through 45.
12.925
12.93
12.935
12.94
12.945
12.95
12.955
12.96
12.965
12.97
12.975
12.98
1956 1954 1952 1950 1948 1946 1944 1942 1940 1938 1936 1934
Birth year
Cost of unit life annuity due payable for ages 25-45
June 23, 2003 63
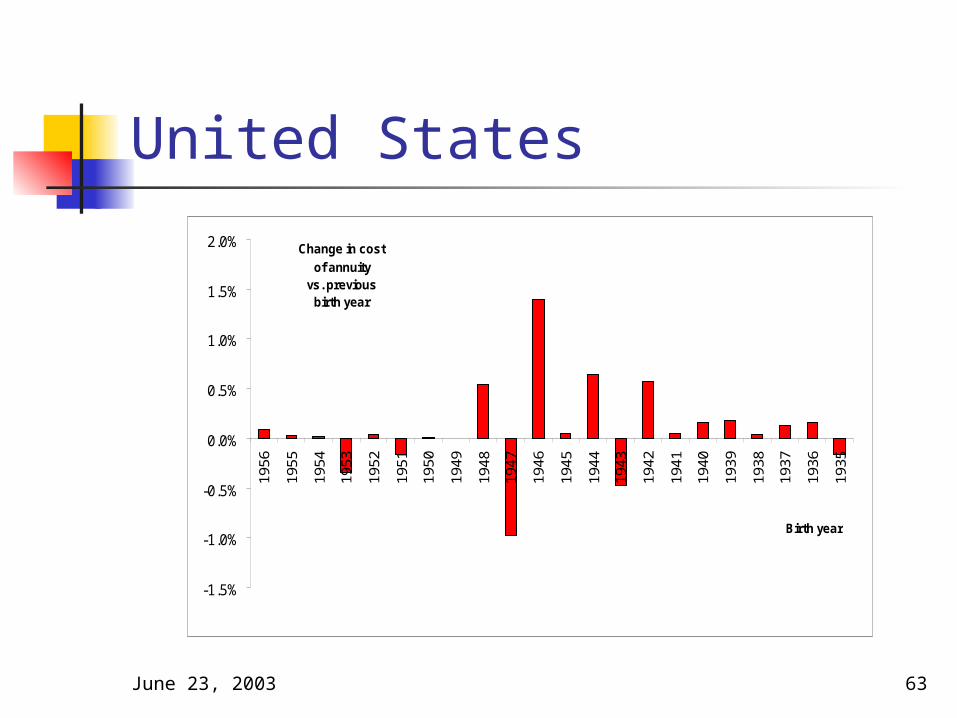
United States
-1.5%
-1.0%
-0.5%
0.0%
0.5%
1.0%
1.5%
2.0%19
56
1955
1954
1953
1952
1951
1950
1949
1948
1947
1946
1945
1944
1943
1942
1941
1940
1939
1938
1937
1936
1935
Birth year
Change in cost of annuity
vs. previous birth year
June 23, 2003 64
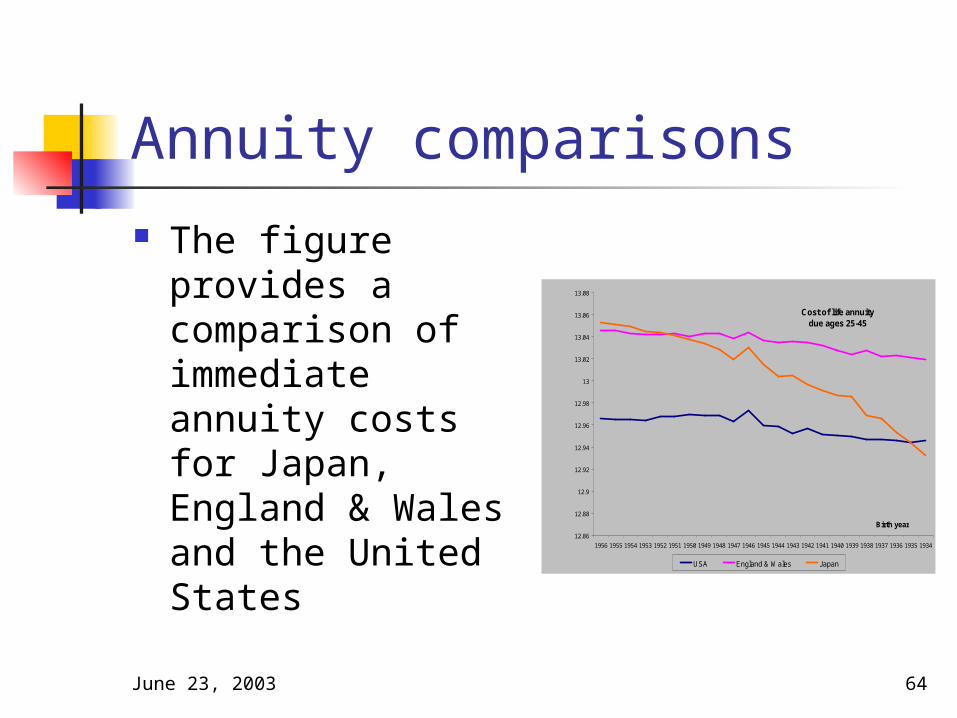
Annuity comparisons The figure
provides a comparison of immediate annuity costs for Japan, England & Wales and the United States
12.86
12.88
12.9
12.92
12.94
12.96
12.98
13
13.02
13.04
13.06
13.08
1956 1955 1954 1953 1952 1951 1950 1949 1948 1947 1946 1945 1944 1943 1942 1941 1940 1939 1938 1937 1936 1935 1934
Birth year
Cost of life annuity due ages 25-45
USA England & Wales J apan
June 23, 2003 65
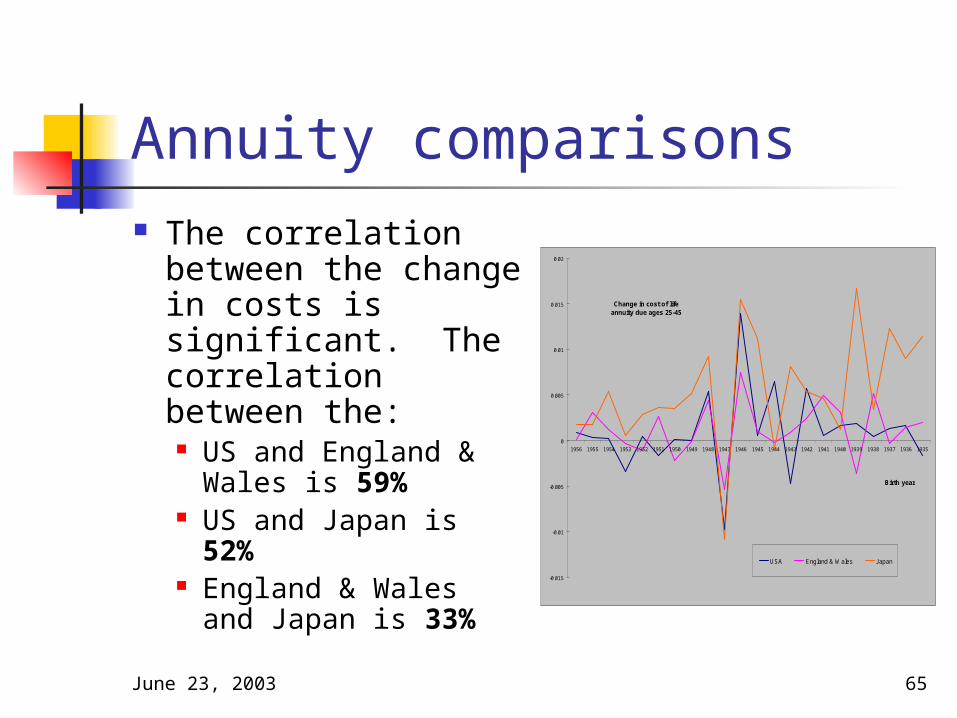
Annuity comparisons The correlation
between the change in costs is significant. The correlation between the: US and England &
Wales is 59% US and Japan is 52% England & Wales
and Japan is 33%-0.015
-0.01
-0.005
0
0.005
0.01
0.015
0.02
1956 1955 1954 1953 1952 1951 1950 1949 1948 1947 1946 1945 1944 1943 1942 1941 1940 1939 1938 1937 1936 1935
Birth year
Change in cost of life annuity due ages 25-45
USA England & Wales J apan
June 23, 2003 66
Close
The mortality experience in the countries investigated exhibit similar trends from both a period and a cohort perspective.
The similar mortality experience is confirmed by the sizable correlation between the changes in annuity costs.