international investment perspectives: freedom of ... · acquisitions in 2006 and 2007 have...
TRANSCRIPT

ISBN 978-92-64-03748-9
International Investment Perspectives:
Freedom of Invesment in a Changing World
2007 Edition
© OECD 2007
13
Chapter 2
Trends and recent developments in foreign direct investment*
* This article was prepared by Hans Christiansen (Senior Economist, InvestmentDivision, OECD Directorate for Financial and Enterprise Affairs), Andrea Goldstein(Senior Economist, OECD Development Centre) and Ayse Bertrand (Manager ofInternational Investment Statistics, OECD Directorate for Financial and EnterpriseAffairs). Thanks are due to Thomas Hatzichronolgou, Directorate for Science,Technology and Industry and Isabelle Laroche, Directorate for Financial andEnterprise Affairs for statistical and textual contributions.
The global environment for FDI continued to improve in 2006.Macroeconomic growth continued, stock prices remained firm andprofitability improved. In addition, new players made their presencemore strongly felt. Multinational enterprises based in developing oremerging economies became more active acquirers of enterprises inthe OECD area and new categories of financial investors, such asprivate equity companies, allocated large amounts of money tocorporate takeovers.Reflecting this, FDI flows to and from OECD countries increasedsignificantly in 2006, outflows by 29 per cent to USD 1 120 billionand inflows by 22 per cent to USD 910 billion. These are the second-highest levels in the history of OECD, exceeded only in the boom year2000. The numbers were lifted by a small number of very large cross-border mergers and acquisitions. The biggest five such transactionsvalued at close to USD 120 billion.There may be reasons to fear the potential impact on FDI of growingpublic concerns about the impact of globalisation. Business allegationsof cross-border investment being dissuaded by hostile attitudes in thehost country have also become more frequent. On balance, however, itappears that the negative political undercurrents have not yettranslated into a slowdown of direct investment flows.

2. TRENDS AND RECENT DEVELOPMENTS IN FOREIGN DIRECT INVESTMENT
INTERNATIONAL INVESTMENT PERSPECTIVES: 2007 EDITION – ISBN 978-92-64-03748-9 – © OECD 200714
Introduction
The international environment for foreign direct investment (FDI)
remains buoyant. The factors identified in previous issues of this publication
are still at play: robust macroeconomic growth in most major economies;
strong corporate profitability; generally low interest rates; high stock prices
notwithstanding some recent corrections; and high real estate prices. This
amounts to an international corporate environment offering profit
opportunities as well as relatively ample liquidity. Enterprises have responded
by stepping up their international investment activity and, in particular,
corporate takeovers.
One factor that may have changed the balance between cross-border
corporate investors is the low value of the US dollar. In the world as a whole
this strengthens the hand of would-be investors based in other currencies and
puts dollar-based investors at a comparative disadvantage. Insofar as the
present exchange rates are perceived as transitory, it also encourages an active
investment strategy by foreign companies into the United States and other
dollar-based economies.
A factor further underpinning global direct investment flows is the
emergence of a number of companies based in developing and emerging
economies as active outward investors. Until relatively recently the most
visible consequence of this was “south-south” investment within regions of
the developing world, but multinational enterprises based in emerging
economies (Brazil and India are cases in point) have also been behind some of
the most highly profiled cross-border corporate acquisitions within the OECD
area in the last couple of years. In a parallel development other countries such
as China have pursued “go global” strategies, encouraging national enterprises
to expand abroad partly in response to broader economic and strategic
considerations.
Another recent development is the increasingly active global investment
strategies of a new class of investors such as hedge funds and private equity
capital companies. Some of the most widely publicised mergers and
acquisitions in 2006 and 2007 have reflected these companies’ global search
for investment opportunities.
Reflecting the changing international environment, policy makers in a
number of OECD countries have had to take into account a growing public

2. TRENDS AND RECENT DEVELOPMENTS IN FOREIGN DIRECT INVESTMENT
INTERNATIONAL INVESTMENT PERSPECTIVES: 2007 EDITION – ISBN 978-92-64-03748-9 – © OECD 2007 15
uneasiness about the consequences of globalisation. The takeover of prized
national enterprises is controversial in most countries. It frequently leads to
allegations that the foreign investors plan to transfer jobs or know-how out of
the host economy, operate on lower standards of corporate behaviour than is
common in the host country or pursue aggressive corporate strategies at the
cost of social cohesion. In addition, the heightened international awareness of
a need to safeguard national security has contributed to concerns about
takeovers of national enterprises that may, however remotely, be related to
broader strategic concerns. As demonstrated in later articles in this
publication some countries have already tightened their practices toward
inward FDI on grounds of national security and others are considering
following suit.
Perhaps ironically, as globalisation fears have led to concerns about
inward direct investment in some quarters they have equally triggered
concerns about excessive outward investment. Public debate in recent years
has focused on “outsourcing” of productive activities to low-wage countries as
a cause of job losses. On the balance of the evidence it is not clear that these
concerns are well founded. The home countries of outward investors generally
benefit from the investments – as discussed in a later article in this
publication. However, the benefits often occur in tandem with a process of
domestic restructuring, the adjustment costs of which may have to be
mitigated through appropriate policy measures.
On balance, the negative political undercurrents have not yet translated
into a slowdown of direct investment flows. On the contrary, as will be
demonstrated in the following sections, FDI is booming.
1. Foreign direct investment in OECD countries continued to grow in 2006
FDI flows to and from OECD countries increased significantly in 2006,
outflows by 29 per cent to 1 120 billion US dollars (USD) and inflows by 22 per
cent to USD 910 billion (Table 2.1). These are the second-highest levels in the
history of OECD, exceeded only in the boom year 2000.
The growth in outward FDI in 2006 was boosted by a return-to-normal of
the US figures which increased almost USD 240 billion after having dropped to
an exceptionally low level in 2005. Conversely, the increase in totals was held
back by the Netherlands outflows which dropped by USD 120 billion after a
one-off effect the previous year. A further factor complicating the comparison
between 2005 and 2006 is the fact that corporate restructuring in Australia in
2005 appeared in the overall investment statistics as sharp disinvestment in
both inward and outward direction.

2.TR
END
S AN
D R
ECEN
T D
EVELO
PMEN
TS
IN FO
REIG
N D
IREC
T IN
VES
TM
ENT
INT
ERN
AT
ION
AL IN
VES
TM
EN
T PER
SPEC
TIV
ES: 2007 EDIT
ION
– ISB
N 978-92-64-03748-9 – ©
OEC
D 2007
16 Table 2.1. Direct investment flows to and from OECD countries: 2001-2006(USD billion)
Notes: data are converted to US dollars using average exchange rates; p: preliminary; e: estimates.
Source: OECD International Direct Investment database.
Outflows Inflows
2001 2002 2003 2004 2005p 2006e 2001 2002 2003 2004 2005 p 2006e
Australia 12.0 7.9 16.2 10.8 –34.3 21.0 8.3 17.0 8.0 36.0 -35.0 24.5
Austria 3.1 5.8 7.1 8.3 10.0 4.1 5.9 0.4 7.2 3.9 9.0 0.2
Belgium/Luxembourg 100.6 .. .. .. .. .. 84.7 .. .. .. .. ..
Belgium .. 12.7 36.9 34.0 31.8 62.6 .. 15.6 32.1 43.6 33.9 71.5
Canada 36.0 26.8 21.5 43.2 34.1 42.1 27.7 22.1 7.6 1.5 33.8 66.6
Czech Republic 0.2 0.2 0.2 1.0 0.0 1.3 5.6 8.5 2.1 5.0 11.7 6.0
Denmark 13.4 5.7 1.1 –10.4 15.0 8.2 11.5 6.6 2.6 –10.7 13.1 7.0
Finland 8.4 7.4 –2.3 –1.1 4.5 .. 3.7 8.1 3.3 3.0 4.5 3.7
France 86.8 50.5 53.2 56.8 120.9 115.1 50.5 49.1 42.5 32.6 81.0 81.1
Germany 39.7 19.0 5.8 14.8 55.5 79.5 26.4 53.6 32.4 –9.2 35.8 42.9
Greece 0.6 0.7 0.4 1.0 1.5 4.2 1.6 0.1 1.3 2.1 0.6 5.4
Hungary 0.4 0.3 1.6 1.1 2.3 3.0 3.9 3.0 2.1 4.5 7.6 6.1
Iceland 0.3 0.3 0.4 2.6 7.1 4.2 0.2 0.1 0.3 0.7 3.1 3.2
Ireland 4.1 11.0 5.6 18.1 13.6 22.1 9.7 29.4 22.8 –10.6 –31.1 12.8
Italy 21.5 17.1 9.1 19.3 41.8 42.1 14.9 14.6 16.4 16.8 20.0 16.6
Japan 38.3 32.3 28.8 31.0 45.8 50.2 6.2 9.2 6.3 7.8 2.8 –6.5
Korea 2.4 2.6 3.4 4.7 4.3 7.1 3.5 2.4 3.5 9.2 6.3 3.6
Luxembourg .. 125.9 99.9 84.1 124.0 81.6 .. 115.3 89.3 79.1 116.3 97.0
Mexico 4.4 0.9 1.3 4.4 6.5 5.8 27.2 18.3 14.2 22.3 19.6 19.0
Netherlands 50.6 32.0 44.1 26.6 142.8 22.7 51.9 25.1 21.1 2.1 41.4 4.4
New Zealand 0.4 –1.1 0.2 1.1 –0.3 –1.6 4.6 –1.3 2.0 2.9 3.1 1.6
Norway 0.5 4.6 2.7 3.5 21.1 12.2 2.2 0.7 3.7 2.5 6.4 1.6

2.TR
END
S AN
D R
ECEN
T D
EVELO
PMEN
TS IN
FOR
EIGN
DIR
ECT
INV
ESTM
ENT
INT
ERN
AT
ION
AL IN
VES
TM
EN
T PER
SPEC
TIV
ES: 2007 ED
ITIO
N – IS
BN
978-92-64-03748-9 – © O
ECD
200717
Table 2.1. Direct investment flows to and from OECD countries: 2001-2006 (cont.)(USD billion)
Notes: data are converted to US dollars using average exchange rates; p: preliminary; e: estimates.
Source: OECD International Direct Investment database.
Outflows Inflows
2001 2002 2003 2004 2005p 2006e 2001 2002 2003 2004 2005 p 2006e
Poland -0.1 0.2 0.3 0.8 3.1 4.1 5.7 4.1 4.9 12.5 9.5 13.9
Portugal 6.3 -0.1 8.0 7.8 2.1 3.5 6.2 1.8 8.6 2.3 4.0 7.4
Slovak Republic 0.1 .. .. 0.2 0.1 0.4 1.6 4.1 0.6 1.1 1.9 4.2
Spain 33.1 32.7 28.7 60.6 41.8 89.7 28.3 39.2 25.8 24.8 25.0 20.0
Sweden 7.3 10.6 21.1 20.8 26.5 24.1 10.9 12.2 5.0 11.7 10.2 27.8
Switzerland 18.3 8.2 15.4 26.3 54.2 81.5 8.9 6.3 16.5 1.4 –1.3 25.1
Turkey 0.5 0.2 0.5 0.9 1.1 0.9 3.4 1.1 1.8 2.9 9.8 20.2
United Kingdom 58.9 50.3 62.4 91.1 83.7 79.5 52.7 24.1 16.8 56.0 193.7 139.6
United States 142.3 154.5 149.9 244.1 9.1 248.9 167.0 84.4 64.0 133.2 109.8 183.6
Total OECD FDI flows 690.5 619.2 623.7 807.4 869.4 1120.1 635.0 575.0 464.9 490.9 746.6 910.2

2. TRENDS AND RECENT DEVELOPMENTS IN FOREIGN DIRECT INVESTMENT
INTERNATIONAL INVESTMENT PERSPECTIVES: 2007 EDITION – ISBN 978-92-64-03748-9 – © OECD 200718
The pickup in inward direct investment in 2006 is largely due to briskgrowth in the inward FDI of Canada and the United States as well as a reversal
of previous declines in the inflows of Australia, Ireland and Switzerland. The
increase was tempered by UK investments, which dropped sharply from an
extraordinarily high level in 2005 due to internal restructurings in the Shell/
Royal Dutch conglomerate.
The OECD area as a whole has further bolstered its traditional role as net
direct investor toward the rest of the world. Net outflows rose by 70 per cent
from the year before to reach USD 210 billion in 2006 – the second-highest levelever, only exceeded in the record year 2004 (Figure 2.1).
1.1. Remarkable trends in selected countries
The United States continues to occupy a dominant position as foreign
investor and as recipient of direct investment (after a one-off drop in outflows
in 2005 due to changes in the corporate tax code). The United States’ outflows
in 2006 were USD 249 billion – more than twice the next country (France) in theleague table. Of this amount almost half was reinvested earnings – particularly
striking in comparison with 2005 which saw massive withdrawals of funds.
Despite the global upsurge in merger and acquisition (M&A) activity in 2006,
multinational enterprises based in the United States were not particularly
active in acquiring new corporate assets abroad. Equity capital investmentremained almost unchanged close to USD 40 billion, which is thought to reflect
a cautious approach by companies in the face of the weakness of the US dollar.
Figure 2.1. FDI flows to and from OECD
Source: OECD International Direct Investment database.
USD billion
–200
0
200
400
600
800
1 000
1 200
1 400
Total OECD FDI outflows Total OECD FDI inflows Total net OECD outflows
1990
1991
1992
1993
1994
1995
1996
1997
1998
1999
2000
2001
2002
2003
2004
2005
p20
06e

2. TRENDS AND RECENT DEVELOPMENTS IN FOREIGN DIRECT INVESTMENT
INTERNATIONAL INVESTMENT PERSPECTIVES: 2007 EDITION – ISBN 978-92-64-03748-9 – © OECD 2007 19
US inflows in 2006 were USD 184 billion, returning the country to the top
of the league table after being briefly eclipsed by the United Kingdom in 2005.
According to additional information released by the Bureau of Economic
Analysis the amount is almost identical to the “outlays” by foreign enterprises
to acquire or establish US businesses. The vast majority of this money went
into takeovers of existing businesses, while greenfield investment accounted
for a comparably limited USD 14 billion. Around two thirds of the investment
originated with European companies, with UK, French and German investors
accounting for broadly equal shares.
FDI into the United Kingdom dropped by 28 per cent in 2006, but the
country nevertheless was the world’s second-largest recipient of direct
investment with inflows totalling USD 140 billion. The United Kingdom is one
of the OECD countries whose inflows were to the largest extent influenced by
cross-border mergers and acquisitions. The five largest foreign acquisitions
alone of UK companies in 2006 were estimated to be worth around
USD 60 billion (see further Section 1.3).
The outward direct investments of UK companies dropped by around
5 per cent to USD 80 billion, placing the United Kingdom behind not only the
United States but also Spain, Luxembourg and Switzerland. The figures for
some of these countries are influenced by pass-through via financial
holding companies and special-purpose entities which complicates a direct
comparison, but the same may apply to UK data for instance due to
financial flows through the City of London. However, the United Kingdom’s
drop in the league table also reflects some substantial developments. For
example, a certain disinvestment by UK companies from corporate assets
previously required was registered in 2006, and while UK companies were
active acquirers of foreign companies in 2006 the deal sizes were mostly
limited.
The large outward direct investments of France in 2006, following even
higher outflows the year before, to some extent reflect a high level of activity
in foreign acquisitions. Of the estimated USD 115 billion outflows, about one
third are accounted for by the five largest foreign M&As by French companies,
including notably Alcatel’s acquisition of US-based Lucent and AXA’s takeover
of the Swiss insurer Wintherthur.
The fact that inward investment flows to France remained unchanged in
2006 at USD 81 billion is not easily attributable to any one factor. In the
absence of large cross-border takeovers into France (with the partial exception
of foreign investment in a privatised toll roads operator) a main factor appears
to have been inter-company loans and extensions of capital by foreign
multinational companies to the subsidiaries they already had in France.
Greenfield investment in small and medium-sized enterprises and stand-

2. TRENDS AND RECENT DEVELOPMENTS IN FOREIGN DIRECT INVESTMENT
INTERNATIONAL INVESTMENT PERSPECTIVES: 2007 EDITION – ISBN 978-92-64-03748-9 – © OECD 200720
alone production plants continue to be of macroeconomic importance butgenerally have not involved amounts that make them visible in the total
figures.
Outward direct investment from Germany, at USD 80 billion in 2006, rose
to its highest level since the 1990s. The partly reflects a handful of large
corporate acquisitions in the United States and United Kingdom, but alsohistorically large reinvested earnings. Inward FDI in 2006 was USD 43 billion,
Box 2.1. Foreign direct investment statistics: main concepts
Direct investment is a category of cross-border investment made by a
resident entity in one economy (the “direct investor”) with the objective of
establishing a “lasting interest” in an enterprise resident in an economy other
than that of the investor (the “direct investment enterprise”).
The lasting interest is evidenced when the direct investor owns 10 per cent
of the voting power of the direct investment enterprise.
A foreign direct investor is an entity that has a direct investment enterprise
operating in a country other than the economy of residence of the foreign
direct investor. A direct investor could be: an individual (or a group of related
individuals; an incorporated or unincorporated enterprise; public or private
enterprise (or a group of related enterprises); a government; estates, or trusts
or other organisations that own enterprises.
A direct investment enterprise is as an incorporated or unincorporated
enterprise (including a branch) in which a non-resident investor owns 10 per
cent or more of the voting power of an incorporated enterprise or the
equivalent of an unincorporated enterprise.
Direct investment is composed of: equity capital, reinvested earning and
other capital.
Equity capital comprises: (i) equity in branches; (ii) all shares in subsidiaries and
associates (except non-participating, preferred shares that are treated as debt
securities and included under direct investment, other capital); and (iii) other
capital contributions.
Reinvested earnings of a direct investment enterprise reflect earnings on
equity accruing to direct investors less distributed earnings; they are income
to the direct investor. However, reinvested earnings are not actually
distributed to the direct investor but rather increase direct investor’s
investment in its affiliate.
Other capital (or inter-company debt transactions) is defined as borrowing
and lending of funds between direct investors and subsidiaries, associates
and branches.

2. TRENDS AND RECENT DEVELOPMENTS IN FOREIGN DIRECT INVESTMENT
INTERNATIONAL INVESTMENT PERSPECTIVES: 2007 EDITION – ISBN 978-92-64-03748-9 – © OECD 2007 21
up 20 per cent from the year before. Following a few years of low direct
investment inflows the German economy has consequently regained its
position among the major FDI destinations in the OECD, although in this
respect it continues to lag behind comparable European economies like the
United Kingdom and France.
Canada’s direct investment inflows reached USD 67 billion in 2006 – twice
the amount of transactions of the preceding year and at par with the previous
record during the investment boom in 2000. Two major takeovers in the
mining sector account for more than half of the total amount. Among the
more “normally sized” transactions, as in previous years, a large number of
companies from the United States invested in Canada. So did investors based
in the United Kingdom and continental European countries, apparently
attracted by the weakness of the Canadian dollar vis-à-vis sterling and euro.
Canadian investment abroad also increased in 2006 – by more than 20 per cent
to reach USD 42 billion. While corporate Canada was relatively active in
undertaking takeovers abroad, a significant part of this amount seems to
reflect capital transactions with existing subsidiaries in the United States.
In 2006, outward direct investment from Japan – traditionally a major net
capital exporter – rose to its highest level since 1990. At USD 50 billion the
total outflows were 10 per cent above the already high levels recorded the
year before. The United States and China remain important recipients of
Japanese FDI, but the increase between 2005 and 2006 was largely due to
higher investment in the Netherlands and United Kingdom. Inward FDI, at
USD –6.5 billion, became negative in 2006 indicating a divestment by foreign
companies from Japan. This figure is understood to be the result of
contrasting underlying trends. In a couple of sectors (automobiles and
chemicals) foreign companies significantly increased their participation.
However, this is overshadowed in the total figures by the withdrawal by, in
particular, one European (in telecommunications) and one North American
company that had previously committed large amounts of capital to the
Japanese economy.
The outward FDI of Switzerland increased from an already high
USD 54 billion in 2005 to USD 82 billion in 2006 – the highest level on record. A
significant share of this amount reflects capital increases in foreign
subsidiaries, especially by financial institutions domiciled in Switzerland.
However, new acquisitions abroad were also part of the story, notably by
finance and holding companies, banks, chemical industries and some other
manufacturing industries. Direct investment inflows reached USD 25 billion in
2006 bringing to an end a two-year period of considerable divestment and
repatriation of funds from Switzerland. By far the largest individual
transaction was the acquisition of an insurance company already mentioned.

2. TRENDS AND RECENT DEVELOPMENTS IN FOREIGN DIRECT INVESTMENT
INTERNATIONAL INVESTMENT PERSPECTIVES: 2007 EDITION – ISBN 978-92-64-03748-9 – © OECD 200722
Among the other OECD countries listed in Table 1 the following
developments in 2006 bear mentioning:
● Sweden saw its FDI inflows more than double to USD 28 billion. The increase
largely reflects corporate takeovers, with a small number of investments by
UK-based investors accounting for almost half of the total amount.
● Inward FDI in Turkey at USD 20 billion recent its highest level in history. Most
of the increase, from already high levels in 2005, is due to a few largetakeovers in the financial and telecommunications sectors.
● Greece also hit a new record in investment inflows, largely due to a couple ofmajor takeovers in the financial sector.
● Other countries recording record-breaking inward FDI in 2006 include Poland
and the Slovak Republic. In the case of Slovakia the figures were lifted by a
large takeover in the energy sector by an Italian company, but in itself thiscan explain only a fourth of total flows. The Polish figures include
historically very large reinvested earnings.
1.2. The longer perspective
Over the last decade the role of OECD countries as the world’s foremost
provider of direct investment funds has been firmly established. Net outflowsfrom OECD countries reached USD 1 242 billion over the last decade (1997 to
2006 – see Table 2.2). France, Japan, the United Kingdom, Switzerland, theNetherlands and Spain have been the main net exporters among OECD
countries during this period.
A number of macroeconomic and structural factors determine a
countries’ importance as a net contributor of capital to the rest of the world.Large current account surpluses are one such factor, inducing nations to
reinvest their collective gains abroad – though not necessarily in the form of
FDI or other types of corporate investment. This would appear to have been animportant factor in the case of Japan and Switzerland.
Some countries’ main corporate actors have also pursued deliberatelyactive policies of international diversification, sometimes with the
encouragement of governments. This would appear to have been the case inthe utilities sector in some OECD countries, and outside the OECD area state-
encouraged outward investment strategies have become commonplaceparticularly in eastern Asia.
Countries with traditionally close relations with certain regions of theworld, including the former colonial powers, maintain business links with
these regions that often affect their FDI flows. This has at times been visible in
the outward investment patterns of Spain, France and the United Kingdomtoward Latin America and Africa. Preferred locations for incorporation of large

2. TRENDS AND RECENT DEVELOPMENTS IN FOREIGN DIRECT INVESTMENT
INTERNATIONAL INVESTMENT PERSPECTIVES: 2007 EDITION – ISBN 978-92-64-03748-9 – © OECD 2007 23
enterprises such as the Netherlands are also likely to serve to some extent as
a conduit for direct investment toward the rest of the world.
The main net recipients of FDI in the OECD area over the last decade havebeen Mexico, Poland, the United States, the Czech Republic, Australia, Turkey
and Korea. The United States and Australia stand out in this group, whichconsists mainly of countries with below-average incomes, and with a recenthistory of rapid economic development, market opening and privatisation. TheUnited States’ prominence as a destination for FDI may be partly linked with
Table 2.2. Cumulative FDI flows in OECD countries 1997-2006(USD billion)
* Mexico = 2001-2006 for outflows and net outflows.** OECD net outflows may not add up to total.
Source: OECD International Direct Investment database.
Inflows Outflows Net outflows
United States 1 637.2 United States 1 580.4 France 391.0
Belgium/Luxembourg 1 188.7 Belgium/Luxembourg 1 181.7 Japan 277.5
United Kingdom 797.2 United Kingdom 1 045.3 United Kingdom 248.2
France 480.8 France 871.8 Switzerland 215.0
Germany 473.2 Netherlands 513.1 Netherlands 214.0
Netherlands 299.1 Germany 510.2 Spain 181.0
Canada 285.3 Spain 420.8 Italy 69.4
Spain 239.8 Japan 330.9 Canada 37.9
Sweden 192.9 Canada 323.1 Germany 37.0
Mexico 178.4 Switzerland 318.5 Norway 27.5
Italy 128.8 Sweden 210.4 Sweden 17.5
Switzerland 103.4 Italy 198.2 Finland 17.4
Australia 89.7 Ireland 90.1 Iceland 7.4
Ireland 88.5 Denmark 81.3 Austria 6.7
Denmark 86.7 Finland 71.5 Ireland 1.6
Poland 78.6 Norway 67.0 Portugal 1.6
Korea 55.5 Austria 52.3 Greece -3.1
Czech Republic 55.2 Australia 46.0 Denmark -5.4
Finland 54.0 Portugal 45.0 Belgium/Luxembourg -7.0
Japan 53.4 Korea 42.9 Korea -12.6
Austria 45.6 Mexico* 23.2 Slovak Republic -16.7
Portugal 43.5 Iceland 15.5 New Zealand -19.9
Turkey 42.6 Greece 10.7 Hungary -30.5
Hungary 40.9 Hungary 10.4 Turkey -36.4
Norway 39.4 Poland 8.8 Australia -43.7
New Zealand 19.0 Turkey 6.2 Czech Republic -51.9
Slovak Republic 17.3 Czech Republic 3.2 United States -56.9
Greece 13.8 Slovak Republic 0.6 Poland -69.7
Iceland 8.1 New Zealand -0.9 Mexico* -97.4
Total OECD 6 836.3 Total OECD FDI outflows 8 078.1 TOTAL OECD** 1 241.8

2. TRENDS AND RECENT DEVELOPMENTS IN FOREIGN DIRECT INVESTMENT
INTERNATIONAL INVESTMENT PERSPECTIVES: 2007 EDITION – ISBN 978-92-64-03748-9 – © OECD 200724
the country’s traditionally large current account deficits, but it also reflects the
country’s persistently high levels of economic growth and traditional
openness to foreign acquisitions.
The gross inflows and outflows, on the other hand, mostly reflect the
economic weight of countries. The United States has been by far the largest
recipient and outward investor over the last decade, followed near the top of
the league table by countries like the United Kingdom, France, Germany, the
Netherlands and Canada. What may perhaps surprise is the fact that Belgium
and Luxembourg come out near the top. Without neglecting the fact that both
countries are, relatively to their size, attracting large investment in their own
right, the fact that they eclipse most G7 countries in Table 2.2 reflects their
popularity as a location for corporate holding companies and other special-
purpose entities.
Some large economies score less highly than might have been expected.
Japan, for example, has attracted only USD 53 billion of cumulative direct
investment over the last 10 years, bringing it at par with the smaller West
European countries. To some extent this reflects the remoteness of Japan from
most other highly developed countries (Japanese outflows, while higher, are
also below what could be expected from so large an economy). Moreover, as
Japan is hardly a low-cost production location most inward FDI would
normally be market seeking investment aimed at serving a Japanese client
base. However, while investment regulation in Japan is actually quite
permissive by international standards, foreign companies have nevertheless
found it notoriously difficult to “break in” to the Japanese market.
By European standards Italy has attracted comparatively little FDI over
the last decade. The USD 129 billion in cumulative inflows that the country
received is between one third and one fifth of the amounts attracted by the
other three large European economies. While this may reflect a number of
factors, including the geographic isolation of large parts of Italy relative to the
main economic poles of Europe, it seems somewhat related to the difficulty in
undertaking cross-border takeovers into the Italian economy. Many of the
largest companies are closely held or have corporate governance
arrangements that militate against unsolicited bids, and according to press
reports would-be investment has in the past given rise to controversy at the
political level.
1.3. Further information from M&A data: looking ahead
While mergers and acquisitions are only one element in total FDI flows,
in many OECD countries they account for more than half of total direct
investment. This is especially the case in times of strong investment activity,
as they tend to be the component of FDI that responds most strongly, or most

2. TRENDS AND RECENT DEVELOPMENTS IN FOREIGN DIRECT INVESTMENT
INTERNATIONAL INVESTMENT PERSPECTIVES: 2007 EDITION – ISBN 978-92-64-03748-9 – © OECD 2007 25
immediately to changes in the business climate, financial conditions or
macroeconomic performance.
Overall data for cross-border M&As in 2006 and early 2007 may henceprovide additional guidance on where FDI is heading. Some caution is,however, called for: privately collected M&A data tend to be more inclusive
than official FDI statistics. FDI data include only the value of corporate assetsactually transferred, whereas published M&A data take as their starting pointthe market value of the enterprises acquired. Moreover, in overall FDI figuresdivestment is subtracted from the totals, whereas the M&A data used in thisarticle concerns gross cross-border flows.
As would be expected given their volatile nature M&A flows haverecovered more briskly since the lows of 2002 and 2003 than total directinvestment. Since 2003 the value of both inward and outward M&As in OECDcountries has almost tripled. Cross-border M&A with the acquirer located inthe OECD area were valued at USD 848 billion in 2006 (Table 2.3). The “inward
M&As” (the target located in an OECD country) were a bit lower at USD 818billion. Both figures represent an increase of more than 25 per cent over theyear before.
A second interesting finding from Table 2.3 is the fact that the average
deal size is growing strongly. To some extent this is a consequence of the weakUS dollar appearing to inflate the value of corporate takeovers in other
Table 2.3. Total number of cross-border M&As into and out of OECD countries
Source: Dealogic.
Outward Inward
DateAmount
(USD mill.)Number
Average deal size
Amount (USD mill.)
NumberAverage deal size
1995 134 602 2 258 59.6 146 603 2 132 68.8
1996 171 528 2 692 63.7 175 598 2 498 70.3
1997 285 189 3 427 83.2 254 315 3 088 82.4
1998 526 089 5 173 101.7 486 157 4 451 109.2
1999 801 080 6 560 122.1 775 757 5 697 136.2
2000 1 166 386 7 799 149.6 1 136 093 7 082 160.4
2001 605 716 6 464 93.7 584 784 6 198 94.4
2002 376 217 5 169 72.8 409 844 5 050 81.2
2003 321 960 4 383 73.5 338 164 4 131 81.9
2004 422 761 5 061 83.5 443 800 4 661 95.2
2005 673 647 6 490 103.8 635 262 5 361 118.5
2006 847 999 6 655 127.4 818 480 5 244 156.1
Jan-May 2007 428 517 2 457 174.4 430 474 2 006 214.6
Estimate 2007 1 028 440 5 897 1 033 138 4 814

2. TRENDS AND RECENT DEVELOPMENTS IN FOREIGN DIRECT INVESTMENT
INTERNATIONAL INVESTMENT PERSPECTIVES: 2007 EDITION – ISBN 978-92-64-03748-9 – © OECD 200726
currency areas. But it also reflects a higher valuation of individual corporate
assets plus the effect of a few multi-billion dollar deals, the like of which has
not been seen since the last boom year 2000.
Judging by the first five months of 2007 (Table 2.3 includes transactions
undertaken up to the first week of June) the surge in international M&As is
continuing apace. The average value of deals in this part of the year was the
highest on record for both inward and outward transactions. And, if the months
January through May are indicative of the year 2007 as a whole then the total
value of cross-border M&As in OECD countries will exceed USD 1 trillion for only
the second time in history.
Based on historic patterns of co-variation between cross-border M&As
and FDI this can be translated into a projection of FDI flows. If mergers and
acquisitions stay at broadly the current levels for the rest of 2007 we are
likely to see inward FDI into OECD countries rise by more than 20 per cent
over 2006 to around USD 1 160 billion for the year as a whole. Outward FDI
from OECD countries (which in 2006 was rather high compared with cross-
border M&As) could increase by a somewhat more modest 5-10 per cent to
around USD 1 200 billion.
1.4. Sectoral trends in cross-border M&As
1.4.1. Large sectoral diversity in 2006
Cross-border corporate M&As in 2006 were relatively evenly split across
some of the main sectors of the private economy. Companies whose main
activities were in the area of raw materials, telecommunication, real estate,
media and entertainment, manufacturing and financial services were in each
case the target of international acquisitions in excess of USD 40 billion. The data
in this sub-section is based on Thomson Financials and include only large
cross-border transactions defined as deals whose value exceed USD 500 million.
Transactions are not limited to the OECD area.
The sector that saw the greatest amount of cross-border M&As in 2006
was the mining and processing of raw materials. Total “large” transactions in
this area according to financial market estimates amounted to USD 119 billion.
More than one fourth of the total amount was due to one transaction – the
much publicised takeover of the Luxembourg-based steel maker Arcelor by
Mittal Steel of the Netherlands, which had a market value of about USD 32
billion. Two major international M&As in this area targeted Canadian
companies, namely the takeover of aluminium producer Falconbridge through
Xstrata of Switzerland and the nickel maker Inco by Brazilian Cia Vale do Rio
Doce. Each transaction was valued at USD 17 billion. The takeover of a third
large Canadian company also figured prominently in this category, namely the

2. TRENDS AND RECENT DEVELOPMENTS IN FOREIGN DIRECT INVESTMENT
INTERNATIONAL INVESTMENT PERSPECTIVES: 2007 EDITION – ISBN 978-92-64-03748-9 – © OECD 2007 27
purchase of the steel maker Dofasco for close to USD 5 billion by Arcelor of
Luxembourg prior to the latter’s acquisition by Mittal Steel.
Other high-profile cases in this sector involved British and American
enterprises. These include the takeover of the UK industrial gas maker BOC
Group by Linde AG of Germany for an estimated USD 14 billion. The miningcompany Glamis Gold of the United States was bought by Canadian GoldCorp
for close to USD 9 billion, and the materials maker Engelhard Corp, likewisefrom the United States, was acquired by German BASF for about USD 5 billion.
The second-most important sector in terms of the value of deals(USD 94 billion in total) was telecommunication. A number of large acquisitions
targeted companies in developing countries, including the Dominican Republic,Thailand, Sudan, Brazil and India, but more than half of the total deal value
related to three intra-OECD transactions. By far the largest cross-bordertakeover in this sector was Spanish Telefonica’s acquisition of O2 plc of the
United Kingdom for USD 31 billion. Second on the league table is the takeover of
Lucent Technologies of the United States by French Alcatel (already referred toearlier) for almost USD 14 billion. Thirdly, a consortium of foreign private equity
companies paid USD 11 billion for the main Danish telephone operator TDC.
In the financial sector the total value of cross-border takeovers in 2006 was
estimated at USD 85 billion. Fourteen transactions were valued aboveUSD 2 billion, but no single deal stands out by its sheer size. The largest
takeover was the aforementioned acquisition of Wintherthur of Switzerlandby French AXA for USD 10 billion. In second place, Old Mutual of the United
Kingdom paid USD 6 billion for the Swedish insurer Försäkrings AB Skandia. Acouple of bank mergers in Italy were much discussed in the media during
2006, namely the acquisition of Banca Nazionale del Lavoro through BNPParibas of France for USD 6 billion and Dutch ABM Amro’s purchase of Banca
Antonveneta for just over USD 4 billion. A further large bank takeover took
place outside the OECD area when the Erste Bank der österreichischenSparkassen of Austria paid almost USD 5 billion for the Romanian Banca
Comerciala Romana.
In the media and entertainment sector, defined broadly to include restaurant
and hotel business, the largest individual transaction was the acquisition of theDutch publishing group VNU through a consortium of private equity companies
for close to USD 10 billion. In second place, the UK-incorporated Hilton Groupplc sold its hotels division to Hilton Hotels Corporation of the United States for
just under USD 6 billion. And, the US gaming services company GTECH Holdingswas bought by Lottomatica of Italy for USD 4½ billion.
A few large-scale international M&As in 2006 not mentioned elsewhere
took place in what could be described as high-tech sectors. For example, PhillipsSemiconductors of the Netherlands was sold for 9½ billion to a group of

2. TRENDS AND RECENT DEVELOPMENTS IN FOREIGN DIRECT INVESTMENT
INTERNATIONAL INVESTMENT PERSPECTIVES: 2007 EDITION – ISBN 978-92-64-03748-9 – © OECD 200728
international investors and Advanced Micro Devices of the United States
acquired the Canadian computer processing unit producer ATI Technologies
for USD 5 billion. In the medical and pharmaceutical area IVAX Corp of the
United States was acquired by Israeli Teva Pharma for more than USD 7 billion,
and the US biotechnology firm Chiron Corp was bought for USD 6 billion byNovartis of Switzerland.
1.4.2. Growth in the first half of 2007: the energy sector and the others
The cross-border M&A activity in the first half of 2007 has remained verybuoyant. The prior to the second week of June (the cut-off date for this article)
the total amount of completed deals with an individual value exceeding
USD 500 million was USD 395 billion. If the first months turn out to be
indicative for the year as a whole, this points to a further strengthening of
activity in 2007 (this is discussed further in the following subsection).
An interesting feature of the first months of 2007 is that there appears to
be particularly strong activity in the energy sector. Four of the top-10 deals were
in this category, including the biggest one. The acquisition of Scottish Power
plc through Iberdrola of Spain for USD 22 billion created what is thought to beEurope’s third-largest utilities group. In a series of much publicised
developments, Enel of Italy built a strategic stake in the Spanish energy group
Endesa at an estimated cost of more than USD 11 billion. In Canada, the
acquisition of Shell Canada through Royal Dutch of the Netherlands/United
Kingdom and the investment by ConocoPhillips in an upstream partnershipwith EnCana were each valued at around USD 7½ billion.
Among the other large transactions in the first part of 2007 several were
valued above USD 10 billion. The takeover of the UK Corus Group through Tata
Steel, though formally an intra-UK transaction, is treated in the followingsection. The takeover of the UK tobacco manufacturer and wholesaler the
Gallaher Group by Japan Tobacco was valued at almost USD 15 billion. In the
financial sector the largest deal was the takeover of the stock market Euronext
by New York Stock Exchange of the United States for USD 10 billion. And,
outside the OECD area, the UK-based telecommunication operator Vodafonepaid more than USD 12 billion for a controlling stake in the Indian mobile
phone operator Hutchinson Essar.
2. A greater role for multinational enterprises based in emerging economies1
The international expansion of large companies from emerging markets
(commonly referred to as emerging economies’ multinational enterprises –
EMNEs) is a new and dynamic feature of the global investment landscape2. A
small number of particularly big mergers and acquisitions have attracted
2. TRENDS AND RECENT DEVELOPMENTS IN FOREIGN DIRECT INVESTMENT
INTERNATIONAL INVESTMENT PERSPECTIVES: 2007 EDITION – ISBN 978-92-64-03748-9 – © OECD 2007 29
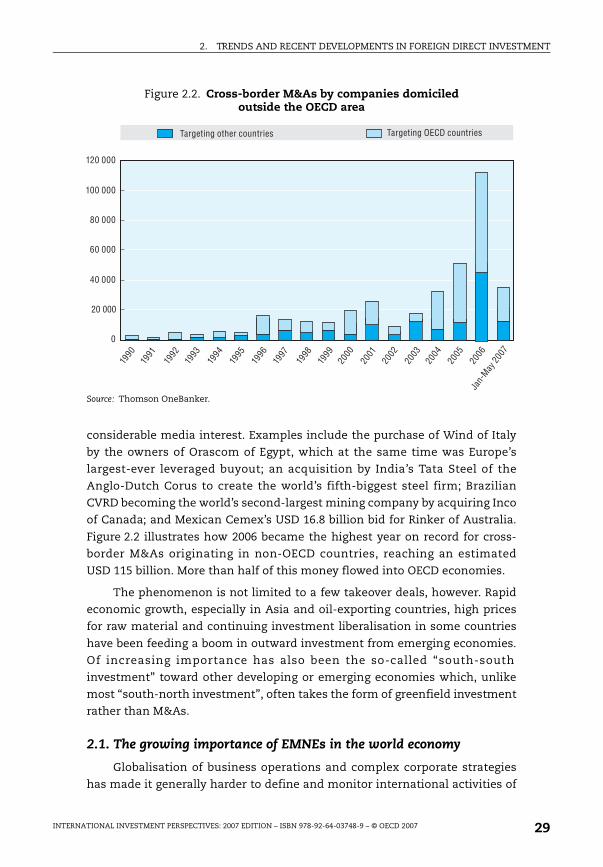
considerable media interest. Examples include the purchase of Wind of Italy
by the owners of Orascom of Egypt, which at the same time was Europe’s
largest-ever leveraged buyout; an acquisition by India’s Tata Steel of the
Anglo-Dutch Corus to create the world’s fifth-biggest steel firm; Brazilian
CVRD becoming the world’s second-largest mining company by acquiring Inco
of Canada; and Mexican Cemex’s USD 16.8 billion bid for Rinker of Australia.
Figure 2.2 illustrates how 2006 became the highest year on record for cross-
border M&As originating in non-OECD countries, reaching an estimated
USD 115 billion. More than half of this money flowed into OECD economies.
The phenomenon is not limited to a few takeover deals, however. Rapid
economic growth, especially in Asia and oil-exporting countries, high prices
for raw material and continuing investment liberalisation in some countries
have been feeding a boom in outward investment from emerging economies.
Of increasing importance has also been the so-called “south-south
investment” toward other developing or emerging economies which, unlike
most “south-north investment”, often takes the form of greenfield investment
rather than M&As.
2.1. The growing importance of EMNEs in the world economy
Globalisation of business operations and complex corporate strategies
has made it generally harder to define and monitor international activities of
Figure 2.2. Cross-border M&As by companies domiciled outside the OECD area
Source: Thomson OneBanker.
Targeting other countries Targeting OECD countries
0
20 000
40 000
60 000
80 000
100 000
120 000
1990
1991
1992
1993
1994
1995
1996
1997
1998
1999
2000
2001
2002
2003
2004
2005
2006
Jan-
May
2007
2. TRENDS AND RECENT DEVELOPMENTS IN FOREIGN DIRECT INVESTMENT
INTERNATIONAL INVESTMENT PERSPECTIVES: 2007 EDITION – ISBN 978-92-64-03748-9 – © OECD 200730
a multinational enterprise. This problem is particularly pronounced in the
case of FDI outflows from emerging economies, whose statistics tend to bepatchy and relatively unreliable. Important players such as Malaysia andMexico just started reporting outward FDI in recent years. Moreover, forseveral countries estimates of FDI outflows are considerably smaller than theactual level of flows measured by international standards. Official statistics donot usually include financing and reinvested components of outward FDI as
well as the capital that is raised abroad. Also, they in general only reflect thelarge investments while excluding small and medium size transactions.
In addition, countries with exchange and capital controls or high taxes oninvestment income provide a substantial incentive for deliberate
underreporting by investors. Another problem has to do with over-reporting ofinward FDI. The inflows to countries such as China and Russia are commonlyconsidered as having been inflated by “round-tripping” of domestic money viaoverseas business locations. The existence of tax havens makes it hard tocorrelate the bilateral flows reported by statistical authorities in home andhost countries. Finally, criteria for defining corporate ownership are complex;
to give just one example, while the media considers Mittal Steel an Indiancompany because the owner and many top managers are Indian, the world’slargest steel maker is registered in the Netherlands and has its headquartersin London3.
With all such caveats in mind, IMF and UNCTAD data do allow for a
reasonable approximation4. Developing countries invested USD 133 billion in2005 and their share of world outward flows reached about 17 per cent.Excluding FDI from offshore financial centres, the total outflow wasUSD 120 billion – the highest level ever recorded. The value of the stock of FDIfrom emerging economies (here defined broadly to refer to all countries theUN characterise as “developing”) was estimated at USD 1.4 trillion in 2005, or
13 per cent of the world total. In another illustration of the growing trend, asrecently as 1990, only six emerging economies reported outward FDI stocksexceeding USD 5 billion. By 2005, that threshold had been exceeded by 25emerging economies.
The share of companies from emerging economies in world rankings hasalso increased fast, no matter which metrics is used to measure corporate size.The number of Fortune Global 500 companies headquartered outside the Triad(the North Atlantic economies and Japan) and Oceania has risen from 26 in1988 to 61 in 2005. In April 2006, Russian Gazprom surpassed Microsoft tobecome the world’s third most valuable company. Also, China Mobile’s market
capitalisation exceeds United Kingdom’s telecom company Vodafone’s. In lessthan a decade, Samsung has become one of the top 20 most valuable brandnames in the world. EMNEs rank high in sectoral ranking – for example, Cemexand CVRD were number one and four in their respective industries in the 2006

2. TRENDS AND RECENT DEVELOPMENTS IN FOREIGN DIRECT INVESTMENT
INTERNATIONAL INVESTMENT PERSPECTIVES: 2007 EDITION – ISBN 978-92-64-03748-9 – © OECD 2007 31
Fortune Global 500. EMNEs’ estimated total sales are estimated to have reached
USD 1.9 trillion in 2005 and they employed some 6 million workers. Five EMNEs
(three of them state-owned) are among the 100 largest in the world.
However, there still remains a large gap between the two groups in terms
of “transnationality”, an index developed by UNCTAD to evaluate the range
and degree of foreign activity by MNEs. The total foreign assets of the top 100
EMNEs in 2004 amounted to less than the foreign assets of U.S.-based General
Electric. The geographic spread of MNE operations, another aspect of trans-
nationality, shows that companies from developing countries have, on
average, affiliates in six countries, mostly in their own region. By way of
contrast, on average the largest EMNEs have affiliates in 40 foreign countries,
spread across a number of regions.
2.2. Regional trends: where did the upsurge in investment come from?
In many regions south-south FDI flows are particularly important in size.
This is a natural reflection of the fact that most corporate strategies for cross-
border expansion are in fact regional as opposed to truly global. In
consequence, most bilateral FDI flows tend to involve geographically
proximate locations. However, insofar as FDI data are often poor, and
particularly sketchy in developing countries, the present article limits itself
to sketching broad trends rather than rely on “precise” figures for each
continent.
A further incomplete illustration is found by considering the subset of
outward FDI that takes the form of cross-border M&As. According to Table 2.4,
the most active outward investor since 1990 by this measure has been
Singapore, both in respect of south-south and south-north investment. The
second-most active south-north investor (still in terms of M&As) was Brazil,
followed by the United Arab Emirates, South Africa and Israel – hence
generally not countries like China and India that have most recently been
portrayed by the public and press as “trying to take over” prized assets in the
OECD area. Following Singapore, the most active south-south investors were
China, Malaysia and South Africa.
Investors from emerging economies appear to play an important role
especially in sub-Saharan Africa, with South Africa emerging in recent years as
one of the largest source countries all across Anglophone Africa. China and, to
a lesser extent, Brazil, India, Malaysia, and Russia have been very active in
natural resources, especially in the Gulf of Guinea and Sudan. In the Middle
East and North Africa, investment from the Gulf countries in services has been
on a clear upwards trend. In Tunisia, for instance, Dubai became in 2006 the
largest investor in terms of non-energy FDI stock, ahead of France and Italy.
The role of Morocco in Senegal is also noteworthy.

2. TRENDS AND RECENT DEVELOPMENTS IN FOREIGN DIRECT INVESTMENT
INTERNATIONAL INVESTMENT PERSPECTIVES: 2007 EDITION – ISBN 978-92-64-03748-9 – © OECD 200732
In other developing regions that since the early 1990s have attracted
considerable FDI from OECD, south-south flows are slightly less vigorous,although also on the rise. In China, in particular, the four largest emerging Asia
investors (Hong Kong [China], Korea, Chinese Taipei and Singapore) accountedfor 41 per cent of the FDI amount invested in 2006, with Hong Kong (China)alone representing 29 per cent. Conversely, Hong Kong (China) and overseas
locations such as the Cayman Islands and the British Virgin Islands, received81 per cent (USD 9.9 billion) of total Chinese outward investment (and perhapsexplaining why these destinations in turn are some of the largest sources of« foreign » investment coming back into China). It is also worth noting thatLatin America passed Asia as the top regional recipient of Chinese investment.
According to MOFCOM China’s outward FDI, excluding the financialsector, reached USD 16.1 billion in 2006, up 32 per cent over 2005. By the end of2006, cumulative FDI abroad had reached USD 73.3 billion5. Overseasacquisitions accounted for about 30 per cent of China’s outward FDI in 2006. By
the end of 2005, China’s cumulative FDI abroad had reached USD 57.2 billion,81 per cent of which was from state-owned enterprises that are directlymanaged by the State Assets Supervision and Administration Commission.Coastal and border provinces together accounted for 62.5 per cent of China'soutward FDI. Nonetheless, problems related to the classification of flows to
and from Hong Kong (China) and Macau make it difficult to arrive at a preciseestimate.
Elsewhere in the region, FDI inflows between Asian countries accounts
for almost half of all FDI inflows to the region and is particularly pronounced
Table 2.4. Top-10 locations for non-OECD companies engaging in cross-border M&A (1990 to May 2007)
Note: Includes only transactions valued at more than USD 100 million.
Source: Thomson OneBanker.
Rank Target located in OECD Target located in other country
Home country
Value of deals (USD bn.)
Share of group total (%)
Home country
Value of deals (USD bn.)
Share of group total (%)
1 Singapore 36.0 14.5 Singapore 35.8 25.3
2 Brazil 32.1 13.0 China 18.3 12.9
3 U.A. Emirates 24.2 9.8 Malaysia 12.7 9.0
4 South Africa 20.1 8.1 South Africa 11.6 8.2
5 Israel 19.2 7.8 U.A. Emirates 7.2 5.1
6 Egypt 18.1 7.3 Brazil 6.7 4.7
7 Saudi Arabia 12.1 4.9 Chile 6.1 4.3
8 Russia 11.2 4.5 India 4.7 3.3
9 Malaysia 10.1 4.1 Qatar 4.7 3.3
10 Bahrain 9.1 3.7 Russia 4.2 3.0

2. TRENDS AND RECENT DEVELOPMENTS IN FOREIGN DIRECT INVESTMENT
INTERNATIONAL INVESTMENT PERSPECTIVES: 2007 EDITION – ISBN 978-92-64-03748-9 – © OECD 2007 33
between and within East Asian economies and South-East Asia economies6.
There is evidence of increasing intra-ASEAN flows. Almost three-fifths of
flows from East Asia to South-East Asia have been destined for the relatively
higher-income South-East economies, viz. Singapore, Malaysia, Philippines
and Thailand. Singapore in particular has attracted about half of all of East
Asian FDI destined for South-East Asia, while Singaporean companies stand
out as key regional investors. Thailand’s CP Group is also said to be the largest
single foreign investor in China.
In Central and Eastern Europe (CEE), three underlying trends are clear. First,
flows among new EU members have risen in anticipation of the entry and this
is now gaining momentum. Non-EU emerging companies, especially from
Asia but also from Latin America, have also made greenfield investments in
CEE to access the European market. Second, in the countries that were created
after the break-up of the Soviet Union and Yugoslavia, there are considerable
intra-area FDI flows. In the CIS countries, it is Russia that accounts for a large
share of inward FDI. In the former Yugoslavia, the consolidation of some
sectors around Slovenia, Croatian, and Serb multinationals has taken place
(Slovenia’s Mercator retail chain being a good example). Third, Russian
companies have concluded major deals in OECD countries, including the USD
2.3 cash buyout of Oregon Steel Mills by Evraz. Turkey has also been actively
investing regionally, particularly in West and Central Asia and Russia.
In Latin America, EMNEs that have made direct investments outside their
home countries (“Translatinas”) have become an increasingly important
phenomenon, particularly since the mid-1990s. Indeed, FDI by Translatinas is
accounting for an increasing share of total FDI in Latin America. The total
OFDI of the countries of the region amounted to USD 40.6 billion in 2006, more
than twice the level observed in 20057. A notable example comes from Brazil,
whose investments outside its borders (USD 28 billion in 2006) surpassed the
total entering the country from foreign investment (USD 18.8 billion).
In high-income OECD countries, on the other hand, media attention to
the rise of the new giants from emerging economies has been somewhat
disproportionate with respect to the dimension of actual flows from these
sources. To give but one example, fewer Americans work for companies from
Mexico (the emerging economy which accounts for the largest number of jobs
in the United States) than for a single Dutch company, Phillips8.
Nonetheless, this should not obscure the fact that new source countries
are becoming more important. In France, recent estimates show that investors
from China were responsible for 17 projects and 1 388 new jobs in 2004-06,
making it the 12th most important foreign investor in this respect during this
period9. According to London’s investment promotion agency, India has
become the second-largest biggest source of FDI into the British capital,

2. TRENDS AND RECENT DEVELOPMENTS IN FOREIGN DIRECT INVESTMENT
INTERNATIONAL INVESTMENT PERSPECTIVES: 2007 EDITION – ISBN 978-92-64-03748-9 – © OECD 200734
accounting for 16 per cent of new inflows between 2003 and 2007. In the case
of the hotel business, Jones Lang LaSalle estimates that strategic investmentby investors from the Middle East accounted for more than 9 per cent of totaltransaction value in Europe last year.
2.3. Sectoral trends: are any parts of the economy particularly affected?
Global FDI activity is increasingly taking place in services andcompanies from emerging economies are playing an active role in thisphenomenon. Taking the cross-border M&As as indicative of the broadertrends in FDI, it would appear from Figure 2.3 that at least 44 per cent of theo ut f l ow s f ro m e m e rg in g e co no m i e s s in c e 1 9 9 0 s ( t h e s u m of
telecommunications, financial services and energy and power) have targetedenterprises in the service sectors. Another 19 per cent concerned the accessto raw materials or the companies that process them. The remainder of thissection further examines the evidence that has been produced by specific ortargeted sectoral studies.
In the telecommunication sector the importance south-south FDI appearsto be growing. Such investment accounted for over 36 per cent of total flowsand close to 20 per cent of the total number of telecommunications projectsfrom 2001 to 2003, compared with only 23 per cent and 11 per cent,respectively, in 1990-9910.
As far as financial services are concerned, World Bank research shows that27 per cent of all foreign banks in developing countries are owned by a bankfrom another developing country, while these banks hold 5 per cent of theforeign assets11. The importance of developing country foreign banks is much
Figure 2.3. Cross-border M&A by companies domiciled outside the OECD area, by target sector (1990 to May 2007)
Source: Thomson OneBanker.
Consumer goodsand services
9%
Energy and power15%
Financial services12%
Raw materials19%
Telecommunication16%
Others17%
Industry and high tech12%

2. TRENDS AND RECENT DEVELOPMENTS IN FOREIGN DIRECT INVESTMENT
INTERNATIONAL INVESTMENT PERSPECTIVES: 2007 EDITION – ISBN 978-92-64-03748-9 – © OECD 2007 35
larger in low-income countries (both in number of banks and in terms of
assets) and this type of foreign banking is strongly regionally concentrated.
Natural resources are also attracting increasing interest, as record-high
world prices and high financial market liquidity make it viable to invest in
riskier projects than in the past. In the case of oil, ongoing research at the
OECD Development Centre and the World Bank reveals that FDI flows are not
only north-south but also and increasingly south-north and south-south12.
Finally, in manufacturing companies from emerging economies occupy
leadership positions in undifferentiated industrial commodities such as
aluminium, basic chemicals, cement, paper and pulp, steel. In each case, FDI
has played an important role to access new markets, either because the
product is hard to transport (e.g. cement) or because trade barriers are sizeable
(e.g. steel). Emerging MNEs are now also targeting more complex industries
such as car making – in late 2004 SAIC took a 51 per cent stake of SsangYong
Motor Company in Korea, one year later Nanjing Autos took over MG Rover for
£ 53 million, and a Russian aluminium magnate is partnering with Canada’s
Magna to buy the struggling Chrysler Group. Argentina’s Tenaris (although it is
owned by an Italian family and is also listed in New York) is the world’s largest
producer of seamless tubes thanks to its technological edge.
2.4. What factors have been at play?
The internationalisation of developing country firms is partially
explained by the so-called investment development path (IDP) theory:
outward FDI is undertaken when the country reaches a certain minimum
development. As countries move along the IDP from the initial stage of only
receiving inward FDI, domestic firms acquire ownership and other advantages
to go abroad and the country reaches the final stage and becomes an
important outward investor.
However, there is some evidence indicating that EMNEs are investing
abroad at earlier stages of IDP, mainly because many such firms do not have the
luxury of waiting given the fierce competition at home and export markets as
a result of increased the level of globalisation13. They may also develop
comparative advantages vis-à-vis other countries/companies in certain sectors
– ranging from a patent, recognised brand, production capacity to access to
certain resources, knowledge of culture, language. For example, EMNEs
experience some comparative advantages in services sector vis-à-vis northern
MNEs in their regional investments – particularly in other developing countries
(south-south FDI) – because services sector often requires proximity between
producer and consumer and favour language and culture similarities. As a
result, southern telecom giants Mexican América Movil, Egyptian Orascom and
South African MTN compete fiercely with northern firms in their regions.

2. TRENDS AND RECENT DEVELOPMENTS IN FOREIGN DIRECT INVESTMENT
INTERNATIONAL INVESTMENT PERSPECTIVES: 2007 EDITION – ISBN 978-92-64-03748-9 – © OECD 200736
In manufacturing, specialisation in production has brought comparative
advantages to many developing country firms. Brazilian bus and coach
producer Marcopolo have developed a flexible production system to produce
custom-made busses, which they have carried to Portugal and other Latin
American countries. Jordanian Hikma’s ability to produce low-cost, diverse
and high-quality pharmaceuticals enable them to expand in other Arab
countries as well as other regions. In the primary sector, southern firms’
access to resources has helped them in terms of access to funding as well as
their scale of production while they expand their operations abroad.
Firms may also engage in internationalisation by acquiring “strategic”
assets (commonly through M&A14) such as technology, brands and
distribution networks in case of lack or limited comparative advantages (asset
augmentation). In an environment with the increased competition in the
domestic and foreign markets due to globalisation and technological advances
that can erode the comparative advantages quickly, developed and developing
country firms alike use cross-border takeovers as an important strategy.
Developing country firms expand abroad using combination both of these
strategies. For example, Orascom Telecom has become a major regional
telecom provider in Africa and the Middle East after investing heavily in the
neighbouring countries as an asset-exploiting strategy, while buying Italy’s
Wind served to augment assets.
3. Offshoring, outsourcing and globalisation
One of the recurrent topics in discussions about globalisation is concerns
by the public in the more mature economies that the growing international
trade and investment implies the shifting of domestic jobs to low-cost
locations abroad. Until a few years ago the debate focused on blue-collar jobs
where developing countries were assumed to be most competitive, but the
recent upsurge in skill-intensive activities in developing and emerging
economies (discussed in more details in a later article in this publication) has
broadened the issue to the technology intensive and service sectors. The
present section reviews some of the indicators of the changing role of
multinational enterprises’ foreign affiliates in corporate value chains.
First, the debate about multinational enterprises’ foreign activities often
suffers from the confusion of a couple of commonly used terms: offshoring
and outsourcing. Outsourcing does not necessarily imply an international
dimension: it simply means the use of goods and services produced outside
the enterprise. An unfolding example of domestic outsourcing is the
streamlining of many industrial companies’ value chains in recent decades by
ceasing to provide auxiliary services (e.g. transportation; information and
communications; financial services) in-house.
2. TRENDS AND RECENT DEVELOPMENTS IN FOREIGN DIRECT INVESTMENT
INTERNATIONAL INVESTMENT PERSPECTIVES: 2007 EDITION – ISBN 978-92-64-03748-9 – © OECD 2007 37
Offshoring is the case when an enterprise moves part of its value chain to
a foreign location. The offshore economic activities may be own subsidiaries of
the enterprise or they may be unrelated corporate entities (in which latter case
outsourcing occurs jointly with offshoring). Some high-tech recent foreign
investments – including by the ICT sector in emerging economies – have
actually involved offshoring as well as in-sourcing, because they took place as
multinational enterprises chose to established foreign subsidiaries to produce
the services that they had previously purchased from independent providers. A
recent study consider by the OECD Committee on Industry, Innovation and
Entrepreneurship, on which the present section is based, documented in detail
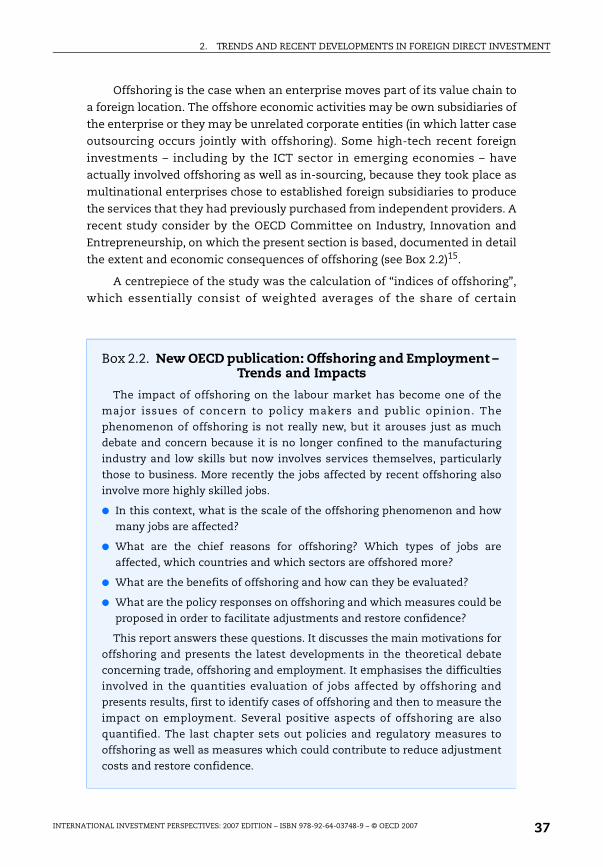
the extent and economic consequences of offshoring (see Box 2.2)15.
A centrepiece of the study was the calculation of “indices of offshoring”,
which essentially consist of weighted averages of the share of certain
Box 2.2. New OECD publication: Offshoring and Employment – Trends and Impacts
The impact of offshoring on the labour market has become one of the
major issues of concern to policy makers and public opinion. The
phenomenon of offshoring is not really new, but it arouses just as much
debate and concern because it is no longer confined to the manufacturing
industry and low skills but now involves services themselves, particularly
those to business. More recently the jobs affected by recent offshoring also
involve more highly skilled jobs.
● In this context, what is the scale of the offshoring phenomenon and how
many jobs are affected?
● What are the chief reasons for offshoring? Which types of jobs are
affected, which countries and which sectors are offshored more?
● What are the benefits of offshoring and how can they be evaluated?
● What are the policy responses on offshoring and which measures could be
proposed in order to facilitate adjustments and restore confidence?
This report answers these questions. It discusses the main motivations for
offshoring and presents the latest developments in the theoretical debate
concerning trade, offshoring and employment. It emphasises the difficulties
involved in the quantities evaluation of jobs affected by offshoring and
presents results, first to identify cases of offshoring and then to measure the
impact on employment. Several positive aspects of offshoring are also
quantified. The last chapter sets out policies and regulatory measures to
offshoring as well as measures which could contribute to reduce adjustment
costs and restore confidence.
2. TRENDS AND RECENT DEVELOPMENTS IN FOREIGN DIRECT INVESTMENT
INTERNATIONAL INVESTMENT PERSPECTIVES: 2007 EDITION – ISBN 978-92-64-03748-9 – © OECD 200738
categories of input goods to certain sectors that are purchased from
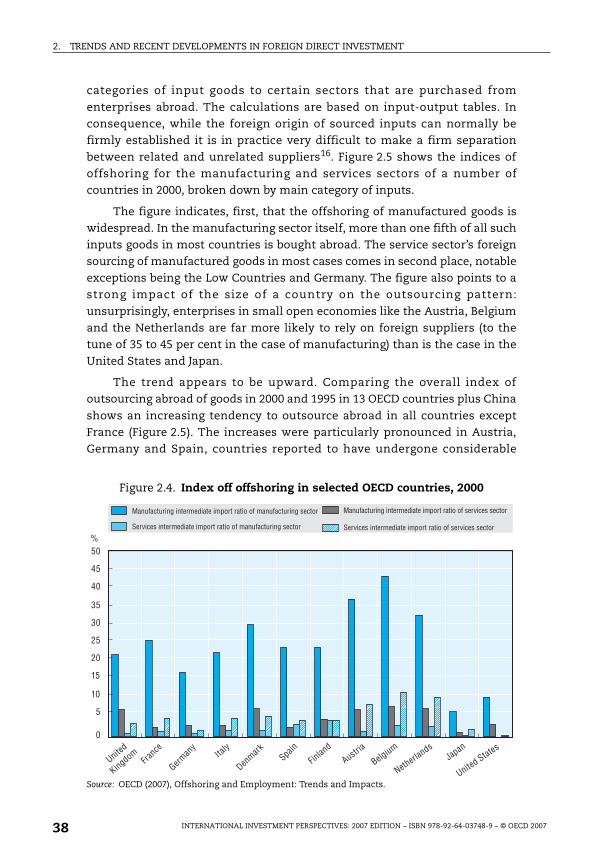
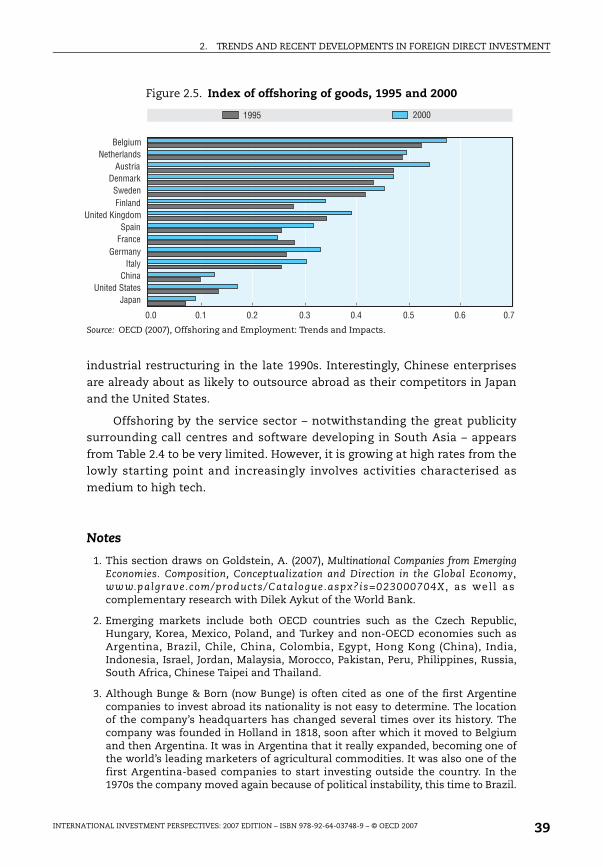
enterprises abroad. The calculations are based on input-output tables. Inconsequence, while the foreign origin of sourced inputs can normally befirmly established it is in practice very difficult to make a firm separationbetween related and unrelated suppliers16. Figure 2.5 shows the indices ofoffshoring for the manufacturing and services sectors of a number ofcountries in 2000, broken down by main category of inputs.
The figure indicates, first, that the offshoring of manufactured goods iswidespread. In the manufacturing sector itself, more than one fifth of all suchinputs goods in most countries is bought abroad. The service sector’s foreignsourcing of manufactured goods in most cases comes in second place, notableexceptions being the Low Countries and Germany. The figure also points to astrong impact of the size of a country on the outsourcing pattern:
unsurprisingly, enterprises in small open economies like the Austria, Belgiumand the Netherlands are far more likely to rely on foreign suppliers (to thetune of 35 to 45 per cent in the case of manufacturing) than is the case in theUnited States and Japan.
The trend appears to be upward. Comparing the overall index ofoutsourcing abroad of goods in 2000 and 1995 in 13 OECD countries plus China
shows an increasing tendency to outsource abroad in all countries exceptFrance (Figure 2.5). The increases were particularly pronounced in Austria,Germany and Spain, countries reported to have undergone considerable
Figure 2.4. Index off offshoring in selected OECD countries, 2000
Source: OECD (2007), Offshoring and Employment: Trends and Impacts.
0
5
10
15
20
25
30
35
40
45
50%
United
Kingdom
German
y
France Ita
ly
Denmark Spain
Finlan
dAustria
Belgium
Netherlands
Japan
United States
Denmark
Manufacturing intermediate import ratio of manufacturing sector Manufacturing intermediate import ratio of services sector
Services intermediate import ratio of manufacturing sector Services intermediate import ratio of services sector
2. TRENDS AND RECENT DEVELOPMENTS IN FOREIGN DIRECT INVESTMENT
INTERNATIONAL INVESTMENT PERSPECTIVES: 2007 EDITION – ISBN 978-92-64-03748-9 – © OECD 2007 39
industrial restructuring in the late 1990s. Interestingly, Chinese enterprises
are already about as likely to outsource abroad as their competitors in Japanand the United States.
Offshoring by the service sector – notwithstanding the great publicitysurrounding call centres and software developing in South Asia – appears
from Table 2.4 to be very limited. However, it is growing at high rates from thelowly starting point and increasingly involves activities characterised as
medium to high tech.
Notes
1. This section draws on Goldstein, A. (2007), Multinational Companies from EmergingEconomies. Composition, Conceptualization and Direction in the Global Economy,www.palgrave.com/products/Catalogue.aspx?is=023000704X , as well ascomplementary research with Dilek Aykut of the World Bank.
2. Emerging markets include both OECD countries such as the Czech Republic,Hungary, Korea, Mexico, Poland, and Turkey and non-OECD economies such asArgentina, Brazil, Chile, China, Colombia, Egypt, Hong Kong (China), India,Indonesia, Israel, Jordan, Malaysia, Morocco, Pakistan, Peru, Philippines, Russia,South Africa, Chinese Taipei and Thailand.
3. Although Bunge & Born (now Bunge) is often cited as one of the first Argentinecompanies to invest abroad its nationality is not easy to determine. The locationof the company’s headquarters has changed several times over its history. Thecompany was founded in Holland in 1818, soon after which it moved to Belgiumand then Argentina. It was in Argentina that it really expanded, becoming one ofthe world’s leading marketers of agricultural commodities. It was also one of thefirst Argentina-based companies to start investing outside the country. In the1970s the company moved again because of political instability, this time to Brazil.
Figure 2.5. Index of offshoring of goods, 1995 and 2000
Source: OECD (2007), Offshoring and Employment: Trends and Impacts.
1995 2000
JapanUnited States
ChinaItaly
GermanyFranceSpain
United KingdomFinlandSweden
DenmarkAustria
NetherlandsBelgium
0.0 0.1 0.2 0.3 0.4 0.5 0.6 0.7

2. TRENDS AND RECENT DEVELOPMENTS IN FOREIGN DIRECT INVESTMENT
INTERNATIONAL INVESTMENT PERSPECTIVES: 2007 EDITION – ISBN 978-92-64-03748-9 – © OECD 200740
By the following decade, Bunge & Born had diversified into numerous activities upand down the food production chain throughout the American continent. In 1999,after undergoing a deep restructuring and refocusing on its core business(agriculture), the company changed its “nationality” yet again and set up itsheadquarters in New York, United States, where Bunge began to trade its shareson the stock exchange in 2001. Thus, it is hard to determine whether this companyis still Argentine, and what the local implications of its transnationalisation mightbe. (Source: UN Economic Commission for Latin America and the Caribbean (2007),Foreign Investment in Latin America and the Caribbean.)
4. UNCTAD (2006), World Investment Report.
5. China’s total outward FDI reached USD 12.3 billion in 2005, a leap of 123 per centover 2004 and the first time that the annual figure passed the USD 10 billion mark.
6. See ICRIER International Workshop on Intra-Asian FDI Flows, Delhi, 25-26 April2007, www.icrier.org/conference/2007/26april07.html.
7. UN Economic Commission for Latin America and the Caribbean (2007), ForeignInvestment in Latin America and the Caribbean.
8. Mira Wilkins (2005), “Dutch Multinational Enterprises in the United States: AHistorical Summary”, Business History Review, Vol. 79, Issue 2 and Bureau ofEconomic Analysis (2006), Foreign Direct Investment in the United States. Final Resultsfrom the 2002 Benchmark Survey.
9. Agence Française pour l’Investissement International (AFII).
10. Guislain, Pierre and Christine Zhen-Wei Qiang (2006), “Foreign Direct Investmentin Telecommunications in Developing Countries”, in Information andCommunications for Development 2006: Global Trends and Policies, World Bank,Washington, DC.
11. Van Horen, Neeltje (2007), “Foreign Banking in Developing Countries: OriginMatters”, Emerging Markets Review, Vol. 8, No. 2: 81-105.
12. Aykut, Dilek and Andrea Goldstein (2007), “FDI in the Oil Sector”, mimeo, DECPG-International Finance Team-The World Bank and OECD Development Centre.
13. Bonaglia, Federico, Andrea Goldstein and John Mathews (2007), “AcceleratedInternationalization by Emerging Multinationals: The Case of White Goods”,Journal of World Business, forthcoming.
14. According to UNCTAD, between 1987 and 2005, emerging economies’ share ofglobal cross-border M&As rose from 4 per cent to 13 per cent in value terms, andfrom 5 per cent to 17 per cent in terms of the number of deals concluded.
15. OECD (2007), Offshoring and Employment: Trends and Impacts, Paris.
16. The quoted study uses the term “index of outsourcing abroad”, but as no formalseparation between related and unrelated enterprises can be made the presentarticle prefers a more general title.

2. TRENDS AND RECENT DEVELOPMENTS IN FOREIGN DIRECT INVESTMENT
INTERNATIONAL INVESTMENT PERSPECTIVES: 2007 EDITION – ISBN 978-92-64-03748-9 – © OECD 2007 41
ANNEX 2.A1
International Direct Investment Statistics

2.TR
END
S AN
D R
ECEN
T D
EVELO
PMEN
TS
IN FO
REIG
N D
IREC
T IN
VES
TM
ENT
INT
ERN
AT
ION
AL IN
VES
TM
EN
T PER
SPEC
TIV
ES: 2007 EDIT
ION
– ISB
N 978-92-64-03748-9 – ©
OEC
D 2007
42 Table 2.A1.1. OECD direct investment abroad: OutflowsUSD million
Notes: Data are converted to US dollars using average exchange rates; p: preliminary; e: estimate.
Source: OECD International Direct Investment database.
1990 1991 1992 1993 1994 1995 1996 1997 1998 1999 2000 2001 2002 2003 2004 2005p 2006e
Australia 992.3 1 199.4 5 266.9 1 947.0 2 816.5 3 281.8 7 087.6 6 427.9 3 344.8 –420.7 3 158.5 11 962.0 7 852.1 16 184.9 10 799.7 –34 288.5 20 987.1
Austria 1 627.2 1 285.3 1 697.5 1 190.5 1 257.2 1 130.6 1 935.0 1 988.2 2 745.2 3 300.7 5 740.9 3 137.9 5 812.0 7 143.0 8 305.4 10 017.4 4 089.4
Belgium/Luxembourg
5 956.0 6 066.2 10 955.9 3 850.5 1 205.4 11 728.4 7 811.3 7 884.5 29 107.8 132 325.8 218 364.4 100 624.7 0.0 0.0 0.0 0.0 0.0
Belgium 0.0 0.0 0.0 0.0 0.0 0.0 0.0 0.0 0.0 0.0 0.0 0.0 12 705.4 36 932.9 34 037.8 31 761.1 62 586.9
Canada 5 235.2 5 832.3 3 589.2 5 699.9 9 293.5 11 462.3 13 094.3 23 059.2 34 349.2 17 250.1 44 678.5 36 037.2 26 761.1 21 526.0 43 247.8 34 084.3 42 134.4
Czech Republic 0.0 0.0 0.0 90.2 119.6 36.6 152.9 25.2 127.1 89.8 42.8 165.4 206.5 206.7 1 014.4 –18.7 1 344.7
Denmark 1 618.2 2 051.8 2 236.0 1 260.5 3 955.1 3 063.5 2 519.1 4 206.6 4 476.6 16 433.9 23 093.2 13 376.1 5 694.9 1 123.9 –10 370.7 15 026.4 8 194.5
Finland 2 708.5 –124.0 –751.7 1 407.1 4 297.8 1 497.3 3 596.5 5 291.7 18 641.5 6 615.5 24 034.7 8 372.0 7 377.8 –2 281.6 –1 080.1 4 474.7 8.9
France 36 228.4 25 137.6 30 407.1 19 736.1 24 372.3 15 758.1 30 419.5 35 580.9 48 612.7 126 859.2 177 481.6 86 783.3 50 486.1 53 197.0 56 762.3 120 891.1 115 101.0
Germany 24 231.9 22 947.0 18 595.1 17 196.1 18 857.8 39 051.6 50 806.3 41 794.1 88 837.2 108 691.6 56 567.5 39 691.1 18 963.5 5 827.0 14 836.7 55 480.6 79 466.4
Greece 0.0 0.0 0.0 0.0 0.0 0.0 0.0 0.0 –275.6 552.1 2 136.5 616.1 655.3 412.6 1 029.7 1 450.0 4 169.2
Hungary 0.0 0.0 0.0 10.6 48.3 59.1 –3.6 461.9 278.3 250.1 620.2 368.1 278.1 1 644.0 1 119.4 2 327.4 3 015.4
Iceland 11.5 28.6 6.3 14.3 23.7 24.8 63.4 56.0 74.1 123.1 392.6 341.8 320.0 373.2 2 553.1 7 063.2 4 159.9
Ireland 364.7 192.6 214.4 217.8 436.3 819.8 727.9 1 013.7 3 902.1 6 109.1 4 629.6 4 066.1 11 035.2 5 554.7 18 079.3 13 559.5 22 113.7
Italy 7 611.7 7 325.9 5 948.5 7 230.6 5 108.8 5 731.4 6 464.9 12 244.7 16 077.6 6 721.7 12 318.5 21 475.9 17 138.3 9 079.3 19 273.2 41 794.7 42 059.7
Japan 50 772.1 31 687.0 17 301.6 13 915.3 18 117.0 22 627.8 23 419.4 25 990.9 24 154.6 22 746.5 31 538.5 38 348.7 32 280.1 28 798.5 30 963.5 45 830.2 50 244.1
Korea 1 051.6 1 488.6 1 161.5 1 340.0 2 461.1 3 552.0 4 670.1 4 449.4 4 739.5 4 197.8 4 998.9 2 420.1 2 616.5 3 425.5 4 657.9 4 298.1 7 128.7
Luxembourg 0.0 0.0 0.0 0.0 0.0 0.0 0.0 0.0 0.0 0.0 0.0 0.0 125 945.1 99 861.4 84 088.5 123 955.3 81 552.3
Mexico 0.0 0.0 0.0 0.0 0.0 0.0 0.0 0.0 0.0 0.0 0.0 4 404.0 890.8 1 253.5 4 431.9 6 474.0 5 758.5
Netherlands 13 660.6 12 825.9 12 697.1 10 063.3 17 553.8 20 175.5 32 098.1 24 522.1 36 475.1 57 611.3 75 648.7 50 602.3 32 046.0 44 075.9 26 585.9 142 839.9 22 704.9
New Zealand 2 360.7 1 472.4 391.4 –1 388.7 2 008.2 1 783.5 –1 239.7 –1 565.5 401.4 1 072.5 608.7 407.7 –1 133.0 195.0 1 082.8 –315.3 –1 640.5
Norway 1 431.5 1 823.6 394.2 933.0 2 172.5 2 856.2 5 892.5 5 015.3 3 200.7 5 503.6 8 620.5 538.6 4 622.1 2 655.2 3 526.0 21 055.7 12 229.4
Poland 0.0 0.0 13.2 18.2 29.0 42.1 53.1 45.2 316.2 31.0 17.0 –88.8 228.6 305.0 769.7 3 069.6 4 134.0
Portugal 164.8 473.6 684.2 107.3 282.5 684.6 728.8 2 092.0 4 028.5 3 191.4 8 133.6 6 262.7 –149.2 8 035.2 7 849.7 2 077.2 3 509.5

2.TR
END
S AN
D R
ECEN
T D
EVELO
PMEN
TS IN
FOR
EIGN
DIR
ECT
INV
ESTM
ENT
INT
ERN
AT
ION
AL IN
VES
TM
EN
T PER
SPEC
TIV
ES: 2007 ED
ITIO
N – IS
BN
978-92-64-03748-9 – © O
ECD
200743
Table 2.A1.1. OECD direct investment abroad: Outflows (cont.)USD million
Notes: Data are converted to US dollars using average exchange rates; p: preliminary; e: estimate.
Source: OECD International Direct Investment database.
1990 1991 1992 1993 1994 1995 1996 1997 1998 1999 2000 2001 2002 2003 2004 2005p 2006e
Slovak Republic
0.0 0.0 0.0 12.8 17.7 43.0 62.9 95.1 146.6 –377.2 28.7 64.5 11.2 13.3 152.1 146.4 369.0
Spain 3 441.7 4 424.4 2 171.0 3 173.6 4 110.8 4 157.8 5 590.1 12 546.8 18 937.7 44 383.5 58 224.0 33 112.6 32 744.0 28 744.9 60 566.5 41 804.5 89 728.3
Sweden 14 748.2 7 057.6 408.7 1 357.7 6 701.1 11 214.3 5 024.8 12 647.5 24 379.4 21 928.6 40 976.4 7 328.2 10 596.3 21 120.7 20 757.6 26 543.9 24 146.2
Switzerland 6 708.4 6 211.6 6 049.2 8 764.5 10 797.2 12 214.0 16 150.4 17 747.7 18 768.8 33 264.3 44 698.0 18 326.1 8 212.4 15 443.4 26 287.2 54 177.9 81 547.0
Turkey –16.0 27.0 65.0 14.0 49.0 113.0 110.0 251.0 367.0 645.0 870.0 497.0 175.0 499.0 859.0 1 078.0 934.0
United Kingdom
17 953.8 16 412.1 17 740.9 26 063.1 32 205.7 43 560.0 34 055.9 61 620.0 122 861.2 201 436.7 23 3487.7 58 885.2 50 346.5 62 439.3 91 082.8 83 692.1 79 470.0
United States 37 183.0 37 889.0 48 266.0 83 950.0 80 167.0 98 750.0 91 885.0 104 803.0 142 644.0 224 934.0 15 9212.0 142 349.0 154 460.0 149 897.0 244 128.0 9 072.0 248 856.0
Total OECD FDI
236 046.2 193 735.4 185 509.4 208 175.3 248 465.0 315 419.1 343 176.3 410 295.2 651 719.3 1 045 470.9 1 240 322.1 690 475.6 619 178.5 623 686.4 807 396.8 869 422,6 1 120 102,7

2.TR
END
S AN
D R
ECEN
T D
EVELO
PMEN
TS
IN FO
REIG
N D
IREC
T IN
VES
TM
ENT
INT
ERN
AT
ION
AL IN
VES
TM
EN
T PER
SPEC
TIV
ES: 2007 EDIT
ION
– ISB
N 978-92-64-03748-9 – ©
OEC
D 2007
44 Table 2.A1.2. OECD direct investment from abroad: InflowsUSD million
Notes: Data are converted to US dollars using average exchange rates; p: preliminary; e: estimate.
Source: OECD International Direct Investment database.
1990 1991 1992 1993 1994 1995 1996 1997 1998 1999 2000 2001 2002 2003 2004 2005p 2006e
Australia 8 115.8 4 302.1 5 719.8 4 281.7 5 024.6 11 963.2 6 111.0 7 633.4 6 002.6 3 268.4 13 949.9 8 297.1 16 996.1 7 981.2 35 963.4 -34 967.2 24 546.8
Austria 650.9 351.3 1 432.7 1 136.5 2 102.9 1 904.2 4 428.6 2 655.6 4 534.1 2 974.6 8 841.7 5 920.5 357.0 7 150.9 3 892.4 9 039.3 248.5
Belgium/Luxembourg
7 516.0 8 919.4 10 957.3 10 467.8 8 313.2 10 894.2 13 924.4 16 510.1 30 146.9 142 512.3 220 987.8 84 717.6 0.0 0.0 0.0 0.0 0.0
Belgium 0.0 0.0 0.0 0.0 0.0 0.0 0.0 0.0 0.0 0.0 0.0 0.0 15 640.5 32 127.2 43 583.1 33 949.8 71 518.8
Canada 7 580.3 2 880.0 4 721.6 4 730.3 8 204.1 9 255.4 9 632.6 11 522.0 22 802.8 24 747.2 66 795.5 27 669.9 22 145.9 7 618.5 1 533.2 33 823.6 66 605.0
Czech Republic 0.0 0.0 0.0 653.4 868.3 2 561.9 1 428.2 1 301.1 3 716.4 6 326.2 4 980.2 5 644.6 8 483.5 2 108.7 4 975.0 11 654.4 5 963.1
Denmark 1 206.7 1 459.9 1 014.7 1 669.0 4 897.6 4 179.8 768.0 2 798.6 7 725.7 14 657.1 31 305.8 11 525.3 6 633.4 2 597.1 -10 721.4 13 108.5 7 033.5
Finland 787.5 -246.6 406.2 864.4 1 577.7 1 062.9 1 109.0 2 115.8 12 140.7 4 610.2 8 835.6 3 732.2 8 053.2 3 322.1 3 004.9 4 503.9 3 707.5
France 15 612.6 15 170.9 17 849.2 16 442.7 15 574.0 23 679.1 21 959.5 23 171.5 30 984.5 46 545.9 43 258.4 50 485.1 49 078.7 42 538.4 32 585.4 81 006.7 81 120.9
Germany 2 962.0 4 729.3 -2 088.9 368.3 7 133.9 12 025.4 6 572.8 12 243.4 24 596.7 56 077.3 198 313.0 26 419.0 53 570.8 32 398.3 -9 201.3 35 844.9 42 891.4
Greece 1 688.4 1 718.1 1 588.6 1 243.6 1 166.1 1 197.7 1 196.4 1 088.6 72.1 561.5 1 108.1 1 589.4 50.3 1 276.4 2 102.6 606.1 5 366.4
Hungary 312.1 1 474.4 1 477.2 2 446.2 1 143.5 5 101.9 3 300.4 4 170.9 3 337.1 3 313.1 2 763.0 3 936.0 2 993.6 2 137.5 4 508.2 7 620.9 6 097.4
Iceland 22.0 18.2 -12.7 0.4 -1.5 9.2 83.1 147.9 147.8 66.6 170.5 172.6 90.9 327.9 653.8 3 074.7 3 233.4
Ireland 622.6 1 360.8 1 458.1 1 068.5 856.2 1 441.5 2 615.7 2 709.6 8 856.3 18 211.2 25 784.2 9 652.7 29 350.0 22 802.8 -10 613.7 -31 113.6 12 817.9
Italy 6 343.4 2 481.5 3 210.8 3 751.4 2 235.6 4 816.2 3 534.9 4 962.5 4 279.8 6 911.4 13 377.3 14 873.4 14 558.2 16 430.2 16 824.5 19 959.0 16 587.2
Japan 1 805.9 1 286.2 2 755.2 210.5 888.2 41.5 227.9 3 224.0 3 192.8 12 743.0 8 317.7 6 243.8 9 239.2 6 324.0 7 818.8 2 778.4 -6 502.8
Korea 788.5 1 179.8 728.3 588.1 809.0 1 775.8 2 325.4 2 844.2 5 412.3 9 333.4 9 283.4 3 527.7 2 392.3 3 525.5 9 246.2 6 309.0 3 645.0
Luxembourg 0.0 0.0 0.0 0.0 0.0 0.0 0.0 0.0 0.0 0.0 0.0 0.0 115 276.1 89 290.1 79 126.1 116 303.7 97 013.2
Mexico 2 633.0 4 761.5 4 393.0 4 389.0 15 069.1 9 678.8 10 086.7 14 164.8 12 408.6 13 631.2 17 587.8 27 150.9 18 274.7 14 183.8 22 300.9 19 642.7 19 037.4
Netherlands 10 516.2 5 778.9 6 169.4 6 443.1 7 158.4 12 306.8 16 660.1 11 136.5 36 924.9 41 206.1 63 865.6 51 936.8 25 060.3 21 063.0 2 124.5 41 431.8 4 373.0
New Zealand 1 683.1 1 695.6 1 089.2 2 211.6 2 615.7 2 849.7 3 922.0 1 917.2 1 825.5 940.4 1 344.4 4 590.4 -1 251.3 2 040.6 2 850.7 3 140.5 1 570.4
Norway 1 176.7 -48.9 810.4 1 460.7 2 777.6 2 408.0 3 168.5 3 946.4 4 353.7 7 061.7 6 907.7 2 232.0 669.6 3 701.0 2 546.6 6 392.2 1 635.1
Poland 84.0 359.2 678.0 1 715.9 1 874.8 3 658.1 4 499.7 4 913.8 6 368.0 7 275.8 9 446.1 5 696.6 4 121.2 4 867.0 12 484.0 9 542.4 13 859.8
Portugal 2 255.4 2 291.6 1 903.8 1 516.2 1 254.6 660.1 1 343.8 2 361.7 3 004.7 1 156.8 6 636.5 6 231.8 1 800.8 8 600.9 2 328.2 3 962.5 7 374.7

2.TR
END
S AN
D R
ECEN
T D
EVELO
PMEN
TS IN
FOR
EIGN
DIR
ECT
INV
ESTM
ENT
INT
ERN
AT
ION
AL IN
VES
TM
EN
T PER
SPEC
TIV
ES: 2007 ED
ITIO
N – IS
BN
978-92-64-03748-9 – © O
ECD
200745
Table 2.A1.2. OECD direct investment from abroad: Inflows (cont.)USD million
Notes: Data are converted to US dollars using average exchange rates; p: preliminary; e: estimate.
Source: OECD International Direct Investment database.
1990 1991 1992 1993 1994 1995 1996 1997 1998 1999 2000 2001 2002 2003 2004 2005p 2006e
Slovak Republic
0.0 0.0 0.0 179.1 272.9 241.4 395.7 230.6 706.8 428.5 2 383.1 1 584.1 4 126.5 593.8 1 107.5 1 907.2 4 232.1
Spain 13 838.6 12 445.2 13 350.7 9 571.6 9 275.8 6 285.1 6 820.6 6 387.8 11 798.4 18 743.9 39 582.4 28 347.0 39 248.7 25 843.9 24 774.5 25 005.2 20 026.9
Sweden 1 971.4 6 355.8 41.0 3 845.1 6 349.7 14 446.9 5 436.6 10 967.4 19 842.7 60 963.7 23 430.5 10 905.1 12 156.6 4 990.1 11 668.7 10 170.1 27 836.6
Switzerland 5 484.6 2 643.3 411.4 -83.1 3 367.7 2 224.0 3 078.4 6 641.9 8 942.1 11 714.4 19 266.0 8 859.0 6 283.8 16 505.3 1 372.7 -1 263.0 25 101.4
Turkey 684.0 810.0 844.0 636.0 608.0 885.0 722.0 805.0 940.0 783.0 982.0 3 352.0 1 137.0 1 752.0 2 883.0 9 801.0 20 165.0
United Kingdom
30 470.7 14 849.2 15 474.8 14 821.3 9 254.6 19 968.4 24 441.3 33 244.9 74 348.9 87 972.8 118 823.8 52 650.2 24 051.9 16 845.9 56 002.2 193 657.5 139 565.7
United States 48 494.0 23 171.0 19 823.0 51 362.0 46 121.0 57 776.0 86 502.0 105 603.0 179 045.0 289 444.0 321 274.0 167 021.0 84 372.0 63 961.0 133 162.0 109 754.0 183 571.0
Total OECD FDI 175 306.5 122 197.7 116 206.7 147 991.3 166 793.1 225 298.5 246 295.4 301 420.1 528 457.9 894 181.6 1 289 602.1 634 963.8 574 961.6 464 905.2 490 886.7 746 646.0 91 0242.2

2.TR
END
S AN
D R
ECEN
T D
EVELO
PMEN
TS
IN FO
REIG
N D
IREC
T IN
VES
TM
ENT
INT
ERN
AT
ION
AL IN
VES
TM
EN
T PER
SPEC
TIV
ES: 2007 EDIT
ION
– ISB
N 978-92-64-03748-9 – ©
OEC
D 2007
46 Table 2.A1.3. OECD direct investment abroad: Outward positionUSD million
Notes: Data are converted to US dollars using average exchange rates; p: preliminary; e: estimate.
Source: OECD International Direct Investment database.
1990 1991 1992 1993 1994 1995 1996 1997 1998 1999 2000 2001 2002 2003 2004 2005p 2006e
Australia 30 494.9 30 897.0 34 559.6 40 503.6 47 786.3 53 009.0 66 857.9 71 968.4 78 647.9 89 583.6 85 385.3 109 688.2 114 847.6 161 886.8 204 196.9 178 335.2 226 171.4
Austria 4 746.9 5 993.6 6 584.5 7 974.2 9 514.1 11 832.0 13 059.8 14 011.4 17 468.4 19 127.3 24 819.9 28 510.6 42 483.2 55 961.0 67 785.0 68 186.7 80 337.0
Belgium/Luxembourg
0.0 0.0 0.0 0.0 0.0 0.0 0.0 0.0 0.0 0.0 0.0 0.0 0.0 0.0 0.0 0.0 0.0
Belgium 0.0 0.0 0.0 0.0 0.0 0.0 0.0 0.0 0.0 0.0 0.0 0.0 0.0 0.0 0.0 0.0 0.0
Canada 84 812.7 94 387.4 87 867.3 92 469.1 104 308.0 118 106.1 132 321.9 152 959.3 171 784.7 201 446.8 237 646.9 250 691.0 275 711.3 318 973.5 373 008.5 394 681.0 449 009.4
Czech Republic 0.0 0.0 0.0 181.4 300.4 345.5 498.0 548.2 804.1 697.9 737.9 1 135.6 1 473.1 2 283.5 3 758.9 3 610.4 5 058.2
Denmark 0.0 15 612.0 16 305.7 15 799.2 19 613.7 24 702.5 27 601.6 28 127.7 38 836.8 51 376.0 73 074.2 78 236.2 86 696.8 102 586.9 123 146.6 127 101.1 150 110.0
Finland 11 227.3 10 845.3 8 564.6 9 178.2 12 534.0 14 993.2 17666.0 20 297.5 29 405.9 33 850.3 52 108.7 52 224.4 63 930.7 76 049.7 85 022.5 81 368.6 90 877.5
France 110 120.6 129 900.5 156 326.6 158 750.3 182 331.8 204 430.3 231 112.8 237 248.9 288 035.9 334 102.9 445 087.0 508 842.0 586 306.6 724 445.4 845 450.6 882 287.2 1 075 917.9
Germany 130 760.3 150 517.4 154 741.3 162 365.0 194 523.4 233 107.4 248 634.1 296 274.9 365 195.7 412 881.3 486 749.8 551 083.1 602 780.0 720 718.3 810 621.7 801 351.5 940 363.0
Greece 0.0 0.0 0.0 0.0 0.0 0.0 0.0 0.0 2 792.2 3 217.9 5 851.7 7 020.4 9 000.6 12 337.0 13 791.3 13 601.9 195 60.1
Hungary 0.0 0.0 223.6 224.6 291.2 278.1 265.3 646.6 785.1 924.2 1 279.1 1 554.5 2 165.8 3 509.4 6 022.1 7 992.5 12 695.8
Iceland 75.2 101.1 98.1 113.5 148.5 177.2 240.1 275.0 360.5 451.8 662.9 840.2 1 255.0 1 733.4 4 024.6 10 084.8 12 990.2
Ireland 0.0 0.0 0.0 0.0 0.0 0.0 0.0 0.0 20 314.4 25 232.1 27 925.0 40 818.7 58 880.0 74 490.5 106 042.3 102 865.1 0.0
Italy 60 195.3 70 419.3 70 382.3 81 086.6 89 688.3 106 318.6 117 278.0 139 437.2 176 985.2 181 855.5 180 273.6 182 373.3 194 488.3 238 887.6 280 481.1 293 475.2 375 754.6
Japan 201 440.0 231 790.0 248 060.0 259 800.0 275 570.0 238 452.0 258 612.4 271 905.7 270 034.0 248 776.0 278 441.5 300 115.7 304 237.5 335 499.5 370 543.6 386 581.3 449 567.4
Korea 0.0 0.0 0.0 0.0 0.0 0.0 0.0 0.0 0.0 0.0 0.0 19 967.0 20 734.5 24 986.4 0.0 0.0 0.0
Luxembourg 0.0 0.0 0.0 0.0 0.0 4 703.3 4 695.4 5 022.3 7 982.8 8 467.8 7 927.0 8 810.2 18 139.5 21 354.8 27 883.0 33 410.2 0.0
Mexico 0.0 0.0 0.0 0.0 0.0 0.0 0.0 0.0 0.0 0.0 0.0 12 077.5 12 868.7 16 587.0 22 218.8 28 040.1 0.0
Netherlands 106 896.1 117 262.8 121 052.5 120 116.2 142 944.0 172 675.1 194 015.6 198 539.0 228 983.2 263 761.3 305 459.2 332 151.2 396 514.3 523 206.6 597 887.4 629 941.0 729 672.0
New Zealand 0.0 0.0 5 899.0 4 430.7 5 896.2 7 675.6 9 293.1 5 646.0 5 490.8 7 006.2 6 065.1 8 807.8 9 162.2 11 458.3 12 495.1 12 592.2 12 601.7
Norway 10 889.2 12 149.1 11 794.4 12 717.7 17 648.0 22 520.7 25 439.1 27 494.5 31 609.4 42 452.9 46 301.5 55 403.2 72 487.3 82 787.7 89 980.1 0.0 0.0
Poland 0.0 0.0 100.8 198.2 461.2 539.3 735.2 678.1 1 164.7 1 024.4 1 018.5 1 157.2 1 456.5 2 145.6 3 223.6 6 438.9 0.0
Portugal 0.0 0.0 0.0 0.0 0.0 0.0 4 195.5 5 747.9 10 225.9 11 492.9 19 792.5 22 264.9 21 324.5 36 059.9 46 113.9 44 072.4 54 850,4

2.TR
END
S AN
D R
ECEN
T D
EVELO
PMEN
TS IN
FOR
EIGN
DIR
ECT
INV
ESTM
ENT
INT
ERN
AT
ION
AL IN
VES
TM
EN
T PER
SPEC
TIV
ES: 2007 ED
ITIO
N – IS
BN
978-92-64-03748-9 – © O
ECD
200747
Table 2.A1.3. OECD direct investment abroad: Outward position (cont.)USD million
Notes: Data are converted to US dollars using average exchange rates; p: preliminary; e: estimate.
Source: OECD International Direct Investment database.
1990 1991 1992 1993 1994 1995 1996 1997 1998 1999 2000 2001 2002 2003 2004 2005p 2006e
Slovak Republic
0.0 0.0 0.0 0.0 166.4 138.5 185.0 236.4 408.2 346.0 379.1506.6 485.6 633.2 583.5 617.2 1176.1
Spain 0.0 0.0 22 046.8 24 014.3 30 044.8 36 547.3 41 999.6 53 035.2 74 109.4 118 042.9 167 717.9 191 648.9 233 937.3 292 464.3 370 931.1 372 943.8 507 970.1
Sweden 50 719.5 54 797.6 48 844.6 45 522.5 60 309.0 73 142.5 72 187.8 78 201.2 93 533.7 106 273.8 123 234.0 123 268.1 146 509.8 183 631.4 214 826.0 208 835.9 262 952.4
Switzerland 66 086.5 75 880.9 74 411.8 91 570.3 112 588.0 142 481.4 141 586.8 165 354.1 184 237.3 194 598.3 232 175.8 252 238.3 292 210.1 341 384.4 399 297.3 426 195.3 545 420.3
Turkey 0.0 0.0 0.0 0.0 0.0 0.0 0.0 0.0 0.0 0.0 3 668.0 4 581.0 5 847.0 6 138.0 7 060.0 8 315.0 8 866.0
United Kingdom
229 306.7 232 140.8 221 678.9 245 628.9 276 743.8 304 864.9 330 432.5 360 796.3 488 372.0 686 420.4 897 844.8 869 700.5 994 135.71 187 045.01 247 190.31 228 325.61 486 948.9
United States 616 655.0 643 364.0 663 830.0 723 526.0 786 565.0 885 506.0 989 810.01 068 063.01 196 021.01 414 355.01 531 607.01 693 131.01 867 043.02 059 850.02 399 224.02 453 933.0 0.0
Total OECD FDI 1 714 426.21 876 058.61 953 372.42 096 170.32 369 976.22 656 546.52 928 723.63 202 514.83 783 589.34 457 765.55 243 233.95 708 847.06 437 112.17 619 095.18 732 809.78 805 183.2 .
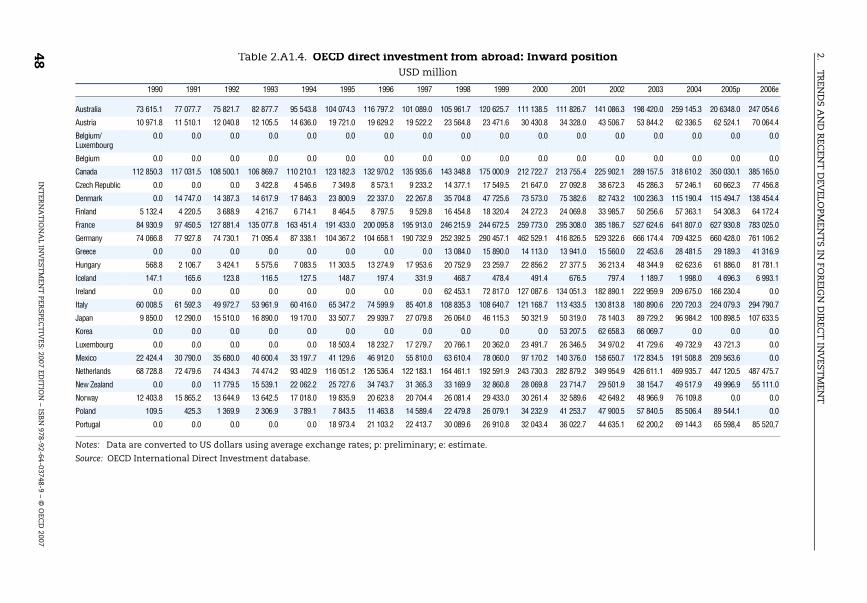
2.TR
END
S AN
D R
ECEN
T D
EVELO
PMEN
TS
IN FO
REIG
N D
IREC
T IN
VES
TM
ENT
INT
ERN
AT
ION
AL IN
VES
TM
EN
T PER
SPEC
TIV
ES: 2007 EDIT
ION
– ISB
N 978-92-64-03748-9 – ©
OEC
D 2007
48 Table 2.A1.4. OECD direct investment from abroad: Inward positionUSD million
Notes: Data are converted to US dollars using average exchange rates; p: preliminary; e: estimate.
Source: OECD International Direct Investment database.
1990 1991 1992 1993 1994 1995 1996 1997 1998 1999 2000 2001 2002 2003 2004 2005p 2006e
Australia 73 615.1 77 077.7 75 821.7 82 877.7 95 543.8 104 074.3 116 797.2 101 089.0 105 961.7 120 625.7 111 138.5 111 826.7 141 086.3 198 420.0 259 145.3 20 6348.0 247 054.6
Austria 10 971.8 11 510.1 12 040.8 12 105.5 14 636.0 19 721.0 19 629.2 19 522.2 23 564.8 23 471.6 30 430.8 34 328.0 43 506.7 53 844.2 62 336.5 62 524.1 70 064.4
Belgium/Luxembourg
0.0 0.0 0.0 0.0 0.0 0.0 0.0 0.0 0.0 0.0 0.0 0.0 0.0 0.0 0.0 0.0 0.0
Belgium 0.0 0.0 0.0 0.0 0.0 0.0 0.0 0.0 0.0 0.0 0.0 0.0 0.0 0.0 0.0 0.0 0.0
Canada 112 850.3 117 031.5 108 500.1 106 869.7 110 210.1 123 182.3 132 970.2 135 935.6 143 348.8 175 000.9 212 722.7 213 755.4 225 902.1 289 157.5 318 610.2 350 030.1 385 165.0
Czech Republic 0.0 0.0 0.0 3 422.8 4 546.6 7 349.8 8 573.1 9 233.2 14 377.1 17 549.5 21 647.0 27 092.8 38 672.3 45 286.3 57 246.1 60 662.3 77 456.8
Denmark 0.0 14 747.0 14 387.3 14 617.9 17 846.3 23 800.9 22 337.0 22 267.8 35 704.8 47 725.6 73 573.0 75 382.6 82 743.2 100 236.3 115 190.4 115 494.7 138 454.4
Finland 5 132.4 4 220.5 3 688.9 4 216.7 6 714.1 8 464.5 8 797.5 9 529.8 16 454.8 18 320.4 24 272.3 24 069.8 33 985.7 50 256.6 57 363.1 54 308.3 64 172.4
France 84 930.9 97 450.5 127 881.4 135 077.8 163 451.4 191 433.0 200 095.8 195 913.0 246 215.9 244 672.5 259 773.0 295 308.0 385 186.7 527 624.6 641 807.0 627 930.8 783 025.0
Germany 74 066.8 77 927.8 74 730.1 71 095.4 87 338.1 104 367.2 104 658.1 190 732.9 252 392.5 290 457.1 462 529.1 416 826.5 529 322.6 666 174.4 709 432.5 660 428.0 761 106.2
Greece 0.0 0.0 0.0 0.0 0.0 0.0 0.0 0.0 13 084.0 15 890.0 14 113.0 13 941.0 15 560.0 22 453.6 28 481.5 29 189.3 41 316.9
Hungary 568.8 2 106.7 3 424.1 5 575.6 7 083.5 11 303.5 13 274.9 17 953.6 20 752.9 23 259.7 22 856.2 27 377.5 36 213.4 48 344.9 62 623.6 61 886.0 81 781.1
Iceland 147.1 165.6 123.8 116.5 127.5 148.7 197.4 331.9 468.7 478.4 491.4 676.5 797.4 1 189.7 1 998.0 4 696.3 6 993.1
Ireland 0.0 0.0 0.0 0.0 0.0 0.0 0.0 0.0 62 453.1 72 817.0 127 087.6 134 051.3 182 890.1 222 959.9 209 675.0 166 230.4 0.0
Italy 60 008.5 61 592.3 49 972.7 53 961.9 60 416.0 65 347.2 74 599.9 85 401.8 108 835.3 108 640.7 121 168.7 113 433.5 130 813.8 180 890.6 220 720.3 224 079.3 294 790.7
Japan 9 850.0 12 290.0 15 510.0 16 890.0 19 170.0 33 507.7 29 939.7 27 079.8 26 064.0 46 115.3 50 321.9 50 319.0 78 140.3 89 729.2 96 984.2 100 898.5 107 633.5
Korea 0.0 0.0 0.0 0.0 0.0 0.0 0.0 0.0 0.0 0.0 0.0 53 207.5 62 658.3 66 069.7 0.0 0.0 0.0
Luxembourg 0.0 0.0 0.0 0.0 0.0 18 503.4 18 232.7 17 279.7 20 766.1 20 362.0 23 491.7 26 346.5 34 970.2 41 729.6 49 732.9 43 721.3 0.0
Mexico 22 424.4 30 790.0 35 680.0 40 600.4 33 197.7 41 129.6 46 912.0 55 810.0 63 610.4 78 060.0 97 170.2 140 376.0 158 650.7 172 834.5 191 508.8 209 563.6 0.0
Netherlands 68 728.8 72 479.6 74 434.3 74 474.2 93 402.9 116 051.2 126 536.4 122 183.1 164 461.1 192 591.9 243 730.3 282 879.2 349 954.9 426 611.1 469 935.7 447 120.5 487 475.7
New Zealand 0.0 0.0 11 779.5 15 539.1 22 062.2 25 727.6 34 743.7 31 365.3 33 169.9 32 860.8 28 069.8 23 714.7 29 501.9 38 154.7 49 517.9 49 996.9 55 111.0
Norway 12 403.8 15 865.2 13 644.9 13 642.5 17 018.0 19 835.9 20 623.8 20 704.4 26 081.4 29 433.0 30 261.4 32 589.6 42 649.2 48 966.9 76 109.8 0.0 0.0
Poland 109.5 425.3 1 369.9 2 306.9 3 789.1 7 843.5 11 463.8 14 589.4 22 479.8 26 079.1 34 232.9 41 253.7 47 900.5 57 840.5 85 506.4 89 544.1 0.0
Portugal 0.0 0.0 0.0 0.0 0.0 18 973.4 21 103.2 22 413.7 30 089.6 26 910.8 32 043.4 36 022.7 44 635.1 62 200,2 69 144,3 65 598,4 85 520,7

2.TR
END
S AN
D R
ECEN
T D
EVELO
PMEN
TS IN
FOR
EIGN
DIR
ECT
INV
ESTM
ENT
INT
ERN
AT
ION
AL IN
VES
TM
EN
T PER
SPEC
TIV
ES: 2007 ED
ITIO
N – IS
BN
978-92-64-03748-9 – © O
ECD
200749
Table 2.A1.4. OECD direct investment from abroad: Inward position (cont.)USD million
Notes: Data are converted to US dollars using average exchange rates; p: preliminary; e: estimate.
Source: OECD International Direct Investment database.
1990 1991 1992 1993 1994 1995 1996 1997 1998 1999 2000 2001 2002 2003 2004 2005p 2006e
Slovak Republic 0.0 0.0 0.0 0.0 897.0 1 297.1 1 899.8 2 103.4 2 919.6 3 227.6 4 679.4 5 729.8 8 530.6 11 283.9 14 503.7 15 795.5 25 482.3
Spain 0.0 0.0 85 989.4 80 295.6 96 302.3 110 290.5 111 532.2 105 265.6 126 018.5 125 363.6 156 346.8 177 252.0 257 095.4 339 652.0 395 983.6 371 451.4 443 274.4
Sweden 12 636.0 18 085.0 14 057.0 13 126.9 22 649.4 31 089.3 34 784.1 41 512.7 50 984.6 73 312.5 93 972.5 91 958.9 119 315.4 157 083.9 196 369.1 171 768.2 218 374.3
Switzerland 34 244.6 35 747.2 32 989.3 38 713.3 48 668.4 57 063.7 53 916.7 59 515.2 71 997.1 76 000.2 86 809.9 88 766.3 124 808.0 162 238.3 197 671.7 168 988.5 207 126.2
Turkey 0.0 0.0 0.0 0.0 0.0 0.0 0.0 0.0 0.0 0.0 19 209.0 19 677.0 18 795.0 33 536.0 38 519.0 64 433.0 0.0
United Kingdom 203 905.3 208 345.5 172 986.4 179 232.6 189 587.5 199 771.8 228 642.5 252 958.6 337 386.1 385 146.1 438 630.7 506 685.6 523 319.2 606 157.3 701 913.4 831 357.2 1 135 263.8
United States 505 346.0 533 404.0 540 270.0 593 313.0 617 982.0 680 066.0 745 619.0 824 136.0 920 044.0 1 101 709.0 1 421 017.0 1 518 473.0 149 9952 1 576 983 1 727 062 1 874 263 0.0
Total OECD FDI 1 291 940.0 1 391 261.4 1 469 281.7 1 558 071.7 1 732 639.7 2 020 343.3 2 187 879.6 2 384 827.6 2 939 686.2 3 376 081.0 4 241 790.1 4 583 321.1 5 247 556.8 6 297 909.5 7 105 092.1 7 128 307.8 ..