international journal of business, management and …ijbmas.in/ijbmas 5.1.18/428-437 pardeep...
TRANSCRIPT

Page 428
RESEARCH ARTICLE Vol.5.Issue.1.2018 Jan-Mar
INTERNATIONAL JOURNAL OF BUSINESS, MANAGEMENT
AND ALLIED SCIENCES (IJBMAS)
A Peer Reviewed International Research Journal
PERFORMANCE EVALUATION OF MUTUAL FUNDS AND UNIT
LINKED INSURANCE PLANS IN INDIA USING VALUE AT RISK (VaR)
MEASURES
PARDEEP KUMAR1*, Dr. HARPREET ANEJA2 1Research Scholar, Department of RIC-Management, IKGPTU, Kapurthala, Punjab,
India 2Director, Department of Management, KIMT, Ludhiana,Punjab, India
Email: *[email protected], [email protected]
ABSTRACT
Fund performance measurement studies in the past have been of great interest for
academicians, fund managers and general investors. Assessment of risk involved
in investment has been at the center of all investment decisions. Treating risk as a
whole and always taking it to be on the negative side of investments, is not
warranted. Since, the risk has two elements upward-risk and downward-risk so
the much more important question in the minds of everyone should be the
maximum downside risk involved in investments. Considering this, Value-at-
Risk (VaR), is a better tool for evaluating fund performance. In the present study,
Value at Risk approaches have been used first time to analyze the performance of
equity based mutual funds and Unit Linked Insurance Plan funds. It can be
concluded that mutual funds outperform the unit linked insurance plan funds.
Key words- Mutual Funds, ULIPs, Value-at-risk, Investments.
1. INTRODUCTION
Increasing variety in the availability of investment avenues and the rising complexity in the
Indian financial markets, have led to broadening the scope of professionally managed investment
vehicles. Mutual Funds or Unit Linked Insurance Plans (ULIPs) being professionally managed, well
regulated; and being the most eligible proxies to investments in equities, are emerging as the most
popular channels in the Indian investment business. Professional Fund management through mutual
funds and ULIPs achieves benefits of bundling of different investment instruments, getting higher
and stable returns, more capital appreciation with minimum risks, while keeping into account safety,
liquidity, marketability, time horizon of investments, convenience, protection against inflation and
unforeseen costs; and tax-benefits etc.
1.1 Performance Evaluation of Funds:
To fulfill the expectations of millions of investors, the funds are required to maximize the
value of investments. Evaluating performance of funds vis-à-vis such a goal, is important for both the
investors as well as the fund managers. Various performance reports which are periodically

PARDEEP KUMAR, Dr. HARPREET ANEJA ISSN:2349-4638 Vol.5. Issue.1.2018 (Jan-Mar)
Int.J.Buss.Mang.& Allied.Sci. (ISSN:2349-4638) 429
published on the basis of standard measures may not actually reflect the true investment performance
of the funds. Moreover the Indian investors are not fully aware of the concept/functioning of these
funds, and even if they are aware, then also they are not capable of judging the most appropriate
investment opportunities among the available alternatives. Besides, time and time again, these
potential investors are posed by a critical question of choosing the best investment avenue among the
mutual funds and ULIPs. So performance comparison of mutual funds and ULIP funds poses a great
case for study and various performance evaluation measures can be utilized for the same.
1.2 Value-at-Risk(VaR) Measures for Performance Evaluation:
Assessment of Risk is an integral part of performance measurement of any investment. But
the investors always associate risk with the bad risk, whereas the risk also includes the more than
expected returns i.e. good-risk. So it becomes of paramount importance that whenever risk needs to
be discussed, the focus should be on the ‘bad-risk’ i.e. downside-risk. Value at Risk (VaR) can be
described as the maximum loss in the value of a portfolio or an asset within a determined time period
and with a pre-defined probability rate or confidence level under regular market conditions. Value-at-
risk (VaR) methodology focuses on the assessment of the maximum downside-risk involved in the
investment. In this study the various VaR approaches are utilized to measure the performance of
mutual-funds and ULIPs funds.
2. OBJECTIVE
The present research has the following main objectives:
a) To evaluate the performance of Mutual funds and ULIP funds in India by using VaR
approaches.
b) To compare the performance of Mutual funds and ULIP funds in India by using VaR
approaches.
3. LITERATURE REVIEW
Value at Risk has gained prominence as a risk measure in the recent past. Value at Risk, also
known as VaR, started from the trading of derivatives by banks and later spread to currency and
bond trading. Group of Thirty (1993), the study stressed on utilizing the VaR analysis for risk
management in derivative investments. Jorion (1997), in his study emphasized on the need and
importance of VaR. Johansson et.al (1999), in his study concluded that is that VaR aggregates several
sources of risk into a single quantitative measure of risk for a portfolio and is a better measure. Gupta
and Liang (2005) compared VaR and traditional risk measures in evaluating hedge fund risk and
concluded that VaR is a better measure than standard deviation. Soumya and Ashok (2009) confirmed
the presence of considerable downside risk for an investor in equity mutual funds by using VaR
approach. Deb (2009), concluded that the Indian equity mutual funds have considerable downside
risk in terms of VaR measure and the actual downsides have exceeded the VaR, quite often. Sahi et.
al.(2013), established that during the study period the downside risk of the sample schemes was
considerable and during post-recession period entire mutual fund industry has suffered losses,
including the top AMCs of India. Agarwal & Mirza(2017), observed that the Value at Risk for equity
based mutual funds were higher than that of debt fund, which has shown that even though the equity
funds have higher potential for returns but on the other hand, the downside risk was also
comparatively higher.
4. RESEARCH METHODOLOGY
4.1 Data Collection: Daily NAV closing values secondary data is collected for the selected 84
equity based mutual-funds and 60 equity based ULIP funds for the period April 2008 to March 2016.
91 Day T-Bills return is taken as the risk free rate and NSE-Nifty is chosen as the benchmark index.
4.2 Performance Evaluation Tools: VaR is defined as the maximum possible loss for a given
asset portfolio under normal market volatility. There are many methods of measuring VaR and no
single method can be recommended (Beder-1995, Hendricks-1996). Out of these methods Variance-
covariance approach is selected to estimate VaR as done by Hendricks (1996), Bredin and Hyde (2004)

PARDEEP KUMAR, Dr. HARPREET ANEJA ISSN:2349-4638 Vol.5. Issue.1.2018 (Jan-Mar)
Int.J.Buss.Mang.& Allied.Sci. (ISSN:2349-4638) 430
and Li-Chang, Shang-ling, Chia-Chen and Yih-Chang (2012) in their studies. Here, a fund’s VaR is
calculated as:
VaR= -W ZασR 𝑇
where W = Scale parameter reflecting the overall size of the portfolio, taken as 100cr.
Zα = critical value from the normal distribution for probability (1-α)
(Zα = -1.645 at 95% of confidence level),
σR= Standard Deviation of the rate of return of the portfolio,
T= Holding Period.
The Approaches used for VaR Calculation are Exponentially Weighted Moving Average Model
(EWMA) &Generalized Auto Regressive Conditional Heteroskedasticity (GARCH) Model.
4.2.1 Exponentially Weighted Moving Average Model (EWMA): This approach uses J.P. Morgan’s
Risk Metrics Methodology for calculating VaR by assigning different weights to each of the data
points and the variance will be calculated as:
σt2= λ σ2
t-1 + 1 − λ 𝑟2𝑡−1
Where λ is the decay factor and 0< λ <1,
The values used in practice are λ=0.94 for daily data and λ=0.97 for monthly data (Risk Metrics, 1996)
since they are easy to use and approximate the behavior of actual data quite well although they are
inconsistent (Jorion, 2001).
4.2.2Generalized Auto Regressive Conditional Heteroskedasticity (GARCH) Model: This approach
calculates volatility by using Bollerslev (1986) GARCH model, a generalized extension of Engle’s
ARCH (1982). There are many different types of GARCH models. Most empirical studies, such as
Engle et al. (1991), Bollerslev et al. (1992), West et al. (1993) and Colm and Patton (2000) have
indicated that the GARCH (1, 1) model provides a good fit to time series data. The variance is
calculated as:
rt= σtεt, εt ~N(0,1)
σ𝑡2= ω + α𝑟2
𝑡−1 + β σ2t-1
Where 0 < ω ≤ ∞, α ≥ 0, β ≥ 0, α+ β < 1
5. RESULTS AND ANALYSIS
5.1 Fund Performance Ranking: Exponentially Weighted Moving Average Model
The various mutual-funds are ranked on the basis of VaR. Here the highest ranking is given to the
fund with lowest VaR as shown in the table 1:
Table1: Mutual Fund Performance Ranking based on Exponentially Weighted Moving Average
Model of VaR
Ra
nk
Mu
tua
l
Fu
nd
Stn
d.
De
v.
(%)
Va
R
(Cro
re
Rs.
)
Ra
nk
Mu
tua
l F
un
d
Stn
d.
De
v.
(%)
Va
R
(Cro
re
Rs.
)
1 UTI MNC 1.03 55.12 43 Kotak Opportunities 0.98 79.77
2 Tata Ethical 0.99 61.33 44 JPMorgan India Equity 1.09 79.81
3 BSL (I) Opportunities 1.00 64.34 45 DWS Alpha Equity 1.09 79.87
4 DWS Invest. Opportunity 0.88 66.69 46 Mirae (I) Opportunities 1.09 80.58
5 ICICI Pru Indo Asia Eqt. 1.17 67.98 47 BSL Equity 1.05 80.70
6 ICICI Pru Exports/Serv. 1.08 68.94 48 ICICI Pru Multicap 1.37 81.05
7 BSL India GenNext 1.11 69.85 49 DSP-BR Equity 1.07 81.41
8 Franklin (I) Flexi Cap 1.08 70.63 50 UTI Dividend Yield 1.11 81.99
9 BSL International Equity 0.96 70.69 51 SBI Magnum Multiplier 1.14 82.03
10 Kotak Classic Equity 0.97 71.38 52 UTI Opportunities 1.28 82.10
11 ICICI Pru Top 100 1.06 71.84 53 Tata Equity Opportunities 1.09 82.83

PARDEEP KUMAR, Dr. HARPREET ANEJA ISSN:2349-4638 Vol.5. Issue.1.2018 (Jan-Mar)
Int.J.Buss.Mang.& Allied.Sci. (ISSN:2349-4638) 431
12 BNP Paribas Div. Yield 1.18 72.10 54 SBI Magnum Equity 1.09 83.07
13 SBI Contra 1.12 72.64 55 Franklin Ind. Opportunities 1.22 83.08
14 BNP Paribas Equity 1.33 72.83 56 Principal Dividend Yield 1.15 83.29
15 Franklin India Prima Plus 1.09 73.36 57 Rel. Focused Large Cap 1.23 83.89
16 Templeton India Growth 1.10 74.49 58 HDFC Large Cap 1.21 84.59
17 Franklin India Blue-chip 0.92 74.73 59 ICICI Pru Value Discovery 1.26 84.74
18 Baroda Pioneer Growth 0.97 75.24 60 HDFC Small and Mid-Cap 1.38 84.96
19 IDFC Classic Equity 1.23 75.29 61 BSL Advantage 1.22 85.19
20 SBI Blue Chip 1.14 75.69 62 Tata Equity PE 1.06 85.91
21 Tata Pure Equity 1.03 75.80 63 Sundaram Rural India 1.04 86.18
22 UTI Mastershare 1.01 76.11 64 Can Robeco Equity Divers 1.00 86.28
23 ICICI Pru Dynamic Plan 1.25 76.23 65 Reliance RSF - Equity 1.14 87.88
24 L&T India Large Cap 1.38 76.46 66 HSBC Equity 1.09 88.24
25 UTI India Lifestyle 1.47 76.48 67 Religare Invesco Contra 1.13 89.23
26 Religare Invesco Growth 1.32 76.94 68 Rel. Equity Opportunities 1.09 89.25
27 BSL Top 100 1.16 77.43 69 Reliance Growth 1.51 89.57
28 IDFC Imperial Equity 1.64 77.69 70 Franklin High Growth 1.18 89.82
29 LIC Nomura Growth 1.17 77.86 71 Taurus Star Share 1.07 90.19
30 Sundaram Select Focus 1.37 78.32 72 HDFC Capital Builder 1.14 90.83
31 BSL Frontline Equity 1.21 78.67 73 Reliance Top 200 1.18 91.48
32 UTI Equity 1.26 78.67 74 HSBC India Opportunities 0.84 91.50
33 Kotak 50 1.05 78.83 75 Principal Growth 1.04 93.11
34 BSL Div. Yield Plus 0.95 78.96 76 HDFC Growth 1.24 96.03
35 UTI Top 100 0.93 79.06 77 DSP-BR Opportunities 1.02 96.67
36 DSPBR Top 100 Equity 1.11 79.16 78 LIC Nomura Equity 1.12 100.07
37 SBI Magnum Multicap 0.99 79.32 79 HDFC Top 200 1.08 100.21
38 Sundaram Eqt. Multiplier 1.16 79.32 80 Reliance Vision 1.05 100.28
39 L&T Ind. Spcl. Situations 1.03 79.44 81 HDFC Core & Satellite 1.04 100.92
40 Principal Large Cap 1.07 79.69 82 HDFC Equity 0.76 106.89
41 L&T Equity 1.10 79.73 83 Sundaram Growth 1.13 110.12
42 Quantum Long-Term Eqt. 1.08 79.77 84 HDFC Premier Multicap 1.08 119.30
From table 1 it can be inferred that the VaR for the selected mutual funds varied from Rs. 55.12 to
119.30 Crore. The top funds with least value at risk on the basis of Exponentially Weighted Moving
Average Model are UTI MNC Fund, Tata Ethical Fund and Birla Sun Life (I) Opportunities Fund,
with respective VaR of Rs. 55.12, 61.33 and 64.34Crore. Sundaram Growth Fund and HDFC Premier
Multicap Fund are the worst performing with respective VaR of Rs. 110.12 and 119.30 Crore.
Again, the various ULIP-funds are ranked on the basis of VaR as shown in the table 2:

PARDEEP KUMAR, Dr. HARPREET ANEJA ISSN:2349-4638 Vol.5. Issue.1.2018 (Jan-Mar)
Int.J.Buss.Mang.& Allied.Sci. (ISSN:2349-4638) 432
Table 2: ULIP Fund Performance Ranking based on the Exponentially Weighted Moving Average
Model of VaR R
an
k
UL
IP
F
un
d
Stn
d.
De
v.
(%)
Va
R
(C
rore
Rs.
)
Ra
nk
UL
IP F
un
d
Stn
d.
De
v.
(%)
Va
R
(C
rore
Rs.
)
1 BSL Plan 1 0.32 23.67 31 HDFC Growth Pens. 1.07 78.30
2 Shriram Maximas 0.62 45.13 32 Bajaj Equity Index Pens. II 1.09 79.16
3 Bajaj Asset Allocation 0.64 46.82 33 Tata Large Cap 1.09 79.35
4 Tata Aggressive Growth 0.70 51.25 34 Bajaj Equity Index II 1.09 79.49
5
Tata Growth 0.71 51.48 35 ICICI Pru Pens. Multiplier
II
1.09 79.76
6 Tata Whole Life Aggressive 0.72 52.11 36 Bajaj Equity Index Pens. 1.09 79.77
7 LIC Growth 0.81 58.82 37 Bajaj Equity Index 1.10 79.83
8
PNB Metlife Accelerator 0.85 61.75 38 Bharti Axa Grow Money
Pens.
1.11 80.57
9 Aviva Growth 0.89 64.76 39 ICICI Pru Multiplier II 1.11 80.68
10 Bajaj Pure Stock 0.89 64.97 40 Aviva Index 1.11 81.00
11 Kotak Dynamic 0.90 65.73 41 Bharti Axa Grow Money 1.11 81.03
12 PNB Metlife Virtue 0.93 67.62 42 Tata Equity 1.11 81.08
13 ICICI Pru Flexi Growth II 0.93 67.64 43 Exide Life Equity 1.12 81.36
14 BSL Magnifier 0.94 68.32 44 ICICI Pru Maximiser II 1.12 81.48
15 ICICI Pru Pens. Rich 0.94 68.35 45 Tata Future Equity Pens. 1.12 81.82
16 ICICI Pru Flexi Growth IV 0.94 68.60 46 HDFC Equity Managed II 1.12 81.99
17 ICICI Pru Pens. Flexi Gr 0.95 69.27 47 ICICI Pru Flexi Growth 1.12 81.99
18 ICICI Pru Pens. Flexi Gr II 0.96 70.09 48 Aviva Enhancer 1.13 82.08
19 ICICI Pru Pens. Rich II 0.96 70.32 49 ICICI Pru Pens. Maximiser 1.14 82.79
20 Reliance Life Super 0.98 71.56 50 Kotak Aggressive Growth 1.15 83.50
21 HDFC Equity Managed 0.99 72.45 51 BSL Maximiser 1.17 85.35
22
HDFC Equity Managed
Pens.
1.00 72.88 52 Reliance Life Pens. Equity 1.27 92.22
23 BSL Multiplier 1.01 73.29 53 Reliance Life Equity 1.27 92.35
24 PNB Metlife Multiplier 1.04 75.66 54 Max Life Growth 1.74 126.9
25 Bajaj Equity Growth 1.04 75.75 55 SBI Growth 3.75 273.5
26 Shriram Wealth Creator 1.04 75.87 56 SBI Growth Pens. 3.85 280.3
27 Bajaj Equity Growth Pens. 1.05 76.24 57 SBI Equity Optimiser Pens. 4.17 304.1
28 Shriram Accelerator 1.05 76.52 58 SBI Equity Optimiser 4.18 304.9
29 HDFC Growth 1.06 76.95 59 SBI Equity Pens. 4.83 351.9
30 HDFC Growth II 1.06 77.23 60 SBI Equity 4.89 356.3
From table 2 it can be concluded that the VaR varied from Rs. 23.67 to 356.25 Crore. The top ULIP
funds with least value at risk on the basis of the Exponentially WeightedMoving Average Model are
BSL Plan 1 Fund, Shriram Maximas Fund and Bajaj Asset Allocation Fund with respective VaR of Rs.
23.67, 45.13, 46.82 Crore. SBI Equity Pension Fund and SBI Equity Fund are the worst performing
with respective VaR of Rs 351.91and 356.25 Crore.
Performance Comparison: By using the values in Table 1 and Table 2 it can be seen that the least VaR
by the mutual funds is Rs. 65.62 Crore, which is significantly greater than that of the top ranked ULIP

PARDEEP KUMAR, Dr. HARPREET ANEJA ISSN:2349-4638 Vol.5. Issue.1.2018 (Jan-Mar)
Int.J.Buss.Mang.& Allied.Sci. (ISSN:2349-4638) 433
fund i.e. Rs. 47.91 Crore. But, out of 10 lowest rankings only one belongs to the mutual funds,
whereas 9 belong to the ULIP funds. From this it can be implied that the ULIP funds have been
outperformed by the mutual funds during the period of study on the basis of the Exponentially
Weighted Moving Average Model of VaR.
5.2 Fund Performance Ranking:GARCH (1, 1) Model
The selected mutual-funds are ranked on the basis of VaR as shown in the table 3:
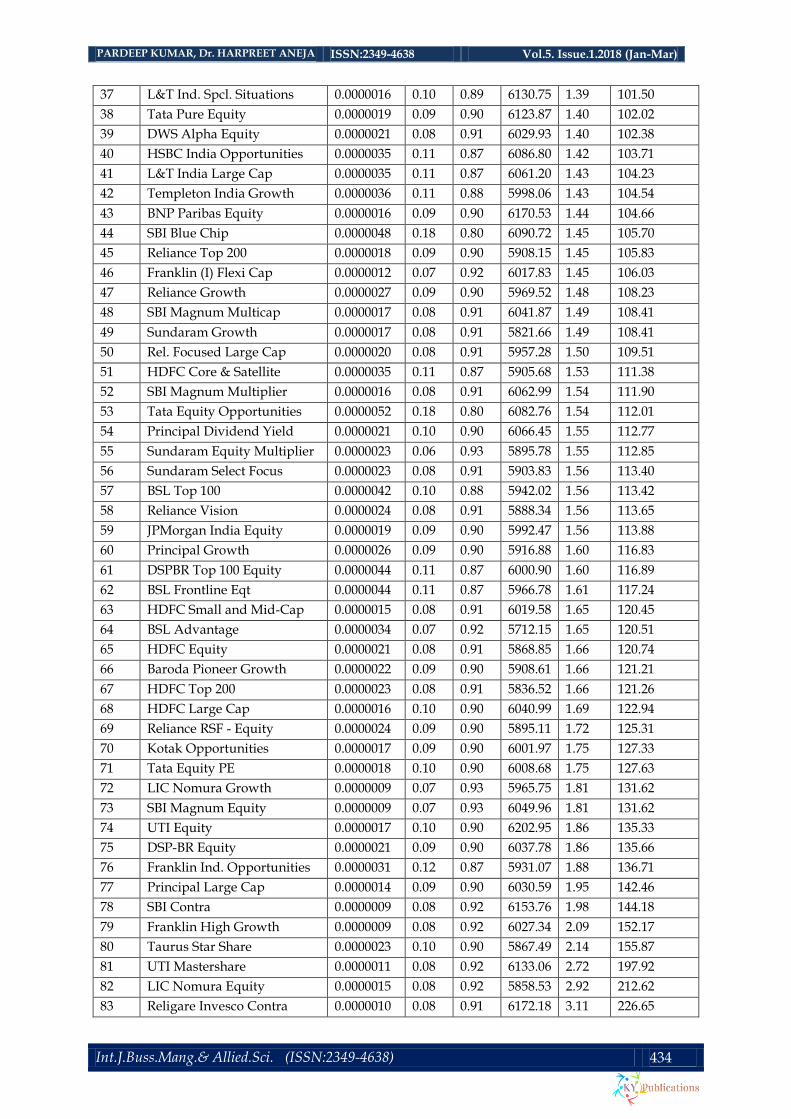
Table 3: Mutual Fund Performance Ranking based on the GARCH (1, 1) Model
Rank Mutual Fund ω α β MLE Stnd.
Dev.
VaR (Crore
Rs.)
1 UTI Top 100 0.0000011 0.08 0.91 6096.04 0.86 62.75
2 UTI MNC 0.0000041 0.15 0.80 6636.94 0.90 65.69
3 ICICI Pru Multicap 0.0000018 0.06 0.92 5995.30 1.07 77.69
4 BSL International Equity 0.0000062 0.15 0.80 6373.67 1.09 79.48
5 ICICI Pru Indo Asia Equity 0.0000031 0.17 0.80 6506.15 1.10 80.19
6 Tata Ethical 0.0000014 0.11 0.88 6426.92 1.13 82.25
7 UTI India Lifestyle 0.0000019 0.08 0.91 6217.68 1.16 84.51
8 ICICI Pru Exports/Serv. 0.0000018 0.08 0.90 6099.47 1.19 87.07
9 HDFC Capital Builder 0.0000020 0.10 0.88 6172.02 1.20 87.20
10 Rel. Equity Opportunities 0.0000026 0.08 0.90 6043.58 1.20 87.22
11 BSL (I) Opportunities 0.0000030 0.04 0.94 5997.40 1.22 88.63
12 BSL India GenNext 0.0000042 0.09 0.88 6137.91 1.23 89.63
13 Quantum Long-Term Eqt. 0.0000043 0.17 0.80 6277.77 1.24 90.15
14 Religare Invesco Growth 0.0000065 0.18 0.78 6221.54 1.24 90.45
15 BSL Div. Yield Plus 0.0000022 0.10 0.89 6302.54 1.24 90.57
16 HSBC Equity 0.0000092 0.14 0.80 5997.47 1.24 90.61
17 UTI Dividend Yield 0.0000020 0.09 0.90 6219.09 1.25 90.84
18 Sundaram Rural India 0.0000015 0.06 0.93 5997.78 1.26 91.48
19 Can Robeco Equity Divers 0.0000018 0.10 0.89 6089.33 1.26 91.53
20 Franklin India Blue-chip 0.0000018 0.10 0.89 6145.81 1.26 91.53
21 HDFC Growth 0.0000020 0.08 0.91 5999.46 1.26 91.87
22 BNP Paribas Div. Yield 0.0000015 0.10 0.89 6328.29 1.27 92.50
23 ICICI Pru Top 100 0.0000021 0.08 0.91 6044.25 1.27 92.58
24 Mirae (I) Opportunities 0.0000028 0.10 0.88 5994.65 1.28 93.39
25 ICICI Pru Value Discovery 0.0000029 0.11 0.87 6200.81 1.30 94.55
26 DSP-BR Opportunities 0.0000029 0.11 0.87 6062.82 1.30 94.57
27 HDFC Premier Multicap 0.0000029 0.11 0.87 5944.67 1.30 94.57
28 IDFC Imperial Equity 0.0000029 0.11 0.87 6067.35 1.30 94.57
29 Kotak Classic Equity 0.0000029 0.11 0.87 6110.36 1.30 94.57
30 L&T Equity 0.0000029 0.11 0.87 6123.04 1.30 94.57
31 UTI Opportunities 0.0000029 0.11 0.87 6137.48 1.30 94.57
32 IDFC Classic Equity 0.0000025 0.10 0.89 6067.36 1.31 95.74
33 BSL Equity 0.0000046 0.06 0.91 5853.01 1.33 96.82
34 Franklin India Prima Plus 0.0000060 0.17 0.80 6120.65 1.36 98.94
35 Kotak 50 0.0000019 0.09 0.90 6053.38 1.37 99.82
36 DWS Invest. Opportunity 0.0000021 0.09 0.90 6025.62 1.39 101.13
PARDEEP KUMAR, Dr. HARPREET ANEJA ISSN:2349-4638 Vol.5. Issue.1.2018 (Jan-Mar)
Int.J.Buss.Mang.& Allied.Sci. (ISSN:2349-4638) 434
37 L&T Ind. Spcl. Situations 0.0000016 0.10 0.89 6130.75 1.39 101.50
38 Tata Pure Equity 0.0000019 0.09 0.90 6123.87 1.40 102.02
39 DWS Alpha Equity 0.0000021 0.08 0.91 6029.93 1.40 102.38
40 HSBC India Opportunities 0.0000035 0.11 0.87 6086.80 1.42 103.71
41 L&T India Large Cap 0.0000035 0.11 0.87 6061.20 1.43 104.23
42 Templeton India Growth 0.0000036 0.11 0.88 5998.06 1.43 104.54
43 BNP Paribas Equity 0.0000016 0.09 0.90 6170.53 1.44 104.66
44 SBI Blue Chip 0.0000048 0.18 0.80 6090.72 1.45 105.70
45 Reliance Top 200 0.0000018 0.09 0.90 5908.15 1.45 105.83
46 Franklin (I) Flexi Cap 0.0000012 0.07 0.92 6017.83 1.45 106.03
47 Reliance Growth 0.0000027 0.09 0.90 5969.52 1.48 108.23
48 SBI Magnum Multicap 0.0000017 0.08 0.91 6041.87 1.49 108.41
49 Sundaram Growth 0.0000017 0.08 0.91 5821.66 1.49 108.41
50 Rel. Focused Large Cap 0.0000020 0.08 0.91 5957.28 1.50 109.51
51 HDFC Core & Satellite 0.0000035 0.11 0.87 5905.68 1.53 111.38
52 SBI Magnum Multiplier 0.0000016 0.08 0.91 6062.99 1.54 111.90
53 Tata Equity Opportunities 0.0000052 0.18 0.80 6082.76 1.54 112.01
54 Principal Dividend Yield 0.0000021 0.10 0.90 6066.45 1.55 112.77
55 Sundaram Equity Multiplier 0.0000023 0.06 0.93 5895.78 1.55 112.85
56 Sundaram Select Focus 0.0000023 0.08 0.91 5903.83 1.56 113.40
57 BSL Top 100 0.0000042 0.10 0.88 5942.02 1.56 113.42
58 Reliance Vision 0.0000024 0.08 0.91 5888.34 1.56 113.65
59 JPMorgan India Equity 0.0000019 0.09 0.90 5992.47 1.56 113.88
60 Principal Growth 0.0000026 0.09 0.90 5916.88 1.60 116.83
61 DSPBR Top 100 Equity 0.0000044 0.11 0.87 6000.90 1.60 116.89
62 BSL Frontline Eqt 0.0000044 0.11 0.87 5966.78 1.61 117.24
63 HDFC Small and Mid-Cap 0.0000015 0.08 0.91 6019.58 1.65 120.45
64 BSL Advantage 0.0000034 0.07 0.92 5712.15 1.65 120.51
65 HDFC Equity 0.0000021 0.08 0.91 5868.85 1.66 120.74
66 Baroda Pioneer Growth 0.0000022 0.09 0.90 5908.61 1.66 121.21
67 HDFC Top 200 0.0000023 0.08 0.91 5836.52 1.66 121.26
68 HDFC Large Cap 0.0000016 0.10 0.90 6040.99 1.69 122.94
69 Reliance RSF - Equity 0.0000024 0.09 0.90 5895.11 1.72 125.31
70 Kotak Opportunities 0.0000017 0.09 0.90 6001.97 1.75 127.33
71 Tata Equity PE 0.0000018 0.10 0.90 6008.68 1.75 127.63
72 LIC Nomura Growth 0.0000009 0.07 0.93 5965.75 1.81 131.62
73 SBI Magnum Equity 0.0000009 0.07 0.93 6049.96 1.81 131.62
74 UTI Equity 0.0000017 0.10 0.90 6202.95 1.86 135.33
75 DSP-BR Equity 0.0000021 0.09 0.90 6037.78 1.86 135.66
76 Franklin Ind. Opportunities 0.0000031 0.12 0.87 5931.07 1.88 136.71
77 Principal Large Cap 0.0000014 0.09 0.90 6030.59 1.95 142.46
78 SBI Contra 0.0000009 0.08 0.92 6153.76 1.98 144.18
79 Franklin High Growth 0.0000009 0.08 0.92 6027.34 2.09 152.17
80 Taurus Star Share 0.0000023 0.10 0.90 5867.49 2.14 155.87
81 UTI Mastershare 0.0000011 0.08 0.92 6133.06 2.72 197.92
82 LIC Nomura Equity 0.0000015 0.08 0.92 5858.53 2.92 212.62
83 Religare Invesco Contra 0.0000010 0.08 0.91 6172.18 3.11 226.65

PARDEEP KUMAR, Dr. HARPREET ANEJA ISSN:2349-4638 Vol.5. Issue.1.2018 (Jan-Mar)
Int.J.Buss.Mang.& Allied.Sci. (ISSN:2349-4638) 435
84 ICICI Pru Dynamic Plan 0.0000020 0.15 0.85 6386.66 4.44 323.72
From table 3 it can be inferred that the VaR varied from Rs. 62.75 to 323.72 Crore. The top funds with
least value at risk are UTI Top 100 Fund, UTI MNC Fund, ICICI Prudential Multicap Fund with
respective VaR of Rs. 62.75, 65.69, 77.69 Crore . Religare Invesco Contra Fund, ICICI Prudential
Dynamic Plan Fund are the worst performing with respective VaR of Rs., 110.12 and 119.30 Crore.
Again, table 4 depicts the ULIP Fund Performance Ranking based on the GARCH (1, 1) Model:
Table 4: ULIP Fund Performance Ranking based on the GARCH (1, 1) Model
Rank
Mu
tua
l F
un
d
ω α β MLE
Stn
d. D
ev.
Va
R
(Cro
re R
s.)
1 Bajaj Asset Allocation 0.0000011 0.08 0.88 7285.86 0.47 34.33
2 Tata Whole Life Aggressive 0.0000018 0.11 0.86 6785.57 0.81 59.22
3 Aviva Growth 0.0000023 0.08 0.89 6581.59 0.85 62.19
4 Reliance Life Super 0.0000016 0.10 0.88 6463.83 0.90 65.27
5 Shriram Maximas 0.0000015 0.11 0.87 6695.53 0.92 66.87
6 Tata Growth 0.0000020 0.11 0.87 6671.65 0.97 70.68
7 Max Life Growth 0.0000008 0.08 0.91 6981.12 0.98 71.06
8 BSL Plan 1 0.0000009 0.10 0.89 6647.25 1.00 72.56
9 Kotak Dynamic 0.0000028 0.10 0.87 6442.58 1.00 72.65
10 HDFC Growth II 0.0000019 0.06 0.92 6012.02 1.01 73.58
11 Tata Aggressive Growth 0.0000012 0.11 0.88 6728.89 1.03 74.91
12 ICICI Pru Pens. Rich 0.0000011 0.07 0.93 6236.67 1.08 79.07
13 HDFC Equity Managed II 0.0000070 0.04 0.91 6183.36 1.12 81.61
14 Bajaj Pure Stock 0.0000022 0.11 0.87 6458.31 1.16 84.41
15 HDFC Growth Pens. 0.0000017 0.06 0.92 5999.25 1.23 89.48
16 ICICI Pru Flexi Growth 0.0000020 0.09 0.90 6219.13 1.23 89.67
17 PNB Metlife Accelerator 0.0000014 0.10 0.89 6364.81 1.23 89.84
18 Reliance Life Equity 0.0000020 0.08 0.90 6029.49 1.26 91.61
19 ICICI Pru Flexi Growth II 0.0000016 0.10 0.89 6246.41 1.26 91.63
20 ICICI Pru Flexi Growth IV 0.0000015 0.10 0.89 6249.46 1.27 92.55
21 Bajaj Equity Growth 0.0000021 0.10 0.89 6183.30 1.27 92.92
22 ICICI Pru Pens. Flexi Gr 0.0000015 0.09 0.90 6239.01 1.28 93.19
23 HDFC Equity Managed 0.0000048 0.17 0.80 6294.70 1.29 94.34
24 SBI Growth 0.0000013 0.11 0.88 6318.73 1.30 94.56
25 Bajaj Equity Growth Pens. 0.0000029 0.11 0.87 6166.57 1.30 94.57
26 ICICI Pru Maximiser II 0.0000029 0.11 0.87 6011.21 1.30 94.57
27 ICICI Pru Pens. Maximiser 0.0000029 0.11 0.87 6026.81 1.30 94.57
28 Reliance Life Pens. Equity 0.0000029 0.11 0.87 6024.01 1.30 94.57
29 ICICI Pru Pens. Flexi Gr II 0.0000016 0.10 0.89 6227.15 1.32 95.92
30 BSL Magnifier 0.0000017 0.10 0.89 6168.53 1.41 102.61
31 ICICI Pru Pens. Rich II 0.0000014 0.09 0.90 6223.68 1.43 104.48
32 Bajaj Equity Index 0.0000028 0.10 0.89 5870.02 1.45 105.58
33 PNB Metlife Virtue 0.0000014 0.10 0.89 6186.16 1.46 106.47
34 Aviva Enhancer 0.0000023 0.10 0.89 6048.32 1.49 108.41

PARDEEP KUMAR, Dr. HARPREET ANEJA ISSN:2349-4638 Vol.5. Issue.1.2018 (Jan-Mar)
Int.J.Buss.Mang.& Allied.Sci. (ISSN:2349-4638) 436
35 Shriram Accelerator 0.0000017 0.08 0.91 5921.52 1.50 109.35
36 Kotak Aggressive Growth 0.0000019 0.08 0.91 5968.13 1.53 111.27
37 Aviva Index 0.0000042 0.12 0.86 5847.38 1.58 115.24
38 ICICI Pru Pens. Multiplier II 0.0000018 0.09 0.90 5990.83 1.61 117.19
39 Exide Life Equity 0.0000020 0.09 0.90 6002.27 1.62 117.95
40 BSL Multiplier 0.0000020 0.10 0.89 6076.72 1.62 117.96
41 HDFC Equity Managed Pens. 0.0000008 0.08 0.92 6304.44 1.71 124.53
42 BSL Maximiser 0.0000019 0.10 0.90 5917.39 1.74 126.55
43 HDFC Growth 0.0000015 0.09 0.90 6005.55 1.88 136.85
44 PNB Metlife Multiplier 0.0000024 0.10 0.89 5951.93 1.92 139.85
45 Bajaj Equity Index II 0.0000015 0.08 0.92 5840.07 1.93 140.94
46 Tata Future Equity Pens. 0.0000009 0.06 0.94 6007.80 1.94 141.23
47 Shriram Wealth Creator 0.0000016 0.08 0.91 5906.53 1.96 142.97
48 SBI Equity Optimiser Pens. 0.0000017 0.10 0.90 6026.80 2.12 154.85
49 Bharti Axa Grow Money 0.0000055 0.14 0.85 5790.43 2.18 159.12
50 Tata Equity 0.0000013 0.09 0.91 5962.34 2.19 159.67
51 SBI Equity Pens. 0.0000023 0.10 0.90 5827.55 2.44 177.56
52 SBI Growth Pens. 0.0000010 0.10 0.90 6232.89 2.47 180.22
53 SBI Equity Optimiser 0.0000016 0.10 0.90 6035.59 2.86 208.25
54 LIC Growth 0.0000010 0.09 0.90 6465.42 3.19 232.39
55 SBI Equity 0.0000021 0.10 0.90 5865.58 3.22 234.92
56 Tata Large Cap 0.0000011 0.08 0.92 6028.21 3.29 239.67
57 Bajaj Equity Index Pens. II 0.0000011 0.08 0.91 5861.95 3.35 243.98
58 ICICI Pru Multiplier II 0.0000012 0.10 0.90 6075.99 3.48 253.58
59 Bajaj Equity Index Pens. 0.0000012 0.08 0.92 5863.87 3.49 254.09
60 Bharti Axa Grow Money Pens. 0.0000014 0.09 0.91 5909.99 3.68 268.36
From table 4 it can be concluded that the VaR varied from Rs. 34.33 to 268.36 Crore. The top ULIP
funds are BSL Plan 1Fund, Bajaj Asset Allocation Fund, Tata Whole Life Aggressive Fund with VaR of
Rs. 34.33, 59.22, 62.19 Crore. Bajaj Equity Index Pension Fund and Bharti Axa Grow Money Pension
Fund are the worst performing.
Performance Comparison: The top 10 comprehensive rankings based on VaR include eight ULIP
funds and two mutual funds. But, out of 10 lowest rankings only three belongs to the mutual funds,
whereas seven belong to the ULIP funds. From this it can be implied that the ULIP funds have been
outperformed by the mutual funds during the period of study on the basis of GARCH (1, 1) Model of
VaR.
6. CONCLUSION
Value-at-risk(VaR) methodology is emerging as a better alternative for the performance
measurement of funds. It has been observed that on the basis of VaRmutual funds outperform the
unit linked insurance plan funds.
REFERENCES
[1]. Agarwal, S. and Mirza, N.(2017), Nawazish A study on the risk-adjusted performance of
mutual funds industry in India, Review of Innovation and Competitiveness, Volume3- ISSUE
1, pp. 75-94
[2]. Beder, T., (1995), VAR: Seductive But Dangerous, Financial Analysts Journal, pp.12-24
[3]. Deb, S. G. and Banerjee, A. (2009), Downside Risk Analysis of Indian Equity Mutual Funds: A
Value at Risk Approach, IRJFE,23, pp. 216-230.
[4]. Gupta, A. and Bing L., (2005), Do Hedge Funds Have Enough Capital? A Value at Risk

PARDEEP KUMAR, Dr. HARPREET ANEJA ISSN:2349-4638 Vol.5. Issue.1.2018 (Jan-Mar)
Int.J.Buss.Mang.& Allied.Sci. (ISSN:2349-4638) 437
Approach, Journal of Financial Economics 77, pp.219-253
[5]. Group of Thirty. (1993), Derivatives: Practices and Principles. Washington,DC.
[6]. Hendricks, D., (1996), Evaluation of Value-at-Risk Models Using Historical Data, Federal
Reserve Bank of New York Economic Policy Review 2, pp. 39-70
[7]. Johansson. F.S. and Michael J.T., (1999), Measuring Downside Portfolio Risk, Journal of
Portfolio Management, Fall 1999,26,1 pp. 96-106
[8]. Jorion, P., (2007). Value at Risk: The New Benchmark for Managing Financial Risk. 3rd
edition. New York: McGraw-Hill.
[9]. Jorion, P. (1997), Value at Risk: The New Benchmark for Controlling Market Risk, Irwin
Professional: Illinois.
[10]. Sahi et. al.(2013),Value at risk methodology for measuring performance of mutual funds,
Asian Journal Of Management Research, Vol-4, Issue-1, pp. 114-129