international summit on the teaching profession …talis2018.nl/gfx/content/istp 2017.pdf · key...
TRANSCRIPT

Key Topics of the 2017 International Summit on the Teaching Profession
International Summit on the Teaching Profession
Empowering and Enabling Teachers to Improve Equity and Outcomes for All Montserrat Gomendio


Empowering and Enabling Teachers to Improve Equity
and Outcomes for All
International Summit on the Teaching Profession
Montserrat Gomendio
The statistical data for Israel are supplied by and under the responsibility of the relevant Israeli authorities. The use of such data by the OECD is without prejudice to the status of the Golan Heights, East Jerusalem and Israeli settlements in the West Bank under the terms of international law.
Photo credits: © AsiaPix / Inmagine© Jose Luis Pelaez, Inc. / Blend Images/Corbis
Corrigenda to OECD publications may be found on line at: www.oecd.org/about/publishing/corrigenda.htm.
© OECD 2017
You can copy, download or print OECD content for your own use, and you can include excerpts from OECD publications, databases
and multimedia products in your own documents, presentations, blogs, websites and teaching materials, provided that suitable
acknowledgment of the source and copyright owner is given. All requests for public or commercial use and translation rights should
be submitted to [email protected]. Requests for permission to photocopy portions of this material for public or commercial use shall be
addressed directly to the Copyright Clearance Center (CCC) at [email protected] or the Centre français d’exploitation du droit de copie
(CFC) at [email protected].
This work is published under the responsibility of the Secretary-General of the OECD. The
opinions expressed and arguments employed herein do not necessarily reflect the official
views of the OECD member countries.
This document and any map included herein are without prejudice to the status of or
sovereignty over any territory, to the delimitation of international frontiers and boundaries
and to the name of any territory, city or area.
Please cite this publication as: Gomendio, M. (2017), Empowering and Enabling Teachers to Improve Equity and Outcomes for All, International Summit on the Teaching Profession, OECD Publishing, Paris.
http://dx.doi.org/10.1787/9789264273238-en
ISBN 978-92-64-27322-1 (print)ISBN 978-92-64-27323-8 (PDF)
Series: International Summit on the Teaching ProfessionISSN 2312-7082 (print)ISSN 2312-7090 (online)

3EMPOWERING AND ENABLING TEACHERS TO IMPROVE EQUITY AND OUTCOMES FOR ALL © OECD 2017
Foreword
The expectations for teachers are high and rising each day. We expect teachers to have a deep understanding of what they teach and to keep up with the rapidly expanding knowledge base; to be passionate, compassionate and thoughtful; to make learning central and encourage students’ engagement and responsibility; to respond effectively to students of different needs, backgrounds and mother tongues, and to promote tolerance and social cohesion; to provide continual assessments of students and feedback; and to ensure that students feel valued and included and that learning is collaborative. We also expect teachers themselves to collaborate and work in teams, and with other schools and parents, to set common goals, and plan and monitor the attainment of goals collaboratively. And there is more to this: successful learners generally had a teacher who was a mentor and took a real interest in their aspirations, who helped students understand who they are, discover what their passions are and where they can capitalise on their specific strength; who taught them how to love to learn and to build effective learning strategies as the foundation for lifelong learning.
All of this is easy to say, hard to do. But one thing is clear, where teachers are not part of the design of effective policies and practices, they won’t be effective in their implementation. Education needs to do more to create a teaching profession that owns its professional practice. When teachers feel a sense of ownership over their classrooms and their profession, when students feel a sense of ownership over their learning, that is when productive learning takes place. And when teachers assume that ownership, it is difficult to ask more of them than they ask of themselves. So the answer is to strengthen trust, transparency, professional autonomy and the collaborative culture of the profession all at the same time.
The International Summit on the Teaching Profession, which brings together Ministers and Union leaders of the best performing and most rapidly improving education systems each year, has proved the ideal platform to move the search for effective teacher policies and practices forward. And one of the secrets of the success of the Summit has been that it explores difficult and controversial issues on the basis of sound evidence, provided by the OECD as global leader for internationally comparable data and analysis. This publication summarises the evidence that underpins the 2017 summit.
Andreas SchleicherDirector for Education and Skills and Special Advisor
on Education Policy to the Secretary-General

5EMPOWERING AND ENABLING TEACHERS TO IMPROVE EQUITY AND OUTCOMES FOR ALL © OECD 2017
Acknowledgements
The report was prepared by Montserrat Gomendio, Deputy Director for Education and Skills. It is based on data and comparative analyses from several OECD publications: TALIS 2013 Results: An International Perspective on Teaching and Learning (2014); PISA 2015 Results (Volumes I and II) (2016); TALIS School Leadership for Learning: Insights from TALIS 2013 (2016); Synergies for Better Learning: An International Perspective on Evaluation and Assessment (2013); Education Policy Outlook: Making Reforms Happen (2015); and Governing Education in a Complex World (2016).
Andreas Schleicher and Karine Tremblay provided expert advice. Most of the Directorate contributed materials and ideas. The following people kindly gave constructive feedback on preliminary versions: Yuri Belfali, Cassandra Davis, Alfonso Echezarra, Pablo Fraser, Paulo Santiago, Diana Toledo, Karine Tremblay and Dirk van Damme.
Susan Copeland edited the text. Raven Gaddy, Sophie Limoges and Elizabeth Morgan co-ordinated production of the report.


Table of Contents
7EMPOWERING AND ENABLING TEACHERS TO IMPROVE EQUITY AND OUTCOMES FOR ALL © OECD 2017
Table of Contents
EXECUTIVE SUMMARY ........................................................................................................................................................................................................................11
CHAPTER 1 PROFESSIONAL LEARNING AND DEVELOPMENT TO SUPPORT TEACHERS’ WORK ....................................................13
• New demands on teaching professionals ...................................................................................................................................................................14Evolving goals of education systems .............................................................................................................................................................................14Changing roles of schools and teachers ......................................................................................................................................................................18
• Professionalism in teaching .................................................................................................................................................................................................19Improving the teaching profession .................................................................................................................................................................................19Major domains in teacher professionalism ................................................................................................................................................................22Developing teacher’s skills ..................................................................................................................................................................................................23Pre-service training .................................................................................................................................................................................................................24Teacher certification ...............................................................................................................................................................................................................27In-service training and lifelong learning......................................................................................................................................................................29Impact of teachers’ participation in professional development .....................................................................................................................34
• Professional autonomy and evidence-informed decisions .............................................................................................................................34The importance of school governance and autonomy for system performance ...................................................................................34Responsibility for school governance and school autonomy ..........................................................................................................................36Reaping the full benefits of autonomy .........................................................................................................................................................................39
• Collaboration with colleagues ...........................................................................................................................................................................................44• Working environment, workload and classroom management to enhance teachers’ well-being and efficacy..........46
Time spent on teaching and other tasks ......................................................................................................................................................................47School climate and teachers’ well-being and effectiveness .............................................................................................................................48
CHAPTER 2 ENSURING APPROPRIATE NATIONAL EDUCATION STRUCTURES AND POLICY ENVIRONMENT ...................55
• Governing complex education systems .......................................................................................................................................................................56• Steering education systems effectively .........................................................................................................................................................................56
Patterns and trends of education governance in OECD countries ................................................................................................................57Policy options to steer education systems ..................................................................................................................................................................58
• Creating structures to foster educational reform and change at the classroom level ....................................................................62Reforms aimed at improving student learning .........................................................................................................................................................62Evaluation and assessment to improve student outcomes .................................................................................................................................65
• Building on research and evidence in policy development ...........................................................................................................................69• Enhancing policy evaluation from inception to implementation ...............................................................................................................72
Challenges in implementing school improvement reforms ..............................................................................................................................72The potential of partnerships with the profession itself.......................................................................................................................................72Dealing with the policy agenda .......................................................................................................................................................................................74Evaluating impact .....................................................................................................................................................................................................................75Common success factors, but no single model for success ..............................................................................................................................75
Table of Contents
8 © OECD 2017 EMPOWERING AND ENABLING TEACHERS TO IMPROVE EQUITY AND OUTCOMES FOR ALL
CHAPTER 3 STRIVING FOR SUSTAINABLE EXCELLENCE AND EQUITY IN LEARNING ...........................................................................79
• Many common challenges, including support for schools in areas of deprivation ........................................................................80Starting strong with high-quality early childhood education and care ......................................................................................................80Enhancing performance at the end of compulsory education ........................................................................................................................82
• Trends in equity in education .............................................................................................................................................................................................88General equity strategies ......................................................................................................................................................................................................90Fostering gender equality .....................................................................................................................................................................................................91Supporting students of immigrant background ........................................................................................................................................................94Strategies targeting students of immigrant background.......................................................................................................................................97Tackling dropouts .....................................................................................................................................................................................................................98
• What works and why: Some insights from the progress of top-performing education systems .............................................99Provide access to quality early education for all children ................................................................................................................................99Design equity strategies adapted to the performance and equity profile of the system.................................................................100Provide additional support for disadvantaged schools and students ........................................................................................................101Reduce gender disparities ................................................................................................................................................................................................103Support immigrant students .............................................................................................................................................................................................104Prevent student dropout ....................................................................................................................................................................................................105
• Conclusion ...................................................................................................................................................................................................................................106
BOXESBox 1.1 Review of teacher standards in Wales (United Kingdom) ...................................................................................................................................20
Box 1.2 New professional standards and continuous professional development system for teachers in Estonia ..............................................20
Box 1.3 Professional learning communities.............................................................................................................................................................................22
Box 1.4 Nurturing excellence in teachers in Finland ...........................................................................................................................................................26
Box 1.5 Reforms to improve initial teacher preparation in Australia ...............................................................................................................................26
Box 1.6 Major reform of teacher education in Denmark ....................................................................................................................................................27
Box 1.7 Making the teaching profession more attractive in Sweden ...............................................................................................................................29
Box 1.8 The Education Cooperative in the Netherlands ......................................................................................................................................................29
Box 1.9 Making time for professional development in Singapore ....................................................................................................................................31
Box 1.10 Assessment and trend analysis in Germany’s federal system .............................................................................................................................40
Box 1.11 The Learning and Change Networks strategy in New Zealand .........................................................................................................................45
Box 2.1 Bipartisan large-scale reforms in Denmark and Mexico......................................................................................................................................59
Box 2.2 Better Public Service Programme in New Zealand ...............................................................................................................................................59
Box 2.3 Portugal’s Agreement on Reorganisation of the School Network (2010) ........................................................................................................60
Box 2.4 Strengthening local capacity in Finland, Germany and the Netherlands .......................................................................................................60
Box 2.5 Education Scotland ..........................................................................................................................................................................................................60
Box 2.6 The Pupil Premium in England (United Kingdom) ................................................................................................................................................61
Box 2.7 Comprehensive school improvement strategies .....................................................................................................................................................63
Box 2.8 Finland.................................................................................................................................................................................................................................63
Box 2.9 Curriculum reforms focusing on core competencies ............................................................................................................................................64
Box 2.10 Curriculum reforms focusing on values and socio-emotional skills ................................................................................................................65
Box 2.11 Comprehensive approaches to education system evaluation ............................................................................................................................66
Box 2.12 Using assessment results to improve student learning .........................................................................................................................................68
Box 2.13 The Education Cooperative in the Netherlands ......................................................................................................................................................71
Box 2.14 Involving the profession in policy design .................................................................................................................................................................74
Box 3.1 Promoting equity and diversity in the United States ............................................................................................................................................89
Box 3.2 Improving opportunities for disadvantaged students in Ireland.........................................................................................................................91
Box 3.3 Targeted education policies for successful integration of refugees in Germany ..........................................................................................98
Box 3.4 The Attainment Challenge in Scotland (United Kingdom) ............................................................................................................................... 101
Box 3.5 Focused intervention for primary schools in Ontario (Canada) ...................................................................................................................... 103

Table of Contents
9EMPOWERING AND ENABLING TEACHERS TO IMPROVE EQUITY AND OUTCOMES FOR ALL © OECD 2017
FIGURES
Figure 1.1 Literacy proficiency, by level of educational attainment (25-65 year-olds) ...................................................................................................14
Figure 1.2 Average three-year trend in science performance since 2006 ...........................................................................................................................15
Figure 1.3 Fifteen-year-olds’ proficiency in science ..................................................................................................................................................................16
Figure 1.4 Percentage of low-achieving students and top performers in science in 2006 and 2015 .........................................................................17
Figure 1.5 Position of teacher cognitive skills in the skill distribution of college graduates .........................................................................................23
Figure 1.6 Student performance and teacher cognitive skills .................................................................................................................................................24
Figure 1.7 Teacher selection (2013) ................................................................................................................................................................................................25
Figure 1.8 Duration of initial teacher education (2013) ...........................................................................................................................................................25
Figure 1.9 Percentage of fully certified teachers, school characteristics and science performance ...........................................................................28
Figure 1.10 Teachers’ needs for professional development (2013) .........................................................................................................................................30
Figure 1.11 Requirements for teachers’ professional development (2013) ...........................................................................................................................31
Figure 1.12 Level of personal payment for teachers’ professional development participation (2013) .........................................................................32
Figure 1.13 Professional development recently undertaken by teachers by type and intensity (2013) .......................................................................33
Figure 1.14 Correlation between participation in school embedded professional development and teacher reports of instructional impact by country ..............................................................................................................................................................................33
Figure 1.15 Index of school autonomy, school characteristics and science performance ...............................................................................................35
Figure 1.16 Correlations between the responsibilities for school governance and science performance ..................................................................37
Figure 1.17 Correlations between the responsibilities for school governance and equity in science performance ................................................37
Figure 1.18 Summary of responsibilities for school governance ..............................................................................................................................................38
Figure 1.19 Correlations between the responsibilities for school governance and science performance, by educational leadership ..............39
Figure 1.20 Correlations between the responsibilities for school governance and science performance, by use of mandatory standardised tests .....................................................................................................................................................................40
Figure 1.21 Teacher-directed teaching practices and science performance .........................................................................................................................42
Figure 1.22 School autonomy and adaptive instruction in science lessons..........................................................................................................................43
Figure 1.23 Enquiry-based teaching practices and science performance .............................................................................................................................44
Figure 1.24 Number of teaching hours per year, by level of education (2014) ...................................................................................................................47
Figure 1.25 Percentage of lower secondary teachers’ working time spent teaching (2014) ............................................................................................48
Figure 1.26 Index of disciplinary climate in science classes, school characteristics and science outcomes .............................................................49
Figure 1.27 Student and teacher behaviour hindering learning and science performance .............................................................................................50
Figure 2.1 An overview of governance arrangements across OECD countries .................................................................................................................57
Figure 2.2 Factors associated with science performance .........................................................................................................................................................70
Figure 3.1 Enrolment rates at age 3 and 4 in early childhood and primary education (2014) .....................................................................................80
Figure 3.2 Mean performance in science and strength of the socio-economic gradient ...............................................................................................82
Figure 3.3 Mean performance in science, by international decile on the PISA index of economic, social and cultural status ........................84
Figure 3.4 Percentage of resilient students....................................................................................................................................................................................86
Figure 3.5 Differences in educational resources between advantaged and disadvantaged schools ...........................................................................87
Figure 3.6 Schools with more than 30% of students from socio-economically disadvantaged homes .....................................................................88
Figure 3.7 Change between 2006 and 2015 in the slope of the socio-economic gradient and average 3-year trend in science performance ..................................................................................................................................................................................................89
Figure 3.8 Gender differences among top performers in science..........................................................................................................................................92
Figure 3.9 Gender differences among low-achieving students in science .........................................................................................................................93
Figure 3.10 Expectations of a science career, by gender ............................................................................................................................................................94
Figure 3.11 Percentage of immigrant students and education systems’ average performance in science ..................................................................95
Figure 3.12 Student performance in science, by immigrant background ..............................................................................................................................96
Figure 3.13 Percentage of 25-34 year-old adults with below upper secondary education, by gender (2015) ..........................................................99
Figure 3.14 Percentage of NEETs among 20-24 year-olds, by gender (2015) ......................................................................................................................99
Table of Contents
10 © OECD 2017 EMPOWERING AND ENABLING TEACHERS TO IMPROVE EQUITY AND OUTCOMES FOR ALL
TABLESTable 1.1 Differences between a semi-profession and a profession ...................................................................................................................................19
Table 1.2 Policy targeting the teaching profession (2008-14) ...............................................................................................................................................21
Table 1.3 Association between types of leadership and the dimensions of professional learning communities, across educational levels ...............................................................................................................................................................................................45
Table 2.1 Policies targeting governance (2008-14) ..................................................................................................................................................................58
Table 2.2 Policies to develop positive learning environments (2008-14) ..........................................................................................................................62
Table 2.3 Policies to guide evaluation and assessment at the system level (2008-14) ..................................................................................................66
Table 2.4 Policies for student assessment (2008-14) ................................................................................................................................................................67
Table 2.5 Education Policy Outlook policy levers (2008-14) ................................................................................................................................................73
Table 3.1 Policies to consolidate early childhood education and care (2008-14) .........................................................................................................81
Table 3.2 Policies to support disadvantaged students and schools (2008-14) .................................................................................................................90
Table 3.3 Policies to increase completion of upper secondary education (2008-14) ................................................................................................ 106
Look for the StatLinks2at the bottom of the tables or graphs in this book. To download the matching Excel® spreadsheet, just type the link into your Internet browser, starting with the http://dx.doi.org pre�x, or click on the link from the e-book edition.
Follow OECD Publications on:
This book has... StatLinks2A service that delivers Excel �les from the printed page! ®
http://twitter.com/OECD_Pubs
http://www.facebook.com/OECDPublications
http://www.linkedin.com/groups/OECD-Publications-4645871
http://www.youtube.com/oecdilibrary
http://www.oecd.org/oecddirect/ OECD
Alerts

11EMPOWERING AND ENABLING TEACHERS TO IMPROVE EQUITY AND OUTCOMES FOR ALL © OECD 2017
Executive Summary
Despite increased funding, expansion of different educational levels and many reforms, most education systems around the world have not yet found effective ways to improve outcomes to prepare students for our volatile and uncertain world and its increasing demands for higher non-routine skills. As the Red Queen says to Alice in Through the Looking-Glass (Lewis Carroll): “Now, here, you see, it takes all the running you can do, to keep in the same place. If you want to get somewhere else, you must run at least twice as fast as that!” This might well be a metaphor for our rapidly changing environment, where education systems need to adapt continuously to keep up with the rapid pace at which technological change and the digital revolution are affecting the way we work, live and relate to one another. Keeping up requires improving the performance of all students, overcoming the factors that may hinder their outcomes, and equipping them with new sets of skills.
The education systems that have succeeded in improving student outcomes in our rapidly evolving landscape point the way forward: teachers must be the top priority. Teachers need new solutions to today’s unprecedented demands and challenges. They have to be able to prepare students to face technologically-driven change, to work in different jobs and fields or create their own work environment, to distinguish the quality of sources of information, to become critical thinkers, to adapt to change, to relate to people with different cultural background and beliefs, to persevere when confronted with adversity and to learn throughout their lives.
The adaptability of education systems and their ability to evolve ultimately depends on enabling teachers to transform what and how students learn. Teachers have a positive impact on their students’ outcomes when they engage in direct instruction and are able to adapt it to the different needs of their diverse classrooms. A positive disciplinary climate is also essential for teachers to be able to improve student performance and have a sense of well-being and self-efficacy. To strengthen support for teachers, pre-service training offered by education institutions needs to meet high standards, selection procedures need to be sufficiently demanding, and in-service teacher training needs to move from courses and workshops with little impact to new forms of professional development that integrate mentoring by highly skilled teachers, new forms of professional collaboration between teachers and lifelong learning.
To achieve high quality, education systems need to perform well in two dimensions: excellence and equity. Many high-performing systems do well on both, demonstrating that excellence and equity are not mutually exclusive. However, to achieve equity, specific measures need to be put in place to overcome factors known to hinder student performance.
The negative impact of socio-economic background is present in all systems to different degrees. Thus, while socio-economic background is always a strong predictor of performance, good-quality systems raise the performance of all students so that disadvantaged students in good-quality systems outperform advantaged students in poor-quality systems. In addition, the magnitude of the gap between advantaged and disadvantaged students varies considerably. Policies known to minimise the impact of socio-economic background include providing good-quality early childhood education and care, allocating additional resources to disadvantaged schools, identifying struggling students as early as possible to provide compensatory measures, and also identifying students at risk of dropping out and offering them support and alternative pathways through vocational education and training.
Gender differences in performance vary depending on the field of study. Science is particularly revealing, because differences in performance are small. But there are major differences between boys and girls in their perceptions of their abilities and their career expectations, mainly due to prejudices from parents and teachers, which need to be addressed.
Immigrant students also tend to underperform compared to non-migrants. However, for many immigrant students, performance is high by international standards. New evidence shows that their performance is related to both the country of origin and the host country. Thus, host countries need to find ways to overcome language barriers and nurture the talents of students with different cultural backgrounds.

Executive Summary
12 © OECD 2017 EMPOWERING AND ENABLING TEACHERS TO IMPROVE EQUITY AND OUTCOMES FOR ALL
Over the last few decades, many countries have decentralised their education systems to grant greater autonomy to regions, local authorities or schools. The underlying premise is that individual schools have highly qualified teachers and strong leaders who are good judges of their students’ learning needs, and who can (re)design and implement rigorous curricula, internal evaluations and accountability mechanisms. However, more school autonomy may not always be effective. The benefits of school autonomy may be contingent on how prepared schools are to use their responsibility effectively and how accountable they are for their students’ outcomes to parents, local communities and education authorities. Thus, it is crucial to build capacity as responsibilities are transferred from the central government to other levels of governance.
The complexity of decentralised systems is such that many decisions taken at the systemic level also have a great impact on teaching and learning. Such system-level decisions include:
• The way responsibilities for education are distributed and managed among different actors and how they are held accountable for them.
• The overall structure of the education system.
• What mechanisms are put in place to ensure that high curricular standards are guaranteed for all students.
• What evaluations and assessments are put in place to identify and support struggling students and to signal the targets that all students need to achieve at the end of different educational stages.
• How decisions are made about which teachers are assigned to which schools.
• Who defines the standards for the teaching profession.
• Who is responsible for decisions about budgets, teacher salaries, careers and incentives.
• At what level teacher training and professional development are defined, developed and funded.
The increase in the number of stakeholders also creates the need for greater collaboration in the design and implementation of reforms. Since different stakeholders have different interests, conflicts may arise. It is crucial that the dialogue and debate be evidence-based, using system data to make an accurate diagnosis of the situation, international comparisons to define how the level of performance compares to other countries, and a profound knowledge of good practices in other systems to understand what works and what does not work in different contexts.
Far too many education reforms fail during the implementation phase. This is due to a very complex combination of factors, including the disconnect between short political cycles and the need to implement education reforms gradually, the contrast between short-term costs and long-term benefit, insufficient efforts to build capacity across all levels and all the way to the classroom, and little understanding of some reforms by the main actors (teachers).
It is important for governments and unions to recognise the intrinsic difficulties associated with education reforms and to agree that the ultimate and shared goal is to prepare students to succeed in life.

13EMPOWERING AND ENABLING TEACHERS TO IMPROVE EQUITY AND OUTCOMES FOR ALL © OECD 2017
Chapter 1
PROFESSIONAL LEARNING AND DEVELOPMENT TO SUPPORT TEACHERS’ WORK
Education systems around the world are changing in order to equip students
with higher levels of skills and new horizontal skills. Teachers need support to
actively participate in this transformation and demand high standards from all
students, while taking into account the increasing diversity in their classrooms.
In most countries, teachers undergo pre-service training, followed by a
selection process, with subsequent in-service training provided mostly through
courses and workshops. New evidence shows that the proportion of certified
teachers and most forms of professional development have a weak impact
on student performance. Thus, many reforms aim to improve the quality
of teacher training, make selection procedures more demanding, develop
new forms of professional development and raise curricular standards. Since
teacher-directed and adaptive instruction have a positive impact on student
outcomes, school autonomy has beneficial effects when school principals and
teachers are prepared to use their responsibility effectively and schools are
held accountable. But teachers can only be effective if the disciplinary climate
in the classroom is positive.
Note regarding IsraelThe statistical data for Israel are supplied by and under the responsibility of the relevant Israeli authorities. The use of such data by the OECD is without prejudice to the status of the Golan Heights, East Jerusalem and Israeli settlements in the West Bank under the terms of international law.

P r o f e s s i o n a l l e a r n i n g a n d d e ve l o p m e n t t o s u p p o r t t e a ch e r s ’ wo r kChapter 1
14 © OECD 2017 EMPOWERING AND ENABLING TEACHERS TO IMPROVE EQUITY AND OUTCOMES FOR ALL
NEW DEMANDS ON TEACHING PROFESSIONALS
Evolving goals of education systems
The main goal of education is to develop the full potential of all students in line with their abilities, effort and aspirations. To achieve this, it is important to recognise that not all students are at the same starting point when they begin compulsory education, and that they all face different challenges. Education systems should ensure that factors that may hinder student performance (such as family socio-economic status, immigrant background, gender or region of origin) do not prevent students from developing the full set of cognitive and socio-emotional skills that they are capable of. Moreover, abilities and aspirations differ between students, and education systems must be sensitive and flexible enough to identify and manage this diversity to ensure that all students can perform to their highest potential.
Notes: All differences are statistically significant. Lower than upper secondary education includes ISCED 1, 2 and 3C short. Upper secondary education includes ISCED 3A, 3B, 3C long and 4. Tertiary education includes ISCED 5A, 5B and 6. Where possible, foreign qualifications are included as per their closest correspondance to the respective national education systems. 1. Note by Turkey: The information in this document with reference to “Cyprus” relates to the southern part of the Island. There is no single authority representing both Turkish and Greek Cypriot people on the Island. Turkey recognises the Turkish Republic of Northern Cyprus (TRNC). Until a lasting and equitable solution is found within the context of the United Nations, Turkey shall preserve its position concerning the “Cyprus issue”.Note by all the European Union Member States of the OECD and the European Union: The Republic of Cyprus is recognised by all members of the United Nations with the exception of Turkey. The information in this document relates to the area under the effective control of the Government of the Republic of Cyprus.2. The sample for the Russian Federation does not include the population of the Moscow municipal area. The data published, therefore, do not represent the entire resident population aged 16-65 in the Russian Federation but rather the population of the Russian Federation excluding the population residing in the Moscow municipal area. More detailed information regarding the data from the Russian Federation as well as that of other countries can be found in the Technical Report of the Survey of Adult Skills, Second Edition (OECD, forthcoming).Countries and economies are ranked in descending order of the mean score in literacy for adults aged 25-65 who have attained tertiary education.Source: Survey of Adult Skills (PIAAC) (2012, 2015), Table A3.2 (L), www.oecd.org/skills/piaac/publicdataandanalysis.12 http://dx.doi.org/10.1787/888933365719
Score
JapanNetherlands
FinlandSweden
AustraliaCzech Republic
Flanders (Belgium)Norway
New ZealandUnited States
PolandAustria
England (UK)Northern Ireland (UK)
Slovak RepublicFrance
GermanyDenmark
OECD averageIreland
KoreaCanadaEstonia
SingaporeSlovenia
LithuaniaCyprus1
SpainItaly
Russian Federation2
IsraelGreeceTurkey
ChileJakarta (Indonesia)
200 225 250 275 300 325150 175
5364646755607049518770575457587073586160617146
1036841355750317438487765
Difference(Difference between tertiary and lower than upper secondary)
Upper secondaryLower than upper secondary Tertiary
Figure 1.1Literacy proficiency, by level of educational attainment (25-65 year-olds)

P r o f e s s i o n a l l e a r n i n g a n d d e ve l o p m e n t t o s u p p o r t t e a ch e r s ’ wo r k Chapter 1
15EMPOWERING AND ENABLING TEACHERS TO IMPROVE EQUITY AND OUTCOMES FOR ALL © OECD 2017
Recognising the universality of this challenge, the Sustainable Development Goals (SDGs), adopted by the United Nations in September 2015, identified the need to “Ensure inclusive and equitable quality education and promote lifelong learning opportunities for all”. The SDGs on education differ from the previous Millennium Development Goals (2000-15) in that they establish a universal agenda, setting targets and indicators for all countries and shift the emphasis from access to education to quality of education and learning outcomes. This is a major and much-needed change, since differences in quality between education systems are so great that traditional measures (such as the number of years of schooling or qualifications obtained) are only loosely related to the actual level of skills that students acquire. The need to monitor actual learning outcomes highlights the prominent role of international surveys, notably the OECD’s Programme for International Student Assessment (PISA) and the Survey of Adult Skills, a product of the Programme for the International Assessment of Adult Competencies (PIAAC).
Universal access to compulsory education is common in most, but not all, OECD countries. Since universal access was achieved decades ago in those countries, the period from 2005 to 2013 was one of relative stability in student enrolment rates. Over that period, expenditure per student in primary, secondary and post-secondary non-tertiary levels increased in most OECD countries (by an average of 19% across the OECD), with an average increase in expenditure of 15% and a slight decrease in the number of students (3%), due to smaller cohorts reaching school age (OECD, 2014).
In most countries, the expansion beyond compulsory education has continued at the levels of early childhood education and care, secondary post-compulsory education and higher education. However, as noted earlier, differences in the quality of education systems can lead to significant differences in the level of skills attained by people with the same level of educational attainment. According to findings from the Survey of Adult Skills, the magnitude is such that university graduates from countries with low-performing education systems have skills levels similar to those of students who have attained only secondary education in top-performing countries (Figure 1.1).
These disparities reveal that, in some countries, the huge effort made to expand access to higher levels of education has not produced the expected returns in terms of increased levels of skills among younger generations. This highlights the need to make quality the main goal of all education systems, to equip students with the level of skills they need to compete successfully in a globalised world.
Figure 1.2Average three-year trend in science performance since 2006
Notes: Statistically significant differences are shown in a darker tone (see Annex A3).The average three-year trend is the average rate of change, per three-year period, between the earliest available measurement in PISA and PISA 2015. For countries and economies with more than one available measurement, the average three-year trend is calculated with a linear regression model. This model takes into account that Costa Rica, Georgia, Malta and Moldova conducted the PISA 2009 assessment in 2010 as part of PISA 2009+. For countries/ economies with comparable data for PISA 2012 and PISA 2015 only, the average three-year trend coincides with the change between 2012 and 2015.Only countries/economies with valid results for PISA 2015 and at least one prior assessment are shown.Countries and economies are ranked in descending order of the average three-year trend in science performance.Source: OECD, PISA 2015 Database, Table I.2.4a.1 2 http://dx.doi.org/10.1787/888933432133
Ave
rage
thre
e-ye
ar tr
end
(sco
re-p
oint
diff
eren
ce)
CA
BA (A
rgen
tina
)G
eorg
iaQ
atar
Alb
ania
Peru
Mo
ldov
aC
olo
mb
iaPo
rtug
alTr
inid
ad a
nd T
ob
ago
Sing
apo
reM
acao
(Chi
na)
Ro
man
iaIs
rael
Bul
gari
aN
orw
ayR
ussi
aPo
land
Jap
anIn
do
nesi
aB
razi
lC
hile
Esto
nia
Spai
nM
alta
Thai
land
Ital
yU
nite
d S
tate
sM
exic
oD
enm
ark
Turk
eyLa
tvia
Uru
guay
Mo
nten
egro
Chi
nese
Tai
pei
Fran
ceTu
nisi
aLu
xem
bo
urg
Irel
and
OEC
D a
vera
ge-3
5U
nite
d K
ingd
om
Slov
enia
Ger
man
yK
ore
aSw
itze
rlan
dC
anad
aB
elgi
umLi
thua
nia
Vie
t N
amSw
eden
Jord
anC
roat
iaA
ustr
iaN
ethe
rlan
ds
Ho
ng K
ong
(Chi
na)
Cze
ch R
epub
licA
ustr
alia
Gre
ece
Co
sta
Ric
aN
ew Z
eala
ndIc
elan
dH
unga
rySl
ovak
Rep
ublic
Finl
and
Uni
ted
Ara
b E
mir
ates
40
30
20
10
0
-10
-20
-30
-40
Change between 2012 and 2015 (PISA 2015 - PISA 2012)Average three-year trend in science across PISA assessments
51

P r o f e s s i o n a l l e a r n i n g a n d d e ve l o p m e n t t o s u p p o r t t e a ch e r s ’ wo r kChapter 1
16 © OECD 2017 EMPOWERING AND ENABLING TEACHERS TO IMPROVE EQUITY AND OUTCOMES FOR ALL
Figure 1.3Fifteen-year-olds’ proficiency in science
Students at the different levels of proficiency in science, as a percentage of all 15-year-olds
Note: The length of each bar is proportional to the percentage of 15-year-olds covered by the PISA sample (Coverage index 3; see Annex A2).Countries and economies are ranked in descending order of the number of students who perform at or above Level 2, expressed as a percentage of the total population of 15-year-olds in the country.Source: OECD, PISA 2015 Database, Table I.2.1b.1 2 http://dx.doi.org/10.1787/888933432083
Students at or below Level 1a
Students at or aboveLevel 2
%% 100 80 60 40 20 0 20 40 60 80 100
Level 1b Level 1aBelow Level 1b Level 2 Level 3 Level 4 Level 5 Level 6
Percentage of 15-year-olds not covered by the PISA sample
SingaporeFinland
JapanEstoniaIreland
Macao (China)Hong Kong (China)
GermanySlovenia
KoreaSwitzerland
RussiaNetherlands
CABA (Argentina)Poland
DenmarkAustralia
Chinese TaipeiBelgium
New ZealandCanada
SpainNorway
Czech RepublicLatvia
SwedenPortugal
FranceOECD average
IcelandUnited Kingdom
CroatiaLithuania
United StatesHungary
AustriaMalta
LuxembourgIsrael
Slovak RepublicItaly
GreeceRomaniaMoldova
B-S-J-G (China)United Arab Emirates
ChileBulgariaAlbania
QatarViet Nam
MontenegroJordan
UruguayTrinidad and Tobago
TurkeyGeorgia
ColombiaThailandFYROM
Costa RicaMexicoTunisia
PeruBrazil
IndonesiaLebanon
AlgeriaKosovo
Dominican Republic
43574
121147845509
119
157
1016996
116
129
117
169
101610172
126
1120977
369
2019167
5110142824302125295
37387
26293234212932

P r o f e s s i o n a l l e a r n i n g a n d d e ve l o p m e n t t o s u p p o r t t e a ch e r s ’ wo r k Chapter 1
17EMPOWERING AND ENABLING TEACHERS TO IMPROVE EQUITY AND OUTCOMES FOR ALL © OECD 2017
In this regard, the latest data from PISA 2015 (in which science was the main domain) reveal a worrying picture (OECD, 2016a). For the majority of countries with comparable data over time, science performance has remained essentially unchanged since 2006, despite significant developments in science and technology over that period. Out of 64 countries with comparable results between PISA assessments, 31 countries showed no significant change, 15 showed some improvement and 18 showed a decline in performance (Figure 1.2). In contrast to this overall lack of progress, it is worth noting that mean performance in science improved between 2006 and 2015 in Colombia, Israel, Macao (China), Portugal, Qatar and Romania. For some of these countries, this progress reflects a comparatively low starting point in the initial years. However, some countries and economies that scored at or above the average in 2006 also saw improvements over time, for example Macao (China).
In relation to high and low performers, all students should be expected to attain Level 2 on the PISA proficiency scale by the time they leave compulsory education. Level 2 is considered the baseline level of science proficiency required to engage in science-related issues as a critical and informed citizen, but 21% of students perform below this level across OECD countries (again with significant variation across countries). The percentage of students performing above the baseline level ranges from over 90% of students in Estonia, Hong Kong (China), Japan, Macao (China), and Singapore to around 20% in Algeria, Kosovo and Lebanon, and even less in the Dominican Republic (Figure 1.3). On the other hand, around 7.7% students across OECD countries are top performers, ranging from 24.2% in Singapore to less than 1% in Mexico and Turkey.
Across OECD countries on average, neither the proportion of students scoring below Level 2 nor the proportion of top performers show a statistically significant change between 2006 and 2015 that would suggest progress and an improvement in student outcomes (Figure 1.4).
Figure 1.4Percentage of low-achieving students and top performers in science in 2006 and 2015
Notes: Only countries/economies that participated in both 2006 and 2015 PISA assessments are shown.The change between PISA 2006 and PISA 2015 in the share of students performing below Level 2 in science is shown below the country/economy name. The change between PISA 2006 and PISA 2015 in the share of students performing at or above Level 5 in science is shown above the country/economy name.Only statistically significant changes are shown (see Annex A3).Countries and economies are ranked in descending order of the percentage of students performing at or above Level 5 in 2015.Source: OECD, PISA 2015 Database, Table I.2.2a.1 2 http://dx.doi.org/10.1787/888933432188
30
20
10
0
%
%
0
10
20
30
40
50
60
70
80
20152006
Students at or above pro�ciency Level 5
Students below pro�ciency Level 2
-6
.6 -4
.8 -3
.4 -2
.9 -2
.3 3.9
-2.3 4.3
-8.6
-4.3
-2.4
-2.3
-2.6
-2.2
-1.3 1.4
-0.5
7.4
3.7
4.8
5.6
-2
.2
5.3
-7.1
5.1
11
7.7
10
.5
8.7
-29.
3
-1
1.2
Chi
nese
Tai
pei
Jap
anFi
nlan
dEs
toni
aN
ew Z
eala
ndC
anad
aA
ustr
alia
Net
herl
and
sU
nite
d K
ingd
om
Ko
rea
Slov
enia
Ger
man
ySw
itze
rlan
dM
acao
(Chi
na)
Bel
gium
Uni
ted
Sta
tes
Swed
enFr
ance
No
rway
OEC
D a
vera
ge-3
5A
ustr
iaPo
rtug
alH
ong
Ko
ng (C
hina
)Po
land
Cze
ch R
epub
licIr
elan
dD
enm
ark
Luxe
mb
our
gIs
rael
Spai
nH
unga
ryLi
thua
nia
Ital
yC
roat
iaLa
tvia
Icel
and
Rus
sia
Slov
ak R
epub
licB
ulga
ria
Gre
ece
Qat
arU
rugu
ayC
hile
Ro
man
iaB
razi
lM
ont
eneg
roTh
aila
ndC
olo
mb
iaTu
rkey
Jord
anM
exic
oIn
do
nesi
aTu
nisi
a
P r o f e s s i o n a l l e a r n i n g a n d d e ve l o p m e n t t o s u p p o r t t e a ch e r s ’ wo r kChapter 1
18 © OECD 2017 EMPOWERING AND ENABLING TEACHERS TO IMPROVE EQUITY AND OUTCOMES FOR ALL
These findings convey a disturbing message: despite increased funding, expansion of different educational levels and implementation of many reforms, most education systems have not found effective ways to improve outcomes to prepare students for today’s rapidly changing environment. It is mainly through education that individuals acquire the skills to overcome personal circumstances that could hinder their success and face the challenges of our globalised world, in which technology is changing how people work, communicate and socialise. Only education systems capable of adapting to the rapidly changing environment can empower their citizens with the right mix of skills to allow them to lead satisfying professional and personal lives and, at an aggregate level, lead to inclusive and sustainable economic growth. The adaptability of education systems and their ability to evolve ultimately depends on enabling teachers to transform what and how students learn.
Changing roles of schools and teachers
Traditionally, education systems were rigid and compartmentalised. Students were expected to acquire a basic body of knowledge and then specialise in a field of their choice and pursue a professional career in that area. To achieve this aim, it was considered sufficient for teachers to transmit accumulated knowledge and for students to memorise it. This approach worked when jobs were also compartmentalised, specialised and stable, allowing most people to find a job for life or at least stay in the same field. The landscape has changed dramatically in recent years, putting huge pressure on education systems to adapt to a rapidly evolving ecosystem. The rapid rate of knowledge generation and technological change has had a major impact on the way people work, with many types of jobs disappearing while new ones are being generated. Professional stability over a lifetime has been replaced by the need to change jobs and fields, to work freelance or to design one’s own job. The automatisation of routine jobs and the digital revolution have led to the rising demand for highly skilled people capable of doing non-routine jobs. This phenomenon, comparable in magnitude to the industrial revolution, is leading to the emergence of jobs and ways of working that did not exist and could not even be predicted a few years ago (Frey and Osborne, 2013).
Education systems not only prepare students for their professional careers, but also to lead satisfying and fulfilling personal lives, so they have to address the impacts of globalisation and the digital revolution. Students need to learn to interact with people from different cultures, to be prepared to live and work in different geographical areas, to adapt to rapidly changing technologies, to cope with diffuse and varied sources of information, to make informed decisions about complex issues and to take greater responsibility for their own learning throughout their lives. In other words, students need to be ready to face an uncertain, volatile, complex and ambiguous world.
The social pain inflicted by the industrial revolution was only overcome by the efforts to grant universal access to education, to upskill the population and equip all citizens for new and more demanding jobs. Today’s students will only be able to cope with the ongoing technological and digital revolution if education systems improve their quality, leading to better student performance, equitable outcomes and the acquisition of new skill sets and greater knowledge.
Although education systems have become very complex and many factors have an impact on student outcomes, teachers are the most influential factor in school systems. What matters most is what and how they teach and for how long, how they motivate students and how they demand high standards from all students, while taking their differences into account.
In this context, the teaching profession needs to undergo a profound transformation in order to prepare students for the societies in which they will live and work, and education systems must support teachers to face these new challenges. This requires continuously updating the knowledge that is being generated, integrating digital technologies, incorporating horizontal and socio-emotional skills, and promoting team work, critical thinking and complex problem-solving. To align their own standards with those established nationwide in their country, teachers need to become familiar with external assessments, learn how to use the results to improve student outcomes, and develop their own methods to track students and provide support to those who are struggling. In addition, teachers need to be able to deal with diverse classrooms to enable all students to achieve their potential.
Future teachers may expect to learn these skills during pre-service training, but those who are already in the profession need other means. In-service training is increasingly important to upskill teachers who started their career at a time when more traditional methods were sufficient and to provide lifelong learning to all. This requires both top-down and bottom-up approaches, so that new standards are defined at the systemic level, training is offered by education institutions, skilled teachers can mentor others, and teachers can learn from each other, investigate in collaboration with others and exchange good practices.
As professionals, teachers are expected to become both researchers and problem-solvers. This makes the teaching profession more attractive, but also much more demanding.

P r o f e s s i o n a l l e a r n i n g a n d d e ve l o p m e n t t o s u p p o r t t e a ch e r s ’ wo r k Chapter 1
19EMPOWERING AND ENABLING TEACHERS TO IMPROVE EQUITY AND OUTCOMES FOR ALL © OECD 2017
PROFESSIONALISM IN TEACHINGTo tackle the challenges of today’s changing society, it is important to examine the framework of what has been understood as teacher professionalism. Many education systems still struggle to raise the status of the teaching career, so that teaching can be considered a “profession” viewed as having the same value as medicine, law or engineering (Guerriero, 2017). Indeed, the results from TALIS 2013 show that teachers’ perceptions about how much society values their profession vary significantly across countries and economies. A key step is to move teachers’ career pathways from what can be described as a “semi-profession” to a true profession (Table 1.1).
Table 1.1Differences between a semi-profession and a profession
Semi-profession ProfessionLower in occupational status. There is a high level of public trust and confidence in the profession and in individual practitioners,
based on the profession's demonstrated capacity to provide service markedly beyond that which would otherwise be available.
Shorter training periods. Preparation for and induction into the profession is provided through a protracted preparation programme, usually in a professional school on a college or university campus.
Lack of societal acceptance that the nature of the service and/or the level of expertise justify the autonomy which is granted to the professions.
The members of the profession are involved in making decisions in the service of the client, and the decisions being made are in accordance with the most valid knowledge available, against a background of principles and theories, and within the context of possible impact on other related conditions or decisions.
A less specialised and less highly developed body of knowledge and skills.
Collectively and individually, the profession possesses a body of knowledge and a repertoire of behaviours and skills (professional culture) needed in the practice of the profession, and such knowledge, behaviour and skills normally are not possessed by the non-professional.
Markedly less emphasis on theoretical and conceptual bases for practice.
The profession is based on one or more underlying disciplines from which it draws basic insights and upon which it builds its own applied knowledge and skills.
More subject to administrative and supervisory surveillance and control.
There is relative freedom from direct on-the-job supervision and from direct public evaluation of the individual practitioner. Professionals accept responsibility in the name of their profession and are accountable to society through their profession.
Less autonomy in professional decision-making, with accountability to superiors rather than to professions/professional bodies.
Authority to practice in any individual case derives from the client or the employing organisation; accountability for the competence of professional practice within the particular case is to the profession itself.
Source: Adapted from Guerriero (2017), http://dx.doi.org/10.1787/9789264270695-en; Howsam (1985), http://eric.ed.gov/?id=ED270430.
Summarising these differences, it is clear that a profession is strong in a body of knowledge which is both individually and collectively developed, has the legitimacy and authority for decision-making and, at the same time, is not exempt from the necessary accountability procedures.
Improving the teaching profession
In the last few decades, several educational systems have enacted policies and reforms to raise the standards of the teaching profession (Table 1.2).
Three possible instruments can be adapted to provide guidance to teachers on what they should know and be able to do: qualifications frameworks, standards and the “knowledge wall” (Guerriero, 2017):
1. Qualifications frameworks: Qualifications frameworks can help clarify the specific formal qualifications that a teacher (or another occupation or profession) can receive within a specific education system in relation to other professions. They can thus be regarded as documents (among other things) in which teachers’ professionalism is manifested. They are instruments that support the development and classification of qualifications, according to a set of criteria for levels of learning achieved, and based on specific quality requirements. These instruments can allow (among other things) a common understanding of the quality and content or outcome of an award achieved, comparability among qualifications and a certain transferability of knowledge across professions.
2. Standards: Standards describe what teachers should know and be able to do, including the description of a desirable level of performance. They are thus documents, or sets of documents, with different extensions and scope that state what is valued in a profession through a competence-based approach (Boxes 1.1 and 1.2). “Competences” are defined as the ongoing and progressive ability to meet complex demands in a defined context by mobilising holistic psychosocial resources (cognitive, functional, personal and ethical) as needed to accomplish these demands.

P r o f e s s i o n a l l e a r n i n g a n d d e ve l o p m e n t t o s u p p o r t t e a ch e r s ’ wo r kChapter 1
20 © OECD 2017 EMPOWERING AND ENABLING TEACHERS TO IMPROVE EQUITY AND OUTCOMES FOR ALL
3. The “knowledge wall”: What the OECD calls the “knowledge wall” refers to the articulation between frameworks and standards. Along the continuum of a teacher’s professional career, professional standards complement the qualifications acquired in formal teacher education programmes to promote teachers’ lifelong improvement. Qualifications frameworks specify the formally-acquired knowledge in principle (e.g. bachelors, masters, or doctoral degree) (OECD, 2004). Professional standards, on the other hand, specify the ongoing improvement of competencies (knowledge, skills and attitudes) from beginner to proficient that may eventually lead (or not) to additional formal outcomes in a teacher’s career (e.g. practicum or induction requirements and continuing professional development). The standards may also allow the further shaping of teachers’ knowledge at different stages of their careers, according to the needs of the education system. From these different perspectives, both qualifications frameworks and professional standards contain information on the aspirations of education systems about what teachers’ should know and be able to do.
Box 1.1. Review of teacher standards in Wales (United Kingdom)
In Wales, the urgent need to reform initial teacher education (ITE) has been highlighted in a number of high-profile reports, including those by the OECD (Improving Schools in Wales, 2014) and Professor John Furlong, Advisor to the Welsh Government on ITE. In his report to the Welsh Government in 2015, Furlong cited the need for “a new kind of teacher professionalism in Wales” to improve the quality of ITE programmes, specifically by:
• revising the accreditation process for ITE providers in Wales (there are currently six), including establishing a Teacher Education Advisory Board tasked with improving university-school partnerships that foster research-informed clinical practice
• revising the narrowly-defined Standards for Newly Qualified Teachers to include formal links to the Practicing Teaching Standards and emphasising the contribution of ITE to teachers’ long-term professional growth and development
• establishing a network of five university-based centres of pedagogical excellence across Wales, all with strong links to the provision of teacher education, to stimulate an active collaborative research culture in teacher education.
In response, the Welsh Government is undertaking a consultation process to develop criteria for the accreditation of ITE programmes in Wales and to establish the Education Workforce Council (the teacher regulator in Wales since 2015) as the accreditation body. A consultation process is also being launched to review the 2009 Qualified Teacher Status Standards.
Sources: Furlong, J. (2015), Teaching Tomorrow’s Teachers: Options for the future of teacher education in Wales, University of Oxford, Oxford; Welsh Government (2016), Draft criteria for the accreditation of Initial Teacher Education Programmes in Wales and the proposal for the Education Workforce Council to accredit initial teacher education, Consultation Document, https://consultations.gov.wales/sites/default/files/consultation_doc_files/160923_consultation_document_en.pdf.
Box 1.2. New professional standards and continuous professional development system for teachers in Estonia
Under Estonia‘s Lifelong Learning Strategy, new professional standards for teachers were adopted in 2013 to develop formal and continuous teacher training plans and to assess future teachers’ readiness to enter the profession. This training is based on the concept of continuous education of teachers and heads of school adopted at the end of 2013 by the Ministry of Education and Research in co-operation with its partners. This new continuous professional development system for teachers comprises national qualification requirements, professional standards for teachers, a central inservice training system aligned to these professional standards, and non-mandatory in-service training hours. A career structure (2014) based on professional standards and the acquisition of competencies has been introduced for both general education teachers (four levels) and vocational education teachers (three levels). One of the goals of the new Lifelong Learning Strategy is to fully align teachers’ salaries by 2020 with the earnings of full-time, full-year workers with tertiary education and, also by 2020, to raise the share of teachers who are under age 30 to 12.5%.
Source: OECD (2016b), Education Policy Outlook: Estonia, OECD Publishing, Paris, www.oecd.org/edu/Education-Policy-Outlook-Country-Profile-Estonia.pdf.

P r o f e s s i o n a l l e a r n i n g a n d d e ve l o p m e n t t o s u p p o r t t e a ch e r s ’ wo r k Chapter 1
21EMPOWERING AND ENABLING TEACHERS TO IMPROVE EQUITY AND OUTCOMES FOR ALL © OECD 2017
Tableau 1.2Policy targeting the teaching profession (2008-14)
Comprehensive policies Content Targeted policies
General strategy Standards Initial education Career progression
Australia: National Partnership on Improving Teacher Quality (2009-13)
Germany: Quality offensive in Teacher Training (2013)
Hungary: National Public Education Act (2011)
Mexico: Teacher Professional Service (2013)
Netherlands: Teachers’ programme 2013-20 (2013)
Slovak Republic: Pedagogical and Specialised Employees Act (2009)
United Kingdom (Scotland): Teaching Scotland’s Future (2011)
Australia: Australian Professional Standards for Teachers (2013)
Austria: Quality Management System for teachers and school leaders – general and VET (2012)
Chile: Good Teaching Framework (2008)
Estonia: New professional standards for teachers (2013)
New Zealand: Registered Teacher Criteria (2010-13)
Sweden: Teacher registration system (2013)
United Kingdom (England): New Teachers’ Standards and appraisal regulations (2012)
Australia: Accreditation of initial Teacher Education Programmes (2013); Teacher Education Ministerial Advisory Group (2014)
Austria: Reforms of teacher training (2013)
Chile: Prueba INICIA (2008); Grant for teaching profession (2012)
Denmark: Reform of teacher education in Denmark (2012); Bachelor of Education Porgramme (2013)
France: Reform of teacher training (2013)
Hungary: Decree on Teacher Training System (2012)
Iceland: Council for Teachers’ Education and Professional Development (2012)
Ireland: Initial Teacher Education Criteria and Guidelines for Porgramme Providers (2011) from Teaching Council.
Italy: Ministerial Decree 249/2010 on initial teacher education (2010)
Norway: National Guidelines for Differentiated Primary and Lower Secondary Teacher Education Programme for Years 1-7 and Years 5-10 (2010 and 2013)
Portugal: Reinforcing the scientific curricula in Teachers Education Programmes (2014)
Sweden: New teacher education programmes (2011); Teaching practice in specialised training schools (2014); Requirements for admission in teacher education.
Turkey: Teacher training programmes of education faculties (2008); New Teacher programme (2011)
United States: Teacher Qualtiy Partnership Program (2012)
Germany: Common guidelines to meet the demand for teachers (2009)
Ireland: Procedures for Induction and Procedures and Criteria for Probation (2013-14)
Israel: Academics for Teaching (2008); Outstanding Achievers for Education (2009); Teach First (2010)
Mexico: GNIST (spark) initiative (2009-14)
Portugal: More stringent admission conditions in Teachers Education Programmes (2014)
United States: Teacher Incentive Fund programme (2012)
Governance Career paths and remuneration
Australia: Australian Institute for Teaching and School Leadership (2010)
New Zealand: Proposed Education Council of Aotearoa New Zealand – EDUCANZ (2013)
Estonia: Increasing teachers’ salaries (2013)
Germany: Rules and proceedings for more mobility and quality for teachers (2013)
Slovak Republic: Increasing teachers’ salaries (2011)
Sweden: Career Development Reform (2013)
Teacher appraisal
Australia: Australian Teacher Performance and Development Framework (2013)
Greece: Presidential Decree 152/2013 on Teacher Appraisal (2013)
Portugal: Evaluation exam for teachers (2013)
Professional development
Australia: Australian Charter for the Professional Learning of Teachers and School Leaders (2013)
Estonia: Working group to develop teacher professional development (expected in 2015)
Finland: Advisory Board for Professional Development of Education Personnel (2008); OSAAVA programme (2010-16)
Greece: In-service Education and Training of Teachers (INSET) (2012)
Korea: National Teacher Professional Development and Evaluation System (NTPDES) (2010)
Portugal: Teacher’s lifelong training framework (2014)
Sweden: Access to in-service training (2014)
Turkey: Teaching, Entrepreneurship and Leadership Training Cooperation Protocol for Managers and Teachers in Vocational and Technical Schools and Institutions (2012)
Source: Education Policy Country Snapshots (Part 3) and Education Policy Outlook Country Profiles, (www.oecd.org/edu/profiles.htm).

P r o f e s s i o n a l l e a r n i n g a n d d e ve l o p m e n t t o s u p p o r t t e a ch e r s ’ wo r kChapter 1
22 © OECD 2017 EMPOWERING AND ENABLING TEACHERS TO IMPROVE EQUITY AND OUTCOMES FOR ALL
Major domains in teacher professionalism
Reflecting the rising policy interest in teacher professionalism, the OECD recently conducted a study on this topic, drawing on TALIS data. The study conceptualised three domains of teacher professionalism and examined their impact on the improvement of teaching practices (OECD, 2016c):
1. Professional knowledge baseProfessional knowledge is defined as the set of knowledge the professional uses in teaching and learning that is acknowledged through qualifications and memberships. The professional knowledge base of teachers requires advanced or graduate-level education and specialised knowledge of subject matter, pedagogy and classroom management, typically acquired through participation in initial teacher training programmes and continuous in-service professional development.
2. Autonomous decision-makingAutonomous decision-making is defined as autonomy over curricular choices, instructional planning and classroom standards of conduct. Autonomy is closely related to both decision-making and empowerment, because it recognises teachers’ capacity for sound professional judgement. Autonomy on classroom issues leads to a sense of empowerment and ownership, where teachers are able to grow professionally and take responsibility for their actions.
3. Peer networksThe third dimension of teacher professionalism lies in regulation and support from peer professionals. Peer regulation is a core component of classic professionalism: peers are responsible for setting high standards and ensuring that members are accountable to meet those standards. At the same time, networks of teachers are also available to provide support, collaboration and instruction in the development of practices at all stages of teachers’ professional careers. The most recurrent forms of peer networks include the following:
• Induction: Induction programmes are formal programmes that provide support, guidance and orientation to new teachers in the transition to their first teaching position. These programmes introduce new teachers to professional networks that help set standards and expectations for their work and ease their transition into the profession.
• Mentoring: Mentoring promotes teachers’ professional growth by both expanding their knowledge base and supporting them emotionally. Mentors play an important role in supporting the development of performance standards. Mentorship takes many forms, including offering specific advice about how to improve teaching, providing learning materials and resources, engaging in mutual evaluation, sharing professional knowledge and skills, and giving feedback.
• Professional development plans: This practice requires teachers to determine their professional needs and set goals for themselves as they develop their teaching practice. Professional development plans are established in consultation with supervisors and mentors to promote professional development and high standards.
• Peer feedback: Peer feedback on teaching practice is one approach that teachers and schools can use to ensure effective teaching. Feedback has the most impact on teachers’ practices when it is immediate.
• Professional learning communities: The professional learning community is one model by which schools create opportunities for professional learning and socialisation. Through socialisation, professional learning communities are able to create shared norms and expectations among teachers. Professional learning communities are also a cornerstone of professional learning environments (Box 1.3).
Box 1.3. Professional learning communities
Not all forms of social capital in education have proved productive for improving student learning or the quality of teaching. Professional learning communities, where teachers collaborate with one another, can be highly effective when they promote shared inquiry into problems of practice and collective responsibility for improvements and interventions that directly affect students’ learning. But they can be ineffective if they are too vague and involve unfocused conversations where teachers simply discuss and share ideas and practices without evaluating and inquiring into them, and without any clear connection to improving practice. They are also ineffective if they are imposed under pressure, for example when teachers are under excessive pressure to produce short-term results in areas where they have no professional discretion to exercise their own judgements
Source: Hargreaves A. and M. Fullan (2012), Professional Capital: Transforming Teaching in Every School, Teachers College Press, New York, NY.

P r o f e s s i o n a l l e a r n i n g a n d d e ve l o p m e n t t o s u p p o r t t e a ch e r s ’ wo r k Chapter 1
23EMPOWERING AND ENABLING TEACHERS TO IMPROVE EQUITY AND OUTCOMES FOR ALL © OECD 2017
Developing teacher’s skills
There is widespread acceptance that the knowledge base of teachers is an important component of teaching quality. However, there is an ongoing debate about whether teachers’ cognitive skills have a direct impact on student performance and whether top-performing systems should select future cohorts of teachers from the top percentiles of those entering university and recruit those with the highest level of performance on graduation from university.
New findings by Hanushek, Piopiunik and Wiederhold (2016) combining data from PIAAC and PISA 2012 show that teachers’ cognitive skills in literacy and numeracy differ widely internationally (Figure 1.5). Countries differ in the range of skills of university graduates and also on where teachers are placed within this range. Some top-performing countries, such as Finland and Japan, have university graduates with higher skills than other countries, and their teachers have comparatively high levels of skills within this range. However, this is not the case of other high-performing countries, such as Estonia or Korea, where teachers tend to come from the middle of the range.
Figure 1.5Position of teacher cognitive skills in the skill distribution of college graduates
Note: Modified figure from Schleicher (2013). Vertical bars indicate modian cognitive skills of teachers in a country. Horizontal bars show the interval of cognitive skill levels of all college graduates (including teachers) between the 25th and 75th percentile. Countries are ranked by the median teacher skills in numeracy and literacy, respectively.Source: Adapted from Hanushek, Piopiunik and Wiederhold (2014), The Value of Smarter Teachers: International Evidence on Teacher Cognitive Skills and Student Performance.
B LiteracyFinland
JapanGermanyBelgiumSweden
Czech RepublicNetherlands
NorwayFranceAustria
AustraliaIreland
DenmarkSlovak Republic
CanadaUnited Kingdom
KoreaEstonia
United StatesSpain
PolandRussian Federation
Italy
240 300280 320260 340Numeracy skils
AFinland
JapanAustralia
NetherlandsSwedenCanadaNorwayBelgium
United StatesGermany
IrelandCzech Republic
United KingdomKorea
FranceEstoniaPolandAustria
SpainSlovak Republic
DenmarkRussian Federation
Italy
240 300280 320260 340Literacy skils
Numeracy
When teachers’ skills and student performance are compared across countries, there is a positive relationship between them, suggesting that better skills among teachers can significantly improve student performance (Figure 1.6). However, it is also worth noting that, in most high-performing countries, students perform above what would be expected based solely on the skills of the teachers, suggesting that other factors of education systems may contribute to boosting student performance. In particular, three countries (Canada, Finland and Korea) are outliers, since their students perform better than would be expected from the skills of their teachers. This suggests that some top-performing countries have other measures in place that also contribute significantly to student performance, such as correct matching of teachers’ skills to the grades and topics assigned, adequate curricular standards and efficient accountability mechanisms.

P r o f e s s i o n a l l e a r n i n g a n d d e ve l o p m e n t t o s u p p o r t t e a ch e r s ’ wo r kChapter 1
24 © OECD 2017 EMPOWERING AND ENABLING TEACHERS TO IMPROVE EQUITY AND OUTCOMES FOR ALL
In light of the positive relationship between teachers’ skills and student performance, a key policy lever to improve the quality of education teachers is to empower teachers to acquire and update the set of knowledge and skills needed to accomplish their work most effectively. In this respect, teachers’ knowledge and skills are acquired through pre-service training before joining the profession and further developed through ongoing training and professional development while they are in activity.
Pre-service training
In most countries, institutions responsible for teacher education are autonomous and define their own curricula. This leads to variations across institutions in the content of initial teacher education.
The types of qualifications, the duration of training and the programme content of pre-service teacher training programmes can influence the extent to which initial teacher education prepares teachers for their role. To help understand these variations, Education at a Glance 2016 examines patterns and trends in pre-service training for teachers in OECD and selected partner countries (Figures 1.7 and 1.8) (OECD, 2014a):
• A master’s degree is required of upper secondary teachers who teach general subjects in 22 of the 36 countries with available data, but in only 4 of the 35 countries with available data for pre-primary school teachers.
• In 27 of 36 OECD and partner countries, there are selective criteria to enter and/or progress in initial teacher education for at least one level of education, and in 20 countries there are requirements beyond initial teacher education before one can start teaching and/or become a fully qualified teacher (Figure 1.7). Finland provides an interesting example of such criteria and requirements (Box 1.4).
• Places in teacher education programmes, independent of the level of education, are limited by numerus clausus policies in approximately half of the countries with available data.
• The duration of teacher training varies more for pre-primary education than for any other level of education, from two years for basic certification in Japan to five years in Austria, Chile, France, Iceland and Italy (Figure 1.8).
• Education programmes for pre-primary and primary teachers are typically organised according to the concurrent model, in which pedagogical and practical training are provided at the same time as courses in specific subject matter. The consecutive model, in which pedagogical and practical training follow the courses in subject matter, is more widespread for lower and upper secondary teachers.
Figure 1.6Student performance and teacher cognitive skills
Source: Adapted from Hanushek, Piopiunik and Wiederhold (2014), The Value of Smarter Teachers: International Evidence on Teacher Cognitive Skills and Student Performance.
Stud
ent m
ath
perf
orm
ance
(PIS
A)
Teacher numeracy skills (PIAAC)
0.6
0.5
0.4
0.3
0.2
0.1
0
-0.1
-0.2
-0.3
-0.4
-2 -1.5 -1.0 -0.5 0 1.51.00.5 2.0
Slovak Republic
Australia
France
Denmark
Germany
Canada
Japan
Korea
Italy
Norway
Sweden
Poland
Spain
Netherlands
y = 0.0836x - 0.0001
Austria
Estonia
Finland
Russian Federation
Czech Republic
United States
IrelandUnited Kingdom
Belgium

P r o f e s s i o n a l l e a r n i n g a n d d e ve l o p m e n t t o s u p p o r t t e a ch e r s ’ wo r k Chapter 1
25EMPOWERING AND ENABLING TEACHERS TO IMPROVE EQUITY AND OUTCOMES FOR ALL © OECD 2017
Figure 1.7Teacher selection (2013)
No selective criteria/additional requirementsSelective criteria/additional requirements in placeMissing
Selective criteria to enter and/or progress in initial teacher education
Pre-primary
Primary
Lower secondary
Upper secondary
Additional requirements other than initial teacher education to start teaching and/or become a fully qualified teacher
Pre-primary
Primary
Lower secondary
Upper secondary
Aus
tral
iaA
ustr
ia1
Bel
gium
(Fl.)
Bel
gium
(Fr.)
Bra
zil
Chi
leC
zech
Rep
ublic
Den
mar
kEn
glan
dEs
toni
aFi
nlan
dFr
ance
Ger
man
yG
reec
eH
unga
ry2
Icel
and
Irel
and
Isra
elIt
aly
Jap
anK
ore
aLu
xem
bo
urg
Mex
ico
Net
herl
and
sN
orw
ayPo
land
Port
ugal
Rus
sian
Fed
erat
ion
Sco
tlan
dSl
ovak
Rep
ublic
Slov
enia
Spai
nSw
eden
Swit
zerl
and
Turk
eyU
nite
d S
tate
s
1. Refers to teachers in academic secondary school only, for lower secondary education. 2. Year of reference 2014.Source: OECD. Tables D6.1a, b, c and d. See Annex 3 for notes (www.oecd.org/edu/eag.htm).1 2 http://dx.doi.org/10.1787/888933120404
Figure 1.8 Duration of initial teacher education (2013)
For teachers teaching general subjects in public institutions
1. Year of reference 2014.2. Refers to teachers in academic secondary school only, for lower secondary education. Countries are ranked in descending order of the duration of initial teacher education for lower secondary teachers.Source: OECD (2013), TALIS 2013 complete database (www.oecd.org/edu/eag.htm).1 2 http://dx.doi.org/10.1787/888933120423
8
7
6
5
4
3
2
1
0
Year
s
Ger
man
y
Luxe
mb
our
g
Ital
y
Icel
and
Chi
le
Slov
ak R
epub
lic
Finl
and
Cze
ch R
epub
lic
Esto
nia
Spai
n
Hun
gary
1
Sco
tlan
d
Swit
zerl
and
Irel
and
Fran
ce
Slov
enia
Pola
nd
Port
ugal
Swed
en
Aus
tria
2
Jap
an
Aus
tral
ia
Net
herl
and
s
Isra
el
Den
mar
k
No
rway
Turk
ey
Ko
rea
Uni
ted
Sta
tes
Bra
zil
Engl
and
Mex
ico
Gre
ece
Rus
sian
Fed
erat
ion
Bel
gium
(Fr.)
Bel
gium
(Fl.)
Lower secondary education
Upper secondary educationPrimary education
Pre-primary education
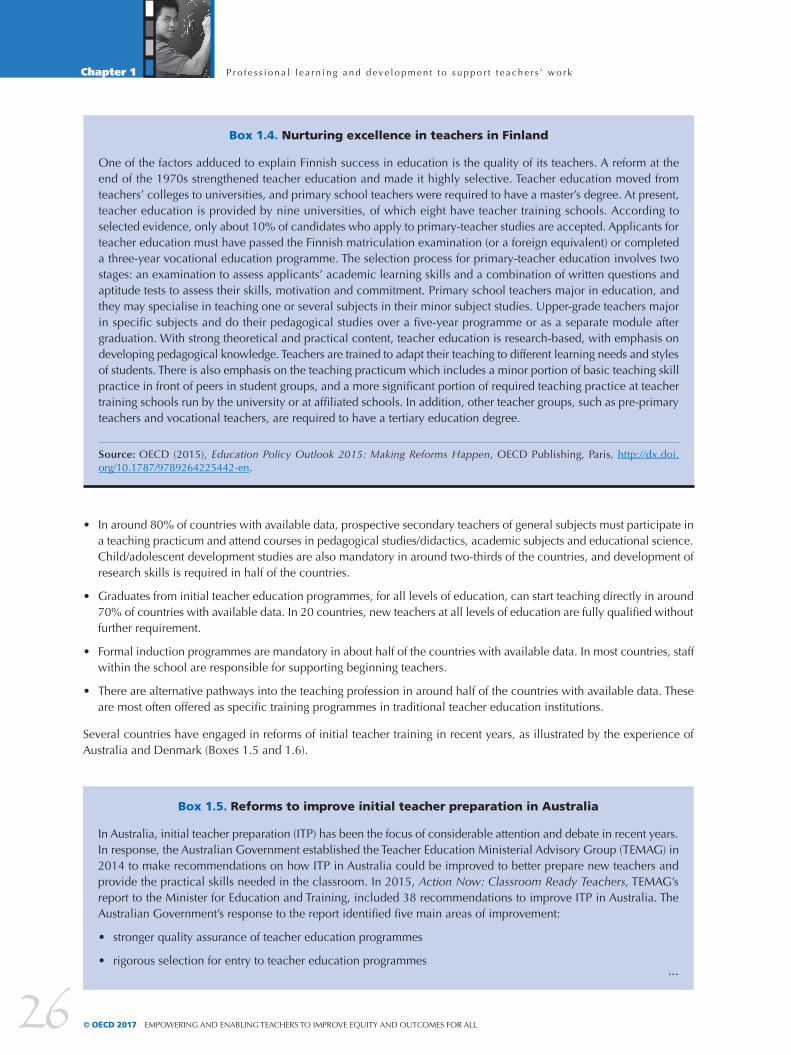
P r o f e s s i o n a l l e a r n i n g a n d d e ve l o p m e n t t o s u p p o r t t e a ch e r s ’ wo r kChapter 1
26 © OECD 2017 EMPOWERING AND ENABLING TEACHERS TO IMPROVE EQUITY AND OUTCOMES FOR ALL
• In around 80% of countries with available data, prospective secondary teachers of general subjects must participate in a teaching practicum and attend courses in pedagogical studies/didactics, academic subjects and educational science. Child/adolescent development studies are also mandatory in around two-thirds of the countries, and development of research skills is required in half of the countries.
• Graduates from initial teacher education programmes, for all levels of education, can start teaching directly in around 70% of countries with available data. In 20 countries, new teachers at all levels of education are fully qualified without further requirement.
• Formal induction programmes are mandatory in about half of the countries with available data. In most countries, staff within the school are responsible for supporting beginning teachers.
• There are alternative pathways into the teaching profession in around half of the countries with available data. These are most often offered as specific training programmes in traditional teacher education institutions.
Several countries have engaged in reforms of initial teacher training in recent years, as illustrated by the experience of Australia and Denmark (Boxes 1.5 and 1.6).
Box 1.4. Nurturing excellence in teachers in Finland
One of the factors adduced to explain Finnish success in education is the quality of its teachers. A reform at the end of the 1970s strengthened teacher education and made it highly selective. Teacher education moved from teachers’ colleges to universities, and primary school teachers were required to have a master’s degree. At present, teacher education is provided by nine universities, of which eight have teacher training schools. According to selected evidence, only about 10% of candidates who apply to primary-teacher studies are accepted. Applicants for teacher education must have passed the Finnish matriculation examination (or a foreign equivalent) or completed a three-year vocational education programme. The selection process for primary-teacher education involves two stages: an examination to assess applicants’ academic learning skills and a combination of written questions and aptitude tests to assess their skills, motivation and commitment. Primary school teachers major in education, and they may specialise in teaching one or several subjects in their minor subject studies. Upper-grade teachers major in specific subjects and do their pedagogical studies over a five-year programme or as a separate module after graduation. With strong theoretical and practical content, teacher education is research-based, with emphasis on developing pedagogical knowledge. Teachers are trained to adapt their teaching to different learning needs and styles of students. There is also emphasis on the teaching practicum which includes a minor portion of basic teaching skill practice in front of peers in student groups, and a more significant portion of required teaching practice at teacher training schools run by the university or at affiliated schools. In addition, other teacher groups, such as pre-primary teachers and vocational teachers, are required to have a tertiary education degree.
Source: OECD (2015), Education Policy Outlook 2015: Making Reforms Happen, OECD Publishing, Paris, http://dx.doi.org/10.1787/9789264225442-en.
Box 1.5. Reforms to improve initial teacher preparation in Australia
In Australia, initial teacher preparation (ITP) has been the focus of considerable attention and debate in recent years. In response, the Australian Government established the Teacher Education Ministerial Advisory Group (TEMAG) in 2014 to make recommendations on how ITP in Australia could be improved to better prepare new teachers and provide the practical skills needed in the classroom. In 2015, Action Now: Classroom Ready Teachers, TEMAG’s report to the Minister for Education and Training, included 38 recommendations to improve ITP in Australia. The Australian Government’s response to the report identified five main areas of improvement:
• stronger quality assurance of teacher education programmes
• rigorous selection for entry to teacher education programmes…

P r o f e s s i o n a l l e a r n i n g a n d d e ve l o p m e n t t o s u p p o r t t e a ch e r s ’ wo r k Chapter 1
27EMPOWERING AND ENABLING TEACHERS TO IMPROVE EQUITY AND OUTCOMES FOR ALL © OECD 2017
Box 1.6. Major reform of teacher education in Denmark
A major reform of teacher education in Denmark (2012) had as its guiding principles deregulation, internationalisation and a strong connection between teacher training and the needs of the Danish public school system. Starting in 2013, the Bachelor of Education programme was guided by competency objectives for each teaching practice, teacher education was constructed around modules, and the University Colleges (Professionshøjskoler) were granted more autonomy in setting programme structures and determining the content of modules for development of different teacher profiles.
Source: OECD (2014b), Education Policy Outlook: Denmark, OECD, Paris, www.oecd.org/edu/EDUCATION%20POLICY%20OUTLOOK%20DENMARK_EN.pdf.
Teacher certification
There is also considerable variance among countries in how they certify teachers to practice in schools and the extent to which schools are staffed with certified teachers. According to school principals who participated in PISA 2015, the average student across OECD countries attends a school where 84% of teachers have been fully certified, but this proportion ranges widely, from 100% in Macao (China) to around 10% in Colombia. Findings show that the proportion of teachers who have been certified to teach is positively associated with student performance in only a few selected countries, both before and after accounting for the socio-economic profile of students and schools (Figure 1.9). This overall weak impact is not surprising, given the different standards used in different countries to certify teachers and the fact that most countries have a high percentage of certified teachers.
Recent reforms have emphasised the development of teachers’ registries, as in Sweden (Box 1.7) and the Netherlands (Box 1.8).
• improved and structured practical experience for teacher education students
• robust assessment of graduates to ensure classroom readiness
• national research and workforce planning capabilities.
The Australian Government instructed the Australian Institute for Teaching and School Leadership (AITSL) – established in 2010 to lead the national reform agenda in promoting excellence in the profession of teaching, including ITP, and in school leadership – to lead implementation of reforms to strengthen the quality assurance of ITP in Australia. Key reforms since the TEMAG recommendations include:
• Revision of Accreditation of Initial Teacher Education Programs in Australia: Standards and Procedures (2015) to ensure an appropriate level of consistency and transparency across the 48 providers in Australia offering ITP programmes, while at the same time encouraging flexibility and innovation in course design and delivery.
• New selection guidelines for all entrants to ITP programmes (2015) which require providers to implement selection processes that assess both the academic and non-academic capacities of candidates, to use evidence-based selection methods and to be transparent in selection methods, with minimum entry requirements.
• Introduction of a national Literacy and Numeracy Test for Initial Teacher Education Students (2016) to ensure personal literacy and numeracy levels of ITP graduates are equivalent to the top 30% of the population.
Source: Australian Council for Educational Research (forthcoming), OECD Initial Teacher Preparation Study Country Background Report, Commonwealth of Australia, Canberra.

P r o f e s s i o n a l l e a r n i n g a n d d e ve l o p m e n t t o s u p p o r t t e a ch e r s ’ wo r kChapter 1
28 © OECD 2017 EMPOWERING AND ENABLING TEACHERS TO IMPROVE EQUITY AND OUTCOMES FOR ALL
Figure 1.9Percentage of fully certified teachers, school characteristics and science performance
1. ESCS refers to the PISA index of economic, social and cultural status.Note: In Chile the question about the certification of teachers was adapted as “authorised or enabled by the Ministry of Education”.Countries and economies are ranked in descending order of the percentage of fully certified teachers.Source: OECD, PISA 2015 Database, Table II.6.12.1 2 http://dx.doi.org/10.1787/888933436272
Education systems with a positive difference/associationEducation systems with a negative difference/associationDifference/association not significantMissing values
School characteristics Science performanceAdvantaged – disadvantaged
Urban – rural
Private – public
Before ESCS1
After ESCS
Macao (China)Lithuania
MontenegroB-S-J-G (China)
IrelandSlovenia
JapanBulgariaRomania
KoreaAustraliaPolandCroatia
ThailandCanada
Hong Kong (China)Czech Republic
FinlandSlovak RepublicUnited Kingdom
TurkeyUnited States
PortugalChinese TaipeiNew Zealand
SingaporeEstoniaRussiaSpain
GermanyCosta Rica
ItalyMaltaBrazil
GreecePeru
CABA (Argentina)IcelandSweden
Viet NamBelgium
OECD averageAustriaNorwayAlgeriaTunisia
NetherlandsSwitzerland
FranceFYROMQatarJordanIsrael
LuxembourgMoldovaKosovo
LebanonLatvia
IndonesiaUruguay
Trinidad and TobagoUnited Arab Emirates
MexicoGeorgia
ChileColombia
Education systems with a positive difference/association 15 10 9 17 9Education systems with no difference/association 40 33 27 39 48
Education systems with a negative difference/association 10 9 18 9 8
406080100 020Percentage of fully certified teachers
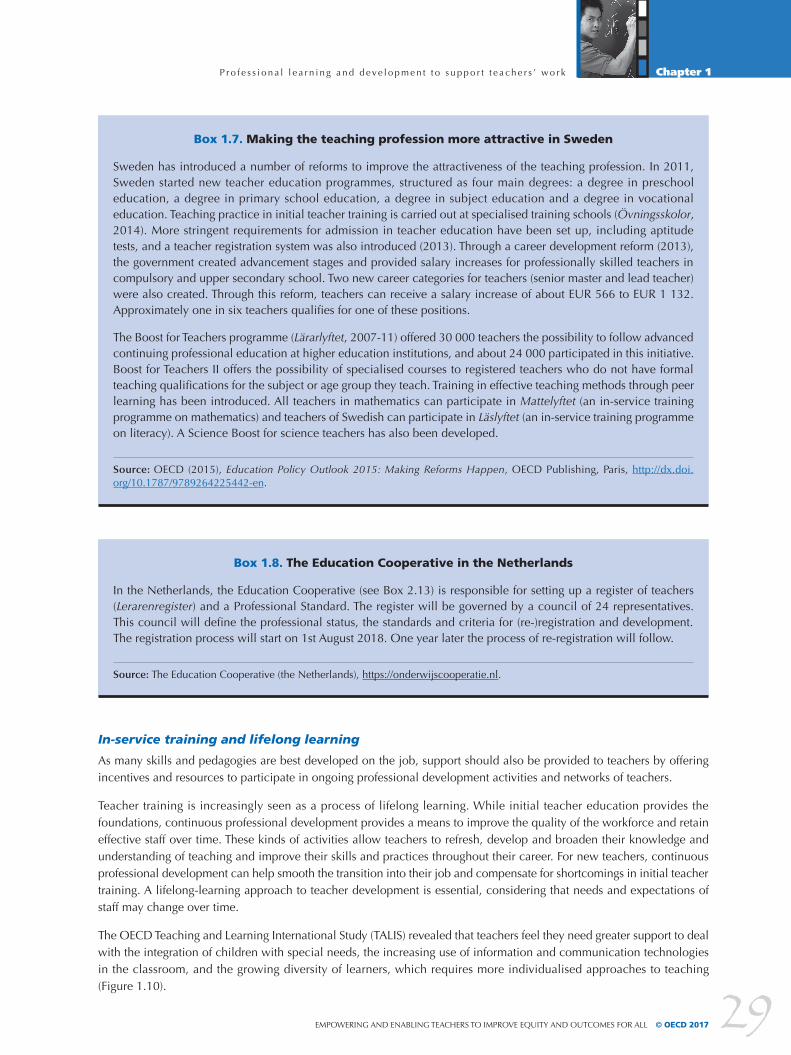
P r o f e s s i o n a l l e a r n i n g a n d d e ve l o p m e n t t o s u p p o r t t e a ch e r s ’ wo r k Chapter 1
29EMPOWERING AND ENABLING TEACHERS TO IMPROVE EQUITY AND OUTCOMES FOR ALL © OECD 2017
Box 1.7. Making the teaching profession more attractive in Sweden
Sweden has introduced a number of reforms to improve the attractiveness of the teaching profession. In 2011, Sweden started new teacher education programmes, structured as four main degrees: a degree in preschool education, a degree in primary school education, a degree in subject education and a degree in vocational education. Teaching practice in initial teacher training is carried out at specialised training schools (Övningsskolor, 2014). More stringent requirements for admission in teacher education have been set up, including aptitude tests, and a teacher registration system was also introduced (2013). Through a career development reform (2013), the government created advancement stages and provided salary increases for professionally skilled teachers in compulsory and upper secondary school. Two new career categories for teachers (senior master and lead teacher) were also created. Through this reform, teachers can receive a salary increase of about EUR 566 to EUR 1 132. Approximately one in six teachers qualifies for one of these positions.
The Boost for Teachers programme (Lärarlyftet, 2007-11) offered 30 000 teachers the possibility to follow advanced continuing professional education at higher education institutions, and about 24 000 participated in this initiative. Boost for Teachers II offers the possibility of specialised courses to registered teachers who do not have formal teaching qualifications for the subject or age group they teach. Training in effective teaching methods through peer learning has been introduced. All teachers in mathematics can participate in Mattelyftet (an in-service training programme on mathematics) and teachers of Swedish can participate in Läslyftet (an in-service training programme on literacy). A Science Boost for science teachers has also been developed.
Source: OECD (2015), Education Policy Outlook 2015: Making Reforms Happen, OECD Publishing, Paris, http://dx.doi.org/10.1787/9789264225442-en.
Box 1.8. The Education Cooperative in the Netherlands
In the Netherlands, the Education Cooperative (see Box 2.13) is responsible for setting up a register of teachers (Lerarenregister) and a Professional Standard. The register will be governed by a council of 24 representatives. This council will define the professional status, the standards and criteria for (re-)registration and development. The registration process will start on 1st August 2018. One year later the process of re-registration will follow.
Source: The Education Cooperative (the Netherlands), https://onderwijscooperatie.nl.
In-service training and lifelong learning
As many skills and pedagogies are best developed on the job, support should also be provided to teachers by offering incentives and resources to participate in ongoing professional development activities and networks of teachers.
Teacher training is increasingly seen as a process of lifelong learning. While initial teacher education provides the foundations, continuous professional development provides a means to improve the quality of the workforce and retain effective staff over time. These kinds of activities allow teachers to refresh, develop and broaden their knowledge and understanding of teaching and improve their skills and practices throughout their career. For new teachers, continuous professional development can help smooth the transition into their job and compensate for shortcomings in initial teacher training. A lifelong-learning approach to teacher development is essential, considering that needs and expectations of staff may change over time.
The OECD Teaching and Learning International Study (TALIS) revealed that teachers feel they need greater support to deal with the integration of children with special needs, the increasing use of information and communication technologies in the classroom, and the growing diversity of learners, which requires more individualised approaches to teaching (Figure 1.10).
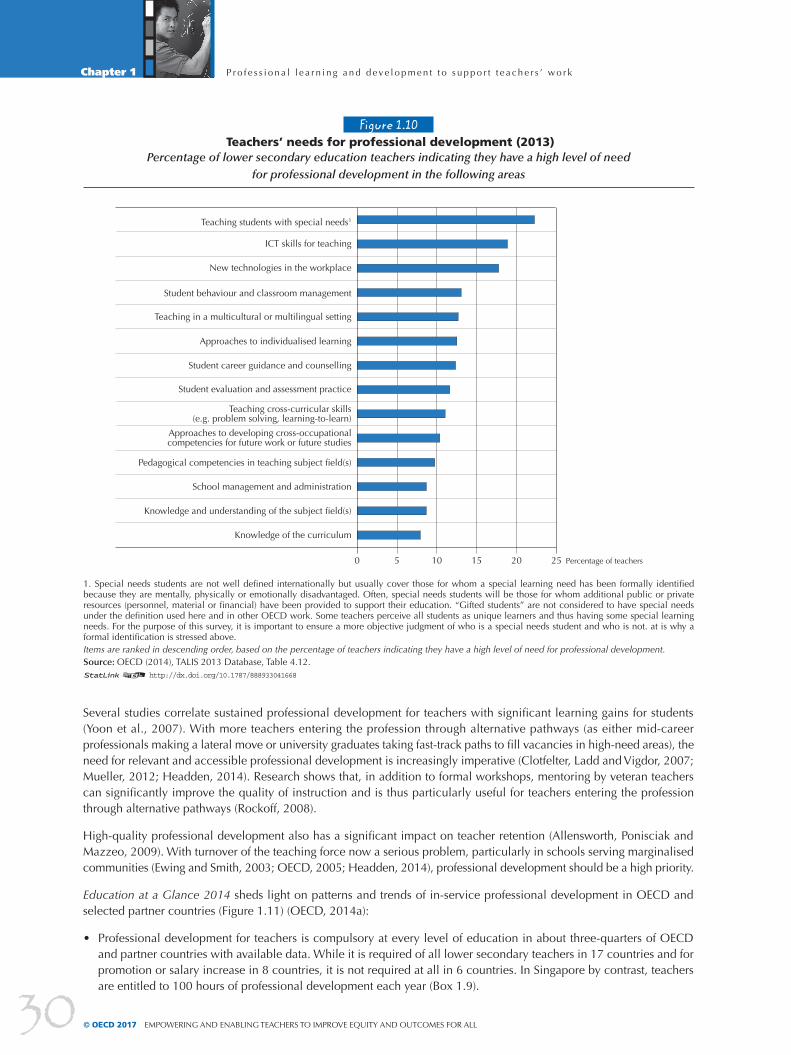
P r o f e s s i o n a l l e a r n i n g a n d d e ve l o p m e n t t o s u p p o r t t e a ch e r s ’ wo r kChapter 1
30 © OECD 2017 EMPOWERING AND ENABLING TEACHERS TO IMPROVE EQUITY AND OUTCOMES FOR ALL
Several studies correlate sustained professional development for teachers with significant learning gains for students (Yoon et al., 2007). With more teachers entering the profession through alternative pathways (as either mid-career professionals making a lateral move or university graduates taking fast-track paths to fill vacancies in high-need areas), the need for relevant and accessible professional development is increasingly imperative (Clotfelter, Ladd and Vigdor, 2007; Mueller, 2012; Headden, 2014). Research shows that, in addition to formal workshops, mentoring by veteran teachers can significantly improve the quality of instruction and is thus particularly useful for teachers entering the profession through alternative pathways (Rockoff, 2008).
High-quality professional development also has a significant impact on teacher retention (Allensworth, Ponisciak and Mazzeo, 2009). With turnover of the teaching force now a serious problem, particularly in schools serving marginalised communities (Ewing and Smith, 2003; OECD, 2005; Headden, 2014), professional development should be a high priority.
Education at a Glance 2014 sheds light on patterns and trends of in-service professional development in OECD and selected partner countries (Figure 1.11) (OECD, 2014a):
• Professional development for teachers is compulsory at every level of education in about three-quarters of OECD and partner countries with available data. While it is required of all lower secondary teachers in 17 countries and for promotion or salary increase in 8 countries, it is not required at all in 6 countries. In Singapore by contrast, teachers are entitled to 100 hours of professional development each year (Box 1.9).
Figure 1.10 Teachers’ needs for professional development (2013)
Percentage of lower secondary education teachers indicating they have a high level of needfor professional development in the following areas
1. Special needs students are not well defined internationally but usually cover those for whom a special learning need has been formally identified because they are mentally, physically or emotionally disadvantaged. Often, special needs students will be those for whom additional public or private resources (personnel, material or financial) have been provided to support their education. “Gifted students” are not considered to have special needs under the definition used here and in other OECD work. Some teachers perceive all students as unique learners and thus having some special learning needs. For the purpose of this survey, it is important to ensure a more objective judgment of who is a special needs student and who is not. at is why a formal identification is stressed above.Items are ranked in descending order, based on the percentage of teachers indicating they have a high level of need for professional development.Source: OECD (2014), TALIS 2013 Database, Table 4.12.1 2 http://dx.doi.org/10.1787/888933041668
0 15 20 255 10 Percentage of teachers
ICT skills for teaching
Teaching students with special needs1
New technologies in the workplace
Student behaviour and classroom management
Approaches to individualised learning
Student career guidance and counselling
Student evaluation and assessment practice
Approaches to developing cross-occupational competencies for future work or future studies
Teaching cross-curricular skills (e.g. problem solving, learning-to-learn)
Pedagogical competencies in teaching subject �eld(s)
School management and administration
Knowledge and understanding of the subject �eld(s)
Knowledge of the curriculum
Teaching in a multicultural or multilingual setting
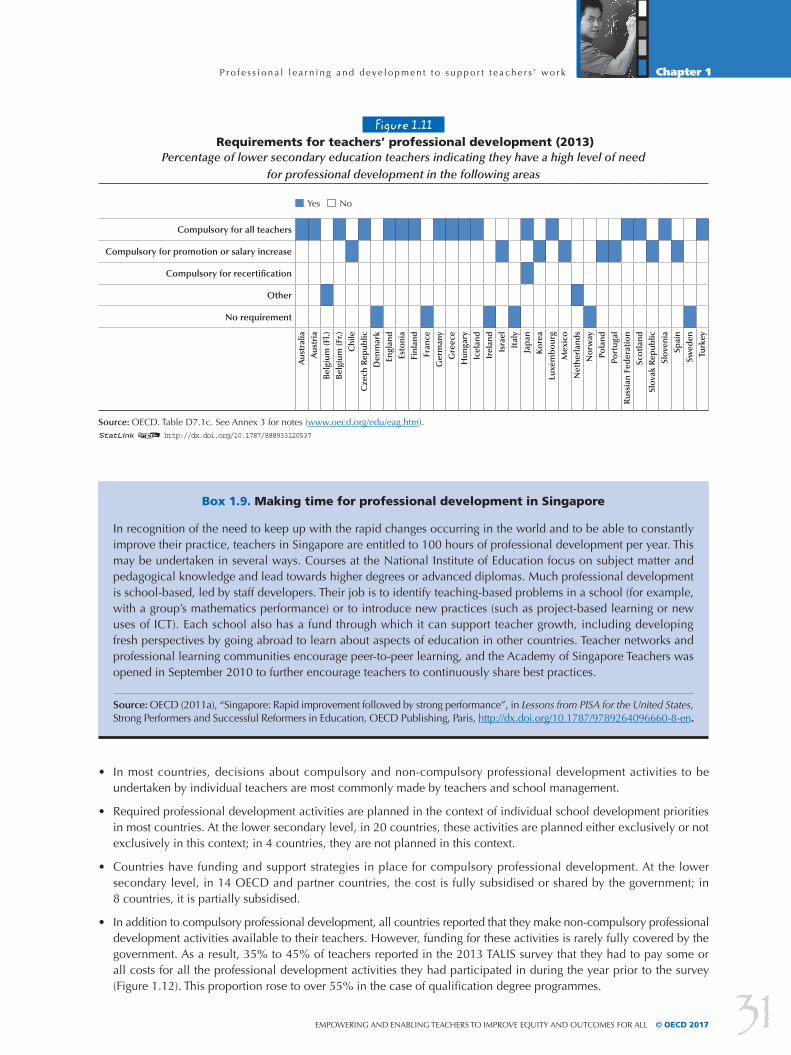
P r o f e s s i o n a l l e a r n i n g a n d d e ve l o p m e n t t o s u p p o r t t e a ch e r s ’ wo r k Chapter 1
31EMPOWERING AND ENABLING TEACHERS TO IMPROVE EQUITY AND OUTCOMES FOR ALL © OECD 2017
Box 1.9. Making time for professional development in Singapore
In recognition of the need to keep up with the rapid changes occurring in the world and to be able to constantly improve their practice, teachers in Singapore are entitled to 100 hours of professional development per year. This may be undertaken in several ways. Courses at the National Institute of Education focus on subject matter and pedagogical knowledge and lead towards higher degrees or advanced diplomas. Much professional development is school-based, led by staff developers. Their job is to identify teaching-based problems in a school (for example, with a group’s mathematics performance) or to introduce new practices (such as project-based learning or new uses of ICT). Each school also has a fund through which it can support teacher growth, including developing fresh perspectives by going abroad to learn about aspects of education in other countries. Teacher networks and professional learning communities encourage peer-to-peer learning, and the Academy of Singapore Teachers was opened in September 2010 to further encourage teachers to continuously share best practices.
Source: OECD (2011a), “Singapore: Rapid improvement followed by strong performance”, in Lessons from PISA for the United States, Strong Performers and Successful Reformers in Education, OECD Publishing, Paris, http://dx.doi.org/10.1787/9789264096660-8-en.
• In most countries, decisions about compulsory and non-compulsory professional development activities to be undertaken by individual teachers are most commonly made by teachers and school management.
• Required professional development activities are planned in the context of individual school development priorities in most countries. At the lower secondary level, in 20 countries, these activities are planned either exclusively or not exclusively in this context; in 4 countries, they are not planned in this context.
• Countries have funding and support strategies in place for compulsory professional development. At the lower secondary level, in 14 OECD and partner countries, the cost is fully subsidised or shared by the government; in 8 countries, it is partially subsidised.
• In addition to compulsory professional development, all countries reported that they make non-compulsory professional development activities available to their teachers. However, funding for these activities is rarely fully covered by the government. As a result, 35% to 45% of teachers reported in the 2013 TALIS survey that they had to pay some or all costs for all the professional development activities they had participated in during the year prior to the survey (Figure 1.12). This proportion rose to over 55% in the case of qualification degree programmes.
Figure 1.11 Requirements for teachers’ professional development (2013)
Percentage of lower secondary education teachers indicating they have a high level of needfor professional development in the following areas
Yes No
Compulsory for all teachers
Compulsory for promotion or salary increase
Compulsory for recertification
Other
No requirement
Aus
tral
iaA
ustr
iaB
elgi
um (F
l.)B
elgi
um (F
r.)C
hile
Cze
ch R
epub
licD
enm
ark
Engl
and
Esto
nia
Finl
and
Fran
ceG
erm
any
Gre
ece
Hun
gary
Icel
and
Irel
and
Isra
elIt
aly
Jap
anK
ore
aLu
xem
bo
urg
Mex
ico
Net
herl
and
sN
orw
ayPo
land
Port
ugal
Rus
sian
Fed
erat
ion
Sco
tlan
dSl
ovak
Rep
ublic
Slov
enia
Spai
nSw
eden
Turk
ey
Source: OECD. Table D7.1c. See Annex 3 for notes (www.oecd.org/edu/eag.htm).1 2 http://dx.doi.org/10.1787/888933120537

P r o f e s s i o n a l l e a r n i n g a n d d e ve l o p m e n t t o s u p p o r t t e a ch e r s ’ wo r kChapter 1
32 © OECD 2017 EMPOWERING AND ENABLING TEACHERS TO IMPROVE EQUITY AND OUTCOMES FOR ALL
• Professional development activities for lower secondary teachers are most commonly provided by higher education institutions (34 countries), institutions for initial teacher education (30 countries), schools (31 countries) and private companies (30 countries). The next most common providers are public agencies for teachers’ professional development and teachers’ professional organisations (22 countries each), teachers’ unions (20 countries), and local education authorities (18 countries). The inspectorate provides these activities in only 6 countries.
• School management plays the largest role in circulating information about professional development activities. In about two-thirds of countries, central or state education authorities are also responsible for circulating information about professional development activities.
• The most common professional development activities are still rather traditional, with 71% of teachers reporting participation in courses and workshops in the past year (Figure 1.13).
• However, recent evidence suggests that these predominant forms of professional development may not be the most effective ways to improve teachers’ skills and enhance their practice. Indeed, a recent OECD study examined the impact of different forms of professional development. It showed that when teachers participate in school-embedded professional development that involves sustained collaboration with colleagues from their school on problems of practice and uses real student work and curriculum examples, they report greater positive impacts on their pedagogical knowledge and practices than in non-school embedded forms of professional development, such as conferences, courses or workshops (Opfer, 2016) (Figure 1.14).
Figure 1.12Level of personal payment for teachers’ professional development participation (2013)
Percentage of lower secondary education teachers who report having participatedin the following professional development activities and who “paid no cost”, “paid some cost”
or “paid all cost” for the activities they participated in1
1. Teachers can participate in more than one professional development activity at the same time. Teachers were not asked about the level of personal payment for each activity but rather for their general level of personal payment for all the professional development activities they participated in. Therefore, the percentages presented in this figure should be interpreted as the level of general personal payment reported by the teachers who participated in each type of professional development activity. Professional development activities are ranked in descending order, based on the average percentage of teachers who reported paying no cost.Source: OECD (2014), TALIS 2013 Database, Tables 4.6 and 4.9.1 2 http://dx.doi.org/10.1787/888933041535
Courses/workshops
0 30 40 6010 20 50 1009070 80 %
Mentoring and/or peer observation and coaching, as part of a formal school arrangement
Participation in a network of teachers formed speci�cally for the professional development of teachers
Education conferences or seminars where teachers and/or researchers present their research results
and discuss educational issues
Observation visits to business premises, public organisations or non-governmental organisations
Individual or collaborative research on a topic of interest to the teacher
In-service training courses in business premises, public organisations or non-governmental organisations
Quali�cation programme (e.g. a degree programme)
Observation visits to other schools
Paid all costPaid some costPaid no cost

P r o f e s s i o n a l l e a r n i n g a n d d e ve l o p m e n t t o s u p p o r t t e a ch e r s ’ wo r k Chapter 1
33EMPOWERING AND ENABLING TEACHERS TO IMPROVE EQUITY AND OUTCOMES FOR ALL © OECD 2017
Figure 1.14Correlation between participation in school embedded professional development
and teacher reports of instructional impact by country
Source: Adapted from OECD (2015b), “Embedding professional development in schools for teacher success”, http://dx.doi.org/10.1787/5js4rv7s7snt-en.
Figure 1.13Professional development recently undertaken by teachers by type and intensity (2013)
Participation rates and average number of days for each type of professional development reported to be undertaken by lower secondary education teachers in the 12 months prior to the survey
Percentage of teachers who participated in the following
professional development activities in the 12 months prior to the survey
Average number of days
of participation among those
who participated
Courses/workshops 8
Education conferences or seminars where teachers and/or researchers present their research results and discuss educational issues 4
Observation visits to other schools 3
In-service training courses in business premises, public organisations or non-governmental organisations 7
Observation visits to business premises, public organisations or non-governmental organisations 3
Participation in a network of teachers formed specifically for the professional development of teachers
Individual or collaborative research on a topic of interest to the teacher
Mentoring and/or peer observation and coaching, as part of a formal school arrangement
Qualification programme (e.g. a degree programme)
Items are ranked in descending order for each block, based on the percentage of teachers who report having participated in professional development activities in the 12 months prior to the survey.Source: OECD, TALIS 2013 Database, Tables 4.9 and 4.9.Web.1 2 http://dx.doi.org/10.1787/888933041554
37%
31%
29%
18%
44%
71%
19%
14%
13%
Correlation Coef�cients
0.5
0.4
0.3
0.2
0.1
0.0
Alb
erta
(Can
ada)
Latv
ia
Aus
tral
ia
Flan
der
s (B
elgi
um)
Sing
apo
re
Finl
and
Chi
le
Net
herl
and
s
Icel
and
Pola
nd
Engl
and
(UK
)
Den
mar
k
Cze
ch R
epub
lic
Swed
en
Esto
nia
No
rway
Cro
atia
Isra
el
Port
ugal
Ital
y
Bra
zil
Bul
gari
a
Ro
man
ia
Ko
rea
Fran
ce
Mex
ico
Spai
n
Serb
ia
Ab
u D
hab
i (U
AE)
Slo
vak
Rep
ublic
Jap
an

P r o f e s s i o n a l l e a r n i n g a n d d e ve l o p m e n t t o s u p p o r t t e a ch e r s ’ wo r kChapter 1
34 © OECD 2017 EMPOWERING AND ENABLING TEACHERS TO IMPROVE EQUITY AND OUTCOMES FOR ALL
Impact of teachers’ participation in professional development
Professional development activities usually focus on three different types of content: knowledge and understanding of teacher’s subject field(s) (subject matter), pedagogical competencies in teaching teacher’s subject field(s) (pedagogy) and knowledge of the curriculum (curriculum). Professional development can have an impact directly on student outcomes or indirectly through teaching practices.
Regarding the latter, what professional development content matters for developing teachers’ classroom practices? How can policy makers best provide for the demand and development of teachers to achieve or maintain quality education? In other words, what are the most effective content and the delivery modes to promote the development of teachers? A recent OECD study shows that teachers who have participated in professional development activities focusing on subject matter, pedagogy or curriculum tend to use promising classroom practices1 more frequently (Barrera-Pedemonte, 2016). Interestingly, this study also shows that participating in professional development focusing on curriculum, rather than subject matter or pedagogy, is related to greater teachers’ reported efforts for enhancing students’ learning. It is the focus of professional development that more systematically increases the likelihood of more frequently using promising teaching practices (with the exception of two practices: presenting a summary of recently learned content and checking students’ notebooks).
With respect to the direct impact of professional development on student outcomes, PISA 2015 asked school principals to report the percentage of teaching staff in their school who had attended a programme of professional development in the three months prior to the PISA assessment (defined as a formal programme of at least one day that is designed to enhance teaching skills or pedagogical practices). Across most countries and economies participating in PISA, results show a weak association between teachers’ participation in professional development activities and students’ performance in science, regardless of whether the participation of all teachers or only of science teachers is considered. After accounting for the socio-economic profile of students and schools, students scored higher in science when more of their science teachers had participated in professional development activities in just eight education systems. In seven other systems, however, students scored lower in science when their science teachers had participated in such activities.
But in light of the previous discussion about school-embedded professional development, it is worth examining the types of professional development activities available. Indeed, PISA 2015 also asked school principals whether their school offers a series of in-house professional development activities, such as teachers co-operating by exchanging ideas or material when teaching specific units or series of lessons, inviting specialists to conduct inservice training for teachers, organising in-service workshops that address specific issues facing the school, or organising in-service workshops for specific groups of teachers. Focusing on these school-embedded forms of professional development sheds a different light on these results. On average across OECD countries, three of the four types of in-house professional development activities are positively related to student performance in science before accounting for the socio-economic profile of students and schools, but only professional collaboration among teachers in the school is also positively associated with student performance in science after accounting for the socio-economic profile of students and schools. When school principals reported that teachers co-operate by exchanging ideas or material, the average 15-year-old student in OECD countries scores 9 points higher in science; in Slovenia, the average student scores 36 points higher, suggesting particularly effective forms of collaboration. According to the recent TALIS report on Supporting Teacher Professionalism: Insights from TALIS 2013 (OECD 2016c), a collaborative culture within the school also shows one of the strongest associations with teachers’ self-efficacy and job satisfaction (OECD, 2016d).
PROFESSIONAL AUTONOMY AND EVIDENCE-INFORMED DECISIONSAmong the many decisions that education authorities and schools have to make, those concerning the way responsibilities for education are distributed and managed have a direct impact on teaching and learning.
The importance of school governance and autonomy for system performanceSchool autonomy is the focus of much of the debate concerning school governance. Since the early 1980s, many school systems, such as those in Australia, Canada, Finland, Hong Kong (China), Israel, Singapore, Spain, Sweden and the United Kingdom, have granted individual schools greater authority to make decisions about curricula and resource allocation (Cheng and Lee, 2016; Fuchs and Woessmann, 2007; Wang, 2013). The underlying premise is that individual schools have highly qualified teachers and strong leaders who are good judges of their students’ learning needs, and who can (re)design and implement rigorous curricula, internal evaluations and accountability mechanisms without feeling overloaded (Caldwell and Spinks, 2013; Department for Education, 2010; Hanushek, Link and Woessmann, 2013). Such school-based management involves increasing principals’ decision-making responsibility and accountability and, in some cases, the management responsibilities of teachers or department heads.

P r o f e s s i o n a l l e a r n i n g a n d d e ve l o p m e n t t o s u p p o r t t e a ch e r s ’ wo r k Chapter 1
35EMPOWERING AND ENABLING TEACHERS TO IMPROVE EQUITY AND OUTCOMES FOR ALL © OECD 2017
Figure 1.15Index of school autonomy, school characteristics and science performance
Results based on school principals’ reports
1. The index of school autonomy is calculated as the percentage of tasks for which the principal, the teachers or the school governing board have considerable responsibility.2. The socio-economic profile is measured by the PISA index of economic, social and cultural status (ESCS).Note: See Annex A7 for instructions on how to interpret this figure.Countries and economies are ranked in descending order of the index of school autonomy.Source: OECD, PISA 2015 Database, Table II.4.5.1 2 http://dx.doi.org/10.1787/888933435854
Positive difference/associationNegative difference/associationDifference/association is not significantMissing values
School characteristics Science performanceAdvantaged – disadvantaged
Urban – rural
Private – public
Before ESCS2
After ESCS
Macao (China)Czech RepublicUnited Kingdom
LithuaniaNetherlands
ThailandSlovak Republic
EstoniaSweden
New ZealandLatvia
Hong Kong (China)DenmarkIndonesia
IcelandRussia
BulgariaUnited States
ChilePoland
SloveniaGeorgiaAustralia
IsraelIrelandFinland
Chinese TaipeiSingapore
JapanLebanonNorwayFYROM
OECD averageMoldova
SwitzerlandBelgiumRomania
LuxembourgColombia
KoreaCanada
PeruCroatiaQatar
HungaryCABA (Argentina)
GermanyPortugal
Trinidad and TobagoUnited Arab Emirates
FranceAustria
MontenegroSpainItaly
MaltaCosta Rica
B-S-J-G (China)Brazil
Dominican RepublicViet NamMexicoKosovoAlgeria
UruguayJordanTunisiaTurkeyGreece
Education systems with a positive difference/association 32 15 50 29 12Education systems with a no difference/association 33 36 8 35 47
Education systems with a negative difference/association 3 4 0 4 9
02040100 6080Index of school autonomy (%)1

P r o f e s s i o n a l l e a r n i n g a n d d e ve l o p m e n t t o s u p p o r t t e a ch e r s ’ wo r kChapter 1
36 © OECD 2017 EMPOWERING AND ENABLING TEACHERS TO IMPROVE EQUITY AND OUTCOMES FOR ALL
But school systems differ in the degree of autonomy granted to schools and in the domains over which schools have autonomy. PISA 2015 asked school principals to report whether the teachers, the principal, the school’s governing board, the regional or local education authorities, the national education authority, or a combination of them, have considerable responsibility for the following areas: 1) allocating resources to schools (appointing and dismissing teachers; determining teachers’ starting salaries and salary raises; and formulating school budgets and allocating them within the school); 2) the school curriculum (choosing textbooks; deciding which courses are offered; and determining the content of those courses); and 3) establishing student assessment, disciplinary and school admissions policies. The results show that at one end of the spectrum, schools enjoy considerable autonomy in the Czech Republic, Lithuania, Macao (China), the Netherlands and the United Kingdom. At the other end of the spectrum, autonomy granted to school principals or teachers is limited in Greece, Jordan, Tunisia and Turkey, at least in comparison with other education systems (OECD, 2016d: 110).
According to the latest PISA results, the impact of school autonomy on student performance is complex, apparently depending on a number of factors:
• On the one hand, top-performing systems tend to score high on the school autonomy index. On average across OECD countries and in 29 education systems, students in schools whose principals reported that more responsibilities lie with either teachers or themselves score higher in science (Figure 1.15).
• However, on average across OECD countries, the association between autonomy and student performance in science no longer holds after accounting for the socio-economic profile of students and schools. There is a positive association with science performance in only 12 education systems, and the association is negative in 9 countries and economies. These findings are consistent with a comprehensive review by Jensen, Weidmann and Farmer (2013), who reported that a wide range of studies show that increased autonomy may improve academic achievement only to some extent, and only in some countries. More school autonomy may not always be effective, and several studies find that the benefits of school autonomy may be contingent on how prepared schools are to use their responsibility effectively and how accountable they are for student outcomes to parents, local communities and education authorities. To reap the full benefits of school autonomy, education systems need to have effective accountability systems, as well as highly qualified teachers and strong school leaders to design and implement rigorous internal evaluations and curricula (Hanushek, Link and Woessmann, 2013; OECD, 2011b).
It is, therefore, helpful to explore the impact of school autonomy in more depth, by examining how the five areas of responsibility overseen by principals, teachers, school governing boards, local/regional education authorities and national education authorities (resources, curriculum, assessment, school admissions and disciplinary policies) relate to both student performance in science and equity in the system (Figure 1.16).
With respect to student performance, the results from PISA 2015 show that students score higher in science in school systems where principals and, to some extent, teachers have greater autonomy in managing their schools. This is particularly true when principals or teachers have greater responsibility for the curriculum, but less so when they have a greater say in deciding which students are admitted to the school. Students score lower in science in systems where school governing boards have greater responsibility for school admissions policies and also when national education authorities hold greater responsibility for resources, curriculum, and disciplinary and assessment policies. No link is observed between the responsibility held by local/regional education authorities and performance in science.
In relation to equity, PISA results are less conclusive. More autonomy for schools and teachers does not seem positively associated with equity in science performance. In fact, results in science seem more equitable (i.e. there is a weaker association between students’ socio-economic status and their performance in science) when education authorities have greater responsibility for disciplinary policies (Figure 1.17).
Responsibility for school governance and school autonomy
In addition to these overall relationships, PISA 2015 also sheds light on patterns of school governance and teacher autonomy.
Across OECD countries, most students are enrolled in schools whose principal reported having considerable responsibility and autonomy for hiring teachers (70% of students attend such schools) or firing teachers (57% of students attend such schools), but fewer than one in four students attend a school whose principal reported having considerable responsibility for establishing teachers’ starting salaries (20%) or salary increases (23%). More than half of students are in schools whose principal reported having considerable responsibility over budgetary issues, including deciding how the budget should be allocated within the school, disciplinary, assessment and admissions policies, and also which courses are offered at the school. Across education systems, differences in responsibility for hiring and firing teachers are particularly large.
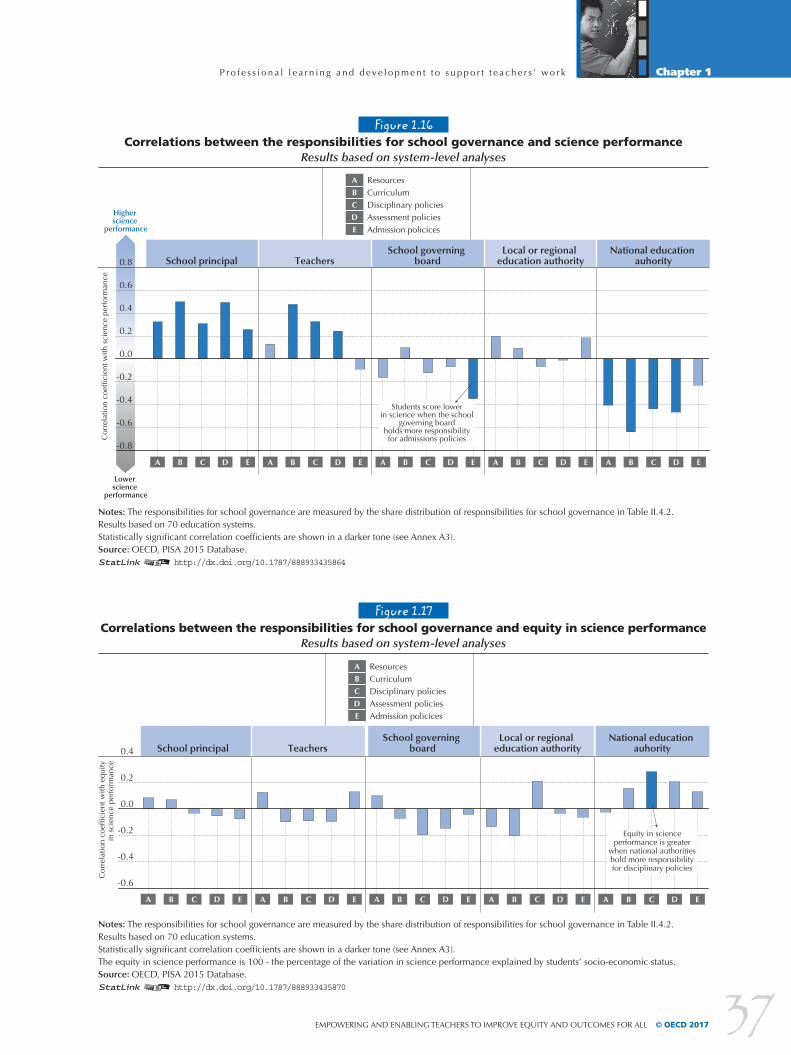
P r o f e s s i o n a l l e a r n i n g a n d d e ve l o p m e n t t o s u p p o r t t e a ch e r s ’ wo r k Chapter 1
37EMPOWERING AND ENABLING TEACHERS TO IMPROVE EQUITY AND OUTCOMES FOR ALL © OECD 2017
Figure 1.16Correlations between the responsibilities for school governance and science performance
Results based on system-level analyses
Notes: The responsibilities for school governance are measured by the share distribution of responsibilities for school governance in Table II.4.2.Results based on 70 education systems.Statistically significant correlation coefficients are shown in a darker tone (see Annex A3).Source: OECD, PISA 2015 Database.1 2 http://dx.doi.org/10.1787/888933435864
Higher science
performance
Lower science
performance
Cor
rela
tion
coef
�cie
nt w
ith s
cien
ce p
erfo
rman
ce
0.8
0.6
0.4
0.2
0.0
-0.2
-0.4
-0.6
-0.8
School principal TeachersSchool governing
boardLocal or regional
education authorityNational education
auhority
A B C D E A B C D E A B C D E A B C D E A B C D E
Students score lower in science when the school
governing board holds more responsibility for admissions policies
Notes: The responsibilities for school governance are measured by the share distribution of responsibilities for school governance in Table II.4.2.Results based on 70 education systems.Statistically significant correlation coefficients are shown in a darker tone (see Annex A3).The equity in science performance is 100 - the percentage of the variation in science performance explained by students’ socio-economic status.Source: OECD, PISA 2015 Database.1 2 http://dx.doi.org/10.1787/888933435870
Figure 1.17Correlations between the responsibilities for school governance and equity in science performance
Results based on system-level analyses
A B C D EA B C D EA B C D EA B C D E
Cor
rela
tion
coef
�cie
nt w
ith e
quity
in s
cien
ce p
erfo
rman
ce
0.4
0.2
0.0
-0.2
-0.4
-0.6
School principal TeachersSchool governing
boardLocal or regional
education authorityNational education
auhority
Equity in science performance is greater
when national authorities hold more responsibility for disciplinary policies
A B C D E
A ResourcesB CurriculumC Disciplinary policiesD Assessment policiesE Admission policices
A ResourcesB CurriculumC Disciplinary policiesD Assessment policiesE Admission policices

P r o f e s s i o n a l l e a r n i n g a n d d e ve l o p m e n t t o s u p p o r t t e a ch e r s ’ wo r kChapter 1
38 © OECD 2017 EMPOWERING AND ENABLING TEACHERS TO IMPROVE EQUITY AND OUTCOMES FOR ALL
In Greece, Jordan, Tunisia and Turkey, fewer than one in ten students attend schools whose principals reported having considerable responsibility over hiring, while in the Czech Republic, Iceland, Montenegro and Sweden, virtually all students are in schools whose principals reported having such responsibility.
With respect to teacher autonomy, school principals in most countries and economies participating in PISA reported that teachers have limited input on their working conditions (hiring, firing and salaries), school budgetary matters and admissions policies. They have more responsibility for disciplinary and assessment policies, choosing textbooks and course content, with around six in ten students or more attending schools whose principal reported that teachers have considerable responsibility for these issues. On average across OECD countries, about half of the students attend schools whose principal reported that teachers have considerable responsibility over which courses are offered at school. Despite having substantial responsibility over curricula across most education systems participating in PISA, teachers in some countries appear to have little autonomy in choosing textbooks, determining course content or deciding which courses are offered. For example, in Greece and Jordan, fewer than one in ten students attend a school whose principal reported that teachers have considerable responsibility over selecting textbooks, courses offered or course content.
In general, local, regional and national authorities have greater responsibility over resources (especially over establishing teachers’ starting salaries and salary increases) than over disciplinary, assessment or admissions policies, or over the curriculum. However, in some education systems, school principals reported that regional or national authorities have considerable responsibility over these issues too. For instance, a majority of principals in Beijing-Shanghai-Jiangsu-Guangdong (China) (hereafter “B-S-J-G [China]”), the federal states of Switzerland and the United States reported that local or regional authorities have considerable responsibility over the curriculum, specifically in determining course content, and deciding which courses are offered and which textbooks will be used. In more centralised education systems, such as those in Croatia, Greece, Luxembourg, Tunisia and Turkey, the national government was cited as holding considerable responsibility over assessment policies and the curriculum.
Figure 1.18 presents a summary of “who is responsible for what” in managing schools across OECD countries. On average across OECD countries, establishing teachers’ starting salaries and salary increases is mainly the responsibility of national authorities, while choosing course content and textbooks is the responsibility of teachers, and assessment and disciplinary policies are jointly established by principals and teachers. All other responsibilities, including hiring and firing teachers, overseeing budgetary issues, setting policy for admissions and deciding which courses are offered at school are held mainly by school principals.
Figure 1.18Summary of responsibilities for school governance
Based on OECD average
Responsibility Held mainly by1 Shared with2 Minor role3
Resources: teachers
Establishing teachers’ starting salaries National authority Local/Regional authority Principal
Determining teachers’ salary increases National authority Local/Regional authority Principal
Selecting teachers for hire Principal Local/regional/national authority
Firing teachers Principal Local/Regional authority School board and national authority
Resources: budget
Formulating the school budget Principal School board and local/regional
authority National authority
Deciding on budget allocations within the school Principal School board Local/Regional authority
Curriculum
Deciding which courses are offered Principal Teachers and school board Local/Regional authority
Choosing which textbooks are used Teachers Principal National authority
Determining course content Teachers Principal and national authority Local/Regional authority
Establishing student assessment policies Principal and teachers National authority School board
Establishing student disciplinary policies Principal and teachers School board
Approving students for admission to the school Principal School board and local/regional authority
1. More than 50% of students attend schools whose principal reported that a given actor has considerable responsibility.2. Between more than 25% and 50% of students attend schools whose principal reported that a given actor has considerable responsibility.3. Between 15% and 25% of students attend schools whose principal reported that a given actor has considerable responsibility.Source: OECD, PISA 2015 Database, Table II.4.1.
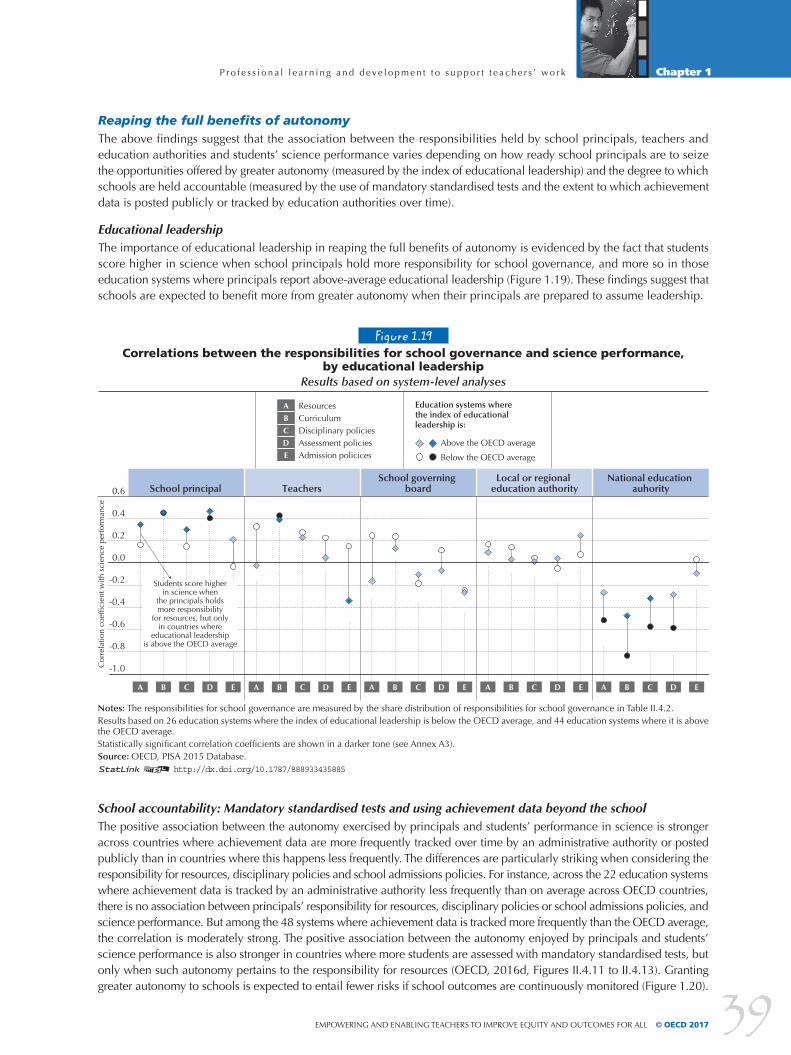
P r o f e s s i o n a l l e a r n i n g a n d d e ve l o p m e n t t o s u p p o r t t e a ch e r s ’ wo r k Chapter 1
39EMPOWERING AND ENABLING TEACHERS TO IMPROVE EQUITY AND OUTCOMES FOR ALL © OECD 2017
Reaping the full benefits of autonomyThe above findings suggest that the association between the responsibilities held by school principals, teachers and education authorities and students’ science performance varies depending on how ready school principals are to seize the opportunities offered by greater autonomy (measured by the index of educational leadership) and the degree to which schools are held accountable (measured by the use of mandatory standardised tests and the extent to which achievement data is posted publicly or tracked by education authorities over time).
Educational leadershipThe importance of educational leadership in reaping the full benefits of autonomy is evidenced by the fact that students score higher in science when school principals hold more responsibility for school governance, and more so in those education systems where principals report above-average educational leadership (Figure 1.19). These findings suggest that schools are expected to benefit more from greater autonomy when their principals are prepared to assume leadership.
Figure 1.19Correlations between the responsibilities for school governance and science performance,
by educational leadershipResults based on system-level analyses
Notes: The responsibilities for school governance are measured by the share distribution of responsibilities for school governance in Table II.4.2.Results based on 26 education systems where the index of educational leadership is below the OECD average, and 44 education systems where it is above the OECD average. Statistically significant correlation coefficients are shown in a darker tone (see Annex A3).Source: OECD, PISA 2015 Database.1 2 http://dx.doi.org/10.1787/888933435885
Cor
rela
tion
coef
�cie
nt w
ith s
cien
ce p
erfo
rman
ce
0.6
0.4
0.2
0.0
-0.2
-0.4
-0.6
-0.8
-1.0
School principal TeachersSchool governing
boardLocal or regional
education authorityNational education
auhority
A B C D EA B C D EA B C D EA B C D EA B C D E
Students score higher in science when
the principals holds more responsibility
for resources, but only in countries where
educational leadership is above the OECD average
A ResourcesB CurriculumC Disciplinary policiesD Assessment policiesE Admission policices
Above the OECD average
Below the OECD average
Education systems where the index of educational leadership is:
School accountability: Mandatory standardised tests and using achievement data beyond the schoolThe positive association between the autonomy exercised by principals and students’ performance in science is stronger across countries where achievement data are more frequently tracked over time by an administrative authority or posted publicly than in countries where this happens less frequently. The differences are particularly striking when considering the responsibility for resources, disciplinary policies and school admissions policies. For instance, across the 22 education systems where achievement data is tracked by an administrative authority less frequently than on average across OECD countries, there is no association between principals’ responsibility for resources, disciplinary policies or school admissions policies, and science performance. But among the 48 systems where achievement data is tracked more frequently than the OECD average, the correlation is moderately strong. The positive association between the autonomy enjoyed by principals and students’ science performance is also stronger in countries where more students are assessed with mandatory standardised tests, but only when such autonomy pertains to the responsibility for resources (OECD, 2016d, Figures II.4.11 to II.4.13). Granting greater autonomy to schools is expected to entail fewer risks if school outcomes are continuously monitored (Figure 1.20).

P r o f e s s i o n a l l e a r n i n g a n d d e ve l o p m e n t t o s u p p o r t t e a ch e r s ’ wo r kChapter 1
40© OECD 2017 EMPOWERING AND ENABLING TEACHERS TO IMPROVE EQUITY AND OUTCOMES FOR ALL
Figure 1.20Correlations between the responsibilities for school governance and science performance,
by use of mandatory standardised testsResults based on system-level analyses
Note: The responsibilities for school governance are measured by the share distribution of responsibilities for school governance in Table II.4.2.Results based on 30 education systems where the percentage of students who are assessed using mandatory standardised tests at least once a year is below the OECD average and 35 education systems where it is above the OECD average. Statistically significant correlation coefficients are shown in a darker tone (see Annex A3).Source: OECD, PISA 2015 Database.
1 2 http://dx.doi.org/10.1787/888933435891
Cor
rela
tion
coef
�cie
nt w
ithsc
ienc
e pe
rfor
man
ce
0.6
0.4
0.2
0.0
-0.2
-0.4
-0.6
-0.8
School principal TeachersSchool governing
boardLocal or regional
education authorityNational education
auhority
A B C D EA B C D EA B C D EA B C D EA B C D E
Students score higher in science when the principal holds more
responsibility for resources, but only in countries where
the use of mandatory standardised tests
is above OECD average
A ResourcesB CurriculumC Disciplinary policiesD Assessment policiesE Admission policices
Above the OECD averageBelow the OECD average
Education systems where the percentage of students who are assessed using mandatory standardised tests at least once a year is:
Germany provides an interesting example of how national assessments can be used to monitor and ensure quality of the education system (Box 1.10).
Box 1.10. Assessment and trend analysis in Germany’s federal system
In Germany, four elements of quality assurance provide an insight into the strengths and challenges of the 16 Länder school systems: 1) attainment of national education standards; 2) analysis of changes over time; 3) comparison between the Länder; and 4) close examination of student sub-groups. Regular national assessments are an integral part of the comprehensive strategy for educational monitoring of the Standing Conference of Ministers of Education and Cultural Affairs of the Länder (revised in 2015). The assessments aim to measure the extent to which students in Germany reach the binding national educational standards and to identify challenges that require intervention. They are carried out every five years at the primary level and every three years at secondary level (where they alternate between German/English/French and mathematics/science). The results are analysed at the level of the school system of each of the Länder. The 2015 National Assessment, administered by the Institute for Educational Quality Improvement, measures students’ competence in German and English (as well as French in six Länder) towards the end of lower secondary education (Grade 9). Trend analyses, considered crucial for monitoring the education system, are now able to show the changes within the tested content areas compared to the first testing round in 2009. This significantly extends the range of possible analyses and the informational value of the results compared to earlier rounds. It is furthermore possible to examine differences in competencies based on gender, social and migration disparities and the progress made between 2009 and 2015 in reducing these disparities.
Sources: Institut zur Qualitätsentwicklung im Bildungswesen (IQB) (n.d.), https://www.iqb.hu-berlin.de/bt; Stanat, P. et al. (eds.) (2016), IQB-Bildungstrend 2015: Sprachliche Kompetenzen am Ende der 9. Jahrgangsstufe im zweiten Ländervergleich, Zusammenfassung, https://www.iqb.hu-berlin.de/bt/bt/BT2015/BT_2015_Zusammen.pdf.

P r o f e s s i o n a l l e a r n i n g a n d d e ve l o p m e n t t o s u p p o r t t e a ch e r s ’ wo r k Chapter 1
41EMPOWERING AND ENABLING TEACHERS TO IMPROVE EQUITY AND OUTCOMES FOR ALL © OECD 2017
Teacher performance and intelligent accountability
Although accountability mechanisms are important to ensure the effectiveness of school and teacher autonomy, a word of caution is necessary regarding the impact of these mechanisms on teachers’ work. Indeed, excessive and unchecked test-based accountability can be an important source of stress, burn out and even early attrition among teachers (Ball, 2003). Furthermore, poorly designed test-based accountability can lead to unintended consequences such as “teaching to the test”, where classroom lessons are circumscribed to be only training sessions to give the correct answers on a standardised test (Koretz, 2008).
It is therefore critical for educational systems to focus efforts on designing an “intelligent accountability” system (Salhberg, 2010). Based on the successful educational performance of Finland, Salhberg has identified three key policy recommendations to develop an “intelligent accountability” approach:
1. Build trust and collective responsibility
As mentioned in previous sections, teachers should be treated as professionals, and as with other professions, the relationship with teachers should be based on trust. Granting autonomy to teachers and making them accountable through teacher-based assessment are both signs of trust. The case of Finland and other Nordic countries has shown that educational performance benefits when more responsibility is placed on teachers and they are held accountable. However, the accountability procedure should not “jeopardise the trust and social capital in schools but should instead strengthen it” (Sahlberg, 2010).
2. Promote in-school accountability procedures and match them to external accountability needs
An in-school intelligent accountability procedure requires involving all relevant stakeholders (i.e. principals, teachers, parents, etc.) in setting the educational goals of the school. It is also based on the use of data from “student assessments, external examinations, teacher-led classroom assessments, feedback from parents and school self-evaluations” (Sahlberg, 2010). Finally it examines the outcomes of a wide spectrum of learning, not only limited to knowledge in subject fields (i.e. mathematics, language, science, etc.), but also development of skills, attitudes and values.
3. The relevance of teacher collaboration
Accountability procedures, especially external test-based accountability should be mindful of not disrupting the collaboration and networking of teachers. Teacher collaboration is a crucial component for the adoption of innovative practices, and collaboration between and within schools can be effective to improve the quality of instruction and to adequately respond to the pressure brought by external teacher-based accountability.
Promoting effective teaching practices
With respect to teacher autonomy, one of the most relevant and difficult decisions that teachers have to make is how to teach. Teachers need to decide how much emphasis to give to learning concepts and facts, class discussions, debates, hands-on activities and students’ questions. The best way of teaching will depend to some extent on the needs of the students, so there is no such thing as a “best teaching strategy” which works in all contexts. However, teachers do need to decide on the best combination of instructional practices to help their students to achieve the best possible outcomes.
A particularly heated debate is taking place as to whether teacher-directed practices or student-oriented instruction are more effective, and PISA 2015 examined the impact of teacher-directed practices on science performance (Figure 1.21). Teacher-directed practices provide a well-structured, clear and informative lesson on a topic, which usually includes explanations by the teacher, classroom debates and questions from students, while student-oriented instruction is more responsive to the demands of students. Like mathematics teachers, science teachers use teacher-directed strategies more frequently than other types of instructional practices.
In order to understand which are the most effective teaching practices, it is important to relate them to student outcomes.
• Teacher-directed instruction: Among countries participating in PISA 2015, in all but three education systems (Indonesia, Korea and Peru) using teacher-directed instruction more frequently is associated with higher science achievement, after accounting for socio-economic status. With teacher-directed instruction, students in all countries also hold stronger epistemic beliefs, such as understanding that scientific ideas change in light of new evidence. A positive association is also observed with students’ expectations of pursuing science-related careers.

P r o f e s s i o n a l l e a r n i n g a n d d e ve l o p m e n t t o s u p p o r t t e a ch e r s ’ wo r kChapter 1
42 © OECD 2017 EMPOWERING AND ENABLING TEACHERS TO IMPROVE EQUITY AND OUTCOMES FOR ALL
• Adaptive instruction: This refers to teachers’ flexibility with their lessons and their ability to adapt them to students with different knowledge, ability and needs, including support to students who are struggling. Across OECD countries, about 16% of students reported that their science teachers adapt their instruction in every lesson or almost every lesson, and almost 30% reported that teachers do so in many lessons. In almost every education system that participated in PISA 2015, the frequent use of adaptive instruction was associated with higher student performance, and these students also hold stronger epistemic beliefs. PISA results also suggest that more school autonomy seems to allow teachers to tailor their teaching to their students’ needs, rather than following a detailed predefined curriculum (Figure 1.22).
• Feedback from teachers and enquiry-based instruction: A number of studies have shown that student performance improves when students receive feedback from teachers (Hattie and Timperley 2007, Lipko-Speed, Dunlosky and Rawson 2014), as well as enquiry-based instruction (Blanchard, Freiman and Lirrete-Pitre, 2010, Furtak et al. 2012, Minner, Levy and Century, 2010). The results from PISA 2015 somewhat challenge this view (Figure 1.23). At least for science performance, students perform worse when they receive more feedback from teachers, and greater exposure to enquiry-based instruction is also negatively associated with performance in 56 countries and economies. This latter finding on enquiry-based instruction offers a more nuanced picture since students do perform better when teachers frequently “explain how a science idea can be applied to a number of different phenomena”, but they perform worse when “students are allowed to design their own experiments”, or “spend time in the laboratory doing practical experiments”. It is also important to keep in mind that the effectiveness of a teaching practice is related to the subject and context in which it is being implemented. Thus, further examination of these practices should be explored in other subject domains.
At this stage it is difficult to interpret this correlational evidence, but it is possible that enquiry-based instruction only has a positive impact when teachers are well trained to promote deep learning and creative thinking and able to motivate students to explore or test ideas following a rigorous methodology, rather than experiment with laboratory material following instructions. In addition, it is likely that students with lower levels of performance receive more feedback, so the direction of the causality in these relationships should be explored further.
Figure 1.21Teacher-directed teaching practices and science performance
Results based on students’ reports, OECD average
1. The socio-economic profile is measured by the PISA index of economic, social and cultural status.Note: All differences are statistically significant (see Annex A3).Source: OECD, PISA 2015 Database, Table II.2.18.1 2 http://dx.doi.org/10.1787/888933435569
Scor
e-po
int d
iffer
ence
40
35
30
25
20
15
10
5
0
-5
The teacher explains
scienti�c ideas
The teacher discusses
our questions
The teacher demonstrates
an idea
A whole class discussion takes place
with the teacher
These happen in “many” or “every” science lesson
Before accounting for students’ and schools’ socio-economic pro�le1
After accounting for students’ and schools’ socio-economic pro�le

P r o f e s s i o n a l l e a r n i n g a n d d e ve l o p m e n t t o s u p p o r t t e a ch e r s ’ wo r k Chapter 1
43EMPOWERING AND ENABLING TEACHERS TO IMPROVE EQUITY AND OUTCOMES FOR ALL © OECD 2017
1. The socio-economic profile is measured by the PISA index of economic, social and cultural status.Note: Statistically significant differences are marked in a darker tone (see Annex A3).Countries and economies are ranked in descending order of the change in the index of adaptive teaching when the index of school autonomy increases by one unit, after accounting for students’ and schools’ socio-economic profile.Source: OECD, PISA 2015 Database, Table II.2.25.1 2 http://dx.doi.org/10.1787/888933435599
LuxembourgCzech Republic
BrazilJapan
GreeceGermany
ColombiaQatar
New ZealandMexico
ChileHungary
Slovak RepublicDenmark
CroatiaCanada
ItalyUnited States
Macao (China)United Kingdom
TunisiaFrance
SingaporeSpain
OECD averageRussia
PortugalAustriaIceland
BelgiumUnited Arab Emirates
FinlandKorea
SwitzerlandMontenegro
AustraliaTurkey
NorwayB-S-J-G (China)
UruguayPeru
Chinese TaipeiIsrael
BulgariaLatvia
PolandDominican Republic
Hong Kong (China)Netherlands
Costa RicaThailandLithuania
EstoniaSwedenIreland
More school autonomy is associated with less adaptive teaching
More school autonomy is associated with more adaptive teaching
Before accounting for students’ and schools’ socio-economic pro�le1
After accounting for students’ and schools’ socio-economic pro�le
Change in the index of adaptive instruction
-0.004 -0.003 -0.002 0.000 0.0040.002-0.001 0.0030.001 0.0060.005
Figure 1.22School autonomy and adaptive instruction in science lessons
Results based on students’ and school principals’ reports

P r o f e s s i o n a l l e a r n i n g a n d d e ve l o p m e n t t o s u p p o r t t e a ch e r s ’ wo r kChapter 1
44© OECD 2017 EMPOWERING AND ENABLING TEACHERS TO IMPROVE EQUITY AND OUTCOMES FOR ALL
Figure 1.23Enquiry-based teaching practices and science performance
Results based on students’ reports, OECD average
1. The socio-economic profile is measured by the PISA index of economic, social and cultural status.Note: All differences are statistically significant (see Annex A3).Source: OECD, PISA 2015 Database, Table II.2.28.1 2 http://dx.doi.org/10.1787/888933435628
Scor
e-po
int d
iffer
ence
20
10
0
-10
-20
-30
-40
-50
-60
The teacher explains how
a science idea can
be applied to a number of different phenomena
The teacher clearly
explains the relevance
of science concepts
to our lives
Students are given
opportunities to explain their ideas
Students are asked to draw conclusions
from an experiment
they have conducted
Students are required to argue about
science questions
There is a class debate
about investigations
Students spend time
in the laboratory
doing practical
experiments
Students are asked to
do an investigation to test ideas
Students are allowed to design their own
experiments
These happen in “most” or “all” science lessons
Before accounting for students’ and schools’ socio-economic pro�le1
After accounting for students’ and schools’ socio-economic pro�le
COLLABORATION WITH COLLEAGUESAs discussed above, PISA results suggest that professional collaboration between teachers within a school can have a positive impact on student performance. However, it is a challenge to implement this on a wider scale, for learning environments to grow and be sustained. The scaling-up requires structures in which teachers with the right skills are identified and assigned specific roles to train other teachers, as well as more informal environments in which teachers can learn from one another and exchange good practices.
There is clearly a support and facilitation role for governments for making connections with the many different partners involved. But there is also a clear leadership role required at school level. A recent OECD study has identified both instructional and distributed leadership as crucial elements for supporting collaboration between teachers (OECD, 2016c). Instructional leadership refers to the efforts made by school principals to improve teaching and learning within schools while distributed leadership reflects the ability of schools to incorporate different stakeholders into decision-making processes.
Leadership practices are related to building capacity for quality instruction. TALIS 2013 explored the relationship between instructional leadership and the establishment of professional learning communities, which allow teachers to collaborate and engage in dialogue with the aim of improving their practice. Professional learning communities are measured through five indicators: 1) teacher engagement in reflective dialogue; 2) deprivatised practice; 3) a shared sense of purpose; 4) engagement in collaborative activity; and 5) a collective focus on student learning.
TALIS results show that principals who show greater instructional leadership work in schools where teachers are more engaged in reflective dialogue and collaboration in primary and lower secondary education (Table 1.3). This may indicate that principals’ efforts to develop cooperation and promote a sense of responsibility in teachers affect teacher collaboration. Distributed leadership is also positively related to a shared sense of purpose in the school. This finding, which is seen across all educational levels, suggests that involving students and their parents/guardians, along with staff, creates a culture of shared responsibility for school issues

P r o f e s s i o n a l l e a r n i n g a n d d e ve l o p m e n t t o s u p p o r t t e a ch e r s ’ wo r k Chapter 1
45EMPOWERING AND ENABLING TEACHERS TO IMPROVE EQUITY AND OUTCOMES FOR ALL © OECD 2017
Table 1.3Association between types of leadership and the dimensions of professional learning communities,
across educational levels
Reflective dialogue
Deprivatised practice
Shared sense of purpose
Collaborative activity
Collective focus on student learning
Primary education
Instructional leadership + + + +
Distributed leadership +
Lower secondary education
Instructional leadership + +
Distributed leadership +
Upper secondary education
Instructional leadership +
Distributed leadership +
Notes: + positive effectSigns in bold font indicate significant effects at p < 0.01; grey signs indicate significant effects at p < 0.05.Results of association are controlled for other school and teacher characteristics that might influence these relationships.Source: OECD (2016c), School Leadership for Learning: Insights from TALIS 2013, http://dx.doi.org/10.1787/9789264258341-en.
Also, many of the strategies depend on government design and leadership. Ministries and system agencies provide the legitimacy and system-wide perspective to push new directions, as well as the capacity to create the necessary structures and career paths. Establishing the climate and means to develop networks and professional learning communities is also important, as illustrated by the New Zealand Learning and Change strategy (Box 1.11). One obvious way to do this is to support the establishment of online platforms for teacher learning and networking. Both top-down and bottom-up approaches are needed, often in combination.
Box 1.11. The Learning and Change Networks strategy in New Zealand
The Learning and Change Networks strategy seeks to learn from a period of widespread experimentation to bring together schools, kura (Māori-language immersion schools), communities, professional providers and ministry officials to achieve targets for learner achievement (including near universal achievement of National Certificate of Educational Achievement Level 2 qualifications by 18-year-olds by 2021). Learning and Change Networks are addressing the three big agenda items of schooling improvement, blended learning, and cultural responsiveness as a whole, instead of creating projects that deal with those agendas separately, as so often happens.
Design of the strategy commenced in October 2011 and 5 pilot networks representing 45 schools/kura were established. The strategy went live in October 2012, and now around 55 networks have been established involving up to one-fifth of New Zealand schools/kura, with an average size of just over 7 schools per network. All learners are included, with a particular focus on priority groups: Māori, Pasifika, those from lower socio-economic groups, and those with special education needs, along with their families, teachers, and school and community leaders.
Among the networks’ distinctive features are:
• a tight and highly developed methodology for ensuring a strong focus on learning and learning change, including very explicit tools, procedures, support, and facilitation
• an explicit and prominent focus on engaging parents, families and communities, and learners themselves in the learning and education (not just as relationships to foster as good in themselves, but because they are strategic stakeholders in determining learning outcomes)
• a developed applied theory of making professional learning communities and networks work so as to achieve outcomes that individual schools and teachers cannot readily do by themselves
• an elaborated set of structures and management arrangements that puts the onus for action and change on the networks and their members, while embedding these in regional and national structures of support
• a central role given to evaluation, generating learning evidence at school, network, regional and system levels
• a strong connection to international experience and networks.
Source: OECD (2013a), Innovative Learning Environments, Educational Research and Innovation, OECD Publishing, Paris, http://dx.doi.org/10.1787/9789264203488-en.
P r o f e s s i o n a l l e a r n i n g a n d d e ve l o p m e n t t o s u p p o r t t e a ch e r s ’ wo r kChapter 1
46 © OECD 2017 EMPOWERING AND ENABLING TEACHERS TO IMPROVE EQUITY AND OUTCOMES FOR ALL
Several systems emphasise a clear focus on specific objectives through their collaboration exercises to ensure that network innovation activity is disciplined and focused, encouraging accountability and speeding transfer of knowledge around schools and systems. Trying to cover everything at once risks disjointed diffusion of effort and missing all targets in the process. Several systems report how choices needed to be made to ensure focus while avoiding narrow goal-setting that blocks wider innovation. Many networks, for instance, chose improving writing as a core focus for attention, but saw it as the vehicle through which many wider innovations can be built.
WORKING ENVIRONMENT, WORKLOAD AND CLASSROOM MANAGEMENT TO ENHANCE TEACHERS’ WELL-BEING AND EFFICACYThe above discussion has explored the different dimensions of teacher professionalism, but the quality of the working environment plays an equally crucial role for fostering effective learning environments. Indeed, working environments provide teachers with “a chance to fulfil their ambitions, to feel useful in society and build self-esteem, as work often represents their main recognised contribution to the community where they live” (Casez, Hijzen and Saint-Martin: 18). Conversely, a detrimental working environment can affect teachers’ well-being, motivation and effectiveness, and can even lead to health issues or attrition, in the most extreme situations.
The quality of working environments ultimately depends on an appropriate balance between job demands and the resources available to meet those demands. It is in the daily routines of teachers in their school that the demands of their occupation as well as the resources available to them can be observed.2 To get an accurate picture of the working environment, it would be misleading to focus on just one of these aspects, since the overall sense of occupational well-being and stress depends on a good balance between demands and resources. Demands become a source of stress only when the working environment does not provide the necessary resources to meet them. Furthermore, research conducted by the OECD has shown that the accumulation of job demands has a strong negative impact on workers’ health, while the level of job resources can play a significant role in mitigating the health impact of job demands (Casez, Hijzen and Saint-Martin: 19).
On the resources side, the following elements are important to support teachers in fulfilling the demands of their job:
• Work autonomy: Considering teaching as a profession is acknowledging teachers as experts with a large degree of self-governance. As discussed above, professional work entails sufficient autonomy to make decisions on how to handle work tasks and methods, and recent analyses drawing upon TALIS data have shown that decision-making on issues concerning the classroom is partly associated with job satisfaction (OECD, 2016c).
• Quality of working relationships: The level of collaboration and support from staff has also been shown to be associated with teachers’ overall job satisfaction (OECD, 2014c). Supportive and collaborative professional relationships among teachers and between teachers and management staff can also have an impact on the quality of teachers’ instruction.
• Support and resources: For teachers to respond appropriately and in a timely manner to the demands that they face daily, they need adequate support and the co-operation of school management. School management can offer support by providing continuous development opportunities (participation in induction and mentoring processes and professional development activities) and appraisal and feedback (pertinent and constructive performance evaluations can improve the instruction of teachers by highlighting aspects in need of improvement), as well as adequate space and materials.
On the demand side, there are three main factors to consider:
• Quality of the physical learning environment: The physical space teachers work in influences the education, health, social and well-being outcomes of both students and teachers. Indeed, working spaces that present risk factors add to the daily job strain that teachers face. School safety, transportation, use and quality of energy sources (e.g. light, heating, ventilation, etc.) and classroom infrastructure (acoustics, space distribution, etc.) are all important to a quality physical learning environment.
• Time pressure/workload: Workload refers to the stress caused by tasks above and beyond regular teaching duties (Boyle et al, 1995). For example, inadequate time for planning and heavy teaching workloads has been shown to have a negative association with the levels of teachers’ job satisfaction (Liu and Ramsey, 2008). The degree of time pressure and workload stress depends on a number of factors. These include the number of working hours dedicated to teaching, planning lessons, marking, collaborating with other teachers, participating in staff meetings and other tasks related to the job and the proportion of hours spent on these different tasks, as well as the number of grades taught (the lesson preparation time and workload of a teacher responsible for multiple grades is not the same as those of a teacher who is responsible for only one grade).

P r o f e s s i o n a l l e a r n i n g a n d d e ve l o p m e n t t o s u p p o r t t e a ch e r s ’ wo r k Chapter 1
47EMPOWERING AND ENABLING TEACHERS TO IMPROVE EQUITY AND OUTCOMES FOR ALL © OECD 2017
• Classroom management: Last but not least, classrooms need to be organised effectively in order to facilitate the learning of the students (OECD, 2014c). Thus, classroom management refers to all the actions that teachers take to organise instruction and classrooms to facilitate student learning (OECD, 2014c: 152). Student misbehaviour and a disruptive classroom can lead to emotional exhaustion for teachers (Osher et al., 2007). This can result in a vicious circle, since teachers tend to express negative emotions in response to student misbehaviour, which then leads to a detrimental classroom climate (Pianta et al., 2003).
Time spent on teaching and other tasks
Although statutory working hours and teaching hours only partly determine the actual workload of teachers, they do offer valuable insight into the demands placed on teachers in different countries. Teachers’ workload includes the amount of time they spend teaching and the time they spend on other activities.
Required teaching time in public schools remained largely unchanged between 2000 and 2014, at 776 hours at the primary level, 694 hours at lower secondary level, and 644 at upper secondary level on average, with some variation across countries (Figure 1.24). The amount of teaching time varies much more across countries at the pre-primary level than at any other level of education, ranging from less than 700 hours in Greece, Korea and Mexico, to more than 1 500 hours in Norway.
Figure 1.24Number of teaching hours per year, by level of education (2014)
Net statutory contact time in public institutions
1. Actual teaching time.2. Year of reference 2013.Countries and economies are ranked in descending order of the number of teaching hours per year in general upper secondary education.Source: OECD. Table D4.1. See Annex 3 for notes (www.oecd.org/education/education-at-a-glance-19991487.htm).1 2 http://dx.doi.org/10.1787/888933399112
1 600
1 400
1 200
1 000
800
600
400
200
0
Hou
rs p
er y
ear
Lower secondary education, general programmes
Upper secondary education, general programmes
Co
lom
bia
Chi
le
Sco
tlan
d (U
K)
Mex
ico
Aus
tral
ia
New
Zea
land
Net
herl
and
s
Engl
and
(UK
)1
Can
ada
Luxe
mb
our
g
Irel
and
Ger
man
y
Spai
n
Fran
ce
OEC
D a
vera
ge
EU22
ave
rage
Ital
y
Slov
ak R
epub
lic
Bel
gium
(Fr.)
Port
ugal
Hun
gary
Cze
ch R
epub
lic
Aus
tria
Slov
enia
Esto
nia
Ko
rea
Finl
and
Pola
nd1
Isra
el
No
rway
Jap
an1
Bel
gium
(Fl.)
Turk
ey
Rus
sian
Fed
erat
ion1
Gre
ece
Den
mar
k1, 2
Primary education
Pre-primary education
In most countries, teachers are formally required to work a specified total number of hours per week to earn their full-time salary, including teaching and non-teaching time, as stipulated in collective and other such agreements. Non-teaching tasks are a part of teachers’ workload and working conditions. These non-teaching activities, required by legislation, regulations or agreements between stakeholders (e.g. teachers’ unions, local authorities, school boards), do not necessarily reflect the actual participation of teachers in non-teaching activities, but they provide an insight into the breadth and complexity of teachers’ roles. Accordingly, assessing students, preparing lessons, correcting students’ work, in-service training and staff meetings should also be taken into account when analysing the demands placed on teachers. Among countries for which both teaching and total working time are available for lower secondary teachers, 45% of teachers’ working time is spent on teaching on average across the OECD, ranging from 35% in Austria, Japan and Turkey to 63% in Scotland (Figure 1.25).
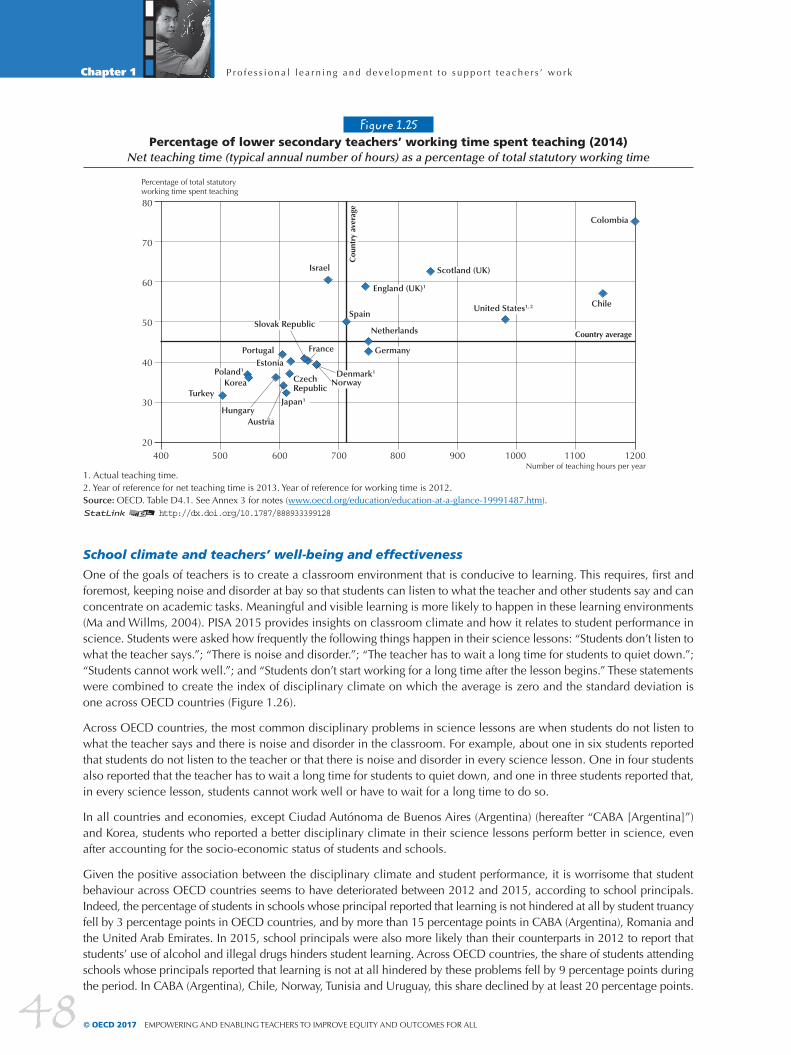
P r o f e s s i o n a l l e a r n i n g a n d d e ve l o p m e n t t o s u p p o r t t e a ch e r s ’ wo r kChapter 1
48 © OECD 2017 EMPOWERING AND ENABLING TEACHERS TO IMPROVE EQUITY AND OUTCOMES FOR ALL
Figure 1.25Percentage of lower secondary teachers’ working time spent teaching (2014)
Net teaching time (typical annual number of hours) as a percentage of total statutory working time
1. Actual teaching time.2. Year of reference for net teaching time is 2013. Year of reference for working time is 2012.Source: OECD. Table D4.1. See Annex 3 for notes (www.oecd.org/education/education-at-a-glance-19991487.htm).1 2 http://dx.doi.org/10.1787/888933399128
80
70
60
50
40
30
20
Percentage of total statutory working time spent teaching
400 500 700600 800 900 1000 1100 1200Number of teaching hours per year
Country average
Cou
ntry
ave
rage
Estonia
Slovak Republic
Scotland (UK)
England (UK)1
Netherlands
Germany
Colombia
Czech Republic
United States1, 2
Denmark1
Israel
Poland1
Hungary
Norway
Portugal
Japan1
Spain
TurkeyKorea
Chile
Austria
France
School climate and teachers’ well-being and effectiveness
One of the goals of teachers is to create a classroom environment that is conducive to learning. This requires, first and foremost, keeping noise and disorder at bay so that students can listen to what the teacher and other students say and can concentrate on academic tasks. Meaningful and visible learning is more likely to happen in these learning environments (Ma and Willms, 2004). PISA 2015 provides insights on classroom climate and how it relates to student performance in science. Students were asked how frequently the following things happen in their science lessons: “Students don’t listen to what the teacher says.”; “There is noise and disorder.”; “The teacher has to wait a long time for students to quiet down.”; “Students cannot work well.”; and “Students don’t start working for a long time after the lesson begins.” These statements were combined to create the index of disciplinary climate on which the average is zero and the standard deviation is one across OECD countries (Figure 1.26).
Across OECD countries, the most common disciplinary problems in science lessons are when students do not listen to what the teacher says and there is noise and disorder in the classroom. For example, about one in six students reported that students do not listen to the teacher or that there is noise and disorder in every science lesson. One in four students also reported that the teacher has to wait a long time for students to quiet down, and one in three students reported that, in every science lesson, students cannot work well or have to wait for a long time to do so.
In all countries and economies, except Ciudad Autónoma de Buenos Aires (Argentina) (hereafter “CABA [Argentina]”) and Korea, students who reported a better disciplinary climate in their science lessons perform better in science, even after accounting for the socio-economic status of students and schools.
Given the positive association between the disciplinary climate and student performance, it is worrisome that student behaviour across OECD countries seems to have deteriorated between 2012 and 2015, according to school principals. Indeed, the percentage of students in schools whose principal reported that learning is not hindered at all by student truancy fell by 3 percentage points in OECD countries, and by more than 15 percentage points in CABA (Argentina), Romania and the United Arab Emirates. In 2015, school principals were also more likely than their counterparts in 2012 to report that students’ use of alcohol and illegal drugs hinders student learning. Across OECD countries, the share of students attending schools whose principals reported that learning is not at all hindered by these problems fell by 9 percentage points during the period. In CABA (Argentina), Chile, Norway, Tunisia and Uruguay, this share declined by at least 20 percentage points.

P r o f e s s i o n a l l e a r n i n g a n d d e ve l o p m e n t t o s u p p o r t t e a ch e r s ’ wo r k Chapter 1
49EMPOWERING AND ENABLING TEACHERS TO IMPROVE EQUITY AND OUTCOMES FOR ALL © OECD 2017
1. Higher values on the index indicate a more positive disciplinary climate in science lessons.2. ESCS refers to the PISA index of economic, social and cultural status.Countries and economies are ranked in descending order of the index of disciplinary climate.Source: OECD, PISA 2015 Database, Table II.3.11.1 2 http://dx.doi.org/10.1787/888933435704
Positive difference/associationNegative difference/associationDifference/association is not significantMissing values
School characteristics Science performanceAdvantaged – disadvantaged
Urban – rural
Private – public
Before ESCS2
After ESCS
Japan Korea
Kosovo Viet Nam Moldova Georgia Thailand
Hong Kong (China) Russia
United States B-S-J-G (China)
Romania Indonesia
Austria FYROM
Singapore Chinese Taipei Macao (China)
Norway Peru
Costa Rica Ireland
Portugal Montenegro
Germany Switzerland
Lithuania Mexico
Colombia United Arab Emirates
Denmark Sweden Iceland
Dominican Republic OECD average
Canada Malta Israel
Poland Estonia Croatia
Trinidad and Tobago Italy
Qatar Slovenia
Spain United Kingdom
Hungary Lebanon Jordan Finland
CABA (Argentina) Netherlands
Uruguay Chile
Algeria Luxembourg
Turkey Slovak Republic
New Zealand Belgium Latvia
Bulgaria Australia
Brazil Greece
Czech Republic France Tunisia
Education systems with a positive difference/association 39 5 19 66 66Education systems with no difference/association 23 41 36 2 2
Education systems with a negative difference/association 6 8 3 0 0
1.00.80.20.0 0.60.4-0.6 -0.2-0.4Index of disciplinary climate1
Figure 1.26Index of disciplinary climate in science classes, school characteristics and science outcomes
Results based on students’ reports

P r o f e s s i o n a l l e a r n i n g a n d d e ve l o p m e n t t o s u p p o r t t e a ch e r s ’ wo r kChapter 1
50 © OECD 2017 EMPOWERING AND ENABLING TEACHERS TO IMPROVE EQUITY AND OUTCOMES FOR ALL
According to school principals, teacher behaviour also deteriorated between 2012 and 2015. Across OECD countries, principals in 2015 were more likely than their counterparts in 2012 to report that student learning is hindered by teachers not meeting individual students’ needs, teacher absenteeism, staff resisting change, teachers being too strict with students, and teachers not being well-prepared for classes. The incidence of teacher absenteeism, potentially the most serious of these problems, increased the most during this period, according to school principals, in CABA (Argentina), Ireland, Israel, Portugal, Switzerland and Turkey.
Overall, student-related problems reported by school principals, such as truancy, use of illegal drugs or bullying, are more clearly related to science performance than teacher-related problems, such as teacher absenteeism or staff resisting change (Figure 1.27). The most negative association with science performance, both before and after accounting for the socio-economic status of students and schools, is students lacking respect for their teachers, followed by student truancy, students skipping classes and students intimidating or bullying other students. By contrast, there is no association with performance when school principals reported that school staff resist change or that teachers are too strict with students.
Overall, these findings and insights from PISA and TALIS point to contemporary challenges facing teachers in meeting new demands of their jobs. But they also highlight policy levers available to policy makers to create positive policy environments in which schools and teachers can thrive and meet these challenges, as well as pointers for school principals on how best to support teachers at their schools. These issues are explored in the following chapter.
1. The socio-economic profile is measured by the PISA index of economic, social and cultural status.Note: Statistically significant differences are marked in a darker tone (see Annex A3).Source: OECD, PISA 2015 Database, Tables II.3.16 and II.3.21.1 2 http://dx.doi.org/10.1787/888933435730
Scor
e-po
int d
iffer
ence
10
5
0
-5
-10
-15
-20
-25
-30
-35
Staff resisting change
Teachers being too strict with students
Teachers not meeting
individual students’
needs
Teacher absenteeism
Teachers not being well prepared for classes
Student use of alcohol or illegal
drugs
Students intimidating or bullying
other students
Students skipping classes
Student truancy
Students lacking respect
for teachers
The phenomena below hinder student learning “to some extent” or “a lot”
Before accounting for students’ and schools’ socio-economic pro�le¹
After accounting for students’ and schools’ socio-economic pro�le
Students score lower in science
Figure 1.27Student and teacher behaviour hindering learning and science performance
Results based on school principals’ reports, OECD average

P r o f e s s i o n a l l e a r n i n g a n d d e ve l o p m e n t t o s u p p o r t t e a ch e r s ’ wo r k Chapter 1
51EMPOWERING AND ENABLING TEACHERS TO IMPROVE EQUITY AND OUTCOMES FOR ALL © OECD 2017
Notes1. Based on an extensive literature review, the TALIS 2013 conceptual framework identified the following ten practices as key aspects of instructional quality: 1) the teacher presents a summary of recently learned content; 2) students work in small groups to come up with a joint solution to a problem or task; 3) the teacher gives different work to students who have difficulties learning and/or to those who can advance faster; 4) the teacher refers to a problem from everyday life or work to demonstrate why new knowledge is useful; 5) the teacher lets students practice similar tasks until he/she knows that every student has understood the subject matter; 6) the teacher checks students’ exercise books or homework; 7) students work on projects that require at least one week to complete; 8) students use ICT for project or class work; 9) the teacher provides written feedback on student work in addition to a mark; and 10) the teacher observes students when working on particular tasks and provides immediate feedback.
2. Job demands refer to all working situations that require sustained physical, cognitive and emotional effort, while job resources are defined as those components helping teachers to “cope with difficult demands, to achieve work goals and stimulate learning and personal development” (Casez and Saint-Martin).
ReferencesAllensworth, E., S. Ponisciak and C. Mazzeo (2009), The Schools Teachers Leave: Teacher Mobility in Chicago Public Schools, Consortium on Chicago School Research, Chicago, IL.
Australian Council for Educational Research (forthcoming), OECD Initial Teacher Preparation Study Country Background Report, Commonwealth of Australia, Canberra.
Ball, S.J. (2003), “The teacher’s soul and the terrors of performativity”, Journal of Education Policy, Vol. 18/2, pp. 215-228.
Barrera-Pedemonte, F. (2016), “High-quality teacher professional development and classroom teaching practices: Evidence from TALIS 2013”, OECD Education Working Papers, No. 141, OECD Publishing, Paris, http://dx.doi.org/10.1787/5jlpszw26rvd-en.
Blanchard, S., V. Freiman and N. Lirrete-Pitre (2010), “Strategies used by elementary schoolchildren solving robotics-based complex tasks: Innovative potential of technology”, Procedia-Social and Behavioral Sciences, Vol. 2/2, pp. 2851-2857, Elsevier Ltd, London, http://dx.doi.org/10.1016/j.sbspro.2010.03.427.
Boyle, G.J. et al. (1995), “A structural model of the dimensions of teacher stress”, British Journal of Educational Psychology, Vol. 65/1, pp. 49-67.
Caldwell, B.J. and J.M. Spinks (2013) The Self-Transforming School, Routledge, New York, NY.
Cazes, S., A. Hijzen and A. Saint-Martin (2015), “Measuring and assessing job quality: The OECD job quality framework”, OECD Social, Employment and Migration Working Papers, No. 174, OECD Publishing, Paris, http://dx.doi.org/10.1787/5jrp02kjw1mr-en.
Cheng, Y.C., J. Ko and T.T.H. Lee (2016), “School autonomy, leadership and learning: A reconceptualization”, International Journal of Educational Management, Vol. 30/2, pp. 177-196, http://dx.doi.org/10.1108/IJEM-08-2015-0108.
Clotfelter, C.T., H.F. Ladd and J.L. Vigdor (2007), “Teacher credentials and student achievement: Longitudinal analysis with student fixed effects”, Economics of Education Review, Vol. 26/6, Elsevier Ltd., Durham, NC.
Department for Education (2010), The Importance of Teaching: The Schools White Paper 2010, The Stationery Office, Norwich, United Kindgom.
Ewing, R. A. and D.L. Smith (2003), “Retaining quality beginning teachers in the profession”, English Teaching: Practice and Critique, May 2003, Vol. 2/1, pp. 15-32, http://edlinked.soe.waikato.ac.nz/research/files/etpc/files/2003v2n1art2.pdf.
Frey, C. and M. Osborne (2013), “The future of employment: how susceptible are jobs to computerization”, Oxford Martin School Study, Oxford.
Fuchs, T. and L. Woessmann (2007), “What accounts for international differences in student performance? A re-examination using PISA data”, Empirical Economics, Vol. 32/2-3, pp. 433-464, http://econpapers.repec.org/RePEc:lmu:muenar:20303.
Furlong, J. (2015), Teaching Tomorrow’s Teachers: Options for the future of teacher education in Wales, University of Oxford, Oxford.
Furtak, E.M. et al. (2012), “Experimental and quasi-experimental studies of inquiry-based science teaching: A meta-analysis”, Review of Educational Research, Vol. 82/3.
Guerriero, S. (ed.) (2017), Pedagogical Knowledge and the Changing Nature of the Teaching Profession, OECD Publishing, Paris, http://dx.doi.org/10.1787/9789264270695-en.
Hargreaves A. and M. Fullan (2012), Professional Capital: Transforming Teaching in Every School, Teachers College Press, New York, NY.

P r o f e s s i o n a l l e a r n i n g a n d d e ve l o p m e n t t o s u p p o r t t e a ch e r s ’ wo r kChapter 1
52 © OECD 2017 EMPOWERING AND ENABLING TEACHERS TO IMPROVE EQUITY AND OUTCOMES FOR ALL
Hanushek, E.A., S. Link and L. Woessmann (2013), “Does school autonomy make sense everywhere? Panel estimates from PISA”, Journal of Development Economics, Vol. 104, Elsevier Ltd., Durham, NC.
Hanushek E.A., M. Piopiunik and S. Wiederhold (2014), The Value of Smarter Teachers: International Evidence on Teacher Cognitive Skills and Student Performance, Program on Education Policy and Governance Working Papers Series, Harvard Kennedy School, Cambridge, MA.
Hanushek E.A., M. Piopiunik and S. Wiederhold (2016), The Value of Smarter Teachers: International Evidence on Teacher Cognitive Skills and Student Performance, Third International PIAAC Conference, Madrid, Spain, 6-8 November 2016, http://gestiondgmejora.educa.madrid.org/piaac_2016/docs/SimonWiederhold.pdf.
Hattie, J. and H. Timperley (2007), “The Power of feedback”, Review of Educational Research, Vol. 77/1, American Educational Research Association, Washington, DC.
Headden, S. (2014), Beginners in the Classroom: What the Changing Demographics of Teaching Mean for Schools, Students, and Society, Carnegie Foundation for the Advancement of Teaching, Stanford, CA.
Howsam, R.B. et al. (1985), “Educating a profession”, Report of the Bicentennial Commission on Education for the profession of teaching of the America Association of colleges for teacher education, American Association of Colleges for Teacher Education, Washington, DC, http://eric.ed.gov/?id=ED270430.
Institut zur Qualitätsentwicklung im Bildungswesen (IQB) (n.d.), www.iqb.hu-berlin.de/bt.
Jensen, B., B. Weidmann and J. Farmer (2013), The Myth of Markets in School Education, Grattan Institute, Melbourne.
Koretz, D. (2008). Measuring Up: What Educational Testing Really Tells Us, Harvard University Press, Cambridge, MA, www.hup.harvard.edu/catalog.php?isbn=9780674035218.
Lipko-Speed A., J. Dunlosky and K.A. Rawson (2014), “Does testing with feedback help grade-school children learn key concepts in science?”, Journal of Applied Research in Memory and Cognition, Vol. 3/3, pp. 171-176.
Liu, X.S. and J. Ramsey (2008), “Teachers’ job satisfaction: Analyses of the teacher follow-up survey in the United States for 2000-2001”, Teaching and Teacher Education, Vol. 24, pp. 1173-1184.
Minner, D.D., A.J. Levy and J. Century (2010), “Inquiry‐based science instruction – what is it and does it matter? Results from a research synthesis years 1984 to 2002”, Journal of Research in Science Teaching, Vol. 47/4.
Mueller, C.M. (2012), The Impact of Teacher Certification Programmes on Teacher Efficacy, Job Satisfaction, and Teacher Performance: A Comparison of Traditional and Alternative Certification, http://digitalcommons.wku.edu/diss/28.
OECD (2016a), PISA 2015 Results (Volume I): Excellence and Equity in Education, OECD Publishing, Paris, http://dx.doi.org/10.1787/ 9789264266490-en.
OECD (2016b), Education Policy Outlook: Estonia, OECD Publishing, Paris, www.oecd.org/edu/Education-Policy-Outlook-Country-Profile-Estonia.pdf.
OECD (2016c), Supporting Teacher Professionalism: Insights from TALIS 2013, TALIS, OECD Publishing, Paris, http://dx.doi.org/ 10.1787/9789264248601-en.
OECD (2016d), PISA 2015 Results (Volume II): Policies and Practices for Successful Schools, OECD Publishing, Paris, http://dx.doi.org/ 10.1787/9789264267510-en.
OECD (2015a), Education Policy Outlook 2015: Making Reforms Happen, OECD Publishing, Paris, http://dx.doi.org/10.1787/ 9789264225442-en.
OECD (2015b), “Embedding professional development in schools for teacher success”, Teaching in Focus, No. 10, OECD Publishing, Paris, http://dx.doi.org/10.1787/5js4rv7s7snt-en.
OCDE (2014a), Education at a Glance 2014: OECD Indicators, OECD Publishing, Paris, http://dx.doi.org/10.1787/eag-2014-en.
OECD (2014b), Education Policy Outlook: Denmark, OECD, Paris, www.oecd.org/edu/EDUCATION%20POLICY%20OUTLOOK%20DENMARK_EN.pdf.
OECD (2014c), TALIS 2013 Results: An International Perspective on Teaching and Learning, TALIS, OECD Publishing, Paris, http://dx.doi.org/10.1787/9789264196261-en.
OECD (2013), Innovative Learning Environments, Educational Research and Innovation, OECD Publishing, Paris, http://dx.doi.org/10.1787/9789264203488-en.
OECD (2011a), “Singapore: Rapid improvement followed by strong performance”, in Lessons from PISA for the United States, Strong Performers and Successful Reformers in Education, OECD Publishing, Paris, http://dx.doi.org/10.1787/9789264096660-8-en.

P r o f e s s i o n a l l e a r n i n g a n d d e ve l o p m e n t t o s u p p o r t t e a ch e r s ’ wo r k Chapter 1
53EMPOWERING AND ENABLING TEACHERS TO IMPROVE EQUITY AND OUTCOMES FOR ALL © OECD 2017
OECD (2011b), “School Autonomy and Accountability: Are They Related to Student Performance?”, PISA in Focus, No. 9, OECD Publishing, Paris, http://dx.doi.org/10.1787/5k9h362kcx9w-en.
OECD (2005), Teachers Matter: Attracting, Developing and Retaining Effective Teachers, Education and Training Policy, OECD Publishing, Paris, http://dx.doi.org/10.1787/9789264018044-en.
Opfer, D. (2016), “Conditions and practices associated with teacher professional development and its impact on instruction in TALIS 2013”, OECD Education Working Papers, No. 138, OECD Publishing, Paris, http://dx.doi.org/10.1787/5jlss4r0lrg5-en.
Osher, D. et al. (2007), “A comprehensive approach to promoting social, emotional, and academic growth in contemporary schools”, in J. Grimes and A. Thomas (eds.), Best Practices in School Psychology V, National Association of School Psychologists, Bethesda, MD, pp. 1263-1278.
Pianta, R.C. et al. (2003), “Relationships between teachers and children”, in W.M. Reynolds and G.E. Miller (eds.), Comprehensive handbook of psychology, Wiley, New York, NY, pp. 199-234.
Rockoff, J. (2008), “Does mentoring reduce turnover and improve skills of new employees? Evidence from teachers in New York City”, NBER Working Paper 13868, National Bureau of Economic Research, March 2008, www.nber.org/papers/w13868.
Sahlberg, P. (2010), “Rethinking accountability in a knowledge society”, Journal of Educational Change, Vol. 11/1, pp. 45-61.
Stanat, P. et al. (eds.) (2016), IQB-Bildungstrend 2015: Sprachliche Kompetenzen am Ende der 9. Jahrgangsstufe im zweiten Ländervergleich, Zusammenfassung, https://www.iqb.hu-berlin.de/bt/bt/BT2015/BT_2015_Zusammen.pdf.
Wang, Y. (ed.) (2013), Education Policy Reform Trends in G20 Members, Springer, Dordrecht.
Welsh Government (2016), Draft criteria for the accreditation of Initial Teacher Education Programmes in Wales and the proposal for the Education Workforce Council to accredit initial teacher education, Consultation Document, https://consultations.gov.wales/sites/default/files/consultation_doc_files/160923_consultation_document_en.pdf.
Yoon, K.S. et al. (2007), “Reviewing the evidence on how teacher professional development affects school achievement”, Issues & Answers Report, No. 033, Institute of Education Sciences, National Center for Education Evaluation and Regional Assistance, Regional Educational Laboratory Southwest, Washington, DC.

55EMPOWERING AND ENABLING TEACHERS TO IMPROVE EQUITY AND OUTCOMES FOR ALL © OECD 2017
Chapter 2
ENSURING APPROPRIATE NATIONAL EDUCATION STRUCTURES AND POLICY ENVIRONMENT
In recent decades, many OECD countries have decentralised their education
systems. Many have shifted responsibilities from the central government to
different levels of governance, often with greater autonomy for regions,
local authorities and schools. Success in granting this increased autonomy
depends largely on whether much-needed capacity was built as these new
responsibilities were being transferred, and to what extent the regions, local
authorities and schools took on increased accountability for student outcomes
to parents, communities and education authorities. With this increased
complexity in governance arrangements, the efficiency of structures at the
systemic level has a direct impact on the quality of the education system, and
the increased number of stakeholders requires greater levels of collaboration
in both design and implementation of reforms.
Note regarding IsraelThe statistical data for Israel are supplied by and under the responsibility of the relevant Israeli authorities. The use of such data by the OECD is without prejudice to the status of the Golan Heights, East Jerusalem and Israeli settlements in the West Bank under the terms of international law.

E n s u r i n g a p p r o p r i a t e n a t i o n a l e d u c a t i o n s t r u c t u r e s a n d p o l i cy e nv i r o n m e n tChapter 2
56 © OECD 2017 EMPOWERING AND ENABLING TEACHERS TO IMPROVE EQUITY AND OUTCOMES FOR ALL
GOVERNING COMPLEX EDUCATION SYSTEMSAs discussed in the previous chapter, many OECD countries have decentralised control of their education systems over the last few decades, giving schools and local school authorities greater autonomy to respond more directly to citizens’ needs. As evidence about school and student achievement has also become more readily available, parents and other stakeholders (such as teachers, students and labour unions) have become more demanding and more involved in decision-making. This increased complexity in governance arrangements, accompanied by a rise in the number of stakeholders and in the availability and use of evaluation and accountability data, calls for a new approach to governance for increasingly complex education systems (Burns and Koster, 2016).
According to Snyder (2013), as networks of interdependently linked actors whose actions affect all other actors, education systems evolve, adapt, and reorganise themselves. Complex systems do not operate in a linear manner, but rather exhibit a series of well-defined characteristics: tipping points, feedback loops, path dependence and sensibility to local contexts. Understanding complexity is thus an important element in policy making and reform, as complex systems cannot be successfully governed with the linear mechanisms of the traditional policy cycle. Devolving power to local authorities will not improve the functioning of the system unless it is accompanied by attention to the connections and interactivity present. This interactivity means that a single intervention may generate both positive and negative effects in different parts of the system. For example, disclosing information about school performance might have a very different impact on a school that is thriving than on a school that is struggling to attract well-performing students.
Thus, when designing and implementing reforms, it is essential to facilitate and apply the constant feedback required to guide any complex system. Although it might be tempting to look for easy, one-size-fits-all policy responses to specific problems, simple solutions to complex problems are doomed to fail. Public governance must remain flexible enough to learn from and adapt to specific circumstances. To steer a clear course towards established goals, modern education governance must be able to juggle dynamism and complexity and, with limited financial resources, do so as efficiently as possible.
A recent OECD review of contemporary education governance (Burns and Koster, 2016) identified five key elements of modern governance for complex systems. According to this study, effective governance:
• Focuses on processes, not structures: Almost all governance structures can be successful under the right conditions. The number of levels and the power at each level are not what make or break a good system, but rather the strength of the alignment across the system, the involvement of actors and the processes underlying governance and reform.
• Is flexible and able to adapt to change and unexpected events: Strengthening a system’s ability to learn from feedback is a fundamental part of this process and is also a necessary step to quality assurance and accountability.
• Works through building capacity, stakeholder involvement and open dialogue: However it is not rudderless. Involvement of more stakeholders only works when there is a strategic vision and a set of processes to harness their ideas and input.
• Requires a whole-of-system approach: This means aligning policies, roles and responsibilities to improve efficiency and reduce potential overlap or conflict (e.g. between accountability and trust, or innovation and risk avoidance).
• Harnesses evidence and research to inform policy and reform: A strong knowledge system combines descriptive system data, research findings and expert practitioner knowledge. The key is knowing what to use, when, why and how.
STEERING EDUCATION SYSTEMS EFFECTIVELYSteering education systems is a significant challenge for policy makers. The degree of decentralisation in decision-making across systems and the greater complexity in the policy-making process have become key issues. Education policy-making environments have become increasingly complex, due to increased decentralisation, institutional autonomy and greater accountability. Furthermore, educational contexts and institutional and policy approaches vary, depending on a country’s historical development and political and institutional frameworks, as do distribution and approaches to education funding.
The institutions and dynamics through which policy is defined and priorities are determined vary across countries, depending on their context, but many OECD countries have been reforming the governance of their systems by defining broad education strategies, setting clear policy priorities with concrete objectives, or reorganising the distribution of roles and responsibilities. To do so, a range of policy options are available to them, of which funding mechanisms and incentives are key.

E n s u r i n g a p p r o p r i a t e n a t i o n a l e d u c a t i o n s t r u c t u r e s a n d p o l i cy e nv i r o n m e n t Chapter 2
57EMPOWERING AND ENABLING TEACHERS TO IMPROVE EQUITY AND OUTCOMES FOR ALL © OECD 2017
Patterns and trends of education governance in OECD countries
Across many countries, greater decentralisation has devolved responsibilities to regional or local authorities, and schools and ministries of education and their related institutions have taken on a guiding and support role.
Broadly speaking, the following governance patterns are found across OECD countries (Figure 2.1):
• Central: In centralised systems, either the Ministry of Education (which may have responsibilities for tertiary education, science, culture or sports) guides and defines policy, or the state sets general priorities while the ministry delivers policy. Often, national ministries have regional education offices that deliver education policy. Within this centralised approach, there is also the tendency to decentralise some responsibilities to the local level or to schools.
• Central with local: One group of countries has a central Ministry of Education that guides the education system, with education delivered by municipalities or municipal-level authorities. Local authorities might have either broad responsibility for delivering education services, or overall responsibility for doing so, as in Nordic countries.
• Central with schools: Another group of countries has a guiding national ministry, with decentralised administration and school autonomy.
• Shared central in agreement with regional: Another group of countries has a relatively decentralised system, with the central government designing the legal framework and regulating principles, objectives and content. Regional governments then deliver education with different degrees of autonomy and with the support of co-ordinating institutions.
• Decentralised: In decentralised environments, different institutions support policy making, bringing together regional education institutions or ministries.
Figure 2.1An overview of governance arrangements across OECD countries
Source: OECD (2015a), Education Policy Outlook 2015: Making Reforms Happen, http://dx.doi.org/10.1787/9789264225442-en.
AustriaCzech RepublicFranceGreeceHungaryIsraelItalyLuxembourgPortugalTurkey
IrelandNetherlandsNew Zealand Australia
MexicoSpain Canada
BelgiumGermanySwitzerlandUnited KingdomUnited States
ChileDenmarkEstoniaFinlandIcelandJapanKoreaNorwayPolandSlovak RepublicSloveniaSweden
Central
Central with local
Central with schools
Shared central in agreement with reagional
Decentralised
Governance arrangements affect policy-making dynamics and incentives for different stakeholders in the system. Policy making needs to be aligned to its governance structure and to take into account the respective responsibilities of different actors (Fazekas and Burns, 2012). Federal systems may look for different options to steer the system, as states or provinces have responsibility for delivering education and therefore require different types of policies or institutional arrangements for their education systems to progress. Because context is key in the process of policy design and implementation, results may vary from one education system to another, and a specific policy from one country might not have similar results in another.
Between 2008 and 2014, countries have adopted different approaches to steer education systems and engage stakeholders in more effective ways (Table 2.1). Overall, the analysis shows that countries are active in defining policy and prioritising and are taking up governance reforms of different types. Some countries have developed education strategies that aim for general education improvement, while others define priorities or goals to guide their education systems towards concrete objectives. A number of countries have introduced targeted policies which aim to reorganise the distribution of roles and responsibilities for more effective delivery of education, either by creating new institutions or developing local level capacity.

E n s u r i n g a p p r o p r i a t e n a t i o n a l e d u c a t i o n s t r u c t u r e s a n d p o l i cy e nv i r o n m e n tChapter 2
58 © OECD 2017 EMPOWERING AND ENABLING TEACHERS TO IMPROVE EQUITY AND OUTCOMES FOR ALL
Indeed, consistency, capacity and leadership at the municipal level are crucial in decentralised systems. More centralised countries face the challenge of providing increased autonomy to adapt to local needs and ensuring effective co-ordination between local, regional and national policy makers. At the same time, with more accountability for education outcomes, national institutions need to find the most suitable approaches to guide policy in either complex or decentralised environments.
Table 2.1Policies targeting governance (2008-14)
Comprehensive policies Content Targeted policies
General strategy Education priorities Reorganisation of decision-making
Canada: Learn Canada 2020 (2008)
Chile: General Education Law (2009)
Czech Republic: Long-term Plan for Education and Development (2011-15)
Denmark: A Denmark that Stands Together platform (2011); Public School (Folkskole) reform (2013)
Estonia: Lifelong Learning Strategy 2020 (2014)
Iceland: Government 2020 Moving Iceland Forward Initiative (2010)
Luxembourg: Compulsory Education Reform (2009)
Mexico: Pact for México (2012); Constitutional Reform (2013)
Netherlands: National Agreement on Education (2013)
Poland: Amendment of School Education Act (2013)
Slovak Republic: Education Act (2008)
Spain: LOMCE (2013)
Sweden: Education Act (2011)
Turkey: Strategic Plan for Ministry of National Education(2010-14); Lifelong Learning Strategy Document and Action Plan (2009-13; 2014-18)
Australia: Melbourne Declaration for Educational Goals for Young Australians (2008-18); National Education Agreement (2009)
Canada: Ministers agreement that numeracy is a priority (2013)
Czech Republic: Operational Programme Research, Development and Education 2014-20 (2014)
Finland: Education and Research Development Plan (2011-16)
Japan: Basic Plan for the Promotion of Education (2013)
New Zealand: Better Public Service Programme (2011); Ministry Statement of Intent (2012-17)
United States: ESEA Flexibility programme (2011)
Czech Republic: National Institute of Education (NUV, 2011)
Finland: Municipal Reform (2013)
Germany: Local Learning (2009)
Hungary: Central state responsibility for maintenance of educational institutions: Decree on the Klebelsberg Institution Maintenance Centre (2012)
Mexico: Creation of school councils of social participation (2009)
New Zealand: Reinforce role of school boards in student achievement under the Education Amendment Act (2012)
Portugal: Autonomy agreements (2008); Agreement on the Reorganisation of the School Network (2010); Effort of rationalisation of public services (PREMAC) (2011)
United Kingdom (England): Increase the number of Academies and free schools (2013); (Scotland) Education Scotland (2011)
Source: OECD (2015a), Education Policy Outlook 2015: Making Reforms Happen, http://dx.doi.org/10.1787/9789264225442-en.
Policy options to steer education systems
Governance approaches address how means, processes and resources all come together for policy making within a country. Governance refers not only to the formal structures and institutions in place in a system, but also to how governments set priorities, and how interactions among the different players contribute to shaping the success of policy making (World Bank, 1994; Hewitt de Alcántara, 1998). Funding approaches refer to how countries invest economic resources in their education systems and how those resources are effectively used and distributed in education institutions to best meet the needs, priorities and capacities of education systems.
An analysis of policy options adopted between 2008 and 2014 across OECD countries shows that countries have taken a variety of approaches depending on their institutional arrangements and dynamics. These include comprehensive governance approaches that define and aim to guide those involved towards improvement by setting priorities or clear mandates, ensuring transparency and stability in funding to respond to needs, developing capacity at the local level and strengthening system co-ordination.
Defining national strategies according to need and setting priorities to guide the system
One frequently adopted approach to education policy making is to develop general education-system strategies based on a concrete analysis, situation or need. General strategies are often the result of changes in political cycles, with the entry of new governments that set new priorities and actions, but can also be endorsed by broader bipartisan coalitions, as illustrated by the large-scale reforms undertaken in Denmark and Mexico (Box 2.1).

E n s u r i n g a p p r o p r i a t e n a t i o n a l e d u c a t i o n s t r u c t u r e s a n d p o l i cy e nv i r o n m e n t Chapter 2
59EMPOWERING AND ENABLING TEACHERS TO IMPROVE EQUITY AND OUTCOMES FOR ALL © OECD 2017
Box 2.1. Bipartisan large-scale reforms in Denmark and Mexico
A Denmark that Stands Together (2011)
In Denmark, a platform emphasising education, A Denmark that Stands Together (2011), established the key education priorities, such as strengthening early childhood education and care, and reforming primary and lower secondary schools and the delivery of education, in collaboration with teachers and parents. It set concrete targets to be met by 2020 in terms of proportions of cohorts to complete upper secondary (25%), tertiary (60%) and long tertiary education (25%). This was followed by the Danish public school (Folkskole) reform (2013), agreed by all political parties, to raise standards for public schools and simplify the Danish Common Objectives, modify the distribution of learning opportunities, and open up schools to their communities, collaborating with associations for selected activities.
The Pact for Mexico (2012)
In Mexico, the Federal Government signed the Pact for Mexico (2012), an agreement between the most important political parties and the Federal Government, which was followed by changes to the Constitution and new laws to support implementation. It sets out clear commitments on education, such as increasing education coverage in upper secondary and tertiary education, improving teaching and learning conditions at schools and establishing full-time schools, creating a Teacher Professional Service (2013), and promoting system improvement with more transparency and autonomy for the National Institute for Educational Assessment and Evaluation.
Sources: OECD (2015a), Education Policy Outlook 2015: Making Reforms Happen, http://dx.doi.org/10.1787/9789264225442-en.
Key to education policy improvement is to establish a small number of clear, prioritised and measurable goals that can drive the system for all involved (OECD, 2010). Setting clear national expectations in the form of goals, policies, curriculum, standards or accountability mechanisms can guide the system towards higher performance levels. In this respect, New Zealand illustrates how countries can govern and steer a system of autonomous schools by establishing clear and transparent plans of an annual or longer nature in a transparent and systematic way (Box 2.2).
Box 2.2. Better Public Service Programme in New Zealand
In New Zealand, the Ministry of Education sets objectives in an annual statement of intent, a planning and accountability document with a five-year horizon. In addition, the Better Public Service Programme (2011) set three clear education targets: 1) participation of 98% in early childhood education in 2016; 2) about 85% of 18-year-olds achieving a national certificate Level 2 or equivalent in 2017; and 3) increasing attainment of advanced trade qualifications, diplomas or degrees for 25-34 year-olds. These targets provide a focus and are used in budget and strategic planning processes and to monitor progress, with the expectation that they will lead to long-term sustainable improvements to student achievement as new practices are developed and adopted across the education system.
Source: OECD (2015a), Education Policy Outlook 2015: Making Reforms Happen, http://dx.doi.org/10.1787/9789264225442-en.
Reorganising policy making and strengthening local capacity
In the past decades, a number of changes have occurred in how school systems allocate school-management responsibilities to various actors. Some countries have decentralised decision-making related to school operations, giving local actors (such as principals and teachers) more responsibility over a range of budgetary, operational and instructional issues. Giving schools greater control over matters of budget, hiring of teachers and course offerings has been advocated on the grounds that local actors understand their students’ needs better than higher administrative bodies, and thus can make better decisions to improve their students’ outcomes (Caldwell and Spinks, 2013; Department of Education, 2010). In other countries, education authorities at local, regional and national levels gained more control over these matters.
E n s u r i n g a p p r o p r i a t e n a t i o n a l e d u c a t i o n s t r u c t u r e s a n d p o l i cy e nv i r o n m e n tChapter 2
60 © OECD 2017 EMPOWERING AND ENABLING TEACHERS TO IMPROVE EQUITY AND OUTCOMES FOR ALL
The success of such reorganisation of service delivery hinges on education systems having capacity at the ministry level and support at regional and local levels to drive large-scale improvements (OECD, 2010; OECD, 2013a), as well as adequate co-ordination across different levels of the system. To this end, different types of policy options have been introduced across countries:
• Fostering school autonomy: With the trend towards decentralisation, there has been a transfer of responsibilities to the local or school level in some countries, such as Portugal (Box 2.3).
Box 2.3. Portugal’s Agreement on Reorganisation of the School Network (2010)
In 2010, schools were reorganised into school clusters for efficiency and effectiveness, with some closures of underperforming or small schools. Schools were given the opportunity to sign autonomy agreements (2008), which has been taken up by 26% of school clusters since this measure was implemented.
Source: OECD (2015a), Education Policy Outlook 2015: Making Reforms Happen, http://dx.doi.org/10.1787/9789264225442-en.
• Strengthening local capacity: Some countries with strong municipal or local engagement in education delivery, such as Finland, Germany and the Netherlands, have also endeavoured to strengthen capacity for policy making and monitoring at the local level (Box 2.4).
Box 2.4. Strengthening local capacity in Finland, Germany and the Netherlands
In Finland a municipal reform (2013) was adopted to strengthen municipal and service structures and reconsider the distribution of tasks between municipalities and the state.
In Germany, 35 local authorities established educational management structures, including a monitoring system for collecting and analysing data concerning lifelong learning. A national programme, Local Learning (2009), was also implemented with the aim of increasing transparency and efficiency.
Source: OECD (2015a), Education Policy Outlook 2015: Making Reforms Happen, http://dx.doi.org/10.1787/9789264225442-en; OECD (2014a), Education Policy Outlook: Germany, www.oecd.org/edu/EDUCATION%20POLICY%20OUTLOOK%20GERMANY_EN.pdf.
• Establishing new institutions in charge of school improvement: Some countries have also established organisations or structures to support schools in their improvement efforts, such as in the United Kingdom with Education Scotland (Box 2.5) and the Education Endowment Foundation in England (Box 2.6).
Box 2.5. Education Scotland
Created in 2011, Education Scotland is an independent agency whose goal is to support quality assurance and improvement in the Scottish education system. Education Scotland operates in the following areas: 1) providing support and resources for learning and teaching; 2) undertaking inspection and review at schools; 3) organising continuing professional development activities for teachers; 4) promoting positive relationships and behaviours in schools; 5) creating online support materials for teachers to support student improvement; 6) implementing Teaching Scotland’s Future in collaboration with key partners; and 7) conducting education research.
Source: OECD (2015b), Education Policy Outlook: United Kingdom, www.oecd.org/edu/UKM_profile_final%20draft_EN.pdf.
Using funding to steer education systemsGovernance and funding approaches can steer education systems towards higher performance, but to be successful, governance strategies and funding must be aligned. High-performing countries build on their institutions and take into account the different governance levels, their dynamics and resources to drive improvement across the system and schools (OECD, 2010). They set clear objectives for their education system, ensure that the right institutions are in place to deliver on the objectives, engage stakeholders in the process, and find the right balance between central and local direction, while at the same time ensuring that financial, material and human resources are aligned to the objectives (OECD, 2011).

E n s u r i n g a p p r o p r i a t e n a t i o n a l e d u c a t i o n s t r u c t u r e s a n d p o l i cy e nv i r o n m e n t Chapter 2
61EMPOWERING AND ENABLING TEACHERS TO IMPROVE EQUITY AND OUTCOMES FOR ALL © OECD 2017
Understanding better how to optimise governance and funding to achieve clear results is particularly important in the current context, where decision-making is increasingly shared among different stakeholders. Policy makers face the challenges of guiding and funding education for effectiveness and efficiency. With education systems increasingly decentralised to regional or local levels and increased demand for accountability for outcomes, a key challenge for countries is assuring alignment and consistency in governance approaches to guide their entire system towards improving outcomes. The main challenges in funding include lack of transparency and consistency, as well as the need to optimise resources to allocate limited funds where they can make the most difference.
Governments or regions tend to make the decisions about overall budgets for education, funding rules for regions or schools, the degree of autonomy and roles granted to schools, school principals and teachers, the types of schools allowed in the education system, national/regional assessments and core curricular standards, teacher qualifications, teacher salaries, recruitment processes, and the rules to assign teachers to schools. When schools enjoy a certain degree of autonomy, the types of decisions have to do with distributing school resources, student assessment, curricular content, disciplinary policies and admission policies. More autonomy is linked to more accountability and demand for results across the different levels of education systems to deliver good-quality education.
Box 2.6. The Pupil Premium in England (United Kingdom)
Tackling the continued underachievement of pupils from disadvantaged backgrounds is integral to the government’s priority of improving social mobility. In England, the focus of education policy is to close the attainment gap between those from poorer and wealthier backgrounds, to increase social mobility and to ensure all pupils realise their academic potential.
Introduced in April 2011, the Pupil Premium provides schools with significant additional money to raise the attainment of eligible pupils of all abilities. Pupils attract the grant to their school if they are recorded as qualifying for means-tested free school meals at any point in the previous six years, have been taken into the care of their local authority or have left care through adoption and other specified routes. To date, the Pupil Premium has provided over GBP 8.7 billion of additional funding for schools, with a further GBP 2.5 billion allocated for 2016-17. Schools receive between GBP 935 and GBP 1 900 per pupil, according to eligibility. These rates will be protected for the remainder of the current Parliament, until 2020.
Schools are best placed to decide how to use the funding to raise the attainment of their disadvantaged pupils, although they are encouraged to ensure that their use of the grant is strategic, evidence-based and regularly reviewed. The government is supporting effective decisions by providing the Education Endowment Foundation with GBP 137 million to expand the evidence base on raising the attainment of disadvantaged pupils and communicate what works to schools. As schools learn effectively from each other, the government maintains a directory of outstanding head teachers who can independently review and advise on the effectiveness of a school’s Pupil Premium strategy. Schools are held to account for the outcomes of disadvantaged pupils through school inspection, information on these pupils’ attainment and progress in annual school performance tables and a requirement to publish information online about the use and impact of the funding.
An independent implementation evaluation of the programme found that schools mostly use the additional funds from the Pupil Premium to support disadvantaged students on learning in the curriculum and to provide socio-emotional support (Carpenter et al., 2013). Specific interventions aimed at disadvantaged students include tutoring in out-of-school hours; mentoring for social skills, such as confidence, organisation and self-esteem; classroom and homework support; subsidised learning devices, such as laptops or tablets; and subject-specific intervention sessions.
Since the introduction of the Pupil Premium, the difference in relative attainment between disadvantaged pupils and their peers has been narrowing (Sutton Trust and Education Endowment Foundation, 2015). While this cannot be interpreted as causal evidence of the impact of pupil premium, it does suggest that it is a promising policy.
Source: OECD (2015a), Education Policy Outlook 2015: Making Reforms Happen, http://dx.doi.org/10.1787/9789264225442-en; Carpenter, H. et al. (2013), Evaluation of Pupil Premium: Research Report, https://www.gov.uk/government/uploads/system/uploads/attachment_data/file/243919/DFE-RR282.pdf; Sutton Trust and Education Endowment Foundation (2015), The Pupil Premium: Next Steps, www.suttontrust.com/wp-content/uploads/2015/06/Pupil-Premium-Summit-Report-FINAL-EDIT.pdf.

E n s u r i n g a p p r o p r i a t e n a t i o n a l e d u c a t i o n s t r u c t u r e s a n d p o l i cy e nv i r o n m e n tChapter 2
62 © OECD 2017 EMPOWERING AND ENABLING TEACHERS TO IMPROVE EQUITY AND OUTCOMES FOR ALL
Funding reforms have been widespread across countries, with system-level funding changes, targeted institution-level funding to different education levels, or funding approaches focused on students (such as grants or different student-aid mechanisms). The Pupil Premium in England (United Kingdom) illustrates how funding can be used to steer the system towards achieving specific targets (Box 2.6).
CREATING STRUCTURES TO FOSTER EDUCATIONAL REFORM AND CHANGE AT THE CLASSROOM LEVELEducation policy at the system level can also focus on creating the structures, framework conditions and incentives for fostering educational reform and change at school and classroom levels. A number of strategies have been adopted in this respect.
Reforms aimed at improving student learning
In a context of increased autonomy for schools in decisions on pedagogical resources and the curriculum, policies to guide and foster schools’ capacity to provide an adequate learning environment set high expectations for all, and relevant curricula are a concern of OECD countries. Improving schools to raise the quality of teaching and learning requires developing environments conducive to learning and ensuring high-quality school leaders and teachers.
Table 2.2Policies to develop positive learning environments (2008-14)
Comprehensive policies Content Targeted policies
General strategy Curriculum Learning support and innovative tools
Austria: School Quality in General Education (SQA, 2012)
Australia: Students First (2014)
Ireland: National Strategy to improve Literacy and Numeracy among children and young people 2011-20 (2011)
Mexico: Comprehensive Strategy to Improve Education Achievement (2009); Quality Schools Programme, PEC (2006-09, 2010-13)
New Zealand: Student Achievement Function (2010)
Norway: Better learning environment (2009-14); Action plan to raise performance in lower secondary education (2012)
United Kingdom: (Northern Ireland) Every School a Good School (ESaGS) (2009); (Wales) Improving schools Plan (2012); (Scotland) Curriculum for Excellence (2010)
Denmark: The National Common Objectives for Compulsory Education (2009)
Finland: Curriculum reform for pre-primary to upper secondary education for 2016 (2014)
Hungary: Decree on the National Core Curriculum (2012)
Iceland: National curriculum guidelines (2011)
Italy: National curriculum guidelines (Ministerial Decree no. 254/2012 (2012)
Japan: Course of Study (2008)
Sweden: A new curriculum for compulsory education (2011)
United Kingdom: (Wales) National Literacy and Numeracy Framework (2013)
Czech Republic: Project Methodology (Metodika) (2011)
Finland: Web-based service for learning difficulties in reading and mathematics, LukiMat (2008)
Hungary: Act on Textbook Provision of National Public Education (2013)
Ireland: Project Maths (2010)
New Zealand: Positive Behaviour for Learning (2009)
Norway: The Advisory Team Programme (2009)
Spain: Information and communication technology (ICT) plan for schools (2012)
Structure
Austria: Whole-day schooling offers (2013)
France: Redistribution of learning time under the Reform of the Republic’s School (2013)
Ireland: Increase in reading instruction (2011); Framework for Junior Cycle (2014)
Korea: After-school childcare (2014)
Luxembourg: Compulsory Education Reform (2009) school administration in partnership.
Mexico: Full-time Schools Programme (2009-12)
Source: OECD (2015a), Education Policy Outlook 2015: Making Reforms Happen, http://dx.doi.org/10.1787/9789264225442-en.

E n s u r i n g a p p r o p r i a t e n a t i o n a l e d u c a t i o n s t r u c t u r e s a n d p o l i cy e nv i r o n m e n t Chapter 2
63EMPOWERING AND ENABLING TEACHERS TO IMPROVE EQUITY AND OUTCOMES FOR ALL © OECD 2017
A majority of students across OECD countries find that their classrooms are conducive to learning, but there are challenges across schools in some countries, including insufficient student motivation, lack of relevant curriculum, difficulties in attracting and retaining qualified staff, insufficient teacher collaboration and professionalisation of school leadership. Most OECD countries have been introducing policies to respond to these challenges, and recent policies have focused especially on what and how students learn (Table 2.2).
To achieve improvement in learning environments, OECD countries have introduced comprehensive school improvement policies or strategies, policies introducing new curricula or new skills, as well as other policies targeted to delivering concrete support for learning.
Comprehensive school improvement strategies
Comprehensive strategies and structural policies that change the structure of learning environments have been introduced in a number of countries, such as France and the United Kingdom (Box 2.7).
Box 2.7. Comprehensive school improvement strategies
France
In France, redistribution of learning time under the Reform of the Republic’s School (2013) added half a day of schooling per week in primary education, redistributed learning time across the week and introduced additional pedagogical activities and individualised learning time in schools.
United Kingdom
Northern Ireland introduced Every School a Good School (2009) which aims to support schools and enable them to raise standards and overcome barriers to higher student learning for better outcomes. An implementation plan published with the policy set out the key actions, targets and timescales. In the same spirit, Scotland’s Curriculum for Excellence (2010) includes complementary aspects to support school improvement. In Wales, the Improving Schools Plan (2012) introduced a National Literacy and Numeracy Framework (2013) to provide a continuum of support to improve literacy and numeracy and reduce the impact of deprivation on educational outcomes for children from age 3 to age 16. National Reading and Numeracy Tests for students from Year 2 to Year 9 have been introduced for formative and summative purposes.
Source: Department of Education (2009), Results of Equality Impact Assessment: “Every School a Good School”: A Policy for School Improvement; OECD (2014b), Improving Schools in Wales: An OECD Perspective, www.oecd.org/edu/Improving-schools-in-Wales.pdf; OECD (2015a), Education Policy Outlook 2015: Making Reforms Happen, http://dx.doi.org/10.1787/9789264225442-en.
Professionalisation of school leadership
Some countries have also introduced policies to support the increased professionalisation of school leadership and reap the full benefits of increased school autonomy. For instance, Portugal introduced initial training programmes for school leaders, while Austria revised the responsibilities of school leadership to more explicitly include quality management as part of their duties. Some reforms of curriculum and instruction also include capacity-building for school leaders and teachers, as in Finland (Box 2.8).
Box 2.8. Finland
In January 2016, the Ministry of Education and Culture in Finland appointed a Teacher Education Forum to reform the core education and induction in-service training of teachers as part of the government’s key project on new comprehensive schools. The objective of the development programme is to ensure that teacher education remains attractive and strong, and that prospective teachers assimilate an enquiry-based and creative approach to their work. More than 2 000 experts in the education sector, students and teachers participated in the development of the programme.
…

E n s u r i n g a p p r o p r i a t e n a t i o n a l e d u c a t i o n s t r u c t u r e s a n d p o l i cy e nv i r o n m e n tChapter 2
64 © OECD 2017 EMPOWERING AND ENABLING TEACHERS TO IMPROVE EQUITY AND OUTCOMES FOR ALL
Modifying the curriculum
To develop environments more conducive to learning that motivate students and ensure higher levels of skills, a number of countries have introduced comprehensive curricular reforms to foster change in the knowledge, competencies, abilities and values students develop in their learning environment (OECD, 2013b). Policies reforming instructional content vary in approach and the extent to which the curriculum has been changed. In many countries, such as Poland and the United Kingdom, curriculum guidelines focus primarily on developing core educational competencies (Box 2.9), while other curriculum guidelines are broader and also focus on values and socio-emotional skills, such as in Hungary, Japan and Korea (Box 2.10).
Box 2.9. Curriculum reforms focusing on core competencies
Poland: Shift to transversal skills and learning outcomes
In 2008, Poland modified the national core curriculum for general education and school vocational training programmes, shifting from narrow, subject-related requirements (earlier described by the intended content of instruction) to more general, transversal skills and competences defined by learning outcomes, with a focus on experiments, scientific inquiry, problem-solving, reasoning and collaboration. The new regulations also increased the autonomy of schools to develop their own sets of programmes and manage instruction time. Schools are only required to ensure that outcomes defined in the national curriculum are attained.
United Kingdom
In Northern Ireland, the Entitlement Framework (statutory since 2013) guarantees that students age 14 and above can access a broad and balanced curriculum, by requiring the offer of a minimum number of courses in their geographic area. The intention is to help students reach their full potential by providing access to relevant and engaging courses that best suit their needs and aspirations. All post-primary schools and Further Education colleges are grouped into Area Learning Communities, established to help them work collaboratively in order to ensure that the courses offered in a given area meet students’ needs and the minimum required by statute.
In Scotland, the Curriculum for Excellence (CfE) (2010) aims to transform learning for 3-18 year-olds by providing all learners with a range of personalised learning to develop skills and knowledge and by skilling teachers to assess a learner’s progress based on a wide range of information. An OECD review of the Scottish education system to examine the progress of implementation of CfE from the first year of primary education to the third year of secondary school (Broad General Education phase) took place in 2015. The review concluded that Scotland had adopted an important and appropriate curriculum reform. It also made a number of recommendations on how Scotland could secure the benefits of its new approach in all parts of the country.
Source: OECD (2015a), Education Policy Outlook 2015: Making Reforms Happen, http://dx.doi.org/10.1787/9789264225442-en.
Finland’s vision of teacher education development is based on:
• A systematic and coherent structure of teachers’ competence development during teachers’ careers, in teams and networks.
• Mentoring as a more systematic part of teachers’ induction training, especially early in their careers.
• Strengthening of strategic management in educational institutions by developing leadership training. The goal is to ensure that teacher education imparts prospective teachers with capabilities for taking responsibilities and participating in leadership processes.
Higher education and other educational institutions, as well as early childhood education and care units, will prepare competence development plans and evaluation in collaboration with staff. Development programme implementation will be supported by almost EUR 10 million. In total, EUR 60 million will be allocated to improving teachers’ competence over three years.
Source: Ministry of Education and Culture, Finland (2017), www.minedu.fi/en/frontpage.

E n s u r i n g a p p r o p r i a t e n a t i o n a l e d u c a t i o n s t r u c t u r e s a n d p o l i cy e nv i r o n m e n t Chapter 2
65EMPOWERING AND ENABLING TEACHERS TO IMPROVE EQUITY AND OUTCOMES FOR ALL © OECD 2017
Box 2.10. Curriculum reforms focusing on values and socio-emotional skills
Hungary: Focus on values
Hungary’s Decree on National Core Curriculum (2012) defines the values that the curriculum should convey, including communication skills, student well-being, volunteering and digital literacy.
Japan: Curriculum guidelines to foster a zest for life
Japan’s Ministry of Education revised the Course of Study which serves as the fundamental standard for school curriculum in elementary and lower secondary schools. It provides guidelines to increase children’s fundamental knowledge, skills, and their capacity to think and communicate. The revision came as a response to studies, including PISA, that show declining results for Japanese students in reading comprehension, application of knowledge and skills, desire to learn, study and lifestyle habits, confidence in themselves and the future, and physical strength.
The idea of fostering a zest for life is central to the revised guidelines. Students are expected to acquire solid fundamental knowledge and skills, to develop the ability to think, make decisions and express themselves, and then to use these skills and abilities to solve problems. The guidelines strengthen the curriculum in languages, mathematics and science, and increase study hours in class. They also aim to nurture a sound mind and fitness by enhancing moral and physical education.
Korea: Free Semester System to promote student happiness
In 2013, as part of a move towards a greater focus on promoting student happiness in the education system, the Korean government introduced a pilot programme of test-free semesters for lower secondary students. These are designed to reduce students’ test-related stress and help them to acquire life values and engage in various activities, including career search. During the free semester, students attend “departmentalised classes”, where they participate in debates, experiments and practices and learn how to manage projects. Students also participate in various free-semester activities, including career development, selection of subjects, art education, physical education and student clubs. Following a positive response to the initial roll-out of the Free Semester System in lower secondary education, the programme was expanded in 2015 to cover 80% of lower secondary schools (2 551 schools, far higher than the initial goal of 1 500 schools) before a full roll-out in all middle schools in 2016. Satisfaction surveys indicate that students, teachers and parents all view the Free Semester System as a positive change.
Source: OECD (2015a), Education Policy Outlook 2015: Making Reforms Happen, http://dx.doi.org/10.1787/9789264225442-en; OECD (2016), Education Policy Outlook: Korea, www.oecd.org/edu/Education-Policy-Outlook-Korea.pdf.
Introducing or developing learning supports to enhance learning environments
Last but not least, policies introducing or developing learning supports constitute another policy lever, as they can strengthen the conditions in which the teaching and learning process occurs, by addressing factors such as instruction and learning time or resources available to support student learning.
A number of OECD countries have introduced new pedagogical tools and resources to support learning, many of which rely on new technologies. For instance, the Czech Republic introduced web-based pedagogical support tools for teachers in core subjects through Project Methodology (2011), while Ireland’s Project Maths (2010) provides online courses and resources to support secondary teachers to implement a mathematics syllabus and improve student learning.
Evaluation and assessment to improve student outcomes
There is widespread recognition that evaluation and assessment arrangements are crucial to improve educational practices and student learning, to recognise the work of educational practitioners and to certify students’ achievements. The challenges countries face include designing a coherent framework for evaluation and assessment policies, targeting better classroom practices and better student outcomes, and building capacity at all levels. To respond to these challenges, it is important to understand the key elements and processes for successful design and implementation of evaluation and assessment policies at the student, school and system levels.
Evaluation and assessment policies aim to actively engage students in their own learning, foster schools’ self-evaluation and give comprehensive information on accountability to the public. They should provide school staff with a deep
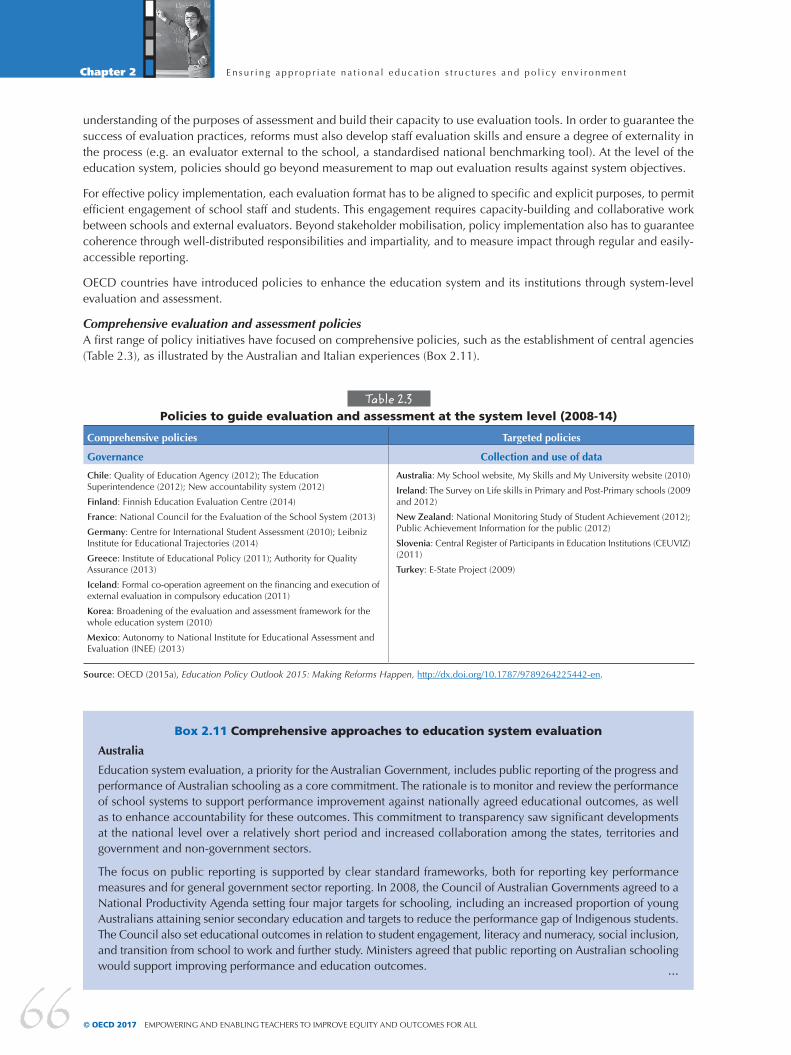
E n s u r i n g a p p r o p r i a t e n a t i o n a l e d u c a t i o n s t r u c t u r e s a n d p o l i cy e nv i r o n m e n tChapter 2
66 © OECD 2017 EMPOWERING AND ENABLING TEACHERS TO IMPROVE EQUITY AND OUTCOMES FOR ALL
Box 2.11 Comprehensive approaches to education system evaluation
Australia
Education system evaluation, a priority for the Australian Government, includes public reporting of the progress and performance of Australian schooling as a core commitment. The rationale is to monitor and review the performance of school systems to support performance improvement against nationally agreed educational outcomes, as well as to enhance accountability for these outcomes. This commitment to transparency saw significant developments at the national level over a relatively short period and increased collaboration among the states, territories and government and non-government sectors.
The focus on public reporting is supported by clear standard frameworks, both for reporting key performance measures and for general government sector reporting. In 2008, the Council of Australian Governments agreed to a National Productivity Agenda setting four major targets for schooling, including an increased proportion of young Australians attaining senior secondary education and targets to reduce the performance gap of Indigenous students. The Council also set educational outcomes in relation to student engagement, literacy and numeracy, social inclusion, and transition from school to work and further study. Ministers agreed that public reporting on Australian schooling would support improving performance and education outcomes.
understanding of the purposes of assessment and build their capacity to use evaluation tools. In order to guarantee the success of evaluation practices, reforms must also develop staff evaluation skills and ensure a degree of externality in the process (e.g. an evaluator external to the school, a standardised national benchmarking tool). At the level of the education system, policies should go beyond measurement to map out evaluation results against system objectives.
For effective policy implementation, each evaluation format has to be aligned to specific and explicit purposes, to permit efficient engagement of school staff and students. This engagement requires capacity-building and collaborative work between schools and external evaluators. Beyond stakeholder mobilisation, policy implementation also has to guarantee coherence through well-distributed responsibilities and impartiality, and to measure impact through regular and easily-accessible reporting.
OECD countries have introduced policies to enhance the education system and its institutions through system-level evaluation and assessment.
Comprehensive evaluation and assessment policiesA first range of policy initiatives have focused on comprehensive policies, such as the establishment of central agencies (Table 2.3), as illustrated by the Australian and Italian experiences (Box 2.11).
…
Table 2.3Policies to guide evaluation and assessment at the system level (2008-14)
Comprehensive policies Targeted policies
Governance Collection and use of data
Chile: Quality of Education Agency (2012); The Education Superintendence (2012); New accountability system (2012)
Finland: Finnish Education Evaluation Centre (2014)
France: National Council for the Evaluation of the School System (2013)
Germany: Centre for International Student Assessment (2010); Leibniz Institute for Educational Trajectories (2014)
Greece: Institute of Educational Policy (2011); Authority for Quality Assurance (2013)
Iceland: Formal co-operation agreement on the financing and execution of external evaluation in compulsory education (2011)
Korea: Broadening of the evaluation and assessment framework for the whole education system (2010)
Mexico: Autonomy to National Institute for Educational Assessment and Evaluation (INEE) (2013)
Australia: My School website, My Skills and My University website (2010)
Ireland: The Survey on Life skills in Primary and Post-Primary schools (2009 and 2012)
New Zealand: National Monitoring Study of Student Achievement (2012); Public Achievement Information for the public (2012)
Slovenia: Central Register of Participants in Education Institutions (CEUVIZ) (2011)
Turkey: E-State Project (2009)
Source: OECD (2015a), Education Policy Outlook 2015: Making Reforms Happen, http://dx.doi.org/10.1787/9789264225442-en.

E n s u r i n g a p p r o p r i a t e n a t i o n a l e d u c a t i o n s t r u c t u r e s a n d p o l i cy e nv i r o n m e n t Chapter 2
67EMPOWERING AND ENABLING TEACHERS TO IMPROVE EQUITY AND OUTCOMES FOR ALL © OECD 2017
As the basis for reporting on the progress of the education system, the Measurement Framework for Schooling in Australia (2012):• outlines the data collection and reporting responsibilities of school systems and sectors across the country• details national key performance measures for schooling• outlines the annual assessment and reporting cycle• underpins the National Report on Schooling in Australia released by Education Ministers.
The Framework is reviewed every three years by the Australian Curriculum, Assessment and Reporting Authority, in consultation with jurisdictions and sectors. The revised framework is then submitted to the Education Council for Education Ministers’ approval.
Italy
The National Evaluation System (2013) is composed of the National Institute for the Evaluation of the Education and Training system (INVALSI, 2004), the National Institute for Documentation, Innovation and Research in Education (INDIRE) and the Inspectorate. Schools are considered important contributors to the evaluation process. The regulation was implemented starting in 2014.
The school evaluation process has four phases: 1) the school self-evaluates; 2) the school leader completes the school evidence-based self-evaluation report, with the help of a co-ordinated team; 3) the report informs the work of a visiting team of experts that carries out the external evaluation, with findings used by the school to inform the school improvement plan and develop improvement targets with support of INDIRE or other qualified institutions; and 4) the results are published and disseminated. The school self-evaluation report and improvement targets provide the basis for evaluation of school leaders.
Source: OECD (2015a), Education Policy Outlook 2015: Making Reforms Happen, http://dx.doi.org/10.1787/9789264225442-en; Santiago, P., et al. (2011), OECD Reviews of Evaluation and Assessment in Education: Australia 2011, http://dx.doi.org/ 10.1787/9789264116672-en.
Table 2.4Policies for student assessment (2008-14)
Content Targeted policies
Standards National standardised assessments
Austria: Educational standards for Mathematics, German and English in grades 4 and 8 (2012)
Denmark: National Common Objectives for Compulsory Education (2009)
Germany: Guidelines on the use of selected educational standards for teachers (2009); Educational standards for the Allgemeine Hochschulreife in German, mathematics and English/French (2012)
New Zealand: National standards for literacy and numeracy (2010)
United States: Common Core State Standards Initiative (2009)
Australia: National Assessment Program – Literacy and Numeracy (2008)
Austria: Assessment in nationwide tests in grades 4 and 8 (2012)
Canada (Alberta): Student Learning Assessments (SLAs) replaced the existing Provincial Achievement Tests (2013)
Czech Republic: Standardised tests in grades 5 and 9 (2011); School leaving examinations (2011)
Denmark: National tests for years 2 to 8 (2010)
Ireland: Standardised assessment in literacy and numeracy (2012)
Italy: National standardised tests in primary and lower secondary education as part of the National Assessment System (2008); Suspension of standardised testing in Grade 6 and no implementation in Grade 13 (2013)
Korea: Test-free semesters (2013)
Spain: Under LOMCE standardised end of grade 3, 6, 10 and 12 (2013); PISA for Schools (2014)
Sweden: A new grading scale (2011); National tests in grades 3, 6 and 9 and two additional tests in grades 6 and 9 (2011)
United Kingdom (Wales): National reading and numerical procedure tests (2013)
Other assessments
Luxembourg: Evaluation reform under the Compulsory Education Reform: student portfolios (2009)
Source: OECD (2015a), Education Policy Outlook 2015: Making Reforms Happen, http://dx.doi.org/10.1787/9789264225442-en.
Targeted policies on student assessmentAnother round of policy initiatives focus on more targeted policies that draw upon student assessment data to improve learning (Table 2.4), as illustrated by the experiences of the Netherlands, New Zealand and Norway (Box 2.12).

E n s u r i n g a p p r o p r i a t e n a t i o n a l e d u c a t i o n s t r u c t u r e s a n d p o l i cy e nv i r o n m e n tChapter 2
68 © OECD 2017 EMPOWERING AND ENABLING TEACHERS TO IMPROVE EQUITY AND OUTCOMES FOR ALL
Box 2.12. Using assessment results to improve student learning
The Netherlands
In the mid-1980s, primary schools in the Netherlands started to make use of a student monitoring system, the LVS (Leerling Volg Systeem). Later, student monitoring systems were also implemented in secondary schools, and every secondary school now has one. The LVS for primary education is a consistent set of nationally standardised tests for longitudinal assessment of a student’s achievement throughout primary education, as well as a system for manual or automated registration of student progress. The LVS covers language, (including decoding and reading comprehension), arithmetic, world orientation (geography, history and biology), social-emotional development, English, science and technology. It is purchased by schools at their own cost and initiative. The primary objective of the LVS is formative assessment of student achievement and individual students’ mastery of key subject matter areas in relation to their year level. The following presentation formats are made available on the basis of the LVS:
• The student report is a graph in which the student’s progress is visible throughout the years in relation to five reference groups: 1) 25% highest scoring students; 2) just above average; 3) just below average; 4) far below average; and 5) 10% lowest scoring students.
• For children with special education needs and who visit special education schools, an alternative student report is made available. This report also shows at what level a student is functioning and how to interpret the results of the student compared to children of the same age who attend mainstream primary education.
• The group survey contains the results of all the students from a group over a number of years in a table. For each student the scale of ability score at the successive measuring moments is shown along with the level score.
New Zealand
The New Zealand Ministry of Education’s Position Paper on Assessment (2010) provides a formal statement of its vision for assessment. It describes what the assessment landscape should look like if assessment is to be used effectively to promote system-wide improvement within and across all layers of the schooling system. Placing assessment firmly at the heart of effective teaching and learning, the paper highlights and explains six key principles: 1) the student is at the centre; 2) the curriculum underpins assessment; 3) building assessment capability is crucial to achieving improvement; 4) an assessment-capable system is an accountable system; 5) a range of evidence drawn from multiple sources potentially enables a more accurate response; and 6) effective assessment is reliant on quality interactions and relationships. To support effective assessment practices at the school level, the Ministry of Education decided to conduct an exercise that mapped existing student assessment tools. The purpose was to align some of the assessment tools to the National Standards and provide an Assessment Resource Map to help school professionals select the appropriate assessment tool to fit their purpose.
Norway
In Norway, a statutory requirement was introduced for schools to implement assessment for learning. To support teachers in fulfilling the requirements for formative assessment, the Directorate for Education and Training created a website on assessment for learning providing a range of materials and tools, including questions for reflection, films, assessment tools and literature, as well as examples of different ways to document formative assessment practice. At the same time, there was a developing awareness that teachers had not traditionally received training in formative assessment and that there was very little expertise available nationally for school leaders to draw on to provide support. To address this the Ministry of Education and Research and the Directorate for Education and Training identified formative assessment as a priority area for education policy and professional development and launched a range of support programmes and learning networks at the regional, local and school level. For example, the Assessment for Learning programme (2010-14) organised learning networks at the local and regional level, where practitioners exchanged experience and created spaces for common reflection on effective practice. Participating municipalities and counties employed a formative assessment contact person to assist in running the project locally. These contact persons attended Assessment for Learning workshops run by the directorate. The programme also provided online resources including tools and videos on how to enact effective formative assessment in the classroom.
Sources: OECD (2013c), Synergies for Better Learning: An International Perspective on Evaluation and Assessment, http://dx.doi.org/10.1787/9789264190658-en; Nusche, D., et al. (2012), OECD Reviews of Evaluation and Assessment in Education: New Zealand 2011, http://dx.doi.org/10.1787/9789264116917-en; Nusche, D., et al. (2011), OECD Reviews of Evaluation and Assessment in Education: Norway 2011, http://dx.doi.org/10.1787/9789264117006-en.

E n s u r i n g a p p r o p r i a t e n a t i o n a l e d u c a t i o n s t r u c t u r e s a n d p o l i cy e nv i r o n m e n t Chapter 2
69EMPOWERING AND ENABLING TEACHERS TO IMPROVE EQUITY AND OUTCOMES FOR ALL © OECD 2017
BUILDING ON RESEARCH AND EVIDENCE IN POLICY DEVELOPMENTAs outlined at the beginning of this chapter, effective governance also hinges on harnessing evidence and research to inform the policy-development process. A strong knowledge system combines descriptive system data, research findings and expert practitioner knowledge, to understand what to use, when, why and how.
Building upon research and evidence to develop policy can help raise issues on the policy agenda to provide the impetus for reform, as well as dispel myths and provide fine-grained analysis on possible consequences of various policy options, to spur a more meaningful policy dialogue with different stakeholders.
The areas where research and evidence inform policy development include the following:
• Better awareness of the universality of basic skills:Goal 4 of the United Nations (UN) Sustainable Development Goals envisions that “all learners acquire the knowledge and skills needed to promote sustainable development” (UN, 2015, Target 4.7). PISA offers one way to assess and monitor how well countries are preparing their students for life after compulsory education. In this respect, the share of students who achieve the baseline level of skills in all three domains (science, reading and mathematics) varies considerably across countries, from more than 80% in Canada, Estonia, Finland, Hong Kong (China), Japan, Macao (China) and Singapore, to less than 20% in some middle-income countries. The culturally and geographically diverse set of countries in the former group shows that universal basic skills could become a reality within the next generation on all continents. At the same time, the small set of countries that achieve this benchmark today show that much remains to be done in most countries (including some of the wealthiest OECD countries) to attain the Sustainable Development Goals. As such, PISA evidence offers a strong impetus for policy action.
• More nuanced discussion of the nexus between education expenditure and results:Money is necessary to secure high and equitable performance in schools, but money alone is not sufficient. Of the ten countries/economies participating in PISA that have the highest cumulative public expenditure per student up to age 15, only one – Singapore – is among the seven countries/economies where less than 20% of students are low achievers in any of the three domains. But those seven include Estonia, where public spending per student is below the OECD average.
Perhaps more important, several countries have increased expenditures over the past decade without seeing corresponding improvements in the quality of the learning outcomes measured by PISA, and there has been no notable reduction in the percentage of students performing below the baseline level of proficiency. While money relates to learning outcomes among low-spending countries, for the majority of OECD countries the way resources are allocated and the qualitative differences in education policies, cultural norms and professional practices seem more important to understand performance differences between and within countries.
• Better understanding of trade-offs in the debate on class size:One strong driver of education expenditure is class size, and this is also an intense source of debate between governments and teachers’ unions. While previous research has pointed to some benefits associated with smaller classes, particularly for disadvantaged and minority students (Dynarski, Hyman and Schanzenbach, 2013), PISA data suggests that large classes have not prevented schools in East Asia from providing good instruction, and that students in large classes tend to score higher across OECD countries. Given the high costs associated with smaller classes, this finding raises the question of the opportunity costs and trade-offs of reducing class size.
Evidence from TALIS nuances this debate, as reports from teachers on their perceived sense of efficacy and job satisfaction suggest that class size may indeed not matter in itself for self-efficacy and job satisfaction, but that the classroom climate does. The more fine-grained research findings suggest that the class-size debate cannot be settled apart from the classroom-climate issue, and that the pattern of very large classes found in Asia might not be directly transposable to other countries/regions where behavioural issues are more prevalent.
• Awareness of the need for reforms to change what happens in the classroom:Research on the drivers of student performance has shown that what happens inside the classroom is crucial for students’ learning and career expectations. With respect to science performance, for instance, PISA 2015 results show that how science teachers teach is more strongly associated with performance and students’ expectations for a career in science than the material and human resources of science departments, including the qualifications of teachers or the kinds of extracurricular science activities offered to students (Figure 2.2).

E n s u r i n g a p p r o p r i a t e n a t i o n a l e d u c a t i o n s t r u c t u r e s a n d p o l i cy e nv i r o n m e n tChapter 2
70 © OECD 2017 EMPOWERING AND ENABLING TEACHERS TO IMPROVE EQUITY AND OUTCOMES FOR ALL
Students tend to perform better in schools that provide an environment conducive to learning. Unfortunately, PISA 2015 also suggests that learning environments across OECD countries have deteriorated in recent years. More students in 2015 than in 2012 reported that they had skipped a day of school or classes, or had arrived late for school in the two weeks prior to the PISA test, and principals were more likely in 2015 than in 2012 to report that teacher and student behaviours hindered student learning.
Figure 2.2Factors associated with science performance
Multilevel regression models of education systems, schools and students
1. The socio-economic profile is measured by the PISA index of economic, social and cultural status (ESCS).2. In the two weeks prior the PISA test.3. Includes homework, additional instruction and private study.Notes: All variables have been introduced jointly in a three-level regression model.Statistically significant coefficients have associated z-scores below -1.96 or above 1.96.The z-scores for «all countries and economies» are generally lower because the uncertainty surrounding the relationships is significantly higher.See Table II.7.1. for results by education system.Factors are ranked in descending order of the z-scores for OECD countries.Source: OECD, PISA 2015 Database.1 2 http://dx.doi.org/10.1787/888933436455
Level of con�dencethat a relationship exists (z-scores)
-100 -80 -60 -40 -20 200 40 60 80
Student’s socio-economic pro�le¹
Index of adaptive instruction
Index of teacher-directed instruction
School’s socio-economic pro�le¹
Student is required to attend at least one science course
Index of disciplinary climate in science lessons (student)
Student speaks the test language at home
Student is enrolled in a general programme (ref: vocational/modular)
Index of disciplinary climate in science lessons (school)
Student has no immigrant background
Student’s socio-economic pro�le¹, squared
Number of students in language-of-instruction class
Index of science-speci�c resources
Previous academic performance considered for school admission
School offers science competitions
School offers a science club
Index of shortage of educational material
School is located in a city (ref: town)
Index of teacher support
Total time per week in regular lessons, minutes
School is located in a rural area (ref: town)
Pre-primary attendance, years
Index of shortage of education staff
Index of school autonomy
External evaluations exist at the school
Ability grouping within schools
Participation in professional development (% school teachers)
Index of educational leadership
Residence considered for school admission
Student attends a private school
Index of student behaviour hindering learning
Student skipped a school day²
Student arrived late for classes²
Index of enquiry-based instruction
Student is a girl
After-school study time³, hours
Index of perceived feedback
Student had repeated a grade at least once
All countries and economies OECD countries
Negative association with science scores
Positive association with science scores

E n s u r i n g a p p r o p r i a t e n a t i o n a l e d u c a t i o n s t r u c t u r e s a n d p o l i cy e nv i r o n m e n t Chapter 2
71EMPOWERING AND ENABLING TEACHERS TO IMPROVE EQUITY AND OUTCOMES FOR ALL © OECD 2017
• Awareness of the need for schools to use multiple types of assessments:Student assessments serve different purposes, and certain assessments are better suited to achieving some goals than others. For instance, standardised tests appear to be better for comparing schools, awarding certificates to students or monitoring a school’s progress from year to year, while teacher-developed tests seem more appropriate for informing parents about their child’s progress, and for identifying aspects of instruction that could be improved or guiding student learning. The most effective strategy is to strategically combine multiple types of assessments (including traditional written exams designed by teachers, oral tests, teachers’ judgements, collaborative problem-solving, long-term projects or standardised tests), so that a wide variety of education goals can be fulfilled and students can develop the skills they need for the future. School leaders and teachers should be prepared to design their own tests, provide fair and balanced judgements, and be comfortable with conducting and interpreting standardised tests.
Over the past few years, a number of OECD countries have developed initiatives to strengthen the research and evidence basis available to support school improvement. The innovation fund of the Netherland’s Education Cooperative is an interesting teacher-driven example in this respect (Box 2.13).
Box 2.13. The Education Cooperative in the Netherlands
In recent years, professional collective autonomy and governance have become a central part of the public discourse on education in the Netherlands. Moving away from a top-down approach, the idea has taken hold that teachers should have a say on all levels of education, not just in the classroom, but also at the school and system levels. One of the major initiatives on this front has been the establishment of the Education Cooperative (Onderwijscoöperatie), an association of teachers run by teachers for teachers.
The Education Cooperative works with the people it represents: teachers in primary, secondary and vocational education. It was established in 2011 by five major teacher unions and associations. All these organisations retain their specific tasks and objectives within the Education Cooperative. Together they represent 200 000 teachers, over four-fifths of the teaching population.
The Education Cooperative has three key focus areas:
• Professional competency: The Education Cooperative is helping to develop competency frameworks and standards, with the aim of safeguarding the quality of the profession. Registration of professional teachers is one component of this.
• Autonomy: The Education Cooperative wants to facilitate the development and autonomy of teachers to practice their profession in a professional manner.
• Status and image: Good teachers who carry out their work in a professional manner constitute the foundation of a good image. However, more is needed to project this image to the outside world. The Education Cooperative encourages activities that contribute to improving this image and the status of teachers as a professional group.
Two major policy initiatives by the Education Cooperative pose great impact on teacher professionalism:
• Teacher Development fund: A Fund (Lerarenontwikkelfonds) with a budget of EUR 5 million has been set up in 2015. It awards teachers an amount of EUR 4,000 to EUR 75,000 to research or implement their innovative development ideas. Teachers collaborate in network innovation labs, which are hosted all across the country to spread ideas and opportunities across the system. Most of the coaches, jury and support staff are part-time teachers themselves. The research on impact is being carried out by teachers under the guidance of academics.
• Register of teachers: The Educational Cooperative is in charge of setting up a register of teachers (Lerarenregister) and a Professional Standard. The register has been set up to promote professional learning and governance. The register will be governed by a council of 24 representatives. This council will define the professional status, the standards and criteria for (re-)registration and development. The registration process will start on the first of August 2018. One year later the process of re-registration will follow.
Source: The Education Cooperative (the Netherlands), https://onderwijscooperatie.nl.

E n s u r i n g a p p r o p r i a t e n a t i o n a l e d u c a t i o n s t r u c t u r e s a n d p o l i cy e nv i r o n m e n tChapter 2
72 © OECD 2017 EMPOWERING AND ENABLING TEACHERS TO IMPROVE EQUITY AND OUTCOMES FOR ALL
ENHANCING POLICY EVALUATION FROM INCEPTION TO IMPLEMENTATIONLast but not least, the success of educational reform hinges upon constant feedback loops and policy dialogue with stakeholders at all stages of reform, from inception to implementation.
Challenges in implementing school improvement reforms
Education systems are embedded in different cultural, economic and political contexts. At the same time, they have increased in complexity, so there is a wide range of policy options to make them more efficient and equitable while improving student outcomes. The OECD has developed a framework to analyse and compare policies by grouping levers into three categories: students, institutions and systems (Table 2.5) (OECD, 2012).
There is limited systematised knowledge on the best ways to implement policies to promote improvement in schools and classrooms, and especially on policy processes that can change the classroom context and lead to improved student outcomes. Areas which are important for success of school improvement reforms can be grouped under three levels of action:
• Focus on classroom practices: Elements of the programmes that target classroom practices through the introduction of new curricula, methods of teaching, professional development of teachers and use of data.
• Building capacity at schools: Elements of the programme that are directed towards developing the organisation and leadership of schools.
• Alignment with the external policy environment: External factors, such as external pressure and support, alignment of policies and timeline of policies.
Context plays an important role in how policies are interpreted and implemented, and some programmes may be effective in one setting but not in another. The contextual factors that need to be taken into account when looking at a policy or reform include: the composition of the student population; the governance structures (i.e. whether the system is decentralised or centralised, the number of levels of governance and the number of actors); the political context in which the policy is being implemented; and the historical and cultural traditions of the system.
Composition of the student population can make a difference with regard to what school improvement programme would be suitable for a school. Some programmes do not work well with a high percentage of students with a language background different from the majority. Countries may also have institutional practices which hamper the development of a culture for school improvement, such as election of school leaders by teachers or a high proportion of teachers in temporary positions.
Some school improvement programmes depend heavily on the school’s leader and the school’s abilities to improve. If there is a long history of autonomous teachers, lack of understanding of leadership and no functioning school-level collaboration, some school programmes and change efforts will not be suitable. In less centralised educational systems, there is more variety between schools in their history of school improvement. Within the same school system, there might be programmes which will work well for schools with a long tradition of improvement, while the design might be less suitable for schools that are struggling to meet basic standards.
The potential of partnerships with the profession itself
In many circumstances, teachers’ unions are instrumental. Some reforms may require changes in working conditions. Better learning opportunities should be given to teachers to support them so that they can introduce new approaches or reforms. Teachers’ unions are therefore important stakeholders in many school improvement programmes. In addition, the unions are often important opinion leaders and can influence teachers’ views on a new curriculum, assessment methods or professional training. There are also ways of consulting unions on teachers’ views or creating other structures for dialogue and consultation with teachers to better understand their points of views.
Some studies suggest that the traditional role of unions in negotiating with governments on working conditions and salaries should be expanded to include other aspects related to career structure and development, as well as greater participation in finding ways to improve teacher effectiveness. Bascia (2008) finds that teachers’ expectations focus on occupational advocacy (improving working conditions); economic sufficiency (improvements in compensation); participation in decision-making; professional development and learning; and articulating and promoting a positive professional identity.

E n s u r i n g a p p r o p r i a t e n a t i o n a l e d u c a t i o n s t r u c t u r e s a n d p o l i cy e nv i r o n m e n t Chapter 2
73EMPOWERING AND ENABLING TEACHERS TO IMPROVE EQUITY AND OUTCOMES FOR ALL © OECD 2017
Table 2.5Education Policy Outlook policy levers (2008-14)
Policy levers Definition Policy options Policies
Students: raising outcomes
Equity (and quality)
Policies to ensure that personal or social circumstances do not hinder achieving educational potential (fairness) and that all individuals reach at least a basic minimum level of skills (inclusion)
Investing early on Provision of quality early childhood education and care.
Tackling system level policies
Avoiding grade repetition, early tracking and student selection; managing school choice; developing funding strategies that address students’ and schools’ needs; designing upper secondary pathways to ensure completion.
Supporting low-performing disadvantaged schools and students
Supporting school leadership; stimulating positive school climates; strengthening the quality of teachers; ensuring effective classroom learning strategies; linking schools with parents and community.
Preparing students for the future
Policies to help prepare students for further education or the labour market
Upper secondary
Flexibility in choice; ensuring quality across programmes; strengthening the specific needs of the profession at this level; engaging communities, parents and the private sector; ensuring effective transitions into the labour market or further education.
VETMatching skills offered by VET programmes with labour market needs; adequate career guidance; quality of teachers; providing workplace training; tools for stakeholder engagement.
Tertiary education
Steering tertiary education; matching funding with priorities; assuring quality and equity; enhancing the role of tertiary education in research and innovation; strengthening links with the labour market; shaping internationalisation strategies.
Transitions Transitions across education pathways; links to the labour market.
Institutions: enhancing quality
School improvement
Policies to strengthen delivery of education in schools that can influence student achievement
Learning environmentsClass size; curriculum; instruction time; learning strategies; interactions in schools.
High quality teachersRecruitment, selection and induction; salary and working conditions; initial training; professional development opportunities and career paths.
School leadersAttracting, developing and retaining school principals in the profession; support and networks.
Evaluation and assessment
Policies to support measurement and improvement of school system’s outcomes
System evaluationEvaluation of the system as a whole and of sub-national education systems; programme and policy evaluation.
School evaluation Internal school evaluation; external school evaluations; school leadership.
Teacher appraisalProbationary periods; developmental appraisal; performance management; appraisal for accountability and improvement purposes.
Student assessment Formative assessments; summative assessments.
Evaluation and assessment frameworks
Co-ordinated arrangements: governance, configuration/architecture; competencies and skills; use of results; implementation strategies and factors.
Systems: governing effectively
GovernanceEnsuring effective planning, implementation and delivery of policies
Formal structuresType of government; organisation of education system; locus of decision making.
Setting objectives Definitions of national education goals or priorities.
Stakeholder process Relevant institutions and engagement with stakeholders.
Funding Policies to ensure effective and efficient investment in education systems
Economic resources in the education system
Public expenditure: GDP and share by education level.
Use of resources Time resources; human resources; material resources by education level.
Source: OECD (2015a), Education Policy Outlook 2015: Making Reforms Happen, http://dx.doi.org/10.1787/9789264225442-en.

E n s u r i n g a p p r o p r i a t e n a t i o n a l e d u c a t i o n s t r u c t u r e s a n d p o l i cy e nv i r o n m e n tChapter 2
74 © OECD 2017 EMPOWERING AND ENABLING TEACHERS TO IMPROVE EQUITY AND OUTCOMES FOR ALL
The first two expectations correspond to the common understanding of union advocacy. The other three are less explored, but evidence shows that it is these areas of activity that raise levels of teacher self-efficacy and confidence. While these are areas of fertile discussions with employers and governments, they also need more awareness and development.
Ontario and Alberta (Canada) provide good illustrations of how the involvement of the profession in policy design can lead to successful reforms (Box 2.14).
Box 2.14. Involving the profession in policy design
Special education and secondary school reform in Ontario (Canada)
In global terms, the Essential for Some, Good for All (ESGA) initiative in Ontario is a remarkable and unique systemic educational reform strategy. It took the often marginalised area of special education and created a change design that had an impact on the education of students and the work of teachers across the whole system. It steered change from the middle, instead of just supporting it from the bottom or driving it from the top, creating both internal coherence within the initiative as well as external coherence in relation to other reform initiatives.
In the Leading for All initiative, Ontario’s school board leaders and superintendents have been the dynamos behind the province’s special education strategy, Education for All, Kindergarten to Grade 6 (2005), and Learning for All, Kindergarten to Grade 12 (2013), generating the forces that have given it momentum and energy. This influential group of highly respected middle-level school-system administrators did not just deliver the reform, but also developed much of the reform strategy, which included processes of coaching, mentoring, cross-pollination and communication of key ideas.
The capacity and agency of this group was made possible, in large part, by a resourcing strategy of equal funding that incentivised participation by all 72 school boards, especially the many smaller boards. This built a critical mass of political and professional capital among directors and superintendents of education, acting as an influential and well-networked province-wide community. Their impact and success point to the power of collective, rather than individual, professional autonomy as a force for positive educational change.
School improvement in Alberta (Canada)
The Alberta Initiative for School Improvement (AISI) was an approach to improve student learning by encouraging teachers, parents and the community to work collaboratively to introduce innovative projects according to their local needs. The AISI was initiated in 1999 and ended in 2013. The platform allowed schools and districts to develop teachers’ professional capital in curriculum and pedagogical development through its process of collaborative inquiry. Teachers in 95% of schools have been involved in continuous inquiry as a routine part of their professional practice (Hargreaves and Shirley, 2012). The AISI was initiated and sustained through close partnership between the Alberta Teachers Association (ATA), the Alberta Government and other professional partners such as the Alberta School Boards Association. ATA includes school principals and district (local authority) superintendents as well as classroom teachers. In addition to the typical collective bargaining functions, the ATA spends around half of its overall budget on professional development, educational research and public advocacy for a stronger teaching profession, improved teaching and learning, and greater innovation. This compares to figures as low as 2%, for example, in teachers’ unions and associations in the United States.
Sources: Hargreaves, A., and H. Braun. (2011), Leading for All: A research report of the development, design, implementation and impact of Ontario’s “Essential for Some, Good for All” initiative; Alberta Report, Minister of Education; Hargreaves, A. and D. Shirley (2012), The Global Fourth Way: The Quest for Educational Excellence.
Dealing with the policy agenda
It is important to understand the political economy of reform, the trade-offs, and the fact that timelines for education reforms tend to differ from those of political cycles. The political costs of education reforms are often in the short term, due to conflicts of interests between groups with vested interests, while the benefits of those reforms only become apparent in the medium-to-long term. In decentralised systems, the alignment of political cycles at different levels and different views from many political actors may further complicate the process. It can be especially hard to keep the long-term perspective and continue aligning reforms and messages when the political context changes. In periods when

E n s u r i n g a p p r o p r i a t e n a t i o n a l e d u c a t i o n s t r u c t u r e s a n d p o l i cy e nv i r o n m e n t Chapter 2
75EMPOWERING AND ENABLING TEACHERS TO IMPROVE EQUITY AND OUTCOMES FOR ALL © OECD 2017
resources are very limited, it is even more important to make sure that schools can concentrate their efforts on what is most important. At the same time, the administrative leadership needs to think about how alignment, consistency and the long-term perspective can be reconciled with the needs of politicians to gain support for a policy agenda in the short term.
Evaluating impact
Many educational systems have weak traditions of evaluating programmes and reforms. Yet, data can be used to monitor student progress as well as the changes taking place in the school organisation. However, a recent review of education policies found that most school improvement programmes have not been evaluated in a way that satisfies rigorous scientific criteria, such as high-quality experimental and quasi-experimental study standards (OECD, 2015a). This is one of the challenges that policy makers face as they search for information on policy reforms with demonstrated impact to use or adapt for their own systems. In times of greater accountability combined with decentralisation, evidence of impact becomes more important, and policy makers are encouraged to include evaluation of impact from the beginning of policy design.
Common success factors, but no single model for success
Common success factors have been identified and can serve as guidance for policy makers when they are planning new school improvement programmes intended to change learning environments, schools and classrooms. At the same time, research shows that there is no single model for success and education systems can achieve results by combining policies and implementation approaches in different ways.
In-depth analysis and reflection should go into the planning and implementation activities of policies and reforms. Looking to other countries and their experiences of education policy implementation around the world can provide policy makers with guiding questions, as well as answers. Just as teaching must be evidence-based, policy making should build on the best evidence of what works. And just like teaching, policy making is many ways the science of adapting the knowledge base to local circumstances and opportunities.

E n s u r i n g a p p r o p r i a t e n a t i o n a l e d u c a t i o n s t r u c t u r e s a n d p o l i cy e nv i r o n m e n tChapter 2
76 © OECD 2017 EMPOWERING AND ENABLING TEACHERS TO IMPROVE EQUITY AND OUTCOMES FOR ALL
References
Bascia, N. (2008), “What teachers want from their unions: What the literature tells us”, in L. Weiner (Ed), The Global Assault on Teaching, Teachers and Their Unions, Palgrave Macmillan, New York, NY, pp. 95-108.
Burns, T. and F. Koster (eds.) (2016), Governing Education in a Complex World, Educational Research and Innovation, OECD Publishing, Paris, http://dx.doi.org/10.1787/9789264255364-en.
Caldwell, B.J. and J.M. Spinks (2013), The Self-Transforming School, Routledge, New York, NY.
Carpenter, H. et al. (2013), Evaluation of Pupil Premium: Research Report, TNS BMRM, TECIS, Centre for Equity in Education, University of Manchester and Newcastle University, www.gov.uk/government/uploads/system/uploads/attachment_data/file/243919/DFE-RR282.pdf.
Department of Education (United Kingdom) (2010), The Importance of Teaching: The Schools White Paper 2010, The Stationery Office, Norwich, United Kingdom.
Department of Education (United Kingdom) (2009), Results of Equality Impact Assessment: ‘Every School a Good School’: A Policy for School Improvement, April 2009, Department of Education, United Kingdom.
Dynarski, S., J. Hyman and D.W. Schanzenbach (2013), “Experimental evidence on the effect of childhood investments on postsecondary attainment and degree completion”, in Journal of Policy Analysis and Management, Association for Public Policy and Management, Washington, DC.
Fazekas, M. and T. Burns (2012), “Exploring the complex interaction between governance and knowledge in education”, OECD Education Working Papers, No. 67, OECD Publishing, Paris, http://dx.doi.org/10.1787/5k9flcx2l340-en.
Hargreaves, A. and H. Braun (eds) (2011), Leading for All, Council of Ontario Directors of Education (CODE), ON, and Boston College, MA.
Hargreaves, A. and D. Shirley (2012), The Global Fourth Way: The Quest for Educational Excellence, Corwin Press, Thousand Oaks, CA.
Hewitt de Alcántara, C. (1998), “Uses and abuses of the concept of governance”, International Social Science Journal, No. 155, Blackwell Publishers/UNESCO, pp. 105-113.
Nusche, D. et al. (2012), OECD Reviews of Evaluation and Assessment in Education: New Zealand 2011, OECD Reviews of Evaluation and Assessment in Education, OECD Publishing, Paris, http://dx.doi.org/10.1787/9789264116917-en.
Nusche, D., et al. (2011), OECD Reviews of Evaluation and Assessment in Education: Norway 2011, OECD Reviews of Evaluation and Assessment in Education, OECD Publishing, Paris, http://dx.doi.org/10.1787/9789264117006-en.
OECD (2016), Education Policy Outlook: Korea, OECD, Paris, www.oecd.org/edu/Education-Policy-Outlook-Korea.pdf.
OECD (2015a), Education Policy Outlook 2015: Making Reforms Happen, OECD Publishing, Paris, http://dx.doi.org/10.1787/ 9789264225442-en.
OECD (2014a), Education Policy Outlook: Germany, OECD, Paris, www.oecd.org/edu/EDUCATION%20POLICY%20OUTLOOK%20GERMANY_EN.pdf.
OECD (2014b), Improving Schools in Wales: An OECD Perspective, OECD, Paris, www.oecd.org/edu/Improving-schools-in-Wales.pdf.
OECD (2013a), PISA 2012 Results: What Makes Schools Successful? Resources, Policies and Practices (Volume IV), PISA, OECD Publishing, Paris, http://dx.doi.org/10.1787/9789264201156-en.
OECD (2013b), Innovative Learning Environments, Educational Research and Innovation, OECD Publishing, Paris, http://dx.doi.org/ 10.1787/9789264203488-en.
OECD (2011), Reviews of National Policies for Education: Improving Lower Secondary Schools in Norway 2011, OECD Publishing, Paris, http://dx.doi.org/10.1787/9789264114579-en.
OECD (2010), Improving Schools: Strategies for Action in Mexico, OECD Publishing, Paris, http://dx.doi.org/10.1787/9789264087040-en.
Santiago, P. et al. (2011), OECD Reviews of Evaluation and Assessment in Education: Australia 2011, OECD Publishing, Paris, http://dx.doi.org/10.1787/9789264116672-en.
Snyder, S. (2013), “The simple, the complicated, and the complex: educational reform through the lens of complexity theory”, OECD Education Working Papers, No. 96, OECD Publishing, Paris, http://dx.doi.org/10.1787/5k3txnpt1lnr-en.
Sutton Trust and Education Endowment Foundation (2015), The Pupil Premium: Next Steps, Sutton Trust and Education Endowment Foundation, London, www.suttontrust.com/wp-content/uploads/2015/06/Pupil-Premium-Summit-Report-FINAL-EDIT.pdf.

E n s u r i n g a p p r o p r i a t e n a t i o n a l e d u c a t i o n s t r u c t u r e s a n d p o l i cy e nv i r o n m e n t Chapter 2
77EMPOWERING AND ENABLING TEACHERS TO IMPROVE EQUITY AND OUTCOMES FOR ALL © OECD 2017
United Nations (UN) (2015), Transforming our world: the 2030 Agenda for Sustainable Development, Resolution adopted by the General Assembly on 25 September 2015, United Nations, New York NY, www.un.org/ga/search/view_doc.asp?symbol=A/RES/70/1&Lang=E.
World Bank (1994), Governance: The World Bank’s Experience, Development in practice, World Bank, Washington, DC.


79EMPOWERING AND ENABLING TEACHERS TO IMPROVE EQUITY AND OUTCOMES FOR ALL © OECD 2017
Chapter 3
STRIVING FOR SUSTAINABLE EXCELLENCE AND EQUITY IN LEARNING
High-quality education systems do well in both student performance and
equity. These systems have high standards for all students, but also put
in place measures to support students who are facing greater challenges.
Many countries achieve this winning combination of excellence and equity
by addressing factors known to hinder student performance, such as socio-
economic background, gender and immigrant status. Policies to minimise
the impact of these factors include providing good-quality early childhood
education and care, identifying students at risk of dropping out and offering
them additional support and alternative pathways (such as vocational
education and training), allocating additional resources to schools in deprived
areas, developing the capacity to integrate migrants from different cultural
backgrounds and overcome language barriers, and combating prejudices and
stereotypes that often influence the perceptions of boys and girls of their
abilities in certain fields and their future career expectations.
Note regarding IsraelThe statistical data for Israel are supplied by and under the responsibility of the relevant Israeli authorities. The use of such data by the OECD is without prejudice to the status of the Golan Heights, East Jerusalem and Israeli settlements in the West Bank under the terms of international law.

S t r i v i n g f o r s u s t a i n a b l e e x c e l l e n c e a n d e q u i t y i n l e a r n i n gChapter 3
80 © OECD 2017 EMPOWERING AND ENABLING TEACHERS TO IMPROVE EQUITY AND OUTCOMES FOR ALL
MANY COMMON CHALLENGES, INCLUDING SUPPORT FOR SCHOOLS IN AREAS OF DEPRIVATIONAs they seek to enhance system performance and equity, countries have focused their efforts on many educational levels and areas. This section explores some of the most promising areas of intervention, such as strengthening participation and the quality of provision in early childhood education and care (ECEC), enhancing performance at the end of compulsory education by supporting students from low socio-economic backgrounds, fostering gender equality, supporting students of immigrant background and tackling dropout in secondary education.
Starting strong with high-quality early childhood education and care
One of the most effective ways to compensate for the factors that may hinder student performance (such as socio-economic background and immigrant status) is to provide access to early childhood education and care. Since young children are able to learn much more than previously assumed, education and support provided during the early years may compensate, at least partly, for deficiencies in stimulation at home or barriers such as language.
Students who have attended at least a year of pre-primary education perform better at age 15, even accounting for socio-economic background. Most OECD countries have therefore made an effort to increase enrolment rates before the age of 5.
From 2005 to 2014 in OECD countries, enrolment in early childhood education rose from 73% to 85% for 4-year-olds, and from 54% to 69% for 3-year-olds (OECD, 2016a and Figure 3.1). Provision of early childhood education and care for children under age 3 is less extensive, and in some countries, demand greatly outstrips supply. Fewer than four out of ten 2-year-olds (36%) are enrolled in early childhood education across OECD countries (OECD, 2016a).
Figure 3.1Enrolment rates at age 3 and 4 in early childhood and primary education (2014)
Countries are ranked in descending order of the enrolment rates of 3-year-olds in pre-primary programmes.Source: OECD. Table C2.1. See Annex 3 for notes (www.oecd.org/education/education-at-a-glance-19991487.htm).1 2 http://dx.doi.org/10.1787/888933398347
100
90
80
70
60
50
40
30
20
10
0
%
Fran
ce
Bel
gium
Isra
el
Spai
n
No
rway
Ger
man
y
Swed
en
Ital
y
Den
mar
k
Ko
rea
New
Zea
land
Latv
ia
Uni
ted
Kin
gdo
m
Slov
enia
Jap
an
Net
herl
and
s
Hun
gary
Rus
sian
Fed
erat
ion
Lith
uani
a
Port
ugal
EU22
ave
rage
Luxe
mb
our
g
OEC
D a
vera
ge
Cze
ch R
epub
lic
Finl
and
Slov
ak R
epub
lic
Aus
tria
Pola
nd
Chi
le
Irel
and
Uni
ted
Sta
tes
Mex
ico
Aus
tral
ia
Bra
zil
Turk
ey
Swit
zerl
and
Co
sta
Ric
a
Gre
ece
Enrolment rates at age 4 (ISCED 02 + ISCED 1)Enrolment rates at age 3 in pre-primary education (ISCED 02)Enrolment rates at age 3 in early childhood educational programmes (ISCED 01)
While provision has increased, countries face challenges in broadening and securing coverage for all young children. Furthermore, evidence suggests that to reap longer-term benefits in terms of child development, systems should target the quality and training levels of staff and set goals that focus on children’s cognitive and social skills (OECD, 2012a; OECD, 2006).
To respond to these challenges, many countries are adopting policy options to expand or consolidate the provision and quality delivery of ECEC. OECD countries have introduced comprehensive policies encompassing broad general strategies and structures, content-related policies which aim to strengthen the curriculum, and targeted policies which focus on assessment (Table 3.1).

S t r i v i n g f o r s u s t a i n a b l e e x c e l l e n c e a n d e q u i t y i n l e a r n i n g Chapter 3
81EMPOWERING AND ENABLING TEACHERS TO IMPROVE EQUITY AND OUTCOMES FOR ALL © OECD 2017
Launching comprehensive ECEC strategies
Most countries that have taken measures in ECEC have done so through broad strategies to enhance this level of education, to either increase or ensure availability and quality delivery, for example:
• Australia has been active in ECEC. With the National Early Childhood Development Strategy (2009), it undertook a comprehensive reform to provide both universal coverage and specific care to the most disadvantaged. It set six priority areas regarding health, safety, early learning and well-being and also introduced several initiatives at local and national levels to improve equity, inclusion and community engagement. In addition, a new National Partnership Agreement on Universal Access to Early Childhood Education (2013-14) was put in place to ensure access to quality ECEC programmes in the 12 months prior to full-time schooling, to be delivered by degree-qualified early childhood teachers.
• Canada set out a pan-Canadian vision for early learning as a framework for ECEC across its jurisdictions, with the Council of Ministers of Education’s Early Learning and Development Framework (2014). It contains key guiding principles and aims to support the development of policies and initiatives to enhance learning in the early years and beyond.
• Poland has targeted coverage and access. An amendment to the School Education Act (2011) made attendance in pre-primary education compulsory for 5-year-olds in 2011, and granted all 4-year-olds and 3-year-olds a right to participate from 2015 and 2017 respectively. Amendments to the School Education Act (2013) also introduced a limit to the fees paid by parents, with earmarked grants from the state to local governments compensating the difference in cost.
• Turkey is making efforts to increase access and coverage for preschool students through the Preschool Education Project (2010-13) and Law No. 29072 (2014). The legislation aims to fulfil the needs of preschool students by: establishing clubs to support children’s social and personal development, if requested by parents and where conditions permit; enabling access to preschool institutions during the summer, especially for those who cannot attend during the regular educational term; and opening free mobile classes, particularly for disadvantaged students in rural areas.
Table 3.1Policies to consolidate early childhood education and care (2008-14)
Comprehensive policies Content Targeted policies
General strategy and structure Curriculum Assessment
Australia: National Early Childhood Development Strategy (2009); National Quality Framework for Early Childhood Education and Care (2012); National Partnership Agreement on Universal Access to Early Childhood Education (2013-14)
Austria: Free compulsory year of pre-primary education (2010)
Canada: CMEC Early Learning and Development Framework (2014)
Estonia: Amendments to the Pre-school Act of 2000 (2010)
Finland: ECEC administration moved from Ministry of Social Affairs to Education (2013)
Germany: Legal entitlement to an ECEC place to children age 1 and 2 (2013)
Korea: After-school childcare for 3-5 year-olds (2013)
New Zealand: An Early Learning Taskforce (2013)
Norway: Legal right for a place in ECEC from age 1 (2009)
Poland: Amendments to the School Education Act (2011, 2013)
Slovenia: Kindergarten Act (2008, 2010); Childcare fees benefits within the Exercise of Rights to Public Funds Act (2008, 2012)
Turkey: Pre-school Education Project (2010-13); Law No. 29072 (2014)
United States: Preschool Development Grants (2013)
Czech Republic: Innovation of the Framework Educational Programme of Pre-primary education (2012)
Finland: Curriculum for pre-primary education (2010)
Italy: National Curriculum for ECEC (2012)
Korea: Nuri curriculum (2012)
Australia: Australian Early Development Index (2009)
Denmark: Mandatory assessment of language development (2010)
Portugal: Evaluation and monitoring guidelines for pre-school education (2011)
Source: OECD (2015a), Education Policy Outlook 2015: Making Reforms Happen, http://dx.doi.org/10.1787/9789264225442-en.

S t r i v i n g f o r s u s t a i n a b l e e x c e l l e n c e a n d e q u i t y i n l e a r n i n gChapter 3
82 © OECD 2017 EMPOWERING AND ENABLING TEACHERS TO IMPROVE EQUITY AND OUTCOMES FOR ALL
Identifying learning needs in ECEC through assessmentAssessment of ECEC aims to enhance and support children’s early learning, identify their learning needs and improve the overall quality of ECEC. A recent survey by the OECD ECEC project found that most of the 25 jurisdictions surveyed monitor or assess early child development in some form (OECD, forthcoming). Both Australia and Denmark have recently introduced assessment policies:
• Australia implemented the Early Development Census (2009), which provides a snapshot of children’s development every three years, to give local institutions the opportunity to use these data and then engage with their communities to develop action plans. National data about health, maturity, social competence, knowledge and language have already been collected three times (in 2009, 2012 and 2015) among more than 96.5% of Australian children in their first year of schooling (Australian Early Development Census, 2015).
• Denmark introduced a mandatory assessment of language development (2010) for all 3-year-olds to diagnose possible language problems before children start school, and offers mandatory support for parents (OECD, 2015a).
Enhancing performance at the end of compulsory education
Education systems can achieve both high performance and greater equity; the two outcomes are not mutually exclusive. In this light, success in education can be defined as a combination of high levels of achievement and high levels of equity, as illustrated by Figure 3.2.
Figure 3.2Mean performance in science and strength of the socio-economic gradient
Notes: The correlation between a country’s/economy’s mean science score and the strength of the socio-economic gradient is 0.17.Only countries and economies with available data are shown.Source: OECD, PISA 2015 Database, Table I.6.3a.1 2 http://dx.doi.org/10.1787/888933432747
Meansciencescore
30 20 10 025 15 5
600
550
500
450
400
350
300
Percentage of variation in performance explained by social-economic status
Greater Equity
Above-average science performance Below-average equity in education
Above-average science performance Above-average equity in education
Below-average science performance Below-average equity in education
Below-average science performance Above-average equity in education
Strength of the relationship between performance and socio-economic status is above the OECD average
Strength of the relationship between performance and socio-economic status is not statistically different from the OECD averageStrength of the relationship between performance and socio-economic status is below the OECD average
Iceland
Switzerland
Germany
Sweden
Tunisia
Jordan
Thailand
Korea
Italy
Portugal
Peru
Denmark
Latvia
Israel
Greece
Russia
Croatia
Hungary
Chile
Spain
Slovak Republic
Luxembourg
France
Indonesia
Lebanon
GeorgiaColombia
Brazil
FYROM Kosovo
TurkeyMexico Qatar
Belgium
Macao(China)
Uruguay
Algeria
Bulgaria
Costa Rica
Romania
Slovenia
Poland Norway
Lithuania
Moldova
Japan FinlandEstonia
Canada
Malta
United Arab EmiratesTrinidad
and Tobago
Czech Republic United Kingdom
Montenegro
Hong Kong (China)B-S-J-G (China)
CABA (Argentina)
Chinese Taipei
Dominican Republic
Viet Nam
Singapore
OECD average
OEC
D a
vera
ge1. Australia2. Ireland3. Netherlands4. New Zealand5. United States
Austria
4 123
5

S t r i v i n g f o r s u s t a i n a b l e e x c e l l e n c e a n d e q u i t y i n l e a r n i n g Chapter 3
83EMPOWERING AND ENABLING TEACHERS TO IMPROVE EQUITY AND OUTCOMES FOR ALL © OECD 2017
Looking at performance and equity simultaneously also helps avoid the risk of misinterpreting low variability in student achievement as a sign of equity. Equity is about success for students from all social backgrounds; widespread low achievement should never be taken as a desirable outcome. Likewise, an education system where levels of achievement and variability are both high and where such variation is only weakly related to social background arguably does better than a system where most students do poorly and variability is low. Equitable education systems are those where inclusion and fairness in education and high levels of performance do not come at the expense of one another.
Equity in education is defined by PISA as providing all students, regardless of gender, family background or socio-economic status, with high-quality opportunities to benefit from education (OECD, 2016b). Defined in this way, equity does not imply that everyone should achieve the same results or that every student should be exposed to identical, one-size-fits-all approaches to teaching and learning. Rather, it refers to creating the conditions for minimising any adverse impacts of students’ personal, social or economic circumstances on their performance.
Supporting students from low socio-economic background
The effects of socio-economic status on student achievement have been widely documented, and research has shed light on specific mechanisms linking economic, social and cultural assets in the family context to students’ education outcomes (e.g. Bianchi et al., 2004; Feinstein, Duchworth and Sabates, 2008; Jæger and Breen, 2016). For example, students whose parents have higher levels of education and more prestigious and better-paid jobs typically benefit from a wider range of financial resources (e.g. private tutoring, computers, books), cultural resources (e.g. extended vocabulary, time in active parenting) and social resources (e.g. role models and networks) that make it easier for them to succeed in school, compared to peers whose families have lower levels of education or are affected by chronic unemployment, low-paid jobs or poverty.
In all high-performing countries except Belgium, the proportion of students performing below proficiency Level 2 in science on PISA 2015 is below the OECD average. This means that the large majority of high-performing systems also achieve high levels of inclusion: they succeed in ensuring greater participation in education among 15-year-olds and in reducing the number of students who perform poorly.
Indicators of fairness in educational opportunities confirm that high levels of equity and achievement need not be mutually exclusive. In 10 of the 24 high-performing systems in PISA 2015, the strength of the relationship between performance and socio-economic status is weaker than the OECD average, and in another 9 systems it is not significantly different from the average. Thus, among the most successful countries and economies in mean achievement, socio-economic disadvantage tends to play a relatively minor role in explaining variation in student performance.
On average across OECD countries, students’ socio-economic status explains a significant share of the variation in their performance in the core subjects assessed in PISA 2015. For science, 12.9% of the variation in student performance within each country is associated with socio-economic status. In 15 countries and economies, the strength of the socio-economic gradient is above average, and students’ socio-economic status explains more than 15% of the variation in performance; in Ciudad Autónoma de Buenos Aires (Argentina) (hereafter “CABA [Argentina]”), France, Hungary, Luxembourg and Peru, it accounts for more than 20% of this variability. By contrast, the strength of the gradient remains below the OECD average in 26 countries; in OECD countries Canada, Estonia, Iceland, Italy, Latvia, Norway and Turkey, students’ socio-economic status explains less than 10% of the variation in their performance in science (OECD, 2016b, Table I.6.3a). Similar results are observed for other domains of assessment where, on average across OECD countries, socio-economic status accounts for 11.9% of the variation in reading performance and 13.0% of the variation in mathematics performance (OECD, 2016b, Tables I.6.3b and I.6.3c).
On average across OECD countries, advantaged students (those in the top quarter of the distribution on the PISA index of economic, social and cultural status within their countries/economies) score 88 points higher in science than disadvantaged students – those in the bottom quarter of the distribution. In Beijing-Shanghai-Jiangsu-Guangdong (China) (hereafter “B-S-J-G [China]”), France, Hungary and Luxembourg, the gap between the two groups of students is largest: 115 score points or more. Among OECD countries, this difference is smallest in Estonia, Iceland, Latvia, Mexico and Turkey, where it ranges between 50 and 70 score points.
While socio-economic status remains a strong predictor of performance in many countries, another consistent finding from PISA is that good-quality educations systems manage to raise the performance of all students. Many disadvantaged students succeed in attaining high levels of performance, not only within their own countries/economies, but also when considered globally.

S t r i v i n g f o r s u s t a i n a b l e e x c e l l e n c e a n d e q u i t y i n l e a r n i n gChapter 3
84 © OECD 2017 EMPOWERING AND ENABLING TEACHERS TO IMPROVE EQUITY AND OUTCOMES FOR ALL
Figure 3.3Mean performance in science, by international decile on the PISA index of economic,
social and cultural status
1. ESCS refers to the PISA index of economic, social and cultural status.Notes: International deciles refer to the distribution of the PISA index of economic, social and cultural status across all countries and economies.Only countries and economies with available data are shown.Countries and economies are ranked in descending order of the mean science performance of students in the middle decile of the PISA index of economic, social and cultural status.Source: OECD, PISA 2015 Database, Table I.6.4a.1 2 http://dx.doi.org/10.1787/888933432757
Mean score200 250 350300 400 450 500 550 600 650
Viet NamMacao (China)
B-S-J-G (China)Japan
SingaporeHong Kong (China)
Chinese TaipeiEstoniaFinland
KoreaPortugal
GermanyCanadaPoland
SpainUnited Kingdom
LatviaSlovenia
SwitzerlandAustralia
New ZealandIreland
Czech RepublicDenmarkHungary
OECD averageNetherlands
FranceItaly
BelgiumNorwaySwedenAustriaRussia
United StatesCroatia
LithuaniaCABA (Argentina)
Slovak RepublicChile
LuxembourgIceland
MaltaUruguayGreece
RomaniaIsrael
TurkeyIndonesiaMoldova
MexicoThailandBulgaria
ColombiaCosta Rica
Trinidad and TobagoPeru
JordanMontenegro
United Arab EmiratesBrazil
GeorgiaTunisia
LebanonFYROMAlgeria
QatarKosovo
Dominican Republic
7622528
112612526
2872
16315
255845593
161249
1571355
111012188
27141
133913206
5974285355134338145021113
4319392713523
1040
298
1127121423339
24394813203511253135293116532227281824344539262432172439221834572613269
2941788
288
14189
13174214121510184
48197
Percentage of students in the bottom decile of the international ESCS index
Percentage of students in the top decile of the international ESCS1 index
A
B
Bottom decileMiddle decileTop decile
Ninth decileSecond decile
BA

S t r i v i n g f o r s u s t a i n a b l e e x c e l l e n c e a n d e q u i t y i n l e a r n i n g Chapter 3
85EMPOWERING AND ENABLING TEACHERS TO IMPROVE EQUITY AND OUTCOMES FOR ALL © OECD 2017
Figure 3.3 shows performance differences by international deciles of the PISA index of social, economic and cultural status – that is, by placing students on the same scale and allowing a comparison of the performance of student groups from similar socio-economic contexts across countries and economies. When the performance of student groups from similar socio-economic contexts across countries/economies is compared, this analysis reveals, for instance, that in Estonia and Macao (China), students facing the greatest disadvantage (i.e. those in the bottom two deciles of the distribution of the ESCS index internationally) have average scores over 500 points in the science assessment, significantly above the OECD mean score of 493 points, which reflects the performance of students from all socio-economic backgrounds. Such a high level of achievement also means that these disadvantaged students in Estonia and Macao (China), and also in Hong Kong (China), Japan and Viet Nam, outperform the most advantaged students (i.e. those in the top two deciles of the distribution of the ESCS index internationally) in more than 20 other countries and economies participating in PISA.
Further evidence that higher levels of equity and performance need not be at odds comes from the finding that many disadvantaged students, schools and school systems achieve better performance in PISA than predicted by their socio-economic status. As such, they are considered to be “resilient”. In PISA, a student is classified as resilient if he or she is in the bottom quarter of the PISA index of economic, social and cultural status in the country of assessment and yet performs in the top quarter of students among all countries, after taking socio-economic status into account (Figure 3.4).
On average across OECD countries, 29.2% of disadvantaged students in PISA 2015 beat the odds against them and scored among the top quarter of students in all participating countries, after accounting for socio-economic status. In B-S-J-G (China), Estonia, Finland, Hong Kong (China), Japan, Korea, Macao (China), Singapore, Chinese Taipei and Viet Nam, more than four in ten disadvantaged students are considered to be resilient, although low coverage rates in B-S-J-G (China) and Viet Nam likely mean that the most disadvantaged 15 year-olds in these countries are not represented in these results. By contrast, fewer than one in ten disadvantaged students in Algeria, Brazil, Costa Rica, the Dominican Republic, the Former Yugoslav Republic of Macedonia (hereafter “FYROM”), Georgia, Jordan, Kosovo, Lebanon, Montenegro, Peru, Qatar, Tunisia and the United Arab Emirates are top performers in science after taking socio-economic status into account.
A potential source of inequity in learning opportunities and outcomes lies in the distribution of resources across students and schools.
PISA 2015 provides two summary measures of the availability of educational resources at the school level: the index of shortage of educational material and the index of shortage of educational staff. Both indices combine school principals’ responses to questions about whether their school’s capacity to provide instruction is hindered by a shortage or inadequacy of either material resources (e.g. textbooks, IT equipment, laboratory material, or physical infrastructure) or human resources (including both teaching and assisting staff). A positive relationship between the socio-economic profile of schools and the quantity or quality of resources means that advantaged schools benefit from more or better resources. A negative relationship implies that more or better resources are devoted to disadvantaged schools. No relationship between the two implies that schools attended by disadvantaged students are as likely to have access to better or more resources as schools attended by advantaged students (Figure 3.5).
These results suggest that, in a large number of countries, access to educational resources at the school level is unequally distributed between students with the highest and lowest socio-economic status within each country/economy. According to school principals’ reports, in 31 countries/economies, students in advantaged schools have access to better educational material resources than their peers in disadvantaged schools, while in 36 countries/economies, students in advantaged schools have greater access to education staff than do disadvantaged students. The largest disparities in the perceived quality of material resources between schools with different socio-economic profiles are observed in CABA (Argentina), Lebanon, Macao (China), Mexico, Peru and the United Arab Emirates. By contrast, in FYROM, Iceland and Latvia, 15-year-olds attending disadvantaged schools enjoy greater access to educational resources than their peers in advantaged schools. And in about half of the countries/economies that participated in PISA 2015, students in disadvantaged schools appear no more likely than students in advantaged schools to have access to better or more resources. The relationship between access to educational resources and student performance is analysed in Chapter 6 of PISA 2015 Results (Volume II): Policies and Practices for Successful Schools (OECD, 2016c).
TALIS 2013 (OECD, 2014a) also examined the distribution of teachers by their level of educational attainment (categorised as ISCED level 5A and above and ISCED level 5B and below) and their experience as teachers, separating more experienced teachers (those with more than five years teaching) from their less-experienced colleagues (five years or less of teaching experience).

S t r i v i n g f o r s u s t a i n a b l e e x c e l l e n c e a n d e q u i t y i n l e a r n i n gChapter 3
86 © OECD 2017 EMPOWERING AND ENABLING TEACHERS TO IMPROVE EQUITY AND OUTCOMES FOR ALL
Figure 3.4Percentage of resilient students1
1. A student is classified as resilient if he or she is in the bottom quarter of the PISA index of economic, social and cultural status (ESCS) in the country/economy of assessment and performs in the top quarter of students among all countries/economies, after accounting for socio-economic status.Countries and economies are ranked in descending order of the percentage of resilient students.Source: OECD, PISA 2015 Database, Table I.6.7.1 2 http://dx.doi.org/10.1787/888933432786
Viet NamMacao (China)
Hong Kong (China)Singapore
JapanEstonia
Chinese TaipeiB-S-J-G (China)
FinlandKoreaSpain
CanadaPortugal
United KingdomLatvia
SloveniaPoland
GermanyAustralia
United StatesNetherlands
New ZealandIreland
OECD averageSwitzerland
DenmarkBelgium
FranceItaly
NorwayAustriaRussia
Czech RepublicSwedenCroatia
LithuaniaTurkeyMalta
LuxembourgHungaryThailand
GreeceSlovak Republic
IcelandIsrael
CABA (Argentina)Chile
UruguayBulgaria
MoldovaTrinidad and Tobago
MexicoColombiaRomania
IndonesiaCosta Rica
BrazilMontenegro
United Arab EmiratesJordan
GeorgiaAlgeria
LebanonQatar
TunisiaFYROM
PeruKosovo
Dominican Republic
%0 10 20 30 40 50 60 70 80

S t r i v i n g f o r s u s t a i n a b l e e x c e l l e n c e a n d e q u i t y i n l e a r n i n g Chapter 3
87EMPOWERING AND ENABLING TEACHERS TO IMPROVE EQUITY AND OUTCOMES FOR ALL © OECD 2017
Figure 3.5Differences in educational resources between advantaged and disadvantaged schools
1. The index of shortage of educational material is measured by an index summarising school principals’ agreement with four statements about whether the school’s capacity to provide instruction is hindered by a lack of and/or inadequate educational materials, including physical infrastructure.2. The index of shortage of educational staff is measured by an index summarising school principals’ agreement with four statements about whether the school’s capacity to provide instruction is hindered by a lack and/or inadequate qualifications of the school staff.Note: Statistically significant differences between advantaged and disadvantaged schools are marked in a darker tone (see Annex A3).Countries and economies are ranked in ascending order of the difference in index of shortage of educational material between advantaged and disadvantaged schools.Source: OECD, PISA 2015 Database, Table I.6.13.1 2 http://dx.doi.org/10.1787/888933432823
CABA (Argentina)Mexico
PeruMacao (China)
United Arab EmiratesLebanon
JordanColombia
BrazilIndonesia
TurkeySpain
Dominican RepublicGeorgiaUruguayThailand
B-S-J-G (China)Australia
JapanChile
LuxembourgRussia
PortugalMalta
ItalyNew Zealand
CroatiaIrelandAlgeria
NorwayIsrael
DenmarkSweden
United StatesMoldovaBelgiumSlovenia
OECD averageHungary
Chinese TaipeiViet Nam
Czech RepublicSingapore
TunisiaGreece
Trinidad and TobagoCanada
RomaniaQatar
MontenegroKosovo
NetherlandsKorea
FinlandSwitzerland
GermanyHong Kong (China)
AustriaFYROMPoland
AlbaniaBulgaria
Slovak RepublicLithuania
EstoniaIceland
Costa RicaUnited Kingdom
Latvia
CABA (Argentina)MexicoPeruMacao (China)United Arab EmiratesLebanonJordanColombiaBrazilIndonesiaTurkeySpainDominican RepublicGeorgiaUruguayThailandB-S-J-G (China)AustraliaJapanChileLuxembourgRussiaPortugalMaltaItalyNew ZealandCroatiaIrelandAlgeriaNorwayIsraelDenmarkSwedenUnited StatesMoldovaBelgiumSloveniaOECD averageHungaryChinese TaipeiViet NamCzech RepublicSingaporeTunisiaGreeceTrinidad and TobagoCanadaRomaniaQatarMontenegroKosovoNetherlandsKoreaFinlandSwitzerlandGermanyHong Kong (China)AustriaFYROMPolandAlbaniaBulgariaSlovak RepublicLithuaniaEstoniaIcelandCosta RicaUnited KingdomLatvia
Index of shortage of educational material1 Index of shortage of educational staff 2
Difference between advantaged and disadvantaged schools
-2.0 -1.5 -1.0 -0.5 0.0 0.5
Disadvantaged schools have fewer resources than advantaged schools
Advantaged schools have fewer resources than disadvantaged schools

S t r i v i n g f o r s u s t a i n a b l e e x c e l l e n c e a n d e q u i t y i n l e a r n i n gChapter 3
88 © OECD 2017 EMPOWERING AND ENABLING TEACHERS TO IMPROVE EQUITY AND OUTCOMES FOR ALL
The data show considerable variation between countries in the proportion of experienced teachers who work in more challenging schools. In countries and economies found at the top of Figure 3.6 (those with positive differences), experienced teachers are more likely to be working in more challenging schools than in less challenging schools. This is the case for Brazil, Korea and Croatia. For a majority of countries, however, the opposite is true and a larger proportion of more experienced teachers teach in less challenging schools than in more challenging schools. This is the case in Flanders (Belgium), Sweden and Alberta (Canada). How to ensure that teachers with the most experience and qualifications are teaching where they are most needed is an important policy consideration.
Figure 3.6Schools with more than 30% of students from socio-economically disadvantaged homes
BrazilKorea
CroatiaNetherlands
ChileLatvia
MexicoPortugal
ItalySerbiaFrance
BulgariaAbu Dhabi (UAE)Slovak Republic
PolandMalaysia
SpainAverageAustralia
SingaporeEstonia
JapanEngland (UK)
IsraelRomania
Alberta (Canada)Sweden
Flanders (Belgium)
Difference in the proportion of teachers withmore than 5 years teaching experience who work in
more challenging schools and those who do not
-15 1050-5-10
Percentage of teachers working in more
challenging schools
4087
1255184448107
4524111018581420266
116
244628201016
TRENDS IN EQUITY IN EDUCATIONTrends in equity also shed light on the dynamics at play in education systems. In 2006, on average across OECD countries, 14.4% of the variation in students’ science performance could be explained by students’ socio-economic status (the strength of the socio-economic gradient). By 2015, the degree to which students’ socio-economic status predicted performance in science decreased to 12.9%, a drop of 1.4 percentage points (Figure 3.7).
When we look at the same time at change between 2006 and 2015 in the slope of the socio-economic gradient and the trends in science performance, in Chile, Denmark, Mexico, Slovenia, Turkey, the United Kingdom and the United States, the average impact of students’ socio-economic status on performance weakened by more than 4 score points, while mean science achievement did not decline. In these countries, average differences in performance between students with different socio-economic status declined as overall performance remained stable.
The largest reduction in the average impact of socio-economic status on science performance (13 score points) is observed in the United States where the percentage of variation explained by students’ socio-economic status also decreased by 6 percentage points between 2006 and 2015, and where the percentage of students performing below Level 2 shrank from 24.4% to 20.3%, while the percentage of resilient students grew from 25.0% to 31.6% over the period. This progress occurred in the context of deliberate efforts to support disadvantaged students in the United States. Box 3.1 showcases the initiatives taken by the United States to tackle equity and diversity.
It is also worth noting that Colombia, Israel, Macao (China), Portugal and Romania managed to improve their average science performance while maintaining equity levels.
Source: OECD, TALIS 2013 Database, Table 2.11.1 2 http://dx.doi.org/10.1787/888933041174

S t r i v i n g f o r s u s t a i n a b l e e x c e l l e n c e a n d e q u i t y i n l e a r n i n g Chapter 3
89EMPOWERING AND ENABLING TEACHERS TO IMPROVE EQUITY AND OUTCOMES FOR ALL © OECD 2017
Box 3.1. Promoting equity and diversity in the United States
The United States has made significant progress in promoting equity and diversity in the country’s education system. The high school graduation rate sits at a record high of 83%, with gaps closing between African-American students, Latino students and Native American students and their white and Asian peers, and more students with disabilities earning high school diplomas. Federal initiatives like the School Improvement Grants, My Brother’s Keeper, and the Federal TRIO Programs all seek to improve access and equity for disadvantaged groups of students.
The Every Student Succeeds Act (ESSA), a new bipartisan law, reauthorises the original Elementary and Secondary Education Act signed by President Lyndon Johnson in 1965, and builds upon the efforts the United States is making to improve equity for all students. ESSA, like its predecessor, is at its core a Civil Rights Law, working to advance equity by upholding critical protections for disadvantaged and high-needs students; promoting high academic standards for all students; sustaining investments in and expanding access to high-quality preschool; and requiring accountability for the lowest-performing schools, where groups of students are not making progress, and where graduation rates are low over extended periods of time.
The U.S. Department of Education is working with states to implement the new legislation. Under ESSA, states will establish new accountability systems that will include additional indicators of success that reflect a broader picture of how schools are serving all children.
Source: US Department of Education, www.ed.gov.
Figure 3.7Change between 2006 and 2015 in the slope of the socio-economic gradient
and average 3-year trend in science performance
Notes: Only countries and economies with available data are shown. Changes in both equity and performance between 2006 and 2015 that are statistically significant are indicated in a darker tone (see Annex A3). The average three-year trend is the average rate of change, per three-year period, between the earliest available measurement in PISA and PISA 2015. For countries and economies with more than one available measurement, the average three-year trend is calculated with a linear regression model. This model takes into account that Costa Rica, Georgia, Malta and Moldova conducted the PISA 2009 assessment in 2010 as part of PISA 2009+. Source: OECD, PISA 2015 Database, Table I.6.17.1 2 http://dx.doi.org/10.1787/888933432855
Cha
nge
in th
e sc
ore-
poin
t diff
eren
ce in
sci
ence
per
form
ance
ass
ocia
ted
with
one-
unit
incr
ease
on
the
PISA
ind
ex o
f eco
nom
ic, s
ocia
l and
cul
tura
l sta
tus
(201
5 -
2006
)
-15 15 2520100 5-5-10
-15
-10
-5
0
5
10
15
Average 3-year trend in science performance (score-point difference)
Performance deteriorated Performance improved
Equity im
pro
vedEq
uity deterio
rated
Korea
Portugal
Denmark
Israel
Greece
Croatia
Hungary
Chile
Spain
Slovak Republic
NetherlandsAustralia
New Zealand
France
Indonesia
Colombia
Turkey
Italy
Mexico
Qatar
Belgium
Macao (China)
Uruguay
Bulgaria
Romania
Slovenia
PolandAustria
Estonia
Norway
Lithuania
Sweden
Iceland
Japan
Finland
Latvia
CanadaCzech Republic
United States
United Kingdom
Luxembourg
Thailand
Hong Kong (China)
Germany
OECD average
1. Chinese Taipei2. Ireland3. Jordan 4. Montenegro5. Russia6. Switzerland7. Tunisia
4
12
35
67
Brazil
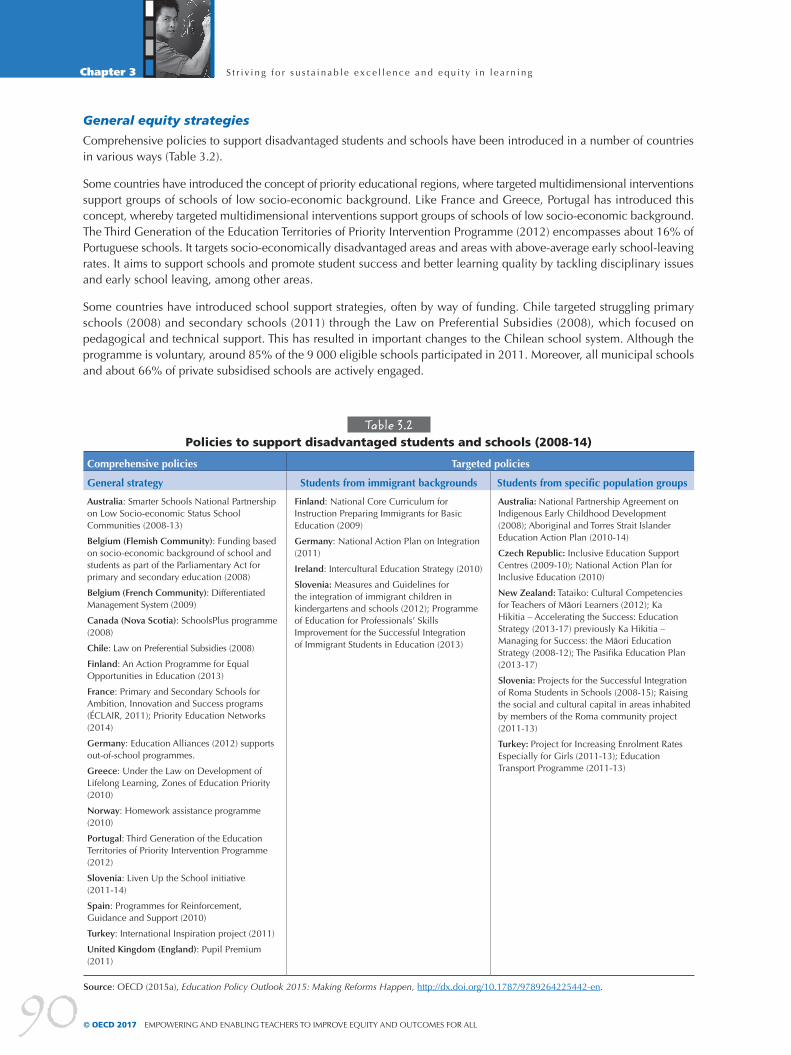
S t r i v i n g f o r s u s t a i n a b l e e x c e l l e n c e a n d e q u i t y i n l e a r n i n gChapter 3
90 © OECD 2017 EMPOWERING AND ENABLING TEACHERS TO IMPROVE EQUITY AND OUTCOMES FOR ALL
General equity strategies
Comprehensive policies to support disadvantaged students and schools have been introduced in a number of countries in various ways (Table 3.2).
Some countries have introduced the concept of priority educational regions, where targeted multidimensional interventions support groups of schools of low socio-economic background. Like France and Greece, Portugal has introduced this concept, whereby targeted multidimensional interventions support groups of schools of low socio-economic background. The Third Generation of the Education Territories of Priority Intervention Programme (2012) encompasses about 16% of Portuguese schools. It targets socio-economically disadvantaged areas and areas with above-average early school-leaving rates. It aims to support schools and promote student success and better learning quality by tackling disciplinary issues and early school leaving, among other areas.
Some countries have introduced school support strategies, often by way of funding. Chile targeted struggling primary schools (2008) and secondary schools (2011) through the Law on Preferential Subsidies (2008), which focused on pedagogical and technical support. This has resulted in important changes to the Chilean school system. Although the programme is voluntary, around 85% of the 9 000 eligible schools participated in 2011. Moreover, all municipal schools and about 66% of private subsidised schools are actively engaged.
Table 3.2Policies to support disadvantaged students and schools (2008-14)
Comprehensive policies Targeted policies
General strategy Students from immigrant backgrounds Students from specific population groups
Australia: Smarter Schools National Partnership on Low Socio-economic Status School Communities (2008-13)
Belgium (Flemish Community): Funding based on socio-economic background of school and students as part of the Parliamentary Act for primary and secondary education (2008)
Belgium (French Community): Differentiated Management System (2009)
Canada (Nova Scotia): SchoolsPlus programme (2008)
Chile: Law on Preferential Subsidies (2008)
Finland: An Action Programme for Equal Opportunities in Education (2013)
France: Primary and Secondary Schools for Ambition, Innovation and Success programs (ÉCLAIR, 2011); Priority Education Networks (2014)
Germany: Education Alliances (2012) supports out-of-school programmes.
Greece: Under the Law on Development of Lifelong Learning, Zones of Education Priority (2010)
Norway: Homework assistance programme (2010)
Portugal: Third Generation of the Education Territories of Priority Intervention Programme (2012)
Slovenia: Liven Up the School initiative (2011-14)
Spain: Programmes for Reinforcement, Guidance and Support (2010)
Turkey: International Inspiration project (2011)
United Kingdom (England): Pupil Premium (2011)
Finland: National Core Curriculum for Instruction Preparing Immigrants for Basic Education (2009)
Germany: National Action Plan on Integration (2011)
Ireland: Intercultural Education Strategy (2010)
Slovenia: Measures and Guidelines for the integration of immigrant children in kindergartens and schools (2012); Programme of Education for Professionals’ Skills Improvement for the Successful Integration of Immigrant Students in Education (2013)
Australia: National Partnership Agreement on Indigenous Early Childhood Development (2008); Aboriginal and Torres Strait Islander Education Action Plan (2010-14)
Czech Republic: Inclusive Education Support Centres (2009-10); National Action Plan for Inclusive Education (2010)
New Zealand: Tataiko: Cultural Competencies for Teachers of Māori Learners (2012); Ka Hikitia – Accelerating the Success: Education Strategy (2013-17) previously Ka Hikitia – Managing for Success: the Māori Education Strategy (2008-12); The Pasifika Education Plan (2013-17)
Slovenia: Projects for the Successful Integration of Roma Students in Schools (2008-15); Raising the social and cultural capital in areas inhabited by members of the Roma community project (2011-13)
Turkey: Project for Increasing Enrolment Rates Especially for Girls (2011-13); Education Transport Programme (2011-13)
Source: OECD (2015a), Education Policy Outlook 2015: Making Reforms Happen, http://dx.doi.org/10.1787/9789264225442-en.

S t r i v i n g f o r s u s t a i n a b l e e x c e l l e n c e a n d e q u i t y i n l e a r n i n g Chapter 3
91EMPOWERING AND ENABLING TEACHERS TO IMPROVE EQUITY AND OUTCOMES FOR ALL © OECD 2017
In the same spirit, Box 3.2 shows how Ireland collaborates with schools to identify and support disadvantaged students.
Box 3.2. Improving opportunities for disadvantaged students in Ireland
In 2005, the Department Education and Science (now called Education and Skills) developed the Delivering Equality of Opportunity in Schools (DEIS) plan as an ongoing national policy for educational inclusion. It consists of a standardised system to identify each school’s level of socio-economic disadvantage (based on its community) and an integrated School Support Programme that provides schools and school clusters or communities with additional resources and support, depending on their level of disadvantage. The key initiatives of DEIS include:
• early childhood education for disadvantaged communities
• targeted student-teacher ratio to reduce class size in disadvantaged primary schools
• access to teachers/co-ordinators in rural primary schools
• professionalisation of school leaders and teachers and access to an administrative principal
• measures to target deficits in literacy and numeracy
• additional funding for school books, based on level of disadvantage
• support for school libraries and librarians for post-primary schools with high levels of disadvantage
• access to Home, School, Community Liaison services and to the School Completion Programme
• measures such as guidance and counselling to increase attendance, retention and attainment
• more curriculum choice
• improved access to higher education for students from disadvantaged backgrounds.
The findings show an overall improvement in reading and mathematics in both urban and rural schools, with rural students improving more than their urban peers. The Department points to positive outcomes of DEIS post-primary schools, with an increase in completion rates from 68.2% for 2001-07 cohorts to 80.1% for 2006-12 cohorts. Further evaluations are planned to understand the specificities of the policy that are contributing to the positive outcomes.
Source: OECD (2015a), Education Policy Outlook 2015: Making Reforms Happen, http://dx.doi.org/10.1787/9789264225442-en.
Fostering gender equality
Among the subjects of science, mathematics and reading, science is the one where mean gender differences in performance in PISA are smallest. Boys tend to perform slightly better than girls in science, while girls outperform boys in reading and boys outperform girls in mathematics. On average across OECD countries, boys’ mean performance in science is 4 points higher than girls’ performance – a statistically significant but numerically small difference.
Boys score significantly higher than girls on average in 24 countries/economies. However, there are considerable variations across countries/economies and years. The largest advantage for boys is found in Austria, Costa Rica and Italy, where the difference between boys’ scores and girls’ scores is over 15 points. Girls score significantly higher than boys, on average, in 22 countries/economies. In Albania, Bulgaria, Finland, FYROM, Georgia, Jordan, Qatar, Trinidad and Tobago, and the United Arab Emirates, girls’ mean score is more than 15 score points higher than boys’ mean score.
In Finland, for example, Figure 3.8 shows that there are more girls than boys among the top performers in science (and the share of top-performing girls in Finland exceeds the share of top-performing boys in most other countries/economies that participated in PISA). In Hong Kong (China), one of the highest-performing countries/economies, similar shares of boys and girls perform at Level 5 or above in mathematics. In most other countries, the share of top-performing students (those who perform at or above Level 5) is larger among boys than among girls, but so is the share of low-achieving students (those who perform below Level 2 on the science scale) as illustrated by Figure 3.9. This indicates that gender disparities in performance do not stem from innate differences in aptitude, but rather from factors that parents, teachers, policy makers and opinion leaders can influence. A collective effort to encourage student attitudes that are conducive to success, among both boys and girls, and to change behaviours that impede learning can give boys and girls equal opportunities to realise their potential and to contribute to society with their unique, individual capacities.
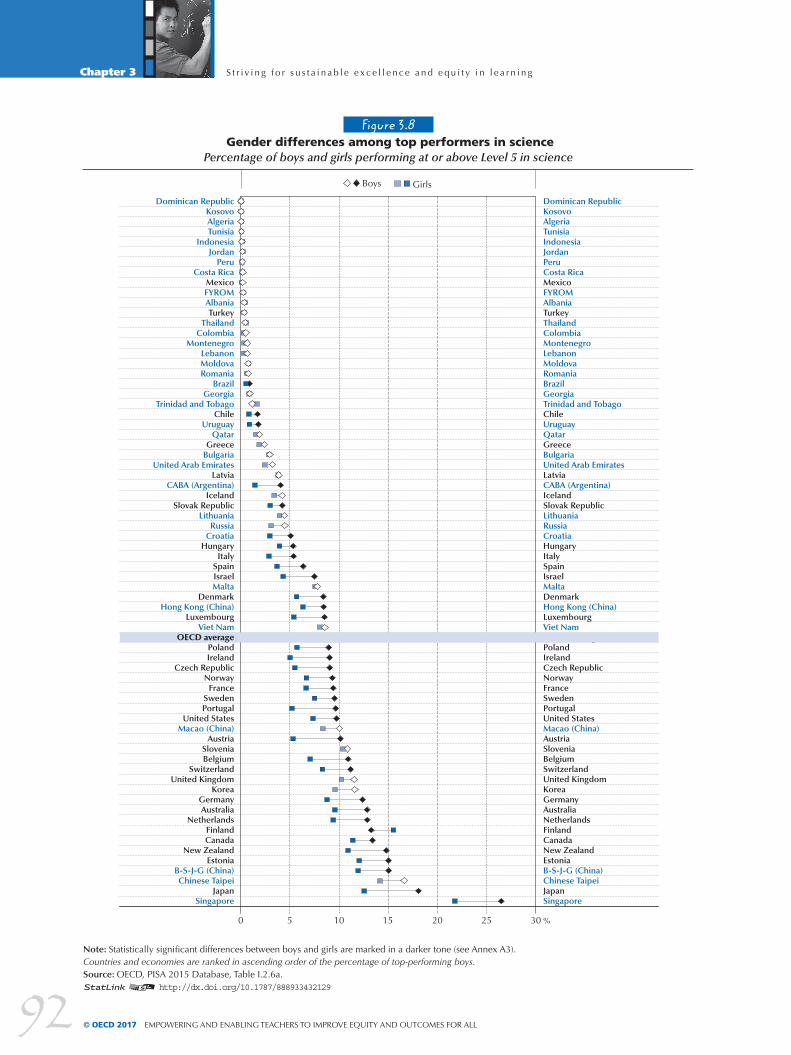
S t r i v i n g f o r s u s t a i n a b l e e x c e l l e n c e a n d e q u i t y i n l e a r n i n gChapter 3
92 © OECD 2017 EMPOWERING AND ENABLING TEACHERS TO IMPROVE EQUITY AND OUTCOMES FOR ALL
Figure 3.8 Gender differences among top performers in science
Percentage of boys and girls performing at or above Level 5 in science
Note: Statistically significant differences between boys and girls are marked in a darker tone (see Annex A3).Countries and economies are ranked in ascending order of the percentage of top-performing boys.Source: OECD, PISA 2015 Database, Table I.2.6a.1 2 http://dx.doi.org/10.1787/888933432129
Dominican RepublicKosovoAlgeriaTunisiaIndonesiaJordanPeruCosta RicaMexicoFYROMAlbaniaTurkeyThailandColombiaMontenegroLebanonMoldovaRomaniaBrazilGeorgiaTrinidad and TobagoChileUruguayQatarGreeceBulgariaUnited Arab EmiratesLatviaCABA (Argentina)IcelandSlovak RepublicLithuaniaRussiaCroatiaHungaryItalySpainIsraelMaltaDenmarkHong Kong (China)LuxembourgViet NamOECD averagePolandIrelandCzech RepublicNorwayFranceSwedenPortugalUnited StatesMacao (China)AustriaSloveniaBelgiumSwitzerlandUnited KingdomKoreaGermanyAustraliaNetherlandsFinlandCanadaNew ZealandEstoniaB-S-J-G (China)Chinese TaipeiJapanSingapore
Boys Girls
%0 5 10 15 20 25 30
Dominican RepublicKosovoAlgeriaTunisia
IndonesiaJordan
PeruCosta Rica
MexicoFYROMAlbaniaTurkey
ThailandColombia
MontenegroLebanonMoldovaRomania
BrazilGeorgia
Trinidad and TobagoChile
UruguayQatar
GreeceBulgaria
United Arab EmiratesLatvia
CABA (Argentina)Iceland
Slovak RepublicLithuania
RussiaCroatia
HungaryItaly
SpainIsraelMalta
DenmarkHong Kong (China)
LuxembourgViet Nam
OECD averagePolandIreland
Czech RepublicNorway
FranceSwedenPortugal
United StatesMacao (China)
AustriaSloveniaBelgium
SwitzerlandUnited Kingdom
KoreaGermanyAustralia
NetherlandsFinlandCanada
New ZealandEstonia
B-S-J-G (China)Chinese Taipei
JapanSingapore

S t r i v i n g f o r s u s t a i n a b l e e x c e l l e n c e a n d e q u i t y i n l e a r n i n g Chapter 3
93EMPOWERING AND ENABLING TEACHERS TO IMPROVE EQUITY AND OUTCOMES FOR ALL © OECD 2017
Figure 3.9Gender differences among low-achieving students in science
Percentage of boys and girls performing below Level 2 in science
Note: Statistically significant differences between boys and girls are marked in a darker tone (see Annex A3).Countries and economies are ranked in descending order of the percentage of low-achieving boys.Source: OECD, PISA 2015 Database, Table I.2.6a.1 2 http://dx.doi.org/10.1787/888933432113
Dominican RepublicAlgeriaKosovoFYROMTunisia
LebanonJordan
IndonesiaPeru
BrazilQatar
GeorgiaMontenegro
Trinidad and TobagoThailandAlbania
United Arab EmiratesColombia
MexicoTurkey
MoldovaBulgaria
Costa RicaRomaniaUruguayGreece
MaltaIsraelChile
Slovak RepublicLithuania
IcelandHungary
LuxembourgCroatia
SwedenFrance
OECD averageCABA (Argentina)
ItalyCzech Republic
United StatesNorway
LatviaNetherlands
AustriaBelgium
SwitzerlandAustralia
New ZealandSpain
RussiaPortugal
United KingdomKorea
PolandSlovenia
B-S-J-G (China)GermanyDenmark
IrelandFinland
Chinese TaipeiCanada
Hong Kong (China)Singapore
Macao (China)Estonia
JapanViet Nam
Boys Girls
%0 10 20 30 40 6050 8070 90
Dominican RepublicAlgeriaKosovoFYROMTunisiaLebanonJordanIndonesiaPeruBrazilQatarGeorgiaMontenegroTrinidad and TobagoThailandAlbaniaUnited Arab EmiratesColombiaMexicoTurkeyMoldovaBulgariaCosta RicaRomaniaUruguayGreeceMaltaIsraelChileSlovak RepublicLithuaniaIcelandHungaryLuxembourgCroatiaSwedenFranceOECD averageCABA (Argentina)ItalyCzech RepublicUnited StatesNorwayLatviaNetherlandsAustriaBelgiumSwitzerlandAustraliaNew ZealandSpainRussiaPortugalUnited KingdomKoreaPolandSloveniaB-S-J-G (China)GermanyDenmarkIrelandFinlandChinese TaipeiCanadaHong Kong (China)SingaporeMacao (China)EstoniaJapanViet Nam

S t r i v i n g f o r s u s t a i n a b l e e x c e l l e n c e a n d e q u i t y i n l e a r n i n gChapter 3
94 © OECD 2017 EMPOWERING AND ENABLING TEACHERS TO IMPROVE EQUITY AND OUTCOMES FOR ALL
Despite small differences between the performance of boys and girls, they have very different expectations about pursuing careers in science-related occupations, even among students who score similarly in science and report similar levels of enjoyment in learning science. On average across OECD countries, 25% of boys and 23% of girls reported that they expect to work in an occupation that requires further science training beyond compulsory education. Even when the shares of boys and girls who expect a science-related career are balanced, boys and girls tend to think of working in different fields of science (Figure 3.10). In all countries, girls envisage themselves as health professionals more than boys do, and in almost all countries, boys see themselves becoming ICT professionals, scientists or engineers more than girls do. This is consistent with recent patterns of enrolment in tertiary bachelor’s degree programmes. In 2013, and on average across OECD countries, women accounted for 78% of new entrants in health and welfare programmes, but for only 30% of new entrants in science and engineering programmes (OECD, 2014b). The similarity of these findings may indicate that the career paths of boys and girls are already starting to diverge before the age of 15, well before crucial career choices are made.
Figure 3.10 Expectations of a science career, by gender
OECD average
Source: OECD, PISA 2015 Database, Tables I.3.11a-d.1 2 http://dx.doi.org/10.1787/888933432311
%0 5 10 15 20 25
...science and engineering professionals
Students who expect to work as...
...health professionals
...information and communication technology (ICT) professionals
...science-related technicians or associate professionals
Boys
Girls
12.2
5.3
5.9
17.4
4.8
0.4
2.1
0.8
Supporting students of immigrant background
How school systems respond to migration can have an enormous impact on the economic and social well-being of all members of the communities they serve, whether they have an immigrant background or not. In recent years, many OECD countries, especially in Europe, have seen a sharp increase in the number of immigrants entering their territories – including unprecedented numbers of asylum-seekers and children. An estimated 5 million permanent migrants arrived in OECD countries in 2015, an increase of about 20% relative to 2014, with family reunification and free movement each accounting for about a third of these permanent entries (OECD, 2016d; OECD, 2015b). The recent wave of migration has reinforced a long and steady upward trend in the share of the immigrant population in OECD countries, which has grown by more than 30% and has become increasingly diverse since 2000 (OECD/EU, 2015). Reflecting this trend, PISA data shows that the proportion of students with an immigrant background increased from 9.4% in 2006 to 12.5% of students in 2015 among OECD countries.
Despite the growing numbers and greater linguistic diversity of immigrant students in the countries/economies participating in PISA, results from PISA 2015 provide no basis for the claim that larger proportions of students with an immigrant background are related to poorer education standards in host communities. There is no significant association between the share of immigrant students and the performance of a school system, as measured by the mean score on the PISA science assessment (Figure 3.11).
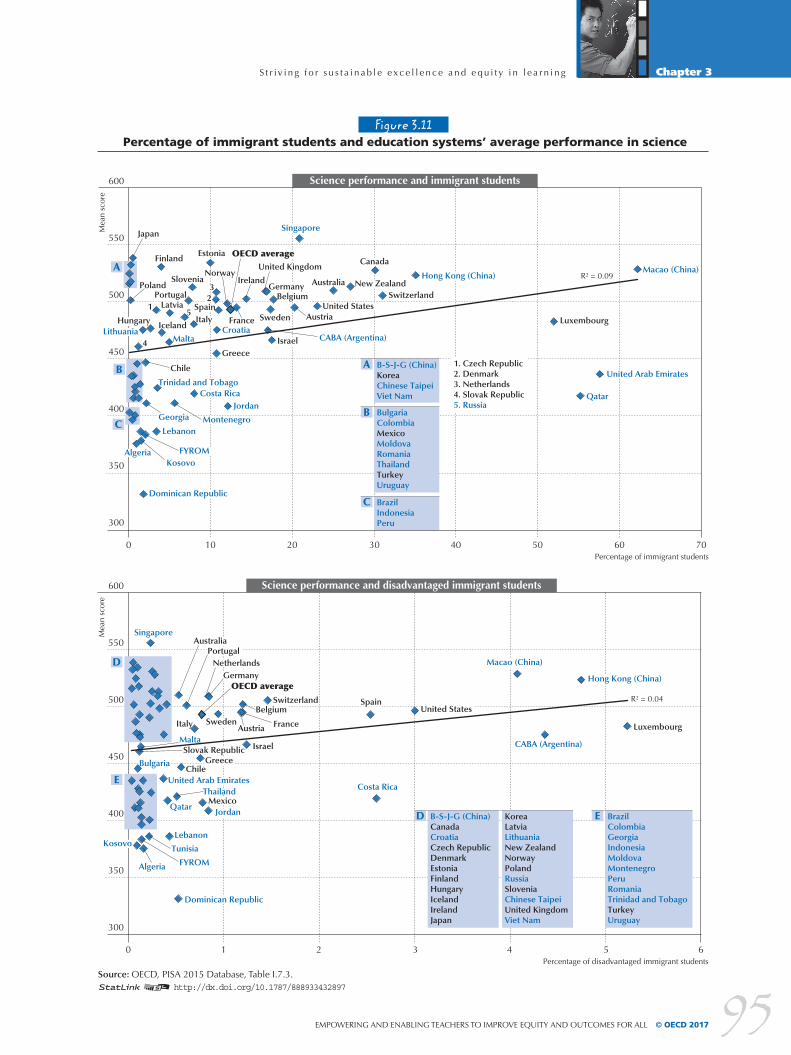
S t r i v i n g f o r s u s t a i n a b l e e x c e l l e n c e a n d e q u i t y i n l e a r n i n g Chapter 3
95EMPOWERING AND ENABLING TEACHERS TO IMPROVE EQUITY AND OUTCOMES FOR ALL © OECD 2017
Figure 3.11 Percentage of immigrant students and education systems’ average performance in science
Source: OECD, PISA 2015 Database, Table I.7.3.1 2 http://dx.doi.org/10.1787/888933432897
Science performance and immigrant students
Mea
n sc
ore
0 40 7020 6010 5030
600
550
500
450
400
350
300
Percentage of immigrant students
R² = 0.09
R² = 0.04
Science performance and disadvantaged immigrant students
Mea
n sc
ore
0 4 621 53
600
550
500
450
400
350
300
Percentage of disadvantaged immigrant students
Portugal
New Zealand
Luxembourg
Netherlands
France
France
Mexico
Belgium
Bulgaria
Thailand
United Kingdom
Switzerland
Chile
Portugal
Sweden
Sweden
NorwayIreland
Canada
Iceland
Japan
Estonia
United States
United States
Hungary
Spain
Spain
Chile
Latvia
Greece
Greece
LuxembourgAustria
Austria
PolandSlovenia
Finland
Australia
Australia
Germany
Germany
Italy
Israel
Israel
MaltaCroatia
FYROM
FYROM
Qatar
Qatar
Georgia
Lebanon
Lebanon
Jordan
Jordan
CABA (Argentina)
CABA (Argentina)
Hong Kong (China)
Hong Kong (China)
Trinidad and Tobago
Singapore
Singapore
Macao (China)
Macao (China)
United Arab Emirates
United Arab Emirates
OECD average
OECD average
Slovak Republic
Lithuania
Montenegro
Dominican Republic
Dominican Republic
Algeria
Algeria
Costa Rica
Costa Rica
Kosovo
KosovoTunisia
SwitzerlandBelgium
1. Czech Republic2. Denmark3. Netherlands4. Slovak Republic5. Russia
5
2
4
3
1
A
D
E
B
C
Italy
Malta
B-S-J-G (China)KoreaChinese TaipeiViet Nam
A
BulgariaColombiaMexicoMoldovaRomaniaThailandTurkeyUruguay
B
BrazilIndonesiaPeru
C
B-S-J-G (China)CanadaCroatiaCzech RepublicDenmarkEstoniaFinlandHungaryIcelandIrelandJapan
KoreaLatviaLithuaniaNew Zealand NorwayPolandRussiaSloveniaChinese TaipeiUnited KingdomViet Nam
D BrazilColombiaGeorgiaIndonesiaMoldovaMontenegroPeruRomaniaTrinidad and TobagoTurkeyUruguay
E
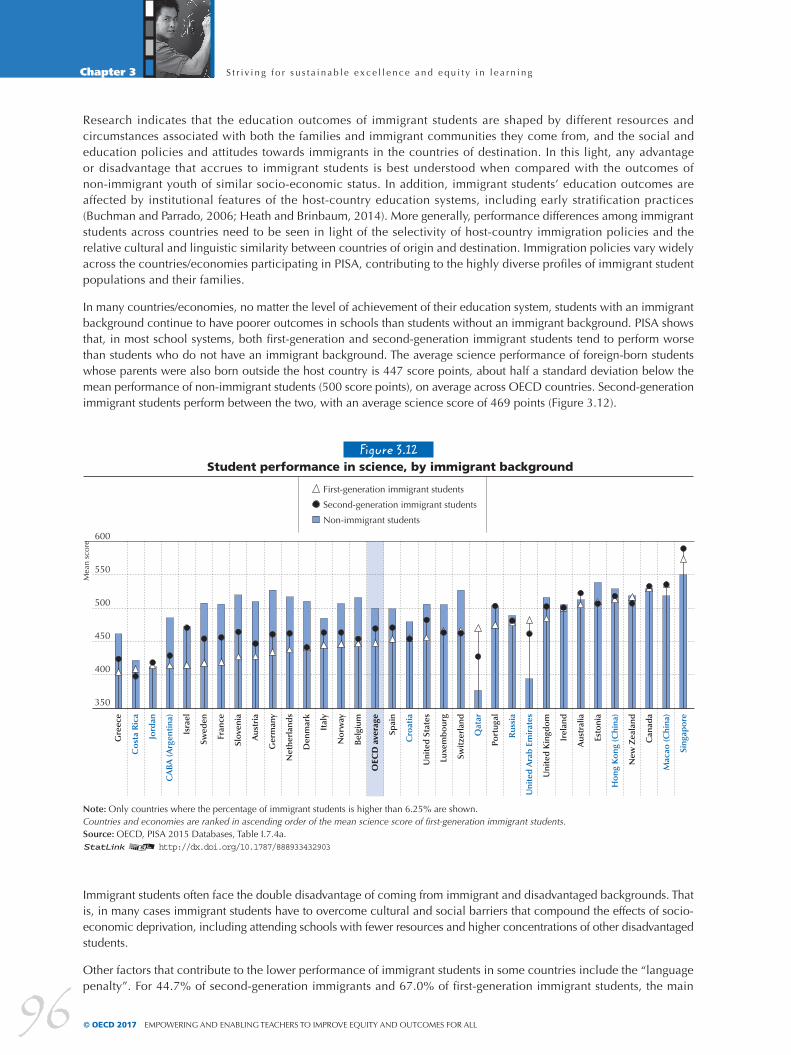
S t r i v i n g f o r s u s t a i n a b l e e x c e l l e n c e a n d e q u i t y i n l e a r n i n gChapter 3
96 © OECD 2017 EMPOWERING AND ENABLING TEACHERS TO IMPROVE EQUITY AND OUTCOMES FOR ALL
Research indicates that the education outcomes of immigrant students are shaped by different resources and circumstances associated with both the families and immigrant communities they come from, and the social and education policies and attitudes towards immigrants in the countries of destination. In this light, any advantage or disadvantage that accrues to immigrant students is best understood when compared with the outcomes of non-immigrant youth of similar socio-economic status. In addition, immigrant students’ education outcomes are affected by institutional features of the host-country education systems, including early stratification practices (Buchman and Parrado, 2006; Heath and Brinbaum, 2014). More generally, performance differences among immigrant students across countries need to be seen in light of the selectivity of host-country immigration policies and the relative cultural and linguistic similarity between countries of origin and destination. Immigration policies vary widely across the countries/economies participating in PISA, contributing to the highly diverse profiles of immigrant student populations and their families.
In many countries/economies, no matter the level of achievement of their education system, students with an immigrant background continue to have poorer outcomes in schools than students without an immigrant background. PISA shows that, in most school systems, both first-generation and second-generation immigrant students tend to perform worse than students who do not have an immigrant background. The average science performance of foreign-born students whose parents were also born outside the host country is 447 score points, about half a standard deviation below the mean performance of non-immigrant students (500 score points), on average across OECD countries. Second-generation immigrant students perform between the two, with an average science score of 469 points (Figure 3.12).
Figure 3.12 Student performance in science, by immigrant background
Note: Only countries where the percentage of immigrant students is higher than 6.25% are shown.Countries and economies are ranked in ascending order of the mean science score of first-generation immigrant students.Source: OECD, PISA 2015 Databases, Table I.7.4a.1 2 http://dx.doi.org/10.1787/888933432903
Mea
n sc
ore
600
550
500
450
400
350
Gre
ece
Co
sta
Ric
a
Jord
an
CA
BA (A
rgen
tina
)
Isra
el
Swed
en
Fran
ce
Slov
enia
Aus
tria
Ger
man
y
Net
herl
and
s
Den
mar
k
Ital
y
No
rway
Bel
gium
OEC
D a
vera
ge
Spai
n
Cro
atia
Uni
ted
Sta
tes
Luxe
mb
our
g
Swit
zerl
and
Qat
ar
Port
ugal
Rus
sia
Uni
ted
Ara
b E
mir
ates
Uni
ted
Kin
gdo
m
Irel
and
Aus
tral
ia
Esto
nia
Ho
ng K
ong
(Chi
na)
New
Zea
land
Can
ada
Mac
ao (C
hina
)
Sing
apo
re
First-generation immigrant students
Second-generation immigrant students
Non-immigrant students
Immigrant students often face the double disadvantage of coming from immigrant and disadvantaged backgrounds. That is, in many cases immigrant students have to overcome cultural and social barriers that compound the effects of socio-economic deprivation, including attending schools with fewer resources and higher concentrations of other disadvantaged students.
Other factors that contribute to the lower performance of immigrant students in some countries include the “language penalty”. For 44.7% of second-generation immigrants and 67.0% of first-generation immigrant students, the main

S t r i v i n g f o r s u s t a i n a b l e e x c e l l e n c e a n d e q u i t y i n l e a r n i n g Chapter 3
97EMPOWERING AND ENABLING TEACHERS TO IMPROVE EQUITY AND OUTCOMES FOR ALL © OECD 2017
language spoken at home is different from the language of assessment in their host country. In Austria and Luxembourg, countries with relatively large immigrant student populations, more than seven in ten second-generation immigrant students are in this situation. In Slovenia, Sweden and the United States, this is the case for more than eight in ten first-generation immigrant students. On average across OECD countries, immigrant students who speak the language of assessment at home score 31 points lower in science than non-immigrant students who speak the language of assessment at home. But immigrant students who mainly speak another language in the family context score 54 points lower than these non-immigrant students – more than 20 points lower than immigrant students who have greater familiarity with the test language. Across school subjects, there is a broad similarity in the pattern of association between the language spoken at home and performance in science and reading, whereas, in mathematics, immigrant students who are less familiar with the test language suffer a smaller penalty (15 score points), on average across OECD countries.
Overall, the average difference in science performance between immigrant and non-immigrant students with a similar socio-economic profile is 31 score points. The average difference shrinks to 19 score points after taking into account the language spoken at home. On average across OECD countries, and after taking their socio-economic status into account, immigrant students are more than twice as likely as their non-immigrant peers to perform below proficiency Level 2 in science. PISA also shows that, in most school systems, the most vulnerable immigrant students tend to be those who arrive at a late age, have limited mastery of the language of assessment in the host country and come from a country where education standards are weaker (OECD, 2015c; OECD, 2013; OECD, 2012b).
Although many immigrants have poorer relative performance when compared to their non-immigrant peers in their country/economy, they can perform at very high levels by international standards. PISA data shows that 24% of socio-economically disadvantaged immigrant students are considered resilient, meaning that they manage to score among the top quarter of all students in PISA. It is also encouraging that the average difference in science performance between immigrant and non-immigrant students with similar socio-economic status and familiarity with the test language narrowed by 6 score points between 2006 and 2015. But these relationships differ widely across countries.
Among countries with relatively large immigrant student populations, Macao (China) and Singapore are high-performing school systems where the average science scores of both first-generation and second-generation immigrant students are higher than those of non-immigrant students, so that the performance of these immigrant students contributes to the significantly higher mean scores of these countries. Immigrant students in Australia, Canada, Estonia, Hong Kong (China), Ireland and New Zealand also score at similar levels to or higher than the OECD average in science.
Strategies targeting students of immigrant background
Increasing migration towards high-income countries has led to changes in the composition of schools in some countries (OECD, 2013b). For example, Finland, Germany and Ireland have experienced increases in the share of international migrants as a percentage of their total population and have made targeted efforts to respond to the needs of migrant students and raise their attainment:
• In Finland, the National Core Curriculum for Instruction Preparing Immigrants for Basic Education (2009) was introduced to support students with immigrant background who are not proficient in the Finnish or Swedish language and/or other abilities so that they can attend basic education. The curriculum is differentiated according to age, learning capabilities and background to support students’ balanced development and integration into society. The national core curricula for vocational education and training and for Preparatory Education for General Upper Secondary Education (2014) also aim to support migrants and foreign-language speakers.
• In 2011, Germany transformed its National Integration Plan (2007) into the National Action Plan on Integration (NAP-I). It sets goals in education, training and continued education to increase the participation and success of students from immigrant backgrounds.
Particularly addressing refugees, Germany has been conducting a successful programme on integrating students of immigrant background (Box 3.3).
• In Ireland, the Intercultural Education Strategy (2010-15) was introduced to promote inclusive and intercultural learning environments for migrant students by developing leadership and teaching quality, instructional language knowledge, mainstreaming, rights and responsibilities and setting high expectations, among other features.
S t r i v i n g f o r s u s t a i n a b l e e x c e l l e n c e a n d e q u i t y i n l e a r n i n gChapter 3
98 © OECD 2017 EMPOWERING AND ENABLING TEACHERS TO IMPROVE EQUITY AND OUTCOMES FOR ALL
Box 3.3. Targeted education policies for successful integration of refugees in Germany
Around one-third of the more than 1 million people who have arrived in Germany since 2015 are children and youths. These 325 000 additional students had to be integrated into the school system. Cost estimates amount to an extra EUR 2.3 billion each year for the school sector. Around 20 000 additional teachers had – and have – to be hired.
A sure command of the German language is an indispensable requirement for successful integration in school, work and society. Usually, children of refugees and unaccompanied underage refugees begin to learn German in specific language classes, with the aim of a rapid transition to the regular school system. The students also already attend regular classes where possible (e.g. sports, music or art classes). Some Länder opt for rapid integration into regular classes with supplementary language tuition. The success of these various approaches also depends on local prerequisites. A small school in a rural area, for instance, will be unable to set up its own language class.
Several Länder have introduced the German Language Diploma of the Standing Conference (DSD) in domestic schools to improve the quality of language integration. The DSD is a national language certificate issued by the Länder that is normally used in schools abroad. Following a successful pilot phase in Hamburg, eight Länder now use this instrument, with more Länder voicing interest. In 2016, the Länder administered about 1 900 domestic DSD examinations. Incidentally, the DSD has also led to very good co-operation on language integration between the Länder. Moreover, being able to prove the language skills acquired through a certificate has a highly motivating effect for students learning German.
Challenges arising from the large number of additional students include attracting new teachers. The Länder have adopted a number of different approaches. Schleswig-Holstein, for example, currently offers all future teachers in preparatory service the possibility of completing a course on German as a second language instead of writing a final thesis. This offer is very popular and provides the opportunity to rapidly and appropriately qualify a large number of teachers. Elsewhere, part-time teachers are being taken on, and retired teachers are asked whether they would like to work for a few hours a week. In addition, the Länder have special programmes for further and continuing education in the field of German as a second language and German as a foreign language.
Source: Standing Conference (KMK), „Integration und Spracherwerb vor Ort – Das DSD in den Ländern“, https://www.kmk.org/themen/deutsches-sprachdiplom-dsd/integration-und-spracherwerb-vor-ort.html.
Tackling dropouts
Over recent decades, the share of adults who have completed secondary education has increased in the majority of OECD and partner countries. However, although access is universal in most countries, a major problem seems to be that students remain in school while education is compulsory, but rates of early school leaving remain high in some countries (Figure 3.13).
The reasons are varied, ranging from opportunities to work in the informal economy or the availability of low-skilled jobs which students from low socio-economic backgrounds need to accept. There is also the perception that the education system does not provide knowledge or skills useful for their professional careers, which can lead to a lack of motivation to continue. In the latter case, early school leaving is closely associated with the proportion of young people who are neither employed nor in education or training (NEETs). On average across OECD countries, the proportion of NEETs among 20-24 year-olds is 17%, ranging from over 30% in Italy and Turkey, to less than 10% in countries with strong vocational education and training systems such as Germany and the Netherlands (Figure 3.14).
Early school leaving is one of the greatest sources of inequity among education systems, since these students leave the education system with a low level of skills. This increases the chances of long spells of unemployment and makes it very difficult to find effective ways to provide training later in life.
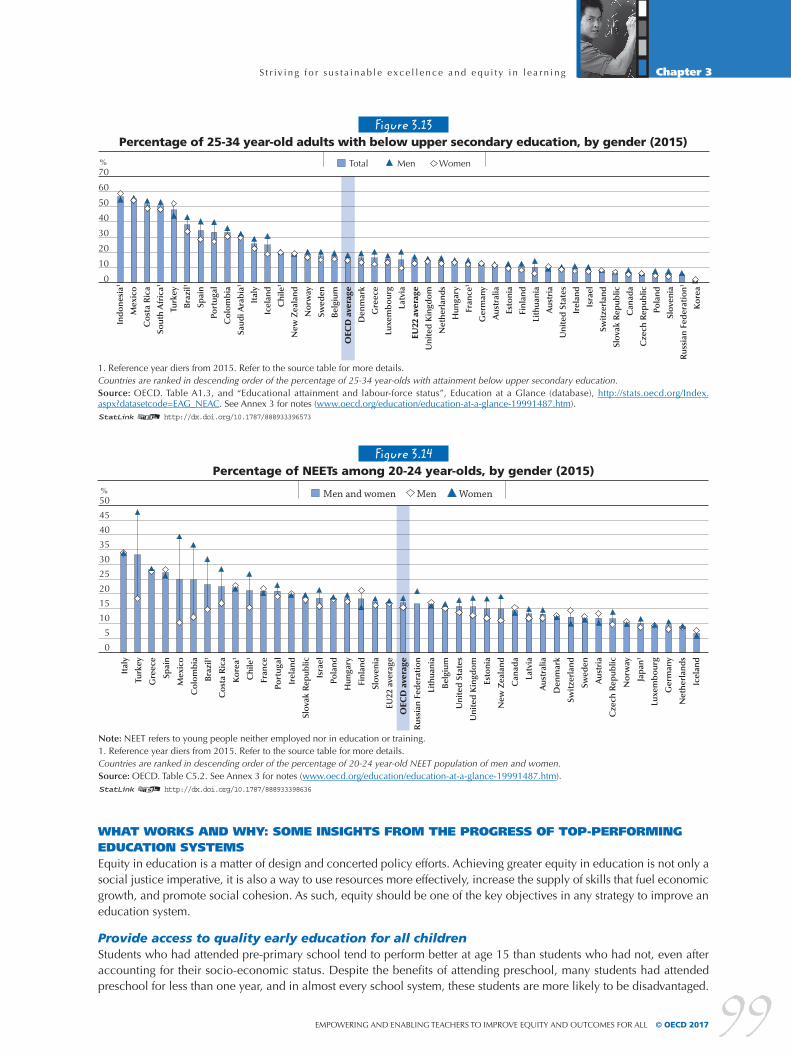
S t r i v i n g f o r s u s t a i n a b l e e x c e l l e n c e a n d e q u i t y i n l e a r n i n g Chapter 3
99EMPOWERING AND ENABLING TEACHERS TO IMPROVE EQUITY AND OUTCOMES FOR ALL © OECD 2017
WHAT WORKS AND WHY: SOME INSIGHTS FROM THE PROGRESS OF TOP-PERFORMING EDUCATION SYSTEMSEquity in education is a matter of design and concerted policy efforts. Achieving greater equity in education is not only a social justice imperative, it is also a way to use resources more effectively, increase the supply of skills that fuel economic growth, and promote social cohesion. As such, equity should be one of the key objectives in any strategy to improve an education system.
Provide access to quality early education for all childrenStudents who had attended pre-primary school tend to perform better at age 15 than students who had not, even after accounting for their socio-economic status. Despite the benefits of attending preschool, many students had attended preschool for less than one year, and in almost every school system, these students are more likely to be disadvantaged.
Figure 3.13Percentage of 25-34 year-old adults with below upper secondary education, by gender (2015)
1. Reference year diers from 2015. Refer to the source table for more details.Countries are ranked in descending order of the percentage of 25-34 year-olds with attainment below upper secondary education.Source: OECD. Table A1.3, and “Educational attainment and labour-force status”, Education at a Glance (database), http://stats.oecd.org/Index.aspx?datasetcode=EAG_NEAC. See Annex 3 for notes (www.oecd.org/education/education-at-a-glance-19991487.htm).1 2 http://dx.doi.org/10.1787/888933396573
Ind
one
sia1
Mex
ico
Co
sta
Ric
a
Sout
h A
fric
a1
Turk
ey
Bra
zil1
Spai
n
Port
ugal
Co
lom
bia
Saud
i Ara
bia
1
Ital
y
Icel
and
Chi
le1
New
Zea
land
No
rway
Swed
en
Bel
gium
OEC
D a
vera
ge
Den
mar
k
Gre
ece
Luxe
mb
our
g
Latv
ia
EU22
ave
rage
Uni
ted
Kin
gdo
m
Net
herl
and
s
Hun
gary
Fran
ce1
Ger
man
y
Aus
tral
ia
Esto
nia
Finl
and
Lith
uani
a
Aus
tria
Uni
ted
Sta
tes
Irel
and
Isra
el
Swit
zerl
and
Slov
ak R
epub
lic
Can
ada
Cze
ch R
epub
lic
Pola
nd
Slov
enia
Rus
sian
Fed
erat
ion1
Ko
rea
70
60
50
40
30
20
10
0
% Total Men Women
Figure 3.14Percentage of NEETs among 20-24 year-olds, by gender (2015)
Note: NEET refers to young people neither employed nor in education or training.1. Reference year diers from 2015. Refer to the source table for more details.Countries are ranked in descending order of the percentage of 20-24 year-old NEET population of men and women.Source: OECD. Table C5.2. See Annex 3 for notes (www.oecd.org/education/education-at-a-glance-19991487.htm).1 2 http://dx.doi.org/10.1787/888933398636
50
45
40
35
30
25
20
15
10
5
0
Ital
y
Turk
ey
Gre
ece
Spai
n
Mex
ico
Co
lom
bia
Bra
zil1
Co
sta
Ric
a
Ko
rea1
Chi
le1
Fran
ce
Port
ugal
Irel
and
Slov
ak R
epub
lic
Isra
el
Pola
nd
Hun
gary
Finl
and
Slov
enia
EU22
ave
rage
OEC
D a
vera
ge
Rus
sian
Fed
erat
ion
Lith
uani
a
Bel
gium
Uni
ted
Sta
tes
Uni
ted
Kin
gdo
m
Esto
nia
New
Zea
land
Can
ada
Latv
ia
Aus
tral
ia
Den
mar
k
Swit
zerl
and
Swed
en
Aus
tria
Cze
ch R
epub
lic
No
rway
Jap
an1
Luxe
mb
our
g
Ger
man
y
Net
herl
and
s
Icel
and
Men and women Men Women%

S t r i v i n g f o r s u s t a i n a b l e e x c e l l e n c e a n d e q u i t y i n l e a r n i n gChapter 3
100© OECD 2017 EMPOWERING AND ENABLING TEACHERS TO IMPROVE EQUITY AND OUTCOMES FOR ALL
In B-S-J-G (China), Croatia, the Dominican Republic, Lithuania, Montenegro, Portugal and Turkey, for example, at least one in six students had attended pre-primary school for less than a year. Providing access to early education for all children can be accomplished by passing legislation that gives every child the right to participate in pre-primary education, by developing or subsidising a network of free pre-primary education centres to ease the financial burden on disadvantaged families, and by providing information and guidance to parents.
Design equity strategies adapted to the performance and equity profile of the system
Policy makers and school administrators often ask themselves whether efforts to improve student performance and equity should be targeted mainly at low performers or at disadvantaged students.
Countries/economies where an equity-centred policy strategy (as opposed to an achievement-centred strategy) would have the greatest impact are those where there are large performance differences between advantaged and disadvantaged students and a strong relationship between performance and socio-economic status. These countries/economies can promote equity and raise their mean level of achievement by implementing policies that target mainly socio-economic disadvantage. In PISA 2015, Belgium, Singapore and Switzerland were the only three high-performing countries with below-average levels of equity in education outcomes. Austria, the Czech Republic and France also show below-average equity and score around the OECD average. Where both poor performance and low equity are observed, such as in Hungary and Luxembourg, policies that target both low performers and disadvantaged students would reach those who need support the most since, in these cases, they tend to be the same students. Countries/economies where socio-economic status is a strong predictor of performance and where the gap in performance between advantaged and disadvantaged students is wide would benefit from compensatory policies that provide more resources to disadvantaged students and schools than to their advantaged peers.
A second group of countries/economies includes those where there is a strong relationship between performance and socio-economic status, but where the differences in performance between advantaged and disadvantaged students are relatively small. This group includes Chile, Peru and Uruguay. More than one in three students in Chile and Uruguay and more than one in two in Peru perform below the baseline level of proficiency in science. In another 14 countries/economies, including Greece, Mexico, Portugal, Spain and the United States, differences in performance are relatively small, but the impact of socio-economic status on performance is around average. In countries/economies with this profile, a combination of universal policies to improve performance across the board (such as increasing the amount or quality of the time students spend at school) and policies providing more and better resources to disadvantaged students and schools may yield the best results.
A third group of countries/economies are those where performance differences related to socio-economic status are small and there is a weak relationship between student performance and socio-economic status. While these countries/economies tend to show small variation in student performance, their overall levels of achievement can vary greatly. Canada, Denmark, Estonia, Hong Kong (China) and Macao (China) are the only school systems that share above-average performance and above-average equity, whether measured by the strength of the relationship between socio-economic status and performance or by the size of the performance difference across socio-economic groups. Latvia is another high-equity country, but its performance is around the OECD average.
Finland, Japan, Norway and the United Kingdom are also high-achievers with a weak relationship between socio-economic status and performance, but performance differences related to socio-economic status are around average. Beyond universal policies, these countries may consider policies targeted to low performers who may not necessarily be defined by their socio-economic status (for example, immigrant students), or to poor-performing schools, when differences between schools are large.
In another 15 countries that score below average in science, including OECD countries Iceland, Italy and Turkey, socio-economic status is only weakly related to performance, and the differences in performance between advantaged and disadvantaged students are relatively small. In all these countries except Iceland, Italy and the Russian Federation, more than one in four students performs below the baseline level of proficiency in science. Equity indicators suggest that, in many of these countries, many low-performing students may not come from disadvantaged backgrounds. Thus, by themselves, policies that specifically target disadvantaged students would not address the needs of many of the country’s low performers. As is true in high-performing systems, in these countries, universal policies that reach all students and schools or policies targeted to low-performing schools, regions or other groups not necessarily defined by socio-economic status are likely to have more of an impact in improving performance while maintaining high levels of equity.
S t r i v i n g f o r s u s t a i n a b l e e x c e l l e n c e a n d e q u i t y i n l e a r n i n g Chapter 3
101EMPOWERING AND ENABLING TEACHERS TO IMPROVE EQUITY AND OUTCOMES FOR ALL © OECD 2017
Provide additional support for disadvantaged schools and students
Achieving equity in education means ensuring that students’ socio-economic status has little to do with learning outcomes. Learning should not be hindered by whether a child comes from a poor family, has an immigrant background or by gender. Successful education systems understand this and have found ways to allocate resources to level the playing field for students who lack the material and human resources that students in advantaged families enjoy. In this way, education systems become powerful engines of social mobility. Furthermore, when more students achieve high performance, the whole system benefits.
Data from PISA and TALIS reveal a number of quantitative and qualitative differences between disadvantaged and advantaged schools that collectively paint a picture of the dramatically different learning environments in these distinct types of schools. Disadvantaged schools have fewer qualified science teachers and are less likely to require students to attend science classes. Their students not only spend less time in regular lessons than students in advantaged schools, but they are also less exposed to quality teaching. For example, teachers in their schools are less likely to engage in some effective teaching strategies, such as having teachers explain or demonstrate a scientific idea. The range of learning opportunities beyond regular classes is also much narrower in disadvantaged schools, as these schools tend to offer fewer extracurricular activities, such as science competitions and clubs, sports, and music and arts activities. Disadvantaged schools also tend to be subject to more disciplinary problems and a lack of student engagement, manifested in students arriving late for school or skipping days of school, which compromise their opportunities to learn and to do well in school.
In more than 30 of the countries/economies that participated in PISA 2015, students in advantaged schools have access to better material or human resources than their peers in disadvantaged schools, although this is not the case in all countries with larger-than-average between-school disparities in performance. In cases where disparities in resource allocation between schools of different socio-economic profiles stem from residential segregation, giving higher-level authorities responsibility for resource allocation and strengthening their capacity to monitor and support schools at risk can begin to address the problem. Other options include allocating specific goods and/or personnel to disadvantaged schools, including teachers specialised in target subjects and/or with training of particular relevance for low-performing students, providing other professional and administrative staff and instructional materials (e.g. computers, laboratories, libraries) or improving school infrastructure.
Compensatory measures are essential and, in many ways, they are already in place in various countries. But further steps need to be taken. For example, it is not enough for disadvantaged schools to have more computers per student; these computers need to be connected to the Internet and, more importantly, they need to be used in a way that improves learning, not distracts from it. It is not enough for students in these schools to spend more time studying after school; they also need more time in regular lessons with better teaching, which is what their counterparts in advantaged schools already have. And they need more support after class too, in the form of tutoring and enriching extracurricular activities.
Once these deficiencies have been identified, policy makers are left with the hard work of finding the best ways to address them. Solutions will vary depending on the nature of the gaps. For example, in some education systems, like those in CABA (Argentina), Georgia, Japan, Lebanon, Macao (China), Mexico and Thailand, policy makers might try to achieve a better distribution of material resources. In others, such as Australia, B-S-J-G (China), New Zealand, Spain and Uruguay, a better allocation of human resources seems to be a priority.
Boxes 3.4 and 3.5 show how Scotland (United Kingdom) and Ontario (Canada) are working to close the achievement gap.
Box 3.4. The Attainment Challenge in Scotland (United Kingdom)
Launched in February 2015 by First Minister Nicola Sturgeon, the Scottish Attainment Challenge aims to achieve equity in educational outcomes by focusing on closing the poverty-related attainment gap wherever, whenever and however it is measured. It prioritises improvements in literacy, numeracy, health and well-being of those children who are adversely affected by poverty in Scotland’s Primary and Secondary schools.
Between 2016 and 2020, GBP 750 million will be allocated through the Attainment Scotland Fund to tackle the poverty-related attainment gap, targeting resources to the children, schools and communities most in need.
…
S t r i v i n g f o r s u s t a i n a b l e e x c e l l e n c e a n d e q u i t y i n l e a r n i n gChapter 3
102© OECD 2017 EMPOWERING AND ENABLING TEACHERS TO IMPROVE EQUITY AND OUTCOMES FOR ALL
In 2016/17 this will include GBP 120 million of Pupil Equity funding provided directly to head teachers across Scotland for them to use for additional staffing or resources that they consider will help raise attainment of children affected by poverty. The Attainment Scotland Fund will also provide targeted support of GBP 50 million per year to nine specific Scottish Attainment Challenge authorities and schools with the highest concentration of pupils from deprived communities, as well as a number of national programmes, including staffing supply and capacity, professional learning and school leadership.
With this support, the Scottish Government’s focus will be to drive improvement from the ground up, to support and empower partners in Scotland’s local authorities, schools and the third sector (community groups, voluntary organisations, charities, social enterprises, co-operatives and individual volunteers). The government will encourage these partners to develop their own approaches, draw on evidence-based practice and share their results to ultimately help address the poverty-related attainment gap.
The Reading for Success programme
Robert Smillie Primary School, in Larkhall, was identified for support in 2015 from the Scottish Attainment Challenge, as more than 70% of the children were in the bottom quintile of the Scottish Index of Multiple Deprivation. Funding was provided to support their Reading for Success programme. Reading for Success is a structured one-to-one literacy intervention for pupils working in early, first and second levels who are having difficulty with reading. It is based on “Catch Up Literacy” which is a training approach for support staff. The training for Reading for Success consisted of three half-days, provision of resources, online support and the option of accreditation. All the support assistants at Robert Smillie opted to pursue accreditation.
A standardised assessment was used to screen children and identify those who would benefit from this approach. As a result of the screening, 26 pupils across the school were identified and subsequently received Reading for Success support. The support takes the form of three support sessions each week, with pupils working on a one-to-one basis with a trained support assistant. Two sessions use Reading for Success techniques, and one is designed for consolidation. Reading for Success supports children in developing their reading skills and also provides a diagnostic element to identify any barriers. These diagnostic findings and pupils’ progress are shared with the class teacher every week to ensure that the child also receives appropriate support in his/her classroom work. Each child participates in the programme until he/she has made the required progress to read at chronological reading age or beyond.
Parents were informed that their child was participating in Reading for Success and asked to give written permission to take part. Parents were invited in after the programme had been running for an appropriate length of time, allowing both child and support assistant to become comfortable with the process and each other and the child felt ready to share success. Parents could then take some of the support materials home with them and continue support there.
In Robert Smillie, the head teacher reported that the support assistants who had been trained were very excited by their experience of the training and by the approach itself. The support assistants gave a professional learning presentation to class teachers about Reading for Success, which the head teacher described as very well received by class teachers and for which the support assistants felt very valued in delivering.
The research base for Reading for Success training is Thomas and Davies (1997), who found that 18% of all 7-8 year-olds have reading difficulties. This remains the case, as in England (2013), 11% of all 7-year-olds were working below the expected level (based on Department for Education expectations, 2014), and 25% of 11-year-olds were below the expected level for reading. Reading for Success Literacy and Reading for Success Numeracy are both featured in the Education Endowment Foundation (EEF) report Making Best Use of Teaching Assistants and the EEF Teaching and Learning Toolkit (https://educationendowmentfoundation.org.uk/our-work/projects/catch-up-literacy).
A number of other schools in the Scottish Attainment Challenge in South Lanarkshire have also undertaken training in Reading for Success with support staff. The impact of this intervention can be shown across these schools through data demonstrating improvements in reading levels and children returning to classroom reading groups. This reading intervention is most effective with children who have slipped behind in their reading development due to interrupted learning.
Source: The Scottish Government, http://www.gov.scot/.
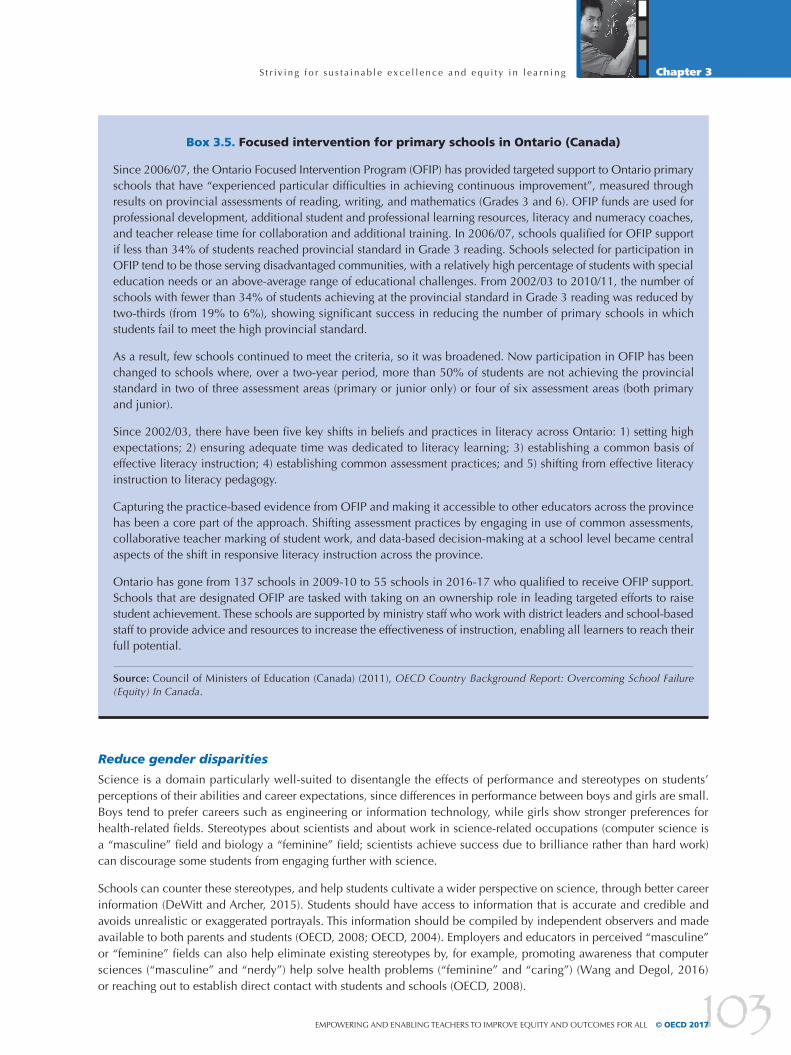
S t r i v i n g f o r s u s t a i n a b l e e x c e l l e n c e a n d e q u i t y i n l e a r n i n g Chapter 3
103EMPOWERING AND ENABLING TEACHERS TO IMPROVE EQUITY AND OUTCOMES FOR ALL © OECD 2017
Box 3.5. Focused intervention for primary schools in Ontario (Canada)
Since 2006/07, the Ontario Focused Intervention Program (OFIP) has provided targeted support to Ontario primary schools that have “experienced particular difficulties in achieving continuous improvement”, measured through results on provincial assessments of reading, writing, and mathematics (Grades 3 and 6). OFIP funds are used for professional development, additional student and professional learning resources, literacy and numeracy coaches, and teacher release time for collaboration and additional training. In 2006/07, schools qualified for OFIP support if less than 34% of students reached provincial standard in Grade 3 reading. Schools selected for participation in OFIP tend to be those serving disadvantaged communities, with a relatively high percentage of students with special education needs or an above-average range of educational challenges. From 2002/03 to 2010/11, the number of schools with fewer than 34% of students achieving at the provincial standard in Grade 3 reading was reduced by two-thirds (from 19% to 6%), showing significant success in reducing the number of primary schools in which students fail to meet the high provincial standard.
As a result, few schools continued to meet the criteria, so it was broadened. Now participation in OFIP has been changed to schools where, over a two-year period, more than 50% of students are not achieving the provincial standard in two of three assessment areas (primary or junior only) or four of six assessment areas (both primary and junior).
Since 2002/03, there have been five key shifts in beliefs and practices in literacy across Ontario: 1) setting high expectations; 2) ensuring adequate time was dedicated to literacy learning; 3) establishing a common basis of effective literacy instruction; 4) establishing common assessment practices; and 5) shifting from effective literacy instruction to literacy pedagogy.
Capturing the practice-based evidence from OFIP and making it accessible to other educators across the province has been a core part of the approach. Shifting assessment practices by engaging in use of common assessments, collaborative teacher marking of student work, and data-based decision-making at a school level became central aspects of the shift in responsive literacy instruction across the province.
Ontario has gone from 137 schools in 2009-10 to 55 schools in 2016-17 who qualified to receive OFIP support. Schools that are designated OFIP are tasked with taking on an ownership role in leading targeted efforts to raise student achievement. These schools are supported by ministry staff who work with district leaders and school-based staff to provide advice and resources to increase the effectiveness of instruction, enabling all learners to reach their full potential.
Source: Council of Ministers of Education (Canada) (2011), OECD Country Background Report: Overcoming School Failure (Equity) In Canada.
Reduce gender disparities
Science is a domain particularly well-suited to disentangle the effects of performance and stereotypes on students’ perceptions of their abilities and career expectations, since differences in performance between boys and girls are small. Boys tend to prefer careers such as engineering or information technology, while girls show stronger preferences for health-related fields. Stereotypes about scientists and about work in science-related occupations (computer science is a “masculine” field and biology a “feminine” field; scientists achieve success due to brilliance rather than hard work) can discourage some students from engaging further with science.
Schools can counter these stereotypes, and help students cultivate a wider perspective on science, through better career information (DeWitt and Archer, 2015). Students should have access to information that is accurate and credible and avoids unrealistic or exaggerated portrayals. This information should be compiled by independent observers and made available to both parents and students (OECD, 2008; OECD, 2004). Employers and educators in perceived “masculine” or “feminine” fields can also help eliminate existing stereotypes by, for example, promoting awareness that computer sciences (“masculine” and “nerdy”) help solve health problems (“feminine” and “caring”) (Wang and Degol, 2016) or reaching out to establish direct contact with students and schools (OECD, 2008).
S t r i v i n g f o r s u s t a i n a b l e e x c e l l e n c e a n d e q u i t y i n l e a r n i n gChapter 3
104© OECD 2017 EMPOWERING AND ENABLING TEACHERS TO IMPROVE EQUITY AND OUTCOMES FOR ALL
Objective and reliable career information for both boys and girls, including through personal contact with employers and professionals, can help reduce the influence of informal sources of information, which may lack reliability, solid information and impartiality, and confine choices to the known and familiar (OECD, 2004). Students sometimes have a limited understanding of what a career in science can mean.
Other data show that few pupils have a full or accurate understanding of science-related professions. Many are largely unaware of the range of career opportunities that are made available with training in science and technology. What they do know often comes from personal interactions – mostly with their teachers, sometimes with family members – or through the media, where scientists are often portrayed as white men in white coats, and engineers as men performing dirty or dull jobs (OECD, 2008).
But the power of personal interactions can also be harnessed in more formal career guidance activities to counter the stereotyped images that otherwise prevail. Providing all children with opportunities for personal contact with science and engineering professionals, such as through employer talks at school, can help children make informed decisions about their desired education and career path, and has been shown in some contexts to have a lasting, positive impact (Kashefpakdel and Percy, 2016).
Other research has shown that the school context also has a lasting influence on how likely girls are to pursue a career in science and engineering. According to a longitudinal study in which students from 250 high schools in the United States were followed from Grade 8 (prior to entering high school) until high school graduation, gendered career choices are more frequent in high schools that are characterised by weaker curricula and where boys and girls attend different extracurricular activities (Legewie and DiPrete, 2014). By contrast, in schools that offer advanced mathematics and science curricula, and where extracurricular activities such as sports clubs attract both boys and girls in similar number, girls and boys are equally likely to report at the end of high school that they plan to major in a science and engineering field.
Promoting a positive and inclusive image of science is also important. Too often, school science is seen as the first segment of a (leaky) pipeline that will ultimately select those who will work as scientists and engineers. Not only does the pipeline metaphor discount the many pathways successful scientists have travelled to reach their career goals (Cannady, Greenwald and Harris, 2014; Maltese, Melki and Wiebke, 2014), it also conveys a negative image of those who do not end up as scientists and engineers. Because knowledge and understanding of science are useful well beyond the work of scientists and necessary for full participation in a world shaped by science-based technology, school science should be promoted more positively, perhaps as a springboard to new sources of interest and enjoyment (Archer, Dewitt and Osborne, 2015). Expanding students’ awareness about the utility of science beyond teaching and research occupations can help build a more inclusive view of science, from which fewer students feel excluded (Alexander, Johnson and Kelley, 2012).
Support immigrant students
The policies and practices that countries design and implement to support immigrant students have a major influence on whether integration in the host communities is successful or not. How well immigrant students do at school is not only related to their attitudes, socio-economic status and prior education, but also to the quality and receptiveness of the host country’s education system. A key policy question is how to best support immigrants students who face the multiple disadvantage of socio-economic deprivation, low education standards in their countries of origin, and cultural adjustment to host countries, including learning a new language. How too can destination countries/economies support the high aspirations of immigrant students and families, and channel the high levels of skills that many of them bring? Previous OECD work describes various education policies that have proven effective in helping immigrant students succeed in school (Nusche, 2009; OECD, 2010; OECD, 2015c).
A quick-win policy response is to provide sustained language support for immigrant students with limited proficiency in the language of instruction. Language skills are essential for most learning processes; any student who does not master the language used in school is at a significant disadvantage. Common features of successful language-support programmes include sustained language training across all grade levels, centrally developed curricula, teachers who are specifically trained in second-language acquisition, and a focus on academic language and integration of language and content learning. Since language development and general cognitive development are intertwined, it is best not to postpone teaching of the main curriculum until students fully master their new language. One way to integrate language and academic learning is to develop curricula for second-language learning. Another is to ensure close co-operation between language teachers and classroom teachers, an approach that is widely used in countries that seem most successful in educating immigrant students, such as Australia, Canada and Sweden (Christensen and Stanat, 2007).

S t r i v i n g f o r s u s t a i n a b l e e x c e l l e n c e a n d e q u i t y i n l e a r n i n g Chapter 3
105EMPOWERING AND ENABLING TEACHERS TO IMPROVE EQUITY AND OUTCOMES FOR ALL © OECD 2017
Offering high-quality early childhood education, tailored to language development, is another immediate policy response. Entering early education programmes can improve the chances that immigrant students start school at the same level as non-immigrant children. Improved access to pre-primary education may involve offering programmes free of charge to disadvantaged students and linking enrolment to wider social policy programmes to support the integration of immigrant families. To raise awareness of the value of early learning and overcome potential reluctance to enrol children, targeted home visits can help families support their child’s learning at home and can also ease entry into appropriate education services.
A third high-impact policy option is to build the capacity of schools receiving immigrant children, as the successful integration of immigrant children depends critically on having high-skilled and well-supported teachers. This can involve providing special training for teachers to better tailor instructional approaches to diverse student populations and to support second-language learning, and also, more generally, reducing teacher turnover in schools serving disadvantaged and immigrant populations and encouraging high-quality and experienced teachers to work in these schools. Hiring more teachers from ethnic minority or immigrant backgrounds can help reverse the growing disparity between an increasingly diverse student population and a largely homogeneous teacher workforce, especially in countries where immigration is a more recent phenomenon.
Among policy responses with a medium-term horizon is avoiding the concentration of immigrant students in the same disadvantaged schools. Schools that struggle to do well for domestic students will struggle even more with a large population of children who cannot speak or understand the language of instruction. Countries have used three main approaches to address the concentration of immigrant and other disadvantaged students in particular schools. The first is to attract and retain other students, including more advantaged students. The second is to better equip immigrant parents with information on how to select the best school for their child. The third is to limit the extent to which advantaged schools can select students on the basis of their family background.
Policy can also provide extra support and guidance to immigrant parents. While immigrant parents often have high aspirations for their children, parents may also feel alienated and limited in their capacity to support their children if they have poor language skills or an insufficient understanding of how schools in the host country function. Programmes to support immigrant parents can include home visits to encourage these parents to participate in educational activities, employing trained liaison staff to improve communication between schools and families, and reaching out to parents to involve them in school-based activities. Evidence from an intervention in a disadvantaged school district in France shows that low-cost programmes can boost parents’ involvement in their children’s education and improve student behaviour at school (Avvisati et al., 2014).
Prevent student dropoutStudent dropout is a complex process of disengagement that can be explained by a variety of factors, including academic performance, students’ personal and family background, system-level policies and labour market conditions (OECD, 2012c). In recent years, several countries have adopted policy initiatives to increase completion of upper secondary education (Table 3.3).
Within the European context, a common objective among European countries under the European 2020 Strategy (2010) is to reduce rates of early school leaving to below 10% by 2020 (a goal for the whole of the European Union) (EC, 2014a). Early school leavers refer to 18-24 year-olds who have left education and training with a lower secondary education or less and are no longer in education or training (EC, 2013). Each European country has translated this target to reflect its specific context (EC, 2014b). Examples of policies adopted to prevent students from leaving the education system and dropping out before attaining a minimum level of education include the following:
• The Austrian National Strategy against Early School Leaving (2012) was implemented to further reduce the proportion of early school leavers. While the proportion is low in Austria (7.6%) compared to other countries, the strategy aims to prevent early school leavers at the system level through structural improvements to the education system, at the school level through improvements of the teaching and learning environment, and at the student level by supporting students at risk, through initiatives such as youth coaching (EC, 2013).
• Spain’s National Reform Plan (2012) laid out objectives to meet the European Union 2020 strategy and reduce dropout rates to 15% by 2020. Between 2009 and 2012, Spain decreased early school-leaving rates by 6.3 percentage points to 24.9% and aims to reduce it further to achieve its targets (EC, 2013). In the past, Spain also introduced the Programme to reduce early dropout in education and training (Programa para la reducción del abandono temprano de la educación y la formación, 2008), which provided funding for preventive measures and has shown a small impact on reducing dropout.
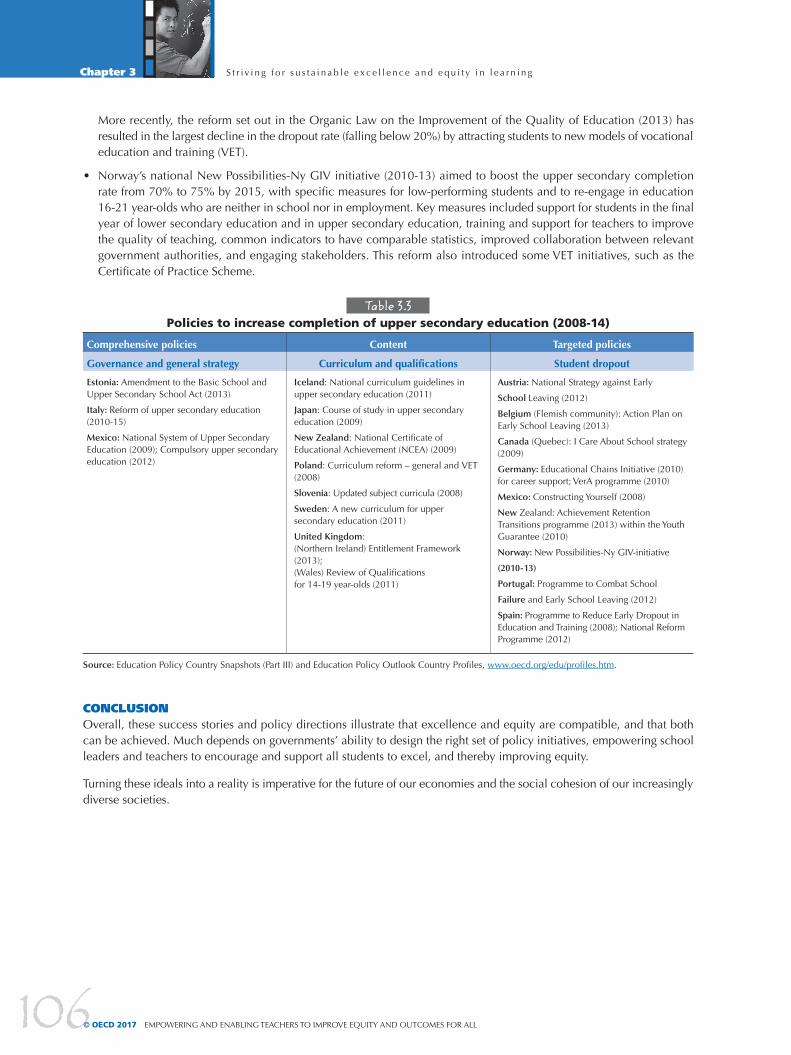
S t r i v i n g f o r s u s t a i n a b l e e x c e l l e n c e a n d e q u i t y i n l e a r n i n gChapter 3
106© OECD 2017 EMPOWERING AND ENABLING TEACHERS TO IMPROVE EQUITY AND OUTCOMES FOR ALL
More recently, the reform set out in the Organic Law on the Improvement of the Quality of Education (2013) has resulted in the largest decline in the dropout rate (falling below 20%) by attracting students to new models of vocational education and training (VET).
• Norway’s national New Possibilities-Ny GIV initiative (2010-13) aimed to boost the upper secondary completion rate from 70% to 75% by 2015, with specific measures for low-performing students and to re-engage in education 16-21 year-olds who are neither in school nor in employment. Key measures included support for students in the final year of lower secondary education and in upper secondary education, training and support for teachers to improve the quality of teaching, common indicators to have comparable statistics, improved collaboration between relevant government authorities, and engaging stakeholders. This reform also introduced some VET initiatives, such as the Certificate of Practice Scheme.
Table 3.3Policies to increase completion of upper secondary education (2008-14)
Comprehensive policies Content Targeted policies
Governance and general strategy Curriculum and qualifications Student dropout
Estonia: Amendment to the Basic School and Upper Secondary School Act (2013)
Italy: Reform of upper secondary education (2010-15)
Mexico: National System of Upper Secondary Education (2009); Compulsory upper secondary education (2012)
Iceland: National curriculum guidelines in upper secondary education (2011)
Japan: Course of study in upper secondary education (2009)
New Zealand: National Certificate of Educational Achievement (NCEA) (2009)
Poland: Curriculum reform – general and VET (2008)
Slovenia: Updated subject curricula (2008)
Sweden: A new curriculum for upper secondary education (2011)
United Kingdom: (Northern Ireland) Entitlement Framework (2013); (Wales) Review of Qualifications for 14-19 year-olds (2011)
Austria: National Strategy against Early
School Leaving (2012)
Belgium (Flemish community): Action Plan on Early School Leaving (2013)
Canada (Quebec): I Care About School strategy (2009)
Germany: Educational Chains Initiative (2010) for career support; VerA programme (2010)
Mexico: Constructing Yourself (2008)
New Zealand: Achievement Retention Transitions programme (2013) within the Youth Guarantee (2010)
Norway: New Possibilities-Ny GIV-initiative
(2010-13)
Portugal: Programme to Combat School
Failure and Early School Leaving (2012)
Spain: Programme to Reduce Early Dropout in Education and Training (2008); National Reform Programme (2012)
Source: Education Policy Country Snapshots (Part III) and Education Policy Outlook Country Profiles, www.oecd.org/edu/profiles.htm.
CONCLUSIONOverall, these success stories and policy directions illustrate that excellence and equity are compatible, and that both can be achieved. Much depends on governments’ ability to design the right set of policy initiatives, empowering school leaders and teachers to encourage and support all students to excel, and thereby improving equity.
Turning these ideals into a reality is imperative for the future of our economies and the social cohesion of our increasingly diverse societies.
S t r i v i n g f o r s u s t a i n a b l e e x c e l l e n c e a n d e q u i t y i n l e a r n i n g Chapter 3
107EMPOWERING AND ENABLING TEACHERS TO IMPROVE EQUITY AND OUTCOMES FOR ALL © OECD 2017
ReferencesArcher, L., J. Dewitt and J. Osborne (2015), “Is science for us? Black students’ and parents’ views of science and science careers”, Science Education, Vol. 99/2, pp. 199-237, http://dx.doi.org/10.1002/sce.21146.
Alexander, J.M., K.E. Johnson and K. Kelley (2012), “Longitudinal analysis of the relations between opportunities to learn about science and the development of interests related to science”, Science Education, Vol. 96/5, pp. 763-786, http://dx.doi.org/10.1002/sce.21018.
Australian Early Development Census (2015), Australian Early Development Census National Report 2015, A Snapshot of Early Childhood Development in Australia, Department of Education and Training, Canberra, Australia, www.aedc.gov.au/Websilk/Handlers/ResourceDocument.ashx?id=45cf2664-db9a-6d2b-9fad-ff0000a141dd.
Avvisati, F. et al. (2014), “Getting parents involved: A field experiment in deprived schools”, The Review of Economic Studies, Vol. 81/1, pp. 57-83, https://dx.doi.org/10.1093/restud/rdt027.
Bianchi, S. et al. (2004) “Inequality in parental investment in child-rearing: Expenditures, time and health”, in K. Neckerman (ed.), Social Inequality, Russell Sage Foundation, New York, NY, pp. 189-219.
Buchmann, C. and Parrado, E. (2006), “Educational achievement of immigrant-origin and native students: A comparative analysis informed by institutional theory”, International Perspectives on Education and Society, Vol. 7, pp. 345-377, http://dx.doi.org/10.1016/S1479-3679(06)07014-9.
Cannady, M.A., E. Greenwald and K.N. Harris (2014), “Problematizing the STEM pipeline metaphor: is the STEM pipeline metaphor serving our students and the STEM workforce?”, Science Education, Vol. 98/3, pp. 443-460, http://dx.doi.org/10.1002/sce.21108.
Christensen, G. and P. Stanat (2007), “Language Policies and Practices for Helping Immigrants and Second-Generation Students Succeed”, Transatlantic Taskforce on Immigration and Integration, Migration Policy Institute (MPI) and Bertelsmann Stiftung.
Council of Ministers of Education (Canada) (2011), OECD Country Background Report: Overcoming School Failure (Equity) In Canada, Council of Ministers of Education, Canada.
DeWitt, J. and L. Archer (2015), “Who aspires to a science career? A comparison of survey responses from primary and secondary school students”, International Journal of Science Education, Vol. 37/13, pp. 2170-2192, http://dx.doi.org/10.1080/09500693.2015.1071899.
EC (European Commission) (2014a), Europe 2020 website, http://ec.europa.eu/europe2020/index_en.htm (accessed 15 September 2014).
EC (2014b), “Overview of Europe 2020 targets”, http://ec.europa.eu/europe2020/pdf/targets_en.pdf (accessed 15 September 2014).
EC (2013), “Reducing early school leavers: Key messages and policy support”, Education and Training, November 2013, http://ec.europa.eu/education/policy/strategic-framework/doc/esl-group-report_en.pdf (accessed 15 September 2014).
Feinstein, L., K. Duckworth and R. Sabates (2008), Education and the Family: Passing Success across the Generations, Routledge, London, United Kingdom.
Heath, A. and Y. Brinbaum (Eds.). (2014). Unequal Attainments. Ethnic Educational Inequalities in Ten Western Countries, Oxford University Press/Proceedings of the British Academy, Oxford.
Jæger, M.M. and R. Breen (2016), “A dynamic model of cultural reproduction”, American Journal of Sociology, Vol. 121/4, pp. 1079-1115, http://dx.doi.org/10.1086/684012.
Kashefpakdel, E.T. and C. Percy (2016), “Career education that works: an economic analysis using the British Cohort Study”, Journal of Education and Work, http://dx.doi.org/10.1080/13639080.2016.1177636.
Legewie, J. and T.A. DiPrete (2014). “The High School Environment and the Gender Gap in Science and Engineering”, Sociology of Education, Vol. 87/4, pp. 259-280, http://dx.doi.org/10.1177/0038040714547770.
Maltese, A.V., C.S. Melki and H.L. Wiebke (2014), “The nature of experiences responsible for the generation and maintenance of interest in STEM”, Science Education, Vol. 98/6, pp. 937-962, http://dx.doi.org/10.1002/sce.21132.
Nusche, D. (2009), “What works in migrant education? A review of evidence and policy options”, OECD Education Working Papers, No. 22, OECD Publishing, Paris, http://dx.doi.org/10.1787/227131784531.
OECD (forthcoming), Starting Strong V: Transition from ECEC to primary schooling, OECD Publishing, Paris.
OECD (2016a), Education at a Glance 2016: OECD Indicators, OECD Publishing, Paris, http://dx.doi.org/10.1787/eag-2016-en.
OECD (2016b), PISA 2015 Results (Volume I): Excellence and Equity in Education, OECD Publishing, Paris, http://dx.doi.org/10.1787/ 9789264266490-en.
OECD (2016c), PISA 2015 Results (Volume II): Policies and Practices for Successful Schools, OECD Publishing, Paris, http://dx.doi.org/10.1787/9789264267510-en.
S t r i v i n g f o r s u s t a i n a b l e e x c e l l e n c e a n d e q u i t y i n l e a r n i n gChapter 3
108© OECD 2017 EMPOWERING AND ENABLING TEACHERS TO IMPROVE EQUITY AND OUTCOMES FOR ALL
OECD (2016d), International Migration Outlook 2016, OECD Publishing, Paris, http://dx.doi.org/10.1787/migr_outlook-2016-en.
OECD (2015a), Education Policy Outlook 2015: Making Reforms Happen, OECD Publishing, Paris, http://dx.doi.org/10.1787/ 9789264225442-en.
OECD (2015b), International Migration Outlook 2015, OECD Publishing, Paris, http://dx.doi.org/10.1787/migr_outlook-2015-en.
OECD (2015c), Immigrant Students at School: Easing the Journey towards Integration, OECD Publishing, http://dx.doi.org/10.1787/ 9789264249509-en.
OECD (2014a), TALIS 2013 Results: An International Perspective on Teaching and Learning, TALIS, OECD Publishing, Paris, http://dx.doi.org/10.1787/9789264196261-en.
OECD (2014b)), Education at a Glance 2014: OECD Indicators, OECD Publishing, Paris, http://dx.doi.org/10.1787/eag-2014-en.
OECD (2013a), PISA 2012 Results: Excellence through Equity: Giving Every Student the Chance to Succeed (Volume II), OECD Publishing, Paris, http://dx.doi.org/10.1787/9789264201132-en.
OECD (2013b), Trends Shaping Education 2013, OECD Publishing, Paris, http://dx.doi.org/10.1787/trends_edu-2013-en.
OECD (2012a), Starting Strong III: A Quality Toolbox for Early Childhood Education and Care, OECD Publishing, Paris, http://dx.doi.org/10.1787/9789264123564-en.
OECD (2012b), Untapped Skills: Realising the Potential of Immigrant Students, OECD Publishing, Paris, http://dx.doi.org/10.1787/ 9789264172470-en.
OECD (2012c), Better Skills, Better Jobs, Better Lives: A Strategic Approach to Skills Policies, OECD Publishing, Paris, http://dx.doi.org/10.1787/9789264177338-en.
OECD (2010), Closing the Gap for Immigrant Students: Policies, Practice and Performance, OECD Publishing, Paris, http://dx.doi.org/ 10.1787/9789264075788-en.
OECD (2008), Encouraging Student Interest in Science and Technology Studies, OECD Publishing, Paris, http://dx.doi.org/10.1787/ 9789264040892-en.
OECD (2006), Starting Strong II: Early Childhood Education and Care, OECD Publishing, Paris, http://dx.doi.org/10.1787/9789264035461-en.
OECD (2004), Career Guidance and Public Policy: Bridging the Gap, OECD Publishing, Paris, http://dx.doi.org/10.1787/9789264105669-en.
OECD/European Union (2015), Indicators of Immigrant Integration 2015: Settling In, OECD Publishing, Paris, http://dx.doi.org/10.1787/ 9789264234024-en.
Wang, M-T. and J.L. Degol (2016), “Gender gap in science, technology, engineering, and mathematics (STEM): Current knowledge, implications for practice, policy, and future directions”, Educational Psychology Review, pp. 1-22, http://dx.doi.org/10.1007/s10648-015-9355-x.

OECD PUBLISHING, 2, rue André-Pascal, 75775 PARIS CEDEX 16
(91 2017 03 1P) ISBN 978-92-64-27322-1 – 2017
The OECD is a unique forum where governments work together to address the economic, social and
environmental challenges of globalisation. The OECD is also at the forefront of efforts to understand and
to help governments respond to new developments and concerns, such as corporate governance, the
information economy and the challenges of an ageing population. The Organisation provides a setting
where governments can compare policy experiences, seek answers to common problems, identify good
practice and work to co-ordinate domestic and international policies.
The OECD member countries are: Australia, Austria, Belgium, Canada, Chile, the Czech Republic,
Denmark, Estonia, Finland, France, Germany, Greece, Hungary, Iceland, Ireland, Israel, Italy, Japan, Korea,
Latvia, Luxembourg, Mexico, the Netherlands, New Zealand, Norway, Poland, Portugal, the Slovak Republic,
Slovenia, Spain, Sweden, Switzerland, Turkey, the United Kingdom and the United States. The European Union
takes part in the work of the OECD.
OECD Publishing disseminates widely the results of the Organisation’s statistics gathering and research
on economic, social and environmental issues, as well as the conventions, guidelines and standards agreed
by its members.
ORGANISATION FOR ECONOMIC CO-OPERATIONAND DEVELOPMENT

International Summit on the Teaching Profession
Empowering and Enabling Teachers to Improve Equity and Outcomes for All Despite increased funding and many reforms, most education systems are still seeking ways to better prepare their students for a world in which technological change and the digital revolution are changing the way we work, live and relate to one another.
Education systems that have succeeded in improving student outcomes show that the way forward is by making teachers the top priority. The adaptability of education systems and their ability to evolve ultimately depends on enabling teachers to transform what and how students learn. This requires strong support and training for teachers, both before and after they enter the profession, with new forms of professional development to help teachers engage in more direct instruction and adapt it to the needs of their diverse classrooms.
Education systems need to perform well in two dimensions: excellence and equity. Many high performers do well on both, demonstrating that they are not mutually exclusive. To do so requires specific measures to overcome factors that can hinder student performance, such as socio-economic background, immigrant status and gender.
Contents
Chapter 1. Professional learning and development to support teachers’ work
Chapter 2. Ensuring appropriate national structures and policy environment
Chapter 3. Striving for sustainable excellence and equity in learning
ISBN 978-92-64-27322-191 2017 03 1P
Consult this publication on line at: http://dx.doi.org/9789264273238-en
This work is published on the OECD iLibrary, which gathers all OECD books, periodicals and statistical databases. Visit www.oecd-ilibrary.org and do not hesitate to contact us for more information.