international trade report
TRANSCRIPT


Publication date: 22 December 2016

1
Executive Summary International Trade Report. October 2016

2
Executive Summary International Trade Report. October 2016
OCTOBER 2016
In October 2016, Spain’s exports decreased by 1.6% year-on-year in nominal terms to 21,806.8 million
euros, whereas imports declined by 1.7% to 23,640.4 million euros. With seasonally adjusted data,
exports grew by 0.9% year-on-year and imports by 0.8%. In real terms, exports grew by 1.0% year-on-
year, as export prices decreased by 2.6%, and imports diminished by 0.9%, as import prices dropped by
0.9%. In nominal terms on a month-on-month basis, exports increased by 1.8% and imports declined by
0.1%. With seasonally adjusted data, exports increased by 0.8% month-on-month and imports rose by
2.6%.
Exports (% year-on-year)
-40
-20
0
20
40
2011 2012 2013 2014 2015 2016
original
trend-cycle
Imports (% year-on-year)
-40
-20
0
20
40
2011 2012 2013 2014 2015 2016
original
trend-cycle
Spain’s trade balance registered a deficit of
1,833.6 million euros, down from a deficit of
1,888.2 million euros in October 2015 (provisional
data). The export/import coverage ratio reached
92.2%, equal value as in October of 2015 with
provisional data. The non-energy trade balance
reached a deficit of 619.6 million euros, in contrast
to a surplus of 129.3 million in the same month of
2015. The energy trade deficit fell by 39.8%
year-on-year to 1,214.0 million euros (compared
to a deficit of 2,017.5 million euros in October
2015).
Trade balance (M€) and coverage ratio (%)
60%
70%
80%
90%
100%
110%
120%
-10,000
-8,000
-6,000
-4,000
-2,000
0
2011 2012 2013 2014 2015 2016
Trade Balance
Coverage ratio
Sectoral data
Spain’s main exporting sectors in October 2016 were capital goods (representing 19.5% of total exports
and declining by 4.1% year-on-year), vehicles (18.3% of total, decreasing by 0.8%), food, beverages and
tobacco (15.9% of total, advancing by 3.0%) and chemical products (13.6% of total, diminishing by 2.2%).

3
Executive Summary International Trade Report. October 2016
Exports (% of total)
15.2
4.62.2
11.0
13.720.1
18.1
1.810.5
2.9
15.9
6.2
2.6
9.8
13.619.5
18.3
1.8
10.71.6
OtherConsumption
goods
Durable goods
Vehicles
Capital goods Chemical
products
Semi-manuf. (non-chem.)
Raw Materials
Energy
Food, beverages and
tobacco
OCTOBER 2015
OCTOBER2016
Imports (% of total)
11.6
12.6
3.5
6.9
15.521.7
13.1
2.812.0
0.3
11.3
10.8
3.6
7.2
15.122.4
12.9
3.0
13.20.5Durable
goods
Vehicles
Capital goods
Chemical products
Semi-manuf.
(non-chem.)
Raw Materials
Energy
OtherConsumption
goods
Food, beveragesand tobacco
OCTOBER2015
OCTOBER2016
The most significant sectors of Spain’s imports were capital goods (representing 22.4% of total imports
and rising by 1.7% year-on-year), chemical products (15.1% of total, shrinking by 4.1%), consumption
goods (13.2% of total, surging by 7.7%) and vehicles (12.9% of total, decreasing by 2.9%).
Among subsectors, the largest contributions to the annual change in Spain’s exports in October 2016
(down by 1.6%) came from oil and by-products (1.7 points), engines (0.5 points) and road transport
equipment (0.5 points). The major negative contributions corresponded to iron and steel (-0.8 points),
general purpose equipment (-0.5 points) and electrical machinery (-0.5 points).
Exports (top/bottom contrib. to annual change, p.p.)
-0.8
-0.5
-0.5
-0.5
-0.3
-0.3
-0.3
-0.2
-0.2
-0.2
0.1
0.2
0.3
0.3
0.4
0.4
0.4
0.5
0.5
1.7
-1.0 -0.5 0.0 0.5 1.0 1.5 2.0
iron and steel
general purpose equipment
electrical machinery
automotive parts and accessories
other capital goods
non-ferrous metals
plastics
toys
railway transport equipment
fruits, vegetables and legumes
other chemical products
ships
garment
meat products
minerals
cars and motorcycles
oils and fats
road transport equipment
engines
oil and by-products
Imports (top/bottom contrib. to annual change, p.p.)
-1.0
-0.6
-0.5
-0.4
-0.4
-0.4
-0.3
-0.3
-0.2
-0.2
0.1
0.1
0.1
0.2
0.2
0.2
0.3
0.5
0.5
0.6
-1.5 -1.0 -0.5 0.0 0.5 1.0
gas
oil and by-products
organic
automotive parts and accessories
other food products
coal and electricity
general purpose equipment
plastics
electrical machinery
inorganic
iron and steel
tobacco
footwear
electrical appliances
non-ferrous metals
toys
precision equipment
garment
medicines
aircraft
The subsectors with the most positive contribution to the annual change in Spain’s imports in October
2016 (down by 1.7%) were aircraft (0.6 points), medicines (0.5 points) and garment (0.5 points). The major
negative contributions corresponded to gas (-1.0 points), oil and by-products (-0.6 points) and organic
chemical products (-0.5 points).

4
Executive Summary International Trade Report. October 2016
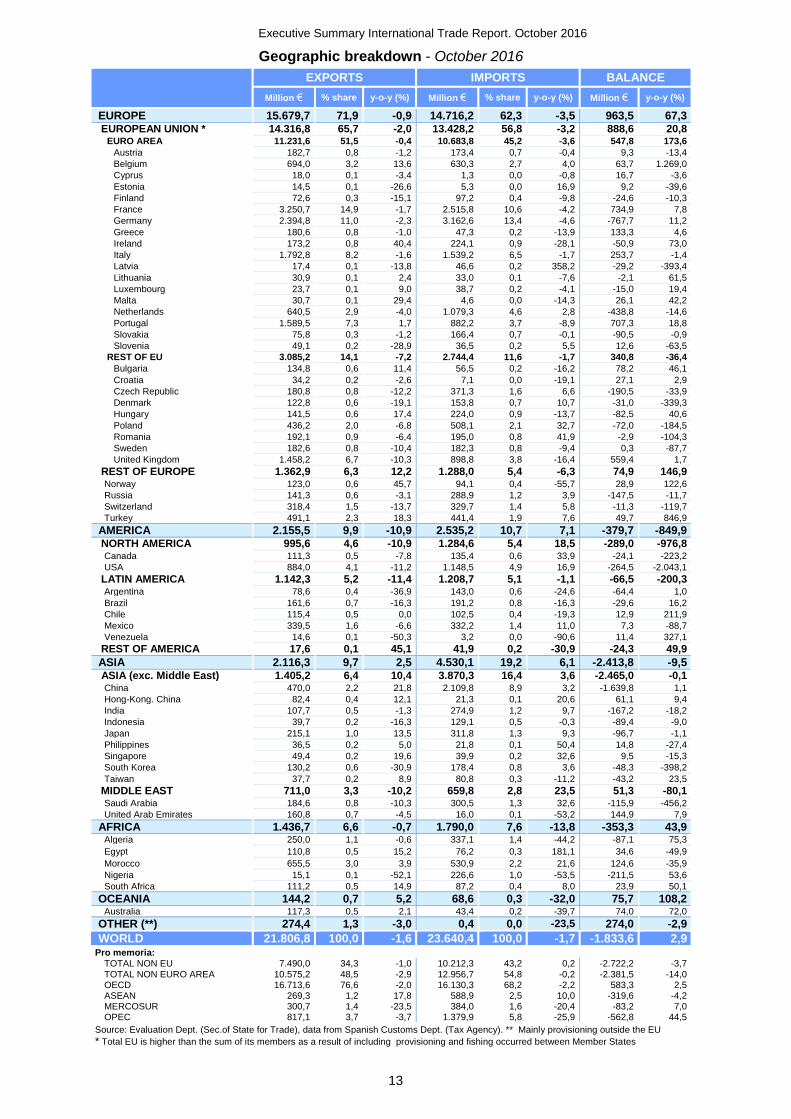
Geographic data
Exports to the European Union accounted for 65.7% of total exports in October 2016 (down from 65.9%
in October 2015) and shrank by 2.0% year-on-year. Exports to the euro area accounted for 51.5% (up
from 50.9% in October 2015) and declined by 0.4%. Exports to non-EU countries accounted for 34.3%
of total exports (up from 34.1% in October 2015) as they declined by 1.0% year-on-year.
Exports (% of total)
Imports (% of total)
Imports from the European Union accounted for 56.8% of total imports in October 2016 (down from 57.6%
in October 2015) and dropped by 3.2% year-on-year. Imports from the euro area represented 45.2% (down
from 46.0% in October 2015) and declined by 3.6%. Imports from non-EU countries accounted for 43.2%
of total imports in October 2016 (up from 42.4% in October 2015) as they augmented by 0.2% year-on-
year.
Exports EU and extra-EU (% y-o-y trend-cycle)
-40
-20
0
20
40
2011 2012 2013 2014 2015 2016
Total
EU-28
Extra-EU-28
Imports EU and extra-EU (% y-o-y trend-cycle)
-40
-20
0
20
40
2011 2012 2013 2014 2015 2016
Total
EU-28
Extra-EU-28
Trade balance with the European Union showed in October 2016 a surplus of 888.6 million euros (up
from a surplus of 735.7 million in October 2015) and a surplus of 547.8 million euros with the euro area
(200.2 million surplus in October 2015). Trade deficit with the rest of the world increased to 2,722.2
million euros (from a deficit of 2,623.9 million euros in October 2015).
50,9
15,0
5,5
10,9
9,3
6,5 0,61,3
51,5
14,1
6,3
9,9
9,7
6,60,7
1,3
OCTOBER2016
Asia
Rest of EU
America
Rest of Europe
Euro area
Africa
OCTOBER2015
Oceania Other
46,0
11,65,7
9,8
17,7
8,60,4
0,0
45,2
11,6
5,4
10,7
19,2
7,60,3
0,0
OCTOBER2015
OCTOBER2016
Rest of EU
Rest of Europe
America
Asia
Africa
Euro area
Oceania Other

5
Executive Summary International Trade Report. October 2016
The destinations with the largest contributions to the annual change in Spain’s exports in October
2016 (down by 1.6%) were China (0.4 percentage points), Belgium (0.4 points), Turkey (0.3 points) and
Iceland (0.3 points). Those destinations with the largest negative contributions were the United Kingdom
(-0.8 points), the United States (-0.5 points), Oman (-0.5 points) and South Korea (-0.3 points).
Exports (top/bottom contrib. to annual change, p.p.)
-0.8
-0.5
-0.5
-0.3
-0.3
-0.3
-0.2
-0.2
-0.2
-0.1
0.1
0.1
0.1
0.1
0.2
0.2
0.3
0.3
0.4
0.4
-1.0 -0.8 -0.6 -0.4 -0.2 0.0 0.2 0.4 0.6
UK
USA
Oman
South Korea
Germany
France
Switzerland
Argentina
Cuba
Poland
Morocco
Japan
Portugal
Malaysia
Norway
Ireland
Iceland
Turkey
Belgium
China
Imports (top/bottom contrib. to annual change, p.p.)
-1.1
-1.1
-0.7
-0.7
-0.6
-0.5
-0.5
-0.4
-0.4
-0.2
0.2
0.2
0.2
0.3
0.3
0.4
0.5
0.5
0.5
0.7
-1.5 -1.0 -0.5 0.0 0.5 1.0
Algeria
Nigeria
UK
Angola
Germany
Norway
France
Ireland
Portugal
Argentina
Egypt
Iraq
Romania
China
Saudi Arabia
Morocco
Libya
Poland
Equatorial Guinea
USA
Regarding imports, the countries with the largest contributions to the annual change in Spain’s
imports in October 2016 (down by 1.7%) were the United States (0.7 percentage points), Equatorial
Guinea (0.5 points), Poland (0.5 points) and Libya (0.5 points). The destinations with the largest negative
contributions were Algeria (-1.1 points), Nigeria (-1.1 points), the United Kingdom (-0.7 points) and Angola
(-0.7 points).
International data
In comparison to other geographical areas, Spain’s exports of goods decreased by 1.6% year-on-year
in October, a smaller decrease than those of the euro area (-4.0%) and the European Union (-4.5%). Within
the European Union, exports also decreased in Germany (-4.1%), France (-8.2%) and Italy (-2.2%), but
they increased in the United Kingdom (6.7%). Outside the European Union, the United States exports
decreased by 1.2% year-on-year, China’s by 7.6% and Japan’s by 10.3%.

6
Executive Summary International Trade Report. October 2016
JANUARY – OCTOBER 2016
Spain’s exports increased by 0.9% in the period of January-October 2016 compared to the same period
of 2015 to 210,292.0 million euros, whereas imports decreased by 1.6% year-on-year to 225,352.8 million
euros. In real terms, exports rose by 3.0% year-on-year, as export prices diminished by 2.0%, and imports
advanced by 2.4% year-on-year, as import prices fell by 3.8%.
Spain’s trade deficit decreased to 15,060.7 million euros compared to the same period of 2015 (deficit of
20,530.3 million euros). The export/import coverage ratio reached 93.3%, 2.3 percentage points higher
than in the same period of 2015 (91.0%, provisional data). The non-energy trade balance reached a
deficit of 1,797.5 million euros, compared to a surplus of 2,163.3 million euros in January-October 2015,
whereas the energy trade deficit declined by 41.6% year-on-year to 13,263.2 million euros.
Sectoral data
Spain’s main exporting sectors in the period of January-October were capital goods (representing 20.1%
of total exports, advancing by 1.5% year-on-year), vehicles (18.0% of total, surging by 7.4%), food,
beverages and tobacco (16.7% of total, increasing by 5.9%) and chemical products (14.3% of total,
declining by 0.6%).
Exports (% of total)
15.9
5.12.3
10.6
14.619.9
16.9
1.69.7
3.3
16.7
5.0
2.2
10.1
14.320.1
18.0
1.7
10.21.7
Consumption goods
Durable goods
Vehicles
Capital goods
J-O2015
Chemical products
Semi-manuf. (non-chem.)
Raw materials
Energy
Food, beveragesand tobacco
Other
JAN-OCT2016
Imports (% of total)
11.1
14.5
3.5
7.0
16.119.9
13.0
2.612.0
0.3
11.7
10.5
3.2
6.9
15.821.7
13.8
2.8
13.00.5Durable
goods
Consumptiongoods
Other Food, beveragesand tobacco
Energy
Raw materials
Semi-manuf.(non-chem.)
Chemical products
Capital goods
Vehicles
JAN-OCT2016
J-O2015
The largest shares by sector of Spain’s imports were those of capital goods (representing 21.7% of
total and advancing by 7.3% year-on-year), chemical products (15.8% of total imports, declining by 2.9%),
vehicles (13.8% of total imports, advancing by 4.4%) and consumption goods (13.0% of total imports,
advancing by 6.4%).
Among subsectors, the largest contributions to the annual change in Spain’s exports (up by 0.9%) were
cars and motorcycles (1.2 percentage points), road transport equipment (0.6 points) and garment (0.4
points). On the other hand, the major negative contributions by subsectors corresponded to iron and steel
(-0.4 points), medicines (-0.2 points), and coal and electricity (-0.2 points).

7
Executive Summary International Trade Report. October 2016
Exports (top/bottom contrib. to annual change, p.p.)
-0.4
-0.2
-0.2
-0.2
-0.2
-0.1
-0.1
-0.1
-0.1
-0.1
0.1
0.1
0.2
0.2
0.2
0.3
0.3
0.4
0.6
1.2
-0.5 0.0 0.5 1.0 1.5
iron and steel
medicines
coal and electricity
gas
aircraft
minerals
electrical machinery
footwear
non-ferrous metals
specific purpose equipment
fishery products
other consumption goods
fruits, vegetables and legumes
other chemical products
oils and fats
meat products
oil and by-products
garment
road transport equipment
cars and motorcycles
Imports (top/bottom contrib. to annual change, p.p.)
-3.1
-0.8
-0.3
-0.3
-0.3
-0.3
-0.2
-0.1
-0.1
-0.1
0.1
0.1
0.2
0.2
0.2
0.2
0.3
0.4
0.5
0.7
-4.0 -3.0 -2.0 -1.0 0.0 1.0
oil and by-products
gas
minerals
medicines
coal and electricity
iron and steel
automotive parts and accessories
fertilizers
organic
inorganic
precision equipment
road transport equipment
specific purpose equipment
other capital goods
fishery products
fruits, vegetables and legumes
general purpose equipment
aircraft
garment
cars and motorcycles
The subsectors with most positive contributions to the annual change in Spain’s imports in January-
October 2016 (down by 1.6%) were cars and motorcycles (0.7 points), garment (0.5 points) and aircraft
(0.4 points). The major negative contributions corresponded to oil and by-products (-3.1 points), gas (-0.8
points) and minerals (-0.3 points).
Geographic data
Exports to the European Union accounted for 66.4% of total exports in the period (up from 64.8% in the
same period of 2015) and increased by 3.3% year-on-year, while exports to the euro area accounted for
51.7% of total (50.5% in the same period of 2015) and went up by 3.2%. Exports to the rest of the world
accounted for 33.6% of total exports (35.2% in the same period of 2015) and fell by 3.5% year-on-year.
Exports (% of total)
50.5
14.3
5.7
11.3
9.5
6.50.8
1.5
51.7
14.7
5.7
10.4
9.4
6.30.6
1.1
J-O 2015
JAN-OCT2016
Rest of EU
Rest ofEurope
America
Asia
Africa
Euro area
Oceania Other
Imports (% of total)
44.3
11.35.4
10.8
19.0
8.90.3
0.0
45.7
11.4
5.6
10.2
19.6
7.30.3
0.0
J-O2015
JAN-OCT2016
Asia
America
Africa
Euro area
Rest ofEurope Rest of EU
OtherOceania
Imports from the European Union accounted for 57.1% of total imports in January-October 2016 (up from
55.5% in the same period of 2015) and increased by 1.2% year-on-year. Imports from the euro area

8
Executive Summary International Trade Report. October 2016
accounted for 45.7% (44.3% in the same period of 2015) and grew by 1.7%. Imports from the rest of the
world accounted for 42.9% of total (44.5% in the same period of 2015) and fell by 5.1% year-on-year.
Spain’s trade surplus with the European Union and with the euro area increased to 10,858.6 million
euros and to 5,616.7 million euros respectively, up from surpluses of 8,012.5 million and 3,966.5 million
euros in the same period of the previous year. The trade deficit with the rest of the world decreased by
9.2% year-on-year to 25,919.3 million euros.
In terms of contribution to the annual change of exports (up by 0.9%), the main contributions were
those of Italy (0.6 percentage points), Germany (0.6 points), Belgium (0.5 points) and the United Kingdom
(0.5 points). Those destinations with the largest negative contributions were France (-0.4 points), Saudi
Arabia (-0.3 points), Argentina (-0.2 points), and Brazil (-0.2 points).
Exports (top/bottom contrib. to annual change, p.p.)
-0.4
-0.3
-0.2
-0.2
-0.2
-0.1
-0.1
-0.1
-0.1
-0.1
0.1
0.1
0.1
0.2
0.2
0.3
0.5
0.5
0.6
0.6
-0.6 -0.4 -0.2 0.0 0.2 0.4 0.6 0.8
France
Saudi Arabia
Argentina
Brazil
Gibraltar
USA
Australia
Mexico
Bulgaria
Greece
Austria
Norway
Romania
Ireland
China
Morocco
UK
Belgium
Germany
Italy
Imports (top/bottom contrib. to annual change, p.p.)
-0.7
-0.6
-0.5
-0.4
-0.2
-0.2
-0.2
-0.2
-0.2
-0.1
0.1
0.1
0.2
0.2
0.2
0.2
0.2
0.2
0.2
0.3
-0.8 -0.6 -0.4 -0.2 0.0 0.2 0.4
Algeria
Nigeria
Angola
UK
Saudi Arabia
Venezuela
Kazakhstan
Colombia
Mexico
Ireland
Czech Republic
Turkey
Japan
Switzerland
Poland
France
Iran
Italy
Morocco
Germany
Regarding imports, the countries with the largest contribution to the annual change in Spain’s imports
in the period (down by 1.6%) were Germany (0.3 percentage points), Morocco (0.2 points), Italy (0.2 points)
and Iran (0.2 points). The destinations with the largest negative contributions were Algeria (-0.7 points),
Nigeria (-0.6 points), Angola (-0.5 points) and the United Kingdom (-0.4 points).
In the period January-October, the number of Spanish exporters grew by 1.3% year-on-year to 134,030
exporters, out of which 35,967 had already exported at least 50,000 euros worth of goods in the period,
0.5% less than in the same period of 2015. With regard to regular exporters (those that have already
exported in the current year as well as in each of the three preceding years), they amounted to 48,861 in
the period, 36.5% of total exporters and 4.1% more than in the same period of 2015. Their exports reached
198,856.2 million, 94.6% of total exports and 1.9% more than in the same period of the previous year.
International data
In comparison to other geographical areas, Spain’s exports of goods increased by 0.9% year-on-year
in the period of January-October 2016. By contrast, the euro area´s exports decreased by 0.4% and the
European Union´s by 1.2%. Within the European Union, exports also increased in Germany (0.3%) and
Italy (0.2%), whereas those of France and the United Kingdom fell by 2.2% and 3.2% respectively. Outside
the European Union, the United States exports decreased by 4.6%, China’s by 6.9% and Japan’s by 9.3%.

9
Executive Summary International Trade Report. October 2016
12 - MONTH ACCUMULATED FLOWS
70
75
80
85
90
95
100
-100,000
-50,000
0
50,000
100,000
150,000
200,000
250,000
300,000
N D J F M A M J J A S O N D J F M A M J J A S O N D J F M A M J J A S O N D J F M A M J J A S O
2012 2013 2014 2015 2016%M€
Imports Exports Trade Balance Coverage ratio
-250,000
-200,000
-150,000
-100,000
-50,000
0
50,000
100,000
150,000
200,000
250,000
N D J F M A M J J A S O N D J F M A M J J A S O N D J F M A M J J A S O N D J F M A M J J A S O
2012 2013 2014 2015 2016M€
Energy Exports Energy Imports Non-energy ExportsNon-energy Trade Balance Non-energy Imports Energy Trade Balance
-200,000
-150,000
-100,000
-50,000
0
50,000
100,000
150,000
200,000
N D J F M A M J J A S O N D J F M A M J J A S O N D J F M A M J J A S O N D J F M A M J J A S O
2012 2013 2014 2015 2016M€
Extra-EU Exports Extra-EU Imports EU ExportsUE Imports EU Trade Balance Extra-EU Trade Balance

10
Executive Summary International Trade Report. October 2016
STATISTICAL ANNEX
COVERAGE
RATIO
Million €%
m-o-m
%
y-o-yMillion €
%
m-o-m
%
y-o-yMillion €
%
m-o-m
%
y-o-y%
2007 185.023,2 8,6 285.038,3 8,5 -100.015,1 -8,4 64,9
2008 189.227,9 2,3 283.387,8 -0,6 -94.159,9 5,9 66,8
2009 159.889,6 -15,5 206.116,2 -27,3 -46.226,6 50,9 77,6
2010 186.780,1 16,8 240.055,9 16,5 -53.275,8 -15,2 77,8
2011 215.230,4 15,2 263.140,7 9,6 -47.910,4 10,1 81,8
2012 226.114,6 5,1 257.945,6 -2,0 -31.831,0 33,6 87,7
2013 235.814,1 4,3 252.346,8 -2,2 -16.532,7 48,1 93,4
2014 240.581,8 2,0 265.556,6 5,2 -24.974,8 -51,1 90,6
2015 249.794,4 3,8 274.772,3 3,5 -24.977,9 0,0 90,9
12 last months* 252.102,9 1,8 270.807,2 -0,3 -18.704,3 21,8 93,1
2007 (Jan-Oct) 154.530,3 9,5 236.992,5 9,0 -82.462,2 -8,2 65,2
2008 (Jan-Oct) 162.305,9 5,0 245.226,9 3,5 -82.921,1 -0,6 66,2
2009 (Jan-Oct) 132.436,3 -18,4 169.486,1 -30,9 -37.049,8 55,3 78,1
2010 (Jan-Oct) 153.551,3 15,9 197.261,4 16,4 -43.710,1 -18,0 77,8
2011 (Jan-Oct) 179.297,9 16,8 218.904,2 11,0 -39.606,3 9,4 81,9
2012 (Jan-Oct) 188.515,3 5,1 217.447,4 -0,7 -28.932,1 27,0 86,7
2013 (Jan-Oct) 198.279,2 5,2 210.794,7 -3,1 -12.515,5 56,7 94,1
2014 (Jan-Oct) 201.134,5 1,4 222.761,1 5,7 -21.626,6 -72,8 90,3
2015 (Jan-Oct) 208.198,3 3,5 229.401,3 3,0 -21.202,9 2,0 90,8
2016 (Jan-Oct)* 210.292,0 0,9 225.352,8 -1,6 -15.060,7 26,6 93,3
2007 (Oct) 17.303,5 16,5 13,9 26.536,3 11,7 11,7 -9.232,8 -3,6 -7,9 65,2
2008 (Oct) 16.681,5 1,6 -3,6 24.813,2 2,4 -6,5 -8.131,6 -4,0 11,9 67,2
2009 (Oct) 14.870,3 6,8 -10,9 18.868,4 -0,1 -24,0 -3.998,2 19,6 50,8 78,8
2010 (Oct) 17.142,1 6,5 15,3 20.933,4 2,3 10,9 -3.791,3 13,1 5,2 81,9
2011 (Oct) 18.084,8 -2,2 5,5 21.460,1 -6,1 2,5 -3.375,3 22,5 11,0 84,3
2012 (Oct) 20.911,6 14,8 15,6 22.586,0 8,1 5,2 -1.674,4 37,2 50,4 92,6
2013 (Oct) 21.286,2 12,5 1,8 22.646,9 5,4 0,3 -1.360,7 47,1 18,7 94,0
2014 (Oct) 22.138,6 6,5 4,0 24.723,4 5,9 9,2 -2.584,8 -1,7 -90,0 89,5
2015 (Oct) 22.074,0 4,8 -0,3 23.795,4 -0,8 -3,8 -1.721,3 41,2 33,4 92,8
2016 (Oct)* 21.806,8 1,8 -1,6 23.640,4 -0,1 -1,7 -1.833,6 17,8 2,9 92,2
2016*
January 18.267,3 -9,4 2,1 20.653,9 -5,9 0,8 -2.386,6 -33,0 8,1 88,4
February 20.390,7 11,6 2,7 22.151,7 7,3 1,2 -1.761,0 26,2 13,6 92,1
March 22.443,1 10,1 -3,3 23.238,9 4,9 -3,6 -795,9 54,8 10,6 96,6
Q1 61.101,1 -4,5 0,2 66.044,5 -5,0 -0,7 -4.943,5 10,6 10,5 92,5
April 22.244,7 -0,9 6,3 22.882,0 -1,5 -1,2 -637,3 19,9 71,7 97,2
May 22.014,1 -1,0 4,7 22.955,1 0,3 1,2 -940,9 -47,6 43,2 95,9
June 22.681,3 3,0 2,1 24.037,9 4,7 -0,9 -1.356,6 -44,2 33,7 94,4
Q2 66.940,1 9,6 4,3 69.875,0 5,8 -0,3 -2.934,8 40,6 50,7 95,8
July 21.366,4 -5,8 -9,1 21.924,2 -8,8 -12,0 -557,8 58,9 60,0 97,5
August 17.646,0 -17,4 8,9 20.206,2 -7,8 4,2 -2.560,2 -358,9 19,9 87,3
September 21.431,6 21,5 0,0 23.662,4 17,1 -1,4 -2.230,8 12,9 13,2 90,6
Q3 60.444,0 -9,7 -1,1 65.792,8 -5,8 -3,7 -5.348,8 -82,3 25,3 91,9
October 21.806,8 1,8 -1,6 23.640,4 -0,1 -1,7 -1.833,6 17,8 2,9 92,2
* Provisional
Source: Evaluation Department (Secretariat of State for Trade), data from Spanish Customs Department (Tax Agency)
Key data
EXPORTS IMPORTS BALANCE

11
Executive Summary International Trade Report. October 2016
Sector breakdown - October 2016
EXPORTS IMPORTS BALANCE
Million € % share y-o-y (%) Million € % share y-o-y (%) Million € y-o-y (%)
Food, beverages and tobacco 3.458,9 15,9 3,0 2.671,3 11,3 -4,6 787,6 40,8 Meat products 580,7 2,7 15,1 185,8 0,8 8,4 394,8 18,6
Fishery products 310,5 1,4 5,7 570,4 2,4 2,8 -259,9 0,5
Fruits, vegetables and legumes 1.181,4 5,4 -3,5 388,1 1,6 -7,1 793,3 -1,6
Oils and fats 345,7 1,6 35,3 159,6 0,7 -17,5 186,2 200,0
Sugars, coffee and cocoa 154,1 0,7 -4,8 256,7 1,1 -4,8 -102,7 4,7
Dairy products and eggs 106,6 0,5 1,6 144,6 0,6 -12,1 -38,0 36,2
Other food products 426,0 2,0 1,4 686,7 2,9 -12,1 -260,8 27,8
Beverages 337,9 1,5 -9,6 152,4 0,6 3,7 185,5 -18,3
Tobacco 16,0 0,1 -23,3 126,9 0,5 27,4 -110,9 -40,9
Energy 1.341,9 6,2 32,4 2.555,9 10,8 -15,7 -1.214,0 39,8 Oil and by-products 1.292,7 5,9 41,4 2.008,1 8,5 -6,6 -715,4 42,1
Gas 23,6 0,1 -33,2 449,5 1,9 -35,3 -426,0 35,4
Coal and electricity 25,6 0,1 -60,0 98,2 0,4 -47,6 -72,6 41,1
Raw materials 565,3 2,6 18,0 848,7 3,6 -0,4 -283,3 24,0 Animals and vegetables 223,1 1,0 3,5 249,8 1,1 -8,1 -26,8 52,6
Minerals 342,2 1,6 29,8 598,8 2,5 3,2 -256,6 18,9
Semi-manuf. (non-chem.) 2.141,4 9,8 -11,9 1.692,9 7,2 2,7 448,5 -42,6 Non-ferrous metals 406,4 1,9 -13,7 330,7 1,4 15,5 75,6 -59,1
Iron and steel 617,6 2,8 -21,4 631,2 2,7 4,3 -13,7 -107,6
Paper 276,2 1,3 -9,9 274,6 1,2 -6,7 1,7 -86,7
Ceramic and associated 304,9 1,4 1,6 70,6 0,3 30,7 234,3 -4,8
Other semi-manufactures 536,3 2,5 -5,4 385,8 1,6 -5,6 150,5 -4,7
Chemical products 2.976,1 13,6 -2,2 3.575,1 15,1 -4,1 -599,1 12,6 Organic 287,7 1,3 4,2 602,0 2,5 -16,1 -314,2 28,9
Inorganic 79,5 0,4 -9,7 117,4 0,5 -32,7 -37,9 56,1
Medicines 845,2 3,9 -3,2 1.236,6 5,2 10,6 -391,4 -59,9
Plastics 774,4 3,6 -7,5 762,3 3,2 -9,3 12,1 474,2
Fertilizers 56,7 0,3 -0,3 79,9 0,3 -24,1 -23,2 52,1
Tanning or dyeing extracts 192,4 0,9 -10,5 130,1 0,6 1,8 62,3 -28,5
Essential and perfume oils 407,6 1,9 4,3 310,8 1,3 0,3 96,8 19,4
Other chemical products 332,6 1,5 8,8 336,1 1,4 0,5 -3,5 87,8
Capital goods 4.262,8 19,5 -4,1 5.297,0 22,4 1,7 -1.034,1 -35,5 Equipment for industry 1.102,9 5,1 -12,2 1.303,3 5,5 -5,0 -200,4 -73,9
Specific purpose 368,2 1,7 -8,3 411,5 1,7 2,4 -43,3 -6.554,0
General purpose 734,7 3,4 -14,1 891,8 3,8 -8,1 -157,1 -37,1
Office and telecom. Equipment 227,9 1,0 -14,2 1.038,9 4,4 -2,9 -811,0 -0,8
Office 83,8 0,4 -10,4 462,5 2,0 2,5 -378,7 -5,9
Telecommunication 144,1 0,7 -16,3 576,4 2,4 -6,8 -432,3 3,2
Transport equipment 1.009,5 4,6 8,7 735,3 3,1 27,8 274,2 -22,5
Railway 63,5 0,3 -43,5 20,9 0,1 -3,0 42,6 -53,1
Road 589,4 2,7 21,1 340,4 1,4 6,1 249,0 50,0
Ships 52,0 0,2 202,8 24,6 0,1 -18,1 27,3 311,7
Aircraft 304,7 1,4 -2,6 349,4 1,5 72,1 -44,7 -140,7
Other capital goods 1.922,5 8,8 -3,6 2.219,4 9,4 1,3 -296,9 -50,3
Engines 219,0 1,0 102,3 195,4 0,8 -2,0 23,6 125,9
Electrical machinery 898,7 4,1 -11,6 1.000,7 4,2 -5,6 -102,0 -138,4
Precision equipment 203,1 0,9 5,7 543,8 2,3 17,4 -340,7 -25,6
Other 601,7 2,8 -11,1 479,5 2,0 2,2 122,2 -41,1
Vehicles 3.986,3 18,3 -0,8 3.059,3 12,9 -2,9 927,0 6,6 Cars and motorcycles 2.930,2 13,4 3,0 1.393,0 5,9 0,8 1.537,2 5,1
Parts and accessories 1.056,1 4,8 -10,1 1.666,3 7,0 -5,7 -610,2 -2,8
Durable goods 396,7 1,8 0,2 711,4 3,0 6,6 -314,6 -15,9 Electrical appliances 117,7 0,5 -3,6 226,8 1,0 20,4 -109,1 -64,8
Consumer electronics 55,0 0,3 21,7 179,9 0,8 -4,9 -124,9 13,2
Furniture 173,4 0,8 -1,9 237,0 1,0 6,6 -63,6 -39,5
Other durable goods 50,6 0,2 -2,4 67,7 0,3 0,1 -17,1 -8,4
Consumption goods 2.337,4 10,7 0,1 3.114,2 13,2 7,7 -776,9 -39,4 Textiles 1.474,1 6,8 6,1 1.780,7 7,5 7,0 -306,6 -12,0
Garment 1.109,5 5,1 6,7 1.400,3 5,9 8,4 -290,8 -15,3
Footwear 186,6 0,9 -17,8 230,8 1,0 16,6 -44,1 -251,8
Toys 129,7 0,6 -28,4 314,9 1,3 23,0 -185,2 -147,1
Other consumption goods 546,9 2,5 1,7 787,9 3,3 1,6 -241,0 -1,5
Other 339,9 1,6 -47,6 114,6 0,5 44,0 225,3 -60,4
TOTAL 21.806,8 100,0 -1,6 23.640,4 100,0 -1,7 -1.833,6 2,9
Source: Evaluation Department (Secretariat of State for Trade), data from Spanish Customs Department (Tax Agency)

12
Executive Summary International Trade Report. October 2016
Sector breakdown - January to October 2016
EXPORTS IMPORTS BALANCE
Million € % share y-o-y (%) Million € % share y-o-y (%) Million € y-o-y (%)
Food, beverages and tobacco 35.208,2 16,7 5,9 26.412,3 11,7 4,1 8.795,9 11,9 Meat products 5.267,8 2,5 11,9 1.644,2 0,7 2,0 3.623,6 17,2
Fishery products 2.932,4 1,4 8,7 5.137,4 2,3 9,5 -2.205,1 -10,5
Fruits, vegetables and legumes 13.530,1 6,4 3,1 4.248,7 1,9 12,5 9.281,5 -0,7
Oils and fats 3.500,2 1,7 16,1 1.826,7 0,8 0,2 1.673,5 40,5
Sugars, coffee and cocoa 1.407,7 0,7 9,1 2.429,0 1,1 1,5 -1.021,3 7,4
Dairy products and eggs 1.050,8 0,5 -1,2 1.435,0 0,6 -6,2 -384,2 17,7
Other food products 4.167,5 2,0 4,1 6.974,2 3,1 -0,6 -2.806,7 6,9
Beverages 3.137,4 1,5 0,6 1.490,5 0,7 2,6 1.647,0 -1,2
Tobacco 214,3 0,1 -2,2 1.226,6 0,5 13,7 -1.012,3 -17,8
Energy 10.439,0 5,0 -0,8 23.702,2 10,5 -28,7 -13.263,2 41,6 Oil and by-products 9.899,6 4,7 7,0 18.154,9 8,1 -27,9 -8.255,2 48,2
Gas 249,1 0,1 -58,7 4.775,2 2,1 -27,5 -4.526,1 24,3
Coal and electricity 290,3 0,1 -57,1 772,2 0,3 -47,2 -481,9 38,6
Raw materials 4.646,1 2,2 -4,3 7.272,6 3,2 -10,4 -2.626,5 19,5 Animals and vegetables 2.046,1 1,0 3,7 2.450,9 1,1 -1,9 -404,8 22,8
Minerals 2.600,0 1,2 -9,8 4.821,8 2,1 -14,2 -2.221,7 18,8
Semi-manuf. (non-chem.) 21.294,9 10,1 -3,8 15.593,1 6,9 -2,1 5.701,8 -8,3 Non-ferrous metals 4.197,9 2,0 -4,9 3.039,4 1,3 2,2 1.158,5 -19,6
Iron and steel 5.755,8 2,7 -12,5 5.285,2 2,3 -10,5 470,6 -29,6
Paper 2.919,8 1,4 1,1 2.901,6 1,3 -0,3 18,1 177,0
Ceramic and associated 3.187,2 1,5 5,2 655,5 0,3 24,2 2.531,7 1,1
Other semi-manufactures 5.234,2 2,5 0,0 3.711,3 1,6 2,9 1.522,9 -6,5
Chemical products 30.174,6 14,3 -0,6 35.687,5 15,8 -2,9 -5.512,9 14,1 Organic 2.865,5 1,4 -5,9 6.680,4 3,0 -3,5 -3.814,8 1,6
Inorganic 839,8 0,4 3,1 1.507,6 0,7 -9,4 -667,8 21,3
Medicines 8.665,2 4,1 -4,8 11.039,6 4,9 -6,2 -2.374,4 11,0
Plastics 8.202,9 3,9 -0,8 8.010,9 3,6 0,5 192,0 -35,8
Fertilizers 558,0 0,3 -10,3 592,2 0,3 -32,2 -34,2 86,4
Tanning or dyeing extracts 1.973,4 0,9 1,2 1.273,1 0,6 2,3 700,3 -0,7
Essential and perfume oils 3.771,6 1,8 2,7 3.037,3 1,3 4,9 734,3 -5,3
Other chemical products 3.298,2 1,6 14,6 3.546,4 1,6 3,3 -248,2 55,3
Capital goods 42.170,2 20,1 1,5 48.915,3 21,7 7,3 -6.745,1 -66,5 Equipment for industry 10.933,1 5,2 -1,5 13.260,3 5,9 7,7 -2.327,2 -92,4
Specific purpose 3.687,6 1,8 -5,4 3.988,0 1,8 9,7 -300,4 -214,5
General purpose 7.245,5 3,4 0,6 9.272,4 4,1 6,9 -2.026,9 -37,7
Office and telecom. Equipment 2.291,4 1,1 3,1 9.452,6 4,2 -1,8 -7.161,2 3,3
Office 831,2 0,4 2,6 3.871,2 1,7 -0,9 -3.040,1 1,8
Telecommunication 1.460,2 0,7 3,5 5.581,4 2,5 -2,4 -4.121,1 4,4
Transport equipment 10.312,7 4,9 9,7 6.138,6 2,7 27,6 4.174,1 -9,0
Railway 977,1 0,5 7,5 207,6 0,1 14,1 769,5 5,9
Road 5.782,3 2,7 25,6 2.846,2 1,3 13,3 2.936,1 40,4
Ships 399,0 0,2 -4,3 258,7 0,1 40,2 140,3 -39,6
Aircraft 3.154,3 1,5 -9,1 2.826,2 1,3 46,3 328,2 -78,7
Other capital goods 18.632,9 8,9 -1,0 20.063,7 8,9 6,4 -1.430,7 -5.575,7
Engines 1.582,6 0,8 -0,1 1.434,3 0,6 16,6 148,3 -58,1
Electrical machinery 9.094,5 4,3 -2,5 9.475,1 4,2 3,1 -380,6 -395,1
Precision equipment 1.846,7 0,9 10,5 4.304,7 1,9 8,3 -2.458,0 -6,6
Other 6.109,2 2,9 -2,3 4.849,6 2,2 8,9 1.259,6 -29,9
Vehicles 37.858,8 18,0 7,4 31.147,0 13,8 4,4 6.711,8 24,1 Cars and motorcycles 27.354,4 13,0 9,7 14.555,3 6,5 12,9 12.799,1 6,3
Parts and accessories 10.504,5 5,0 1,9 16.591,8 7,4 -2,1 -6.087,3 8,3
Durable goods 3.593,9 1,7 8,4 6.345,3 2,8 8,6 -2.751,3 -8,8 Electrical appliances 982,4 0,5 -2,5 1.781,0 0,8 7,3 -798,6 -22,4
Consumer electronics 444,5 0,2 28,7 1.546,5 0,7 12,3 -1.102,1 -6,8
Furniture 1.714,2 0,8 11,2 2.415,1 1,1 9,2 -701,0 -4,6
Other durable goods 452,9 0,2 8,0 602,6 0,3 1,4 -149,7 14,4
Consumption goods 21.387,0 10,2 5,5 29.241,0 13,0 6,4 -7.854,0 -8,9 Textiles 12.890,6 6,1 8,1 17.214,4 7,6 8,0 -4.323,7 -7,6
Garment 9.591,3 4,6 8,7 13.391,4 5,9 8,5 -3.800,1 -8,0
Footwear 2.430,9 1,2 -8,3 2.547,8 1,1 6,5 -116,9 -145,2
Toys 868,2 0,4 7,3 1.946,0 0,9 18,4 -1.077,8 -29,2
Other consumption goods 5.197,2 2,5 6,1 7.532,8 3,3 0,2 -2.335,6 10,9
Other 3.519,4 1,7 -49,2 1.036,6 0,5 33,0 2.482,8 -59,6
TOTAL 210.292,0 100,0 0,9 225.352,8 100,0 -1,6 -15.060,7 26,6
Source: Evaluation Department (Secretariat of State for Trade), data from Spanish Customs Department (Tax Agency)
13
Executive Summary International Trade Report. October 2016
Geographic breakdown - October 2016
EXPORTS IMPORTS BALANCE
Million € % share y-o-y (%) Million € % share y-o-y (%) Million € y-o-y (%)
EUROPE 15.679,7 71,9 -0,9 14.716,2 62,3 -3,5 963,5 67,3 EUROPEAN UNION * 14.316,8 65,7 -2,0 13.428,2 56,8 -3,2 888,6 20,8
EURO AREA 11.231,6 51,5 -0,4 10.683,8 45,2 -3,6 547,8 173,6
Austria 182,7 0,8 -1,2 173,4 0,7 -0,4 9,3 -13,4
Belgium 694,0 3,2 13,6 630,3 2,7 4,0 63,7 1.269,0
Cyprus 18,0 0,1 -3,4 1,3 0,0 -0,8 16,7 -3,6
Estonia 14,5 0,1 -26,6 5,3 0,0 16,9 9,2 -39,6
Finland 72,6 0,3 -15,1 97,2 0,4 -9,8 -24,6 -10,3
France 3.250,7 14,9 -1,7 2.515,8 10,6 -4,2 734,9 7,8
Germany 2.394,8 11,0 -2,3 3.162,6 13,4 -4,6 -767,7 11,2
Greece 180,6 0,8 -1,0 47,3 0,2 -13,9 133,3 4,6
Ireland 173,2 0,8 40,4 224,1 0,9 -28,1 -50,9 73,0
Italy 1.792,8 8,2 -1,6 1.539,2 6,5 -1,7 253,7 -1,4
Latvia 17,4 0,1 -13,8 46,6 0,2 358,2 -29,2 -393,4
Lithuania 30,9 0,1 2,4 33,0 0,1 -7,6 -2,1 61,5
Luxembourg 23,7 0,1 9,0 38,7 0,2 -4,1 -15,0 19,4
Malta 30,7 0,1 29,4 4,6 0,0 -14,3 26,1 42,2
Netherlands 640,5 2,9 -4,0 1.079,3 4,6 2,8 -438,8 -14,6
Portugal 1.589,5 7,3 1,7 882,2 3,7 -8,9 707,3 18,8
Slovakia 75,8 0,3 -1,2 166,4 0,7 -0,1 -90,5 -0,9
Slovenia 49,1 0,2 -28,9 36,5 0,2 5,5 12,6 -63,5
REST OF EU 3.085,2 14,1 -7,2 2.744,4 11,6 -1,7 340,8 -36,4
Bulgaria 134,8 0,6 11,4 56,5 0,2 -16,2 78,2 46,1
Croatia 34,2 0,2 -2,6 7,1 0,0 -19,1 27,1 2,9
Czech Republic 180,8 0,8 -12,2 371,3 1,6 6,6 -190,5 -33,9
Denmark 122,8 0,6 -19,1 153,8 0,7 10,7 -31,0 -339,3
Hungary 141,5 0,6 17,4 224,0 0,9 -13,7 -82,5 40,6
Poland 436,2 2,0 -6,8 508,1 2,1 32,7 -72,0 -184,5
Romania 192,1 0,9 -6,4 195,0 0,8 41,9 -2,9 -104,3
Sweden 182,6 0,8 -10,4 182,3 0,8 -9,4 0,3 -87,7
United Kingdom 1.458,2 6,7 -10,3 898,8 3,8 -16,4 559,4 1,7
REST OF EUROPE 1.362,9 6,3 12,2 1.288,0 5,4 -6,3 74,9 146,9 Norway 123,0 0,6 45,7 94,1 0,4 -55,7 28,9 122,6
Russia 141,3 0,6 -3,1 288,9 1,2 3,9 -147,5 -11,7
Switzerland 318,4 1,5 -13,7 329,7 1,4 5,8 -11,3 -119,7
Turkey 491,1 2,3 18,3 441,4 1,9 7,6 49,7 846,9
AMERICA 2.155,5 9,9 -10,9 2.535,2 10,7 7,1 -379,7 -849,9 NORTH AMERICA 995,6 4,6 -10,9 1.284,6 5,4 18,5 -289,0 -976,8
Canada 111,3 0,5 -7,8 135,4 0,6 33,9 -24,1 -223,2
USA 884,0 4,1 -11,2 1.148,5 4,9 16,9 -264,5 -2.043,1
LATIN AMERICA 1.142,3 5,2 -11,4 1.208,7 5,1 -1,1 -66,5 -200,3 Argentina 78,6 0,4 -36,9 143,0 0,6 -24,6 -64,4 1,0
Brazil 161,6 0,7 -16,3 191,2 0,8 -16,3 -29,6 16,2
Chile 115,4 0,5 0,0 102,5 0,4 -19,3 12,9 211,9
Mexico 339,5 1,6 -6,6 332,2 1,4 11,0 7,3 -88,7
Venezuela 14,6 0,1 -50,3 3,2 0,0 -90,6 11,4 327,1
REST OF AMERICA 17,6 0,1 45,1 41,9 0,2 -30,9 -24,3 49,9
ASIA 2.116,3 9,7 2,5 4.530,1 19,2 6,1 -2.413,8 -9,5 ASIA (exc. Middle East) 1.405,2 6,4 10,4 3.870,3 16,4 3,6 -2.465,0 -0,1
China 470,0 2,2 21,8 2.109,8 8,9 3,2 -1.639,8 1,1
Hong-Kong. China 82,4 0,4 12,1 21,3 0,1 20,6 61,1 9,4
India 107,7 0,5 -1,3 274,9 1,2 9,7 -167,2 -18,2
Indonesia 39,7 0,2 -16,3 129,1 0,5 -0,3 -89,4 -9,0
Japan 215,1 1,0 13,5 311,8 1,3 9,3 -96,7 -1,1
Philippines 36,5 0,2 5,0 21,8 0,1 50,4 14,8 -27,4
Singapore 49,4 0,2 19,6 39,9 0,2 32,6 9,5 -15,3
South Korea 130,2 0,6 -30,9 178,4 0,8 3,6 -48,3 -398,2
Taiwan 37,7 0,2 8,9 80,8 0,3 -11,2 -43,2 23,5
MIDDLE EAST 711,0 3,3 -10,2 659,8 2,8 23,5 51,3 -80,1 Saudi Arabia 184,6 0,8 -10,3 300,5 1,3 32,6 -115,9 -456,2
United Arab Emirates 160,8 0,7 -4,5 16,0 0,1 -53,2 144,9 7,9
AFRICA 1.436,7 6,6 -0,7 1.790,0 7,6 -13,8 -353,3 43,9 Algeria 250,0 1,1 -0,6 337,1 1,4 -44,2 -87,1 75,3
Egypt 110,8 0,5 15,2 76,2 0,3 181,1 34,6 -49,9
Morocco 655,5 3,0 3,9 530,9 2,2 21,6 124,6 -35,9
Nigeria 15,1 0,1 -52,1 226,6 1,0 -53,5 -211,5 53,6
South Africa 111,2 0,5 14,9 87,2 0,4 8,0 23,9 50,1
OCEANIA 144,2 0,7 5,2 68,6 0,3 -32,0 75,7 108,2 Australia 117,3 0,5 2,1 43,4 0,2 -39,7 74,0 72,0
OTHER (**) 274,4 1,3 -3,0 0,4 0,0 -23,5 274,0 -2,9
WORLD 21.806,8 100,0 -1,6 23.640,4 100,0 -1,7 -1.833,6 2,9 Pro memoria:
TOTAL NON EU 7.490,0 34,3 -1,0 10.212,3 43,2 0,2 -2.722,2 -3,7 TOTAL NON EURO AREA 10.575,2 48,5 -2,9 12.956,7 54,8 -0,2 -2.381,5 -14,0 OECD 16.713,6 76,6 -2,0 16.130,3 68,2 -2,2 583,3 2,5 ASEAN 269,3 1,2 17,8 588,9 2,5 10,0 -319,6 -4,2 MERCOSUR 300,7 1,4 -23,5 384,0 1,6 -20,4 -83,2 7,0 OPEC 817,1 3,7 -3,7 1.379,9 5,8 -25,9 -562,8 44,5
Source: Evaluation Dept. (Sec.of State for Trade), data from Spanish Customs Dept. (Tax Agency). ** Mainly provisioning outside the EU
* Total EU is higher than the sum of its members as a result of including provisioning and fishing occurred between Member States

14
Executive Summary International Trade Report. October 2016
Geographic breakdown - January to October 2016
EXPORTS IMPORTS BALANCE
Million € % share y-o-y (%) Million € % share y-o-y (%) Million € y-o-y (%)
EUROPE 151.649,4 72,1 3,1 141.270,7 62,7 1,3 10.378,7 37,0 EUROPEAN UNION * 139.568,4 66,4 3,3 128.709,8 57,1 1,2 10.858,6 35,5
EURO AREA 108.708,4 51,7 3,2 103.091,7 45,7 1,7 5.616,7 41,6
Austria 1.843,3 0,9 10,7 1.823,6 0,8 10,2 19,7 85,9
Belgium 6.457,9 3,1 19,2 5.855,6 2,6 -0,2 602,3 233,8
Cyprus 202,8 0,1 -9,3 15,8 0,0 16,7 186,9 -11,0
Estonia 177,1 0,1 -0,5 72,3 0,0 -29,8 104,9 39,7
Finland 875,5 0,4 17,2 927,5 0,4 8,0 -52,0 53,4
France 31.798,9 15,1 -2,8 25.243,9 11,2 2,0 6.554,9 -17,4
Germany 23.758,5 11,3 5,5 30.389,0 13,5 2,1 -6.630,5 8,4
Greece 1.477,6 0,7 -12,3 420,4 0,2 -15,7 1.057,2 -10,9
Ireland 1.496,1 0,7 35,1 2.338,8 1,0 -12,6 -842,7 46,3
Italy 16.828,2 8,0 8,1 14.802,2 6,6 3,7 2.026,0 56,0
Latvia 154,2 0,1 -5,9 110,6 0,0 51,7 43,7 -52,1
Lithuania 304,5 0,1 -3,1 233,0 0,1 -10,9 71,6 35,1
Luxembourg 231,8 0,1 -2,9 399,0 0,2 11,0 -167,2 -38,5
Malta 251,4 0,1 -7,2 76,1 0,0 65,7 175,3 -22,1
Netherlands 6.646,6 3,2 1,0 9.552,4 4,2 1,2 -2.905,8 -1,6
Portugal 15.079,5 7,2 1,1 8.823,1 3,9 -1,5 6.256,4 5,0
Slovakia 759,1 0,4 16,8 1.650,7 0,7 12,6 -891,6 -9,2
Slovenia 365,6 0,2 -7,3 357,7 0,2 15,5 7,8 -90,8
REST OF EU 864,7 0,4 -20,5 480,9 0,2 6,6 383,8 -39,7
Bulgaria 864,7 0,4 -20,5 480,9 0,2 6,6 383,8 -39,7
Croatia 316,5 0,2 11,7 70,3 0,0 -8,8 246,3 19,4
Czech Republic 1.829,0 0,9 9,6 3.299,3 1,5 8,7 -1.470,3 -7,6
Denmark 1.222,2 0,6 0,8 1.500,4 0,7 11,2 -278,2 -103,2
Hungary 1.282,2 0,6 12,2 2.179,0 1,0 -0,9 -896,8 15,1
Poland 4.008,9 1,9 -0,3 4.188,3 1,9 12,6 -179,4 -159,9
Romania 1.736,5 0,8 13,5 1.339,5 0,6 18,3 397,0 -0,3
Sweden 1.818,7 0,9 -0,9 1.823,9 0,8 -6,8 -5,2 95,7
United Kingdom 16.137,9 7,7 6,7 9.173,6 4,1 -9,6 6.964,4 40,0
REST OF EUROPE 12.081,1 5,7 1,5 12.561,0 5,6 1,8 -479,9 -9,9 Norway 977,0 0,5 25,4 1.238,4 0,5 -19,5 -261,4 65,6
Russia 1.359,6 0,6 -5,8 2.617,7 1,2 -5,6 -1.258,2 5,5
Switzerland 3.364,1 1,6 3,9 2.953,0 1,3 15,8 411,0 -40,1
Turkey 4.339,8 2,1 3,7 4.238,7 1,9 7,3 101,1 -57,1
AMERICA 21.807,4 10,4 -7,2 22.928,5 10,2 -7,6 -1.121,1 14,0 NORTH AMERICA 10.548,4 5,0 -2,0 11.509,6 5,1 -1,3 -961,1 -6,9
Canada 1.247,9 0,6 7,4 985,5 0,4 14,1 262,4 -12,2
USA 9.290,4 4,4 -3,2 10.518,5 4,7 -2,2 -1.228,0 -6,1
LATIN AMERICA 11.060,9 5,3 -11,3 11.107,1 4,9 -11,9 -46,2 67,1 Argentina 697,7 0,3 -39,7 1.232,1 0,5 12,4 -534,4 -975,0
Brazil 1.886,3 0,9 -19,3 2.560,7 1,1 -3,5 -674,3 -112,8
Chile 1.161,6 0,6 3,0 1.160,4 0,5 -8,7 1,2 100,9
Mexico 3.309,2 1,6 -6,8 2.682,6 1,2 -15,7 626,6 69,9
Venezuela 183,6 0,1 -42,1 149,6 0,1 -77,8 33,9 109,5
REST OF AMERICA 198,1 0,1 -24,2 311,8 0,1 -40,5 -113,7 56,8
ASIA 19.791,6 9,4 0,4 44.179,3 19,6 1,5 -24.387,7 -2,4 ASIA (exc. Middle East) 12.901,6 6,1 3,8 38.523,9 17,1 2,4 -25.622,3 -1,8
China 4.170,1 2,0 12,8 19.884,5 8,8 1,1 -15.714,4 1,6
Hong-Kong. China 767,7 0,4 8,1 209,0 0,1 6,1 558,7 8,8
India 1.034,1 0,5 -2,0 2.852,2 1,3 9,2 -1.818,1 -16,7
Indonesia 328,7 0,2 -20,8 1.391,7 0,6 3,4 -1.063,0 -14,1
Japan 2.035,8 1,0 0,0 3.023,8 1,3 13,6 -988,0 -58,0
Philippines 303,1 0,1 -4,7 174,4 0,1 -0,7 128,7 -9,6
Singapore 463,3 0,2 3,9 263,6 0,1 -16,0 199,7 51,3
South Korea 1.317,7 0,6 -11,1 1.922,8 0,9 -0,9 -605,0 -32,2
Taiwan 402,5 0,2 -3,1 877,5 0,4 2,3 -475,1 -7,5
MIDDLE EAST 6.890,0 3,3 -5,5 5.655,4 2,5 -4,7 1.234,6 -9,3 Saudi Arabia 1.975,4 0,9 -23,9 2.428,2 1,1 -18,4 -452,9 -18,8
United Arab Emirates 1.460,6 0,7 -2,4 292,7 0,1 -24,8 1.167,9 5,5
AFRICA 13.306,1 6,3 -1,1 16.341,2 7,3 -19,8 -3.035,1 56,1 Algeria 2.450,9 1,2 -6,5 3.788,1 1,7 -30,9 -1.337,3 53,2
Egypt 1.163,3 0,6 1,3 592,2 0,3 57,1 571,1 -26,0
Morocco 5.682,0 2,7 13,6 4.623,0 2,1 13,0 1.059,0 16,2
Nigeria 185,2 0,1 -29,0 2.582,8 1,1 -34,6 -2.397,7 35,0
South Africa 941,8 0,4 -11,9 733,3 0,3 -7,8 208,5 -23,8
OCEANIA 1.331,6 0,6 -20,0 626,1 0,3 -8,3 705,5 -28,2 Australia 1.119,2 0,5 -20,9 374,9 0,2 -14,0 744,3 -24,0
OTHER (**) 2.405,9 1,1 -20,6 6,9 0,0 -91,4 2.399,0 -18,7
WORLD 210.292,0 100,0 0,9 225.352,8 100,0 -1,6 -15.060,7 26,6 Pro memoria:
TOTAL NON EU 70.723,7 33,6 -3,5 96.643,0 42,9 -5,1 -25.919,3 9,2 TOTAL NON EURO AREA 101.583,7 48,3 -1,4 122.261,1 54,3 -4,2 -20.677,4 15,6 OECD 163.717,8 77,9 2,8 154.781,7 68,7 0,9 8.936,1 51,9 ASEAN 2.380,6 1,1 -1,3 5.847,8 2,6 4,5 -3.467,2 -9,0 MERCOSUR 3.107,9 1,5 -24,4 4.153,8 1,8 -10,5 -1.046,0 -96,1 OPEC 7.898,8 3,8 -13,5 13.211,4 5,9 -26,7 -5.312,6 40,3
Source: Evaluation Dept. (Sec.of State for Trade), data from Spanish Customs Dept. (Tax Agency). ** Mainly provisioning outside the EU
* Total EU is higher than the sum of its members as a result of including provisioning and fishing occurred between Member States

15
Executive Summary International Trade Report. October 2016
Oct Last 12 Jan-Oct Oct Last 12 Jan-Oct
2016 months 2016 2016 months 2016
Spain -1,6 1,8 0,9 -1,7 -0,3 -1,6
Germany -4,1 1,1 0,3 -2,2 0,4 -0,5
France (1) -8,2 -1,1 -2,2 -5,0 -0,4 -1,3
Italy -2,2 0,9 0,2 -1,6 -1,7 -2,8
Euro Area (2) -4,0 0,4 -0,4 -3,3 -0,6 -1,5
United Kingdom 6,7 -3,1 -3,2 5,0 9,7 12,7
European Union (28) (3) -4,5 -0,2 -1,2 -4,5 0,1 -0,7
USA -1,2 -5,6 -4,6 -1,5 -4,3 -3,8
China -7,6 -6,4 -6,9 -1,3 -7,6 -7,4
Japan -10,3 -8,7 -9,3 -16,5 -17,1 -17,8
n.a.: not available when this report was prepared
(3) Includes both extra and intra EU transactions
Source: Evaluation Department (Secretariat of State for Trade), from provisional national data in selected countries
Exports and imports growth in selected economies (y-o-y %)
EXPORTS IMPORTS
(2) Includes both extra and intra EA transactions
(1)Excluding military equipment
