international transfer pricing for goods and intangible...
TRANSCRIPT

International Transfer Pricing for Goods and Intangible Asset Licenses in a Decentralized Multinational Corporation:
Review and Extensions
Peter C. Dawson No affiliation Dallas, Texas
and
Stephen M. Miller* College of Business
University of Nevada, Las Vegas 4505 S. Maryland Parkway
Las Vegas, Nevada, USA 89154-6005 Telephone: 702-895-3969
Fax: 702-895-1354 E-Mail: [email protected]
Abstract: We review and extend the core literature on international transfer price manipulation to avoid or evade taxes. Under negotiated transfer pricing with a viable bargaining structure, including performance evaluation disconnected from the transfer price, divisions voluntarily exchange accurate information to obtain firm-wide optimality, a result not dependent on restraint from exercising internal market power. For intangible licenses, a larger optimal profit shift for a given tax rate change strengthens incentives for transfer pricing abuse. In practice, an intangible’s arm’s length range is viewed as a guideline, a context where incentives for abuse materialize. Transfer pricing for intangibles obliges greater tax authority scrutiny. Key Words: Negotiated transfer pricing, licensing intangibles, decentralized MNC. JEL Codes: F23; H25; H26; L29; O34. * Corresponding author

1. Introduction
Guttman (1999) argues that more than 60 percent of international trade occurs through intra-firm
trade between related or controlled divisions of multinational corporations (MNCs). Stanley
(2001) refers to this figure as a “long-standing statistic.” Using U.S. trade data reported by the
U.S. Bureau of Economic Analysis for 1981 to 2000, Diewert, Alterman, and Eden (2005) report
that intra-firm trade equals 31 to 40 percent of the value of aggregate annual U.S. exports and 37
to 44 percent of the value of aggregate annual U.S. imports (p. 4), and estimate that intra-firm
trade equals 30 to 40 percent of world trade (p. 40). If accurate, then approximately 30 to 60
percent of the dollar value of international trade occurs at prices, called “transfer prices”, that
MNCs determine internally rather than at arm’s length in an external market. In sum, intra-firm
trade and transfer pricing constitute a large portion of international trade.
The extent of internal MNC trade creates a substantial opportunity for MNCs to adjust
transfer prices to shift profit earned in high-tax countries to related corporate entities or divisions
in low-tax or tax-haven countries. This opportunity, coupled with an MNC’s fiduciary imperative
to maximize world-wide after-tax profit, raises governmental concerns about abusive transfer
pricing practices and their potential adverse effect on tax collections in high-tax jurisdictions. In
response, many countries revised existing transfer pricing regulations or introduced new ones. To
improve the effectiveness of existing regulations, many countries introduced documentation and
penalty rules. Given the global web of transfer pricing regulations and the “increased compliance
burden and enforcement” associated with them, Ernst and Young (2007) project that transfer
pricing will constitute the “most important,” or at least a “very important,” tax issue for 74
percent of MNC tax departments in the next two years (pp. 9-11).
But, in practice, does the typical MNC significantly adjust its transfer price(s) to avoid or
2

evade corporate income taxes? In an unpublished federally-funded study of U.S. Customs data,
Pak and Zdanowicz (2002)1 report dramatic over-invoicing of U.S. imports and under-invoicing
of U.S. exports, creating an estimated aggregate $53.1 billion loss in U.S. federal tax revenue in
2001 (Diewert, Alterman, and Eden 2005, p. 4; Dorgman 2002). In contrast, Eden (2003)
concludes “empirical evidence for transfer pricing manipulation exists but is not overwhelming
and that most evidence has been by inference from income-shifting studies” (p. 7).2 Diewert,
Alterman, and Eden (2004) conclude that the empirical literature on the extent of transfer pricing
manipulation proves “mixed” (p. 3) and indicate that, in practice, transfer price manipulation
does not occur to the degree suggested in Pak and Zdanowicz (2002), or to the degree inferred
from traditional transfer pricing theory (p. 3). Nonetheless, given the importance of transfer
pricing on an MNC’s global tax liability and after-tax profit, and on host governments’ tax
collections, this paper revisits the question of how the typical MNC adjusts its transfer price(s)
when relative national corporate profit tax rates change, ceteris paribus.
Horst (1971) analyzes transfer pricing in a traditional neoclassical firm, assuming a
centralized decision-making (CDM) structure within the MNC. Horst concludes that MNCs shift
profit earned in high-tax jurisdictions to low-tax jurisdictions. His model without an import tariff
implies that MNCs experience the economic incentive to shift all before-tax profit, when
unconstrained, to their controlled divisions in low-tax jurisdictions (i.e., a complete profit shift).
Such a dramatic analytical result implies that governments should thoroughly monitor transfer
pricing practices to prevent abuses. The CDM structure implicit in the traditional neoclassical
firm, an empty “black box,” however, does not adequately capture the management structure that
1 See also Pak and Zdanowicz (1994a, 1994b). 2 Empirical studies that consider how transfer pricing shifts profit include Lall (1973), Vaitsos (1974), Jenkins and Wright (1975), Kopits (1976), Lecraw (1985), Bernard and Weiner (1989, 1990), Dworin (1990), Grubert and Mutti (1991), Harris et al. (1993), and Hines and Rice (1994).
3

exists within the typical MNC. That is, the neoclassical firm does not consider the different
decision-makers and agency relationships within the typical modern firm. Since MNCs operate
in geographically dispersed locations and, in general, choose a greater degree of decentralized
decision-making (DDM, Bartlett and Ghoshal, 1993), we assume DDM.
In sum, this paper considers how the typical MNC sets its transfer prices in response to
changes in relative tax rates under DDM. Section 2 presents a synthesis model of transfer pricing
to facilitate a comparison of the assumptions, conclusions, and implications of the core economic
literature. Section 3 compares the core centralized and decentralized economic models of transfer
pricing that Horst (1971), Hirshleifer (1956, 1964), and Bond (1980) develop. CDM and DDM
prove fundamental to understand differences in these alternative approaches. Section 4 extends
the DDM model of Bond (1980), where top management selects the transfer price (i.e.,
centralized transfer pricing) and division managements select intra-firm trade and division
output. Section 5 departs further from the core CDM model, where division management now
selects the transfer price, through negotiation (i.e., negotiated transfer pricing), as well as the
quantity of intra-firm trade and division output. This model includes strategic interactions
between each division’s management in the transfer price negotiation process. Section 6 extends
the decentralized transfer pricing model to analyze intra-firm licensing of intangible assets.
Section 7 concludes by placing our findings in a broader perspective.
2. A Synthesis Model for Transfer Pricing
Our basic model provides a general framework to examine and synthesize the core economic
literature on transfer pricing from both the CDM and DDM strands, as well as to develop the
extensions in Sections 4, 5, and 6. Eden (1985) assumes CDM to review and compare several
CDM papers, including Horst (1971) and Copithorne (1971). With our synthesis model, we
4

compare two seemingly disconnected economic models of transfer pricing -- the traditional
CDM model, as in Horst (1971), and the DDM models of Hirshleifer (1956, 1964), Bond (1980),
and our extended analyses.
The synthesis model assumes, for simplicity, that the MNC owns two divisions, one
operating in the domestic country (country 1) and the other operating in a foreign country
(country 2), as in Hirshleifer (1956, 1964), Horst (1971), and Bond (1980). The parent company
operates in country 1 along with the central office, where top management resides, and an
operating division (division 1), where division 1’s management resides. Division 2’s operations
constitute a wholly-owned and controlled subsidiary of the parent company, incorporated under
the laws of country 2. By convention, intra-firm trade flows from division 1 to division 2, which
may reflect an MNC’s vertical or horizontal integration strategy. Top management maximizes
the MNC’s global after-tax profit, subject to regulatory constraints in both countries. We define
the MNC’s domestic currency-denominated global after-tax profit as follows:
( ) ( )( )dc dc fcMNC 1 1 2 2
1Π 1 t Π 1 t ΠE= − + − , (1)
where is the domestic currency value of division 1’s before-tax profit, dc1Π
fc2Π is the foreign
currency value of division 2’s before-tax profit, and are country 1’s and 2’s effective
corporate income tax rates, and is the nominal exchange rate defined as foreign currency per
domestic currency. Furthermore,
1t 2t
E
( )dc dc dc dc1 1 11 12 12 1 1Π P X P X C X= + − , and (2)
( )fc fc fc fc2 2 2 2 2 12 12Π P Y γ Y P X= − − , (3)
where division 1 produces good 1, 1X , sold in country 1, 11X , and also sold intra-firm to
division 2 in country 2, 12X , at a per-unit domestic currency transfer price of , and dc12P
5

1 11 12X X X= +
12
. Division 1 incurs a domestic currency cost of producing good 1, . Division 2
uses
dc1C
X as an input in the production of good 2, , for sale in country 2. Division 2 incurs a
foreign currency production cost,
2Y
fc2γ .3 Division 2 uses 12X as a variable resource input in its
production of good 2, apart from the variable labor/input costs already included in fc2γ .
equals division 2’s intra-firm foreign-currency input cost. Since the parent company operates in
country 1, the MNC must repatriate division 2’s foreign-currency-denominated before-tax profit,
fc12 12P X
fc2Π , in domestic currency (i.e.,
fcdc2 = 2ΠΠ E ), where it enters the MNC’s consolidated financial
statements. That is, division 2’s before-tax profit, fc2Π , enters top management’s profit-
maximizing objective function as . dc2Π
By convention, division 2 possesses a unit fixed-coefficient production function. In other
words, one unit of 12X can produce one unit of (i.e., 2Y ( )2 12X X= =Y f 12 ). Bond (1980) argues
that relaxing this assumption does not alter the quality of the results (p. 196). In addition, no
outside market for the intermediate good exists, so 11X 0= and 1 12X X= . Also, division 2 faces
a perfectly competitive output market (i.e., fc2P = fc
2P ). Therefore, we can write the synthesis
model in domestic currency as follows:
( ) ( )MNC 1 1 2 2Π 1 t Π Π= − −1 t+
)12
, (1')
(X1 12 12 1Π P X C= − , and (2')
( )fc
22 2 12 2 12 12 12
ΠΠ P X X P XE= = − −γ . (3')
23 If division 2 resells good 1 in country 2 as good 2, division 2’s output is X . In that case, equals division 2’s cost of processing good 1 for resale as good 2. That is, re-packaging, re-labeling, and/or modifying the product to meet country 2’s regulations or consumer tastes.
fc2γ
6

In general, the intra-firm quantity traded depends on the transfer price (i.e., ( )12 12 12X X P= ).
This specification allows division managements, under DDM, to choose their respective
quantities supplied and demanded. Under CDM, top management determines the quantity of
intra-firm trade, which, from division managements’ perspective, means 12 12X X= when they
make their respective profit-maximizing decisions.
3. The Core Literature
Centralized Decision-Making
Horst (1971) considers the MNC under CDM. We modify our synthesis model to incorporate his
assumptions. The MNC faces an import tariff or duty, , in country 2 on the quantity of intra-
firm trade. The MNC is horizontally integrated (i.e., division 2 resells
2d
12X as good 2, which is
now 2X instead of ). Division 2 produces part of 2Y 2X itself (i.e., 22X ) with a production cost,
. Division 2 does not incur a processing cost for the portion of good 2 that it imports from
division 1, so . Finally, division 2 sells good 2 in an imperfectly competitive output
market. Therefore, Horst’s division 2 before-tax profit, in the notation of the synthesis model, is
as follows:
22C
2γ = 0
( ) ( )2 2 2 22 22 2 12 12Π P X C X 1 d P X= − − + , (4)
where , ( )2 2 2P P X= 2 22 12X X X= +
2 12 12)P X
, is division 2’s on-site cost of producing its portion of
good 2, and (1 is division 2’s import cost including the tariff. An imperfectly
competitive external market for the intra-firm good exists, where division 1 sells the intra-firm
good to unrelated parties in country 1 as good 1,
22C
d+
11X . Therefore, Horst’s division 1 before-tax
profit, in the notation of the synthesis model, becomes as follows:
7

( )1 1 11 12 12 1 1Π P X P X C X= + − , (5)
where . Equations (1'), (4), and (5) represent Horst’s (1971) original CDM model. (1 1 11P P X= )
Since the quantity of intra-firm trade, 12X , in Horst’s (1971) model does not depend on
the transfer price, , he assumes CDM. Presumably, a centralized decision-maker (or decision-
making unit) exists within the MNC that chooses the quantity of intra-firm trade. Several
possible scenarios may underlie the CDM assumption: (i) The MNC operates as a traditional
neoclassical firm, or “black box,” with no explicit decision-makers or agency relationships, and
the “firm” chooses the transfer price and the quantity of intra-firm trade to maximize
12P
MNCΠ ; (ii)
an owner-operated MNC faces no principal-agent problems, since the owner makes all operating
divisions, and the owner chooses both the transfer price and quantity of intra-firm trade to
maximize MNCΠ ; or (iii) the MNC’s top management implements a perfect management control
system that corrects all principal-agent problems, such that division managements choose the
transfer price and the quantity of intra-firm trade that maximize MNCΠ . Given the benefits of
decentralization,4 the typical MNC delegates decision-making authority to division
managements in different countries. As such, an agency relationship between top management
and division managements exists. Since a principal-agent (or agency) framework exists, for
comparison purposes scenario (iii) will best characterize CDM.
4 The benefits of DDM stem from increased productivity (Dean 1955, p. 65; Hass 1968, p. B-310; Sharav 1974, p. 56; Schaub 1978, p. 33), such as (1) division managers operate nearer to the relevant local information regarding their input and output prices (Ronen and McKinney 1970, p. 99), (2) division managers can more effectively coordinate the factors of production at the division level (Ronen and McKinney 1970, p. 99), (3) division managers face decreased information flows between top management and themselves, which reduces the bureaucratic inefficiencies inherent in a large centralized organization (Hass 1968, p. B-310), (4) division managers experience more motivation, which reduces “agency costs” (Hirshleifer 1964, p. 28; Grabski 1985, p. 34), and (5) division managers know better than top management their local markets (local customs, government policies and regulations, customer tastes and preferences, market trends, etc.) and, therefore, they know better how to produce the goods and services that satisfy the local market demand, laws, and regulations.
8

Substitute equations (4) and (5) into equation (1') to obtain the following outcome:
( ) ( )MNC 12 12 2 1 2 2Π Z P X t t 1 t d⎡= + − − −⎣ ⎤⎦ , (6)
where ( )[ ] ( )[ ]1 1 11 1 2 2 2 22Z 1 t P X C 1 t P X C= − − + − − . The first-order condition for an optimum
yields the following:
( ) ( )MNC12 2 1 2 2
12
dΠ X t t 1 t d 0dP><⎡= − − −⎣ ⎤⎦
)
. (7)
Horst (1971) concludes that when ( 2 1t t− exceeds (falls below) 2 2(1 t )d− , ( )MNC
12
dΠ 0 0dP > <
and the firm raises (lowers) the transfer price to the highest (lowest) allowable level. When the
home (foreign) country imposes a high-enough tax rate (import tariff rate), the firm can “take a
beating” on the import duty (home country corporate tax bill) to avoid a relatively high tax bill in
country 1 (high import tariff in country 2).
The MNC abides by transfer pricing regulations.5 According to Eden (1985), Horst
(1971) assumes that the arm’s length price lies in the to range, since “he expected tax and
tariff authorities to impose
1P '1C
1MC as an effective lower bound and as an upper bound to ”
(p. 19). Booth and Jensen (1977) note that the transfer price is arbitrary and indeterminate when
top management’s profit-maximizing objective is unconstrained, such as by an arm’s length
constraint (p. 434). Schjelderup and Sørgard (1995) impose an internal profit constraint to ensure
a determinate solution. Since an MNC cannot deduct losses earned in one country on its tax
return in another country, the MNC does not adjust the transfer price such that it earns a loss in
its high-tax division. Rather, the transfer price adjusts only until the high-tax division earns zero
profit. Booth and Jensen (1977) show that the transfer price becomes determinate when top
1P 12P
5 Under the U.S. transfer pricing regulations in §1.482, a firm must report “arm’s length” income, which conforms to the “arm’s length standard” (§1.482-1(b)(1)).
9

management constrains itself to meet minimum profit levels in each country.
We convert Horst’s (1971) model into a DDM model similar to the models in Hirshleifer
(1956, 1964) and Bond (1980), by adopting Bond’s (1980) assumptions. First, each division
faces a perfectly competitive output market. Second, no external market exists for the intra-firm
good. Finally, the MNC is vertically integrated (i.e., division 2 does not produce the intra-firm
good). Horst’s original conclusion remains unchanged. In addition, we adopt Bond’s (1980)
assumption that . Therefore, within the synthesis model, the modified Horst (1971)
solution becomes
2d 0=
( )MNC12 2 1
12
dΠ X t t 0dP><⎡ ⎤= −⎣ ⎦ . (8)
When ( ), the MNC chooses the highest (lowest) allowable transfer price to
maximize
2 1t t> 2t t< 1
MNCΠ , given its optimal choice of , where the arm’s length range implicitly
constrains the transfer price.
12X
6 The MNC raises (lowers) the transfer price to the upper (lower)
arm’s-length boundary of that range. That is, under CDM the transfer price maximizes MNCΠ
while obtaining equilibrium in the MNC’s internal market (i.e., s d12 12 12X X X= = ).
Decentralized Decision-Making
Under DDM, the neoclassical firm can incorporate a principal-agent framework. That is, we now
distinguish between top management and division-level managements, where top management
delegates some decision-making authority over division operations to division managements. A
management control system evaluates and rewards division managers based on division profit in
an effort to minimize the agency costs associated with the delegation of authority. Albeit it in a
6 The assumption of an arm’s length range proves appropriate, given existing tax policy. For example, under the U.S. transfer pricing regulations, the arm’s length transfer price must fall within the interquartile range of prices determined under the best transfer pricing method (§1.482-1(e)).
10

limited way, the neoclassical firm under DDM more realistically captures the internal workings
of the modern MNC.7
Hirshleifer’s (1956, 1964) model. The domestic divisionalized firm faces an identical corporate
profit tax rate in each state or region in which it operates. Therefore, in equation (1'), 1t t2= . In
Hirshleifer’s decentralized firm, division managements choose the transfer price through
negotiation (i.e., negotiated transfer pricing) and choose the quantity of intra-firm trade (and
division output). Under DDM, division managements respond to changes in the negotiated
transfer price by adjusting the quantity of the intra-firm good supplied and demanded. According
to the divisions’ profit maximization problems, an increase in the negotiated transfer price causes
division 1 to increase the quantity of the intra-firm good it supplies (i.e., ''1
12s *12
C 0dXdP = > )
while simultaneously causing division 2 to decrease the quantity of the intra-firm good it
demands (i.e., ''12d * 212
dP γ 0dX = − < ).8 We illustrate the internal market supply and demand
curves in Figure 1.
In Hirshleifer (1956, 1964), top management wants autonomous divisions to negotiate the
equilibrium transfer price, (superscript “0” refers to internal equilibrium). The efficient
transfer price produces equilibrium in the internal market. Under Hirshleifer’s assumption of
equal tax rates, also equals the profit-maximizing transfer price. When is chosen,
Hirshleifer (1956) calls this “marginal cost pricing for the intermediate product”, since the
transfer price equals division 1’s marginal cost, , which he clarifies by noting “the sum of the
012P
012P
012P 0
12P
'1C
7 General Motors was, perhaps, the first multi-division firm to adopt a decentralized corporate structure in the 1920s, when it divided its corporate divisions into separate profit centers. As firms adopted decentralized corporate structures, scholars began to model the modern firm, including MNCs, as decentralized organizations. 8 See Appendix A for these derivations.
11
divisional marginal costs equal to price (in the perfectly competitive case) or marginal revenue
(in the imperfectly competitive case) in the final market” (p. 175).9 That is, when the firm
chooses the transfer price such that ' '1 2 2C γ P+ = (i.e., the combination of conditions 1 and 2
below), it promotes both resource efficiency and firm-wide profit-maximizing. If autonomous
divisions negotiate , the following maximizing conditions (Hirshleifer 1964, p. 31) hold: 012P
1. Division 1: '12 1P C= ,
2. Division 2: '12 2 2P P γ= − , and
3. Firm-wide: s d12 12 12X X X= = .
No guarantee exists that autonomous divisions will choose a negotiated transfer price and
intra-firm quantity of and 012P 0
12X , however. Rational division managements may exploit their
internal (monopolistic or monopsonistic) market power. To overcome potentially dysfunctional
effects, Hirshleifer (1956, 1964) suggests a “neutral umpire” or “auctioneer” to facilitate the
transfer price negotiations. Even though a neutral umpire aims to minimize the exercise of
internal market power, rational divisions possess an incentive to misinform the neutral umpire.
“[I]n the process of exchanging information, even through a neutral umpire, it may be in the
interest of either party to give inaccurate replies in the hopes of achieving a more favorable
price” (Hirshleifer 1964, p. 32). Under conditions of imperfect information, top management
chooses a transfer pricing rule (e.g., a neutral umpire) intended to lead autonomous divisions to
choose . Divisions act within a firm’s hierarchy, including policies designed to achieve
corporate objectives. If successful, top management effectively chooses both the transfer price
and quantity of intra-firm trade.
012P
0
12P '2γ
9 Also, at , division 2’s marginal cost, , equals division 2’s net marginal revenue, 2 12P P− .
12

Bond’s (1980) model. The decentralized MNC faces potentially different tax rates. Bond (1980)
characterizes decentralization by top management choosing the transfer price (i.e., centralized
transfer pricing) and division managements choosing the quantity of intra-firm trade and division
output. As in Hirshleifer (1956, 1964), divisions respond to changes in the transfer price by
adjusting the quantity of the intra-firm good supplied and demanded. Bond’s model contains
equations (1'), (2'), and (3') of the synthesis model. Given the transfer price set by top
management through centralized transfer pricing, each division chooses its optimal internal
quantity of the intra-firm good. The divisions maximize as follows:
Division 1: ( )s12
12
1 1X P
Max 1 t Π− ⇒ ( ) '1 12 11 t P C 0⎡ ⎤− − =⎣ ⎦ ; and (9)
Division 2: ( )d12
12
2 2X P
Max 1 t Π− ⇒ ( ) '2 2 2 121 t P γ P⎡ 0⎤− − − =⎣ ⎦ . (10)
In Bond (1980), top management chooses the transfer price to maximize MNCΠ , given
known division supply and demand curves.10 Formally, top management’s maximization
problem is s '12 1212d '12 12
MNC X (P ) 0PX (P ) 0
Max Π><
. Bond calculates top management’s first-order condition and
evaluates it at the equilibrium transfer price as follows: 012P
012 12
0MNC12 2 1
12 P P
dΠ X (t t )dP=
= − (11)
Bond concludes that when (2 1t t> 2 1t t< ), top management raises (lowers) the transfer price
from to maximize 012P MNCΠ . Equilibrium in the internal market occurs when top management
0
12P
012P
10 In Hirshleifer (1956, 1964), this perfect information assumption would allow the neutral umpire to choose without an iterative process. In Bond (1980), top management knows the division supply and demand curves and chooses directly.
13
sets the transfer price at , which, in turn, occurs in the trivial case where . Choosing
does not maximize
012P 1t t= 2
012P
MNCΠ when tax rates differ, however.
In the modified Horst (1971) model, different tax rates cause the centralized MNC to
raise or lower the transfer price by the maximum amount allowed by tax law. How much does
top management in Bond’s (1980) decentralized MNC raise or lower the transfer price? Bond
derives optimal markup and markdown conditions. The optimal markup rate equals
'1
12
P C−=12 1
1
t )P t )
−−
2(tη(1
(12)
and the optimal markdown rate equals
'2 2
12
γP
12 2 1
2
( P (t t )ε(1 t )
−=
−) P− − , (13)
where d12 12
d12
Pη X∂⎛ ⎞⎛ ⎞= ⎜ ⎟⎜ ⎟
⎝ ⎠12
XP∂⎝ ⎠
is division 2’s transfer price elasticity of demand for 12X , and
s12
12
Xε P X∂
∂⎛ ⎞⎛ ⎞= ⎜ ⎟⎜ ⎟⎝ ⎠⎝ ⎠
12s12
P is division 1’s transfer price elasticity of supply of 12X . Bond
concludes that when ( ), the optimal markup (markdown) depends on the relative
magnitude of the tax differential and the transfer price elasticity of demand (supply).
2 1t t> 2 1t t<
Bond (1980) raises the possibility of a transfer price within, rather than on, the arm’s
length boundary. Under CDM, division management does not reduce the quantity of intra-firm
trade when the transfer price changes, which frees top management to choose the highest or
lowest allowable transfer price, a boundary solution. Under DDM, division management may
lower the quantity of intra-firm trade below 012X in response to a change in the transfer price. In
that case, top management trades off a gain in MNCΠ that comes from profit-shifting to minimize
14

its global profit taxes with a loss in MNCΠ that comes from a loss in internal efficiency. This
tradeoff makes a solution within the arm’s-length boundary possible. Top management, limited
by the possible adverse effect of a fall in intra-firm trade on the MNC’s global after-tax profit,
probably adjusts the transfer price by less than the maximum allowed by tax law.
4. Centralized Transfer Pricing: An Extension
This section extends Bond (1980) by allowing the transfer price to take any value within the
implicit arm’s length constraint imposed by tax authorities. That is, the transfer price can differ
from by finite amounts. Like Bond, we consider DDM with centralized transfer pricing,
where top management chooses the transfer price subject to division 1’s and division 2’s given
and known reaction functions. Division 1’s (division 2’s) reaction function equals its supply
(demand) curve for the intra-firm good. Under DDM, each division’s autonomous profit-
maximizing behavior, a by-product of a decentralized corporate structure, is an internal
constraint on top management’s transfer price selection. Profit-maximizing division
managements react to changes in the centrally-determined transfer price by adjusting their
respective intra-firm quantities supplied and demanded. Division managements’ reaction
functions reflect their objective of maximizing division profits, an objective created by top
management’s use of a management control system that evaluates and rewards division
management based on division profit. Under DDM, the quantity of intra-firm trade depends on
the transfer price, where the direction of the quantity’s response to changes in the transfer price
depends on whether the MNC operates along division 1’s supply curve or division 2’s demand
curve.
012P
In addition to its internal constraint, top management maximizes the MNC’s global after-
tax profit subject to an external arm’s length constraint that does not enter explicitly into the
15

maximization problem. Given the significance of intra-firm trade, top management hires a
competent consultant to determine the arm’s length range (if not already known) and, therefore,
can and does select a transfer price on, or within, the arm’s length boundary. Top management’s
first-order condition for profit maximization implicitly defines the optimal transfer price. The
total differential of the first-order condition generates the comparative static results as follows:
( )' '*12 1 12 1212
1
P C X XPt CC
− +∂=
∂; and (14)
( )' '*2 2 12 12 1212
2
P γ P X XPt CC
− − −∂=
∂, (15)
where .( ) ( ) ( ) ( ) ( )2 2' '' ' '' '1 12 1 2 12 2 12 2 1CC t 1 X C t 1 X γ 2 X t t 0⎡ ⎤ ⎡ ⎤= − + − + − <⎢ ⎥ ⎢ ⎥⎣ ⎦ ⎣ ⎦
11 To determine the sign
of equations (14) and (15), we evaluate each result when the MNC operates along division 1’s
supply curve, along division 2’s demand curve, and along both. Along the supply (demand)
curve, division 1’s (2’s) first-order condition for division profit maximization, ( ) 0CP '112 =−
( ( )'2 2 12γ P 0− − =
1 2t t> 1 2t t
P ), holds. The following tax conditions also hold when the MNC is along the
supply (demand) curve: ( < ).12 The slope of the supply (demand) curve is
'12
s '12X X 0= > d '
12 ( X 0= <
1 2t t
). In internal equilibrium, the MNC operates at the intersection of
division 1’s supply curve and division 2’s demand curve, satisfying both division’s first-order
conditions as well as the tax condition that = . Therefore, when 1t 2t= , the comparative static
results, which correspond to Bond’s (1980) conclusion, reduce to
11 See Appendix A for a derivation of the sign of CC. 12 See Appendix A for a derivation of the tax conditions.
16

*12 12
1
P X 0t CC∂ = <∂ and
*12 12
2
P X 0t CC∂ −= >∂ . (16)
When , the MNC operates along the internal supply curve and the comparative static
results reduce to
1t t> 2
*12 12
1
P X 0t CC
∂= <
∂ and
( )' '*2 2 12 12 1212
2
P γ P X XP 0t CC
− − −∂= >
∂. (17)
When , the MNC operates along the internal demand curve and the comparative static
results reduce to
1t t< 2
( )' '*12 1 12 1212
1
P C X XP 0t CC
− +∂= <
∂ and
*12 12
2
P X 0t CC
∂ −= >
∂. (18)
We conclude that whether or 1 2t t= 1 2t t≠ , the sign of equation (14) is always negative.
Similarly, the sign of equation (15) is always positive.13
The signs of the comparative static results do not depend on differences in organization
structure (i.e., CDM versus DDM). Their magnitudes may differ, however. Unlike the traditional
centralized MNC (i.e., the modified Horst (1971) model), which strictly predicts a boundary
solution, the decentralized MNC’s top management may not select the highest or lowest transfer
price allowed by tax law. It may optimally select a transfer price within the arm’s length
boundary. An interior solution reflects the tradeoff inherent to decentralized firms, a tradeoff
between the internal constraint embodied by each division’s reaction function and its tax
minimization objective.
Our extended model may provide limited applicability, or generality, based on the
following: (i) No outside market exists for the intra-firm good, (ii) division 2 faces a perfectly
13 Dawson (1999) shows that the qualitative results are unaffected by the assumption of general functional-form supply and demand curves (pp. 97-100, 108).
17

competitive output market, and (iii) top management knows division information (i.e., division
1’s supply curve and division 2’s demand curve). Our results do prove useful because they apply
to relevant MNC situations, however.
Assuming no market for the intra-firm good makes sense in some cases. For example,
Spicer (1988) considers a situation where top management exercises control over the “make-or-
buy decision”. When “the internally transferred intermediate product is idiosyncratic, and
involves a large investment in transaction-specific human and/or physical capital” (pp. 319-320),
internal trade may meet the best interests of the firm and, if so, top management should
encourage it instead of external trade. From a broader perspective, a vertical integration strategy
requires that the MNC does not use the external market, if any, to source certain inputs.
“Mandated internal transactions are required in implementing a strategy of vertical integration”
(Eccles 1985b, p. 79). The choice of vertical integration reflects synergistic benefits of
integration, including cost savings or productivity enhancements from sourcing with a related or
controlled division of the MNC. Furthermore, if a competitive external market for the
intermediate good does exist, then a comparable market price also exists, leaving little room for
the MNC to manipulate the transfer price from an easily identifiable arm’s length price. MNCs
that do not face an external market, and therefore do not face an easily discernible comparable
external market price, maintain more flexibility to adjust their transfer price. Thus, an outside
market for the intermediate good does not exist or matter for those MNCs relevant to an analysis
of international transfer pricing abuse.
Our analysis also assumes that division 2 faces a perfectly competitive final goods
market. Since MNCs operate in increasingly competitive international markets, the typical MNC
faces markets nearer to a competitive market structure. As such, the typical MNC exerts little
18

influence over its own price.
Finally, our analysis assumes top management knows division reaction functions. Bond’s
(1980) DDM, which assumes centralized transfer pricing, presumes top management possesses
perfect (or at least very good) information about its divisions so that it can choose the optimal
transfer price (Hansen and Kimbrell 1991, p. 84). Adopting a decentralized corporate structure
copes with the agency costs associated with “impacted information” (Williamson 1975) at the
division level. As Hansen and Kimbrell (1991) note, top management’s “limited and untimely
access to local information and cognitive limitations are key reasons why firms decentralize!” (p.
84). Therefore, assuming top management knows division information, such as division supply
and demand curves, appears to contradict the DDM assumption. Nonetheless, top management,
although not knowledgeable of all division information, does know how divisions responded to
transfer price changes in the past. And, absent a structural change in how divisions operate,
historical information concerning supply and demand curves may make a good approximation of
present supply and demand curves. Therefore, centralized transfer pricing does not necessarily
limit the applicability of our decentralized analysis.
5. Negotiated Transfer Pricing
Negotiated transfer pricing, where division managements choose the transfer price as well as the
quantity of intra-firm trade, reflects common practice (Vaysman 1998; Chalos and Haka 1990;
Eccles 1985b; Price Waterhouse 1984; Tang, Walter, and Raymond 1979; Wu and Sharp 1979;
Vancil 1978). Therefore, we relax the centralized transfer pricing assumption. “Previous research
in transfer pricing had led to the conclusion that there is no transfer price that will encourage
goal-congruent behavior while at the same time preserving divisional autonomy” (Hansen and
Kimbrell 1991, p. 79). This section extends the negotiated transfer pricing literature to show that,
19

under a tractable bargaining structure, a firm-wide optimal solution, the modified Horst (1971)
CDM solution, can occur.
Hansen and Kimbrell (1991) analyze negotiated transfer pricing in a decentralized,
domestic firm (i.e., with effectively equal tax rates), assuming incomplete information between
top management and division managements, sufficiently complete information between division
managements, and a positive-sum bargaining game. That is, both players know that a joint
benefit accrues to successful cooperation, an increase in combined division profits. Since
division managements’ compensation depends on division profit, they maximize their respective
division’s profit. First, rational divisions negotiate and select the firm-wide optimal quantity of
intra-firm trade (p. 89), which equals the equilibrium quantity, because that quantity maximizes
combined division profit. Second, they negotiate and select a transfer price to divide the gain in
combined division profit (p. 89). Since tax rates are equal, the transfer price can allocate the joint
gain without adversely affecting the firm’s overall profit. The negotiated transfer price facilitates
division management performance evaluation and compensation, since it enters into the
calculation of division profit and division management compensation depends on division profit.
Hansen and Kimbrell conclude that negotiated transfer pricing—under the “existence of a joint
benefit, awareness of this benefit, and rational behavior” (p. 90) on the part of division
managers—leads to goal congruence and the selection of the firm-wide optimal quantity of intra-
firm trade. Assuming the “existence of common interests (joint benefit) and the ability to
communicate and coordinate a joint strategy to exploit this joint benefit” (p. 85) proves critical to
their cooperation.
Halperin and Srinidhi (1991) extend Hansen and Kimbrell (1991) to the international
case. They ask “how transfer pricing, in the presence of differential taxation, affects the resource
20

allocation and profitability of a decentralized multinational enterprise (MNE) that uses the same
transfer price for tax and performance evaluation purposes” (p. 141). The negotiated transfer
price incorporates three roles -- calculating division profit for tax reporting purposes, calculating
division profit for management compensation purposes, and providing a sharing mechanism for
the joint gain in MNC profit, if any, between the divisions. The negotiated transfer price
manifests the divisions’ relative “negotiating abilities” (p. 141) or “bargaining strengths” (p.
146). Complete information exists as both divisions know each other’s cost and revenue
information (p. 141). Implicitly, Halperin and Srinidhi assume cooperation (weakly) dominates
non-cooperation, where division managements know their negotiation conforms to a positive-
sum game. Complete knowledge of each division’s reaction function would give division
managements the ability, but not necessarily the incentive, to cooperate and select the optimal
intra-firm quantity and transfer price. Halperin and Srinidhi conclude that, although divisions
negotiate and select the firm-wide optimal quantity of intra-firm trade, the negotiated transfer
pricing does not necessarily maximize firm-wide profit. In other words, it does not produce the
modified Horst (1971) CDM result, because tax payments and performance evaluation depend
on the transfer price. That is, “…in the absence of any transfer-pricing rule other than the
requirement that the same transfer price be used for both performance evaluation and tax
purposes, the MNC’s total after-tax profits will not be maximized” (Halperin and Srinidhi 1991,
p. 145). Since the negotiated transfer price probably reflects the parties’ relative bargaining
power, no guarantee exists that the chosen transfer price equals either the upper or lower arm’s
length boundary.
Vaysman (1998) extends Hansen and Kimbrell (1991) to include private division
information and a bargaining structure that includes the possibility that top management
21

intervenes to set the transfer price (i.e., centralized transfer pricing) when a negotiation impasse
occurs at the end of the negotiation period. Vaysman concludes “the negotiated transfer-pricing
method in this paper allows the firm to attain the upper bound on its profits” (p. 373). This upper
bound on profit, however, does not equal the modified Horst (1971) CDM result. Under the
assumption of private division information, a “centralized decision-making” result emerges that
is “second-best to … the first-best profits … in the absence of private information” (p. 355;
italics original). Implicitly, Vaysman finds a lower MNC profit than the modified Horst (1971)
CDM outcome because both tax payments and performance evaluation depend on the same
transfer price. In other words, “Divisional profits reflect transfer prices” (p. 349) and “transfer
pricing affects managerial decisions” (p. 350). As Halperin and Srinidhi (1991) show, no
guarantee exists that the negotiated transfer price will equal either the upper or lower arm’s
length boundary because the parties’ relative bargaining power determines the transfer price.
Negotiated transfer pricing receives criticism because division performance evaluation
depends on negotiating ability rather than division performance (Dupuch and Drake 1964),
which can lead to agency costs for the firm. “The transfer pricing problem can be considered as a
problem of agency” (Eccles 1985a, p. 151). When top management cannot observe division
managements’ behavior and effort perfectly and division managements receive their reward
based on division profit, top management’s task of coordination within the firm proves more
complicated because its “desire to use the transfer price to minimize the MNC’s global tax
liabilities may encourage slack effort by its subsidiaries’ managers” (Donnenfeld and Prusa
1995, p. 231). “[I]f a [transfer pricing] method is chosen to give an advantage for tax purposes,
then the use of the results of subsidiary operations for performance evaluation of managers may
yield unfair results, causing managerial conflict and morale problems. This potential conflict
22

between the transfer pricing method chosen and a fair performance evaluation is a primary
concern in the MNC” (Borkowski 1992, p. 174). According to Eccles (1985b), “managers
believe they are being treated fairly when they receive rewards that they believe are
commensurate with their contribution to the company” (p. 270). “Although my study showed
that transfer prices sometimes affect resource allocation decisions, this was not the dominant
concern for managers. Instead, they were most concerned about how transfer prices define the
roles of divisions and allocate profits between trading divisions” (Eccles 1985a, p. 157). Eccles
(1985b) argues further that the transfer price’s effect on managerial incentives should play a
principal role in the MNC’s choice of a transfer pricing policy:
There are two major criteria for evaluating whether the distribution
of authority and responsibility is effective for implementing
strategy: corporate performance and individual fairness. Have
[division] general managers been given the appropriate level of
responsibility and sufficient authority over resources to carry out
this responsibility in a way that contributes to corporate
performance and that is perceived by them as fair? An often-voiced
complaint by managers is that their responsibility exceeds their
authority—that they are held responsible for outcomes that they
cannot control because they do not have the authority over the
resources that determine outcomes. Vancil [1978] has shown that
responsibility frequently does exceed authority. …The problem of
fairness is a central one in managing transfer pricing, since transfer
pricing policies affect both the authority and the responsibility of
23

managers. If managers believe that the transfer pricing policy
results in performance measures that misrepresent their
contributions to the company, or that it interferes with their ability
to achieve the objectives they are responsible for, then they will
believe that the policy is unfair. (p. 81)
The perceived fairness of the transfer price, and the MNC’s internal transfer pricing policy that
underlies the transfer price, is important because it can create an agency problem that hinders the
MNC’s ability to achieve its desired profit goals (Eccles 1985a, 1985b). “The traditional
literature, however, focuses almost exclusively on the effects of external factors such as
corporate tax differences across countries, tariffs, etc. on the setting of transfer prices”
(Donnenfeld and Prusa 1995, p. 231).
In sum, Halperin and Srinidhi (1991) and Vaysman (1998) assume taxable income and
performance evaluation depend on the transfer price. In the domestic case in Hansen and
Kimbrell (1991), the decentralized firm achieves the firm-wide optimal quantity of intra-firm
trade because minimizing division tax payments is independent of the transfer price. In the
international context in Halperin and Srinidhi (1991) and Vaysman (1998), the negotiated
transfer price minimizes tax payments as well as divides the joint gain in combined division
profit, leading to a sub-optimal negotiated transfer price. That is, no guarantee exists that the
negotiated transfer price will be selected on the upper or lower arm’s length boundary. In Hansen
and Kimbrell (1991), Halperin and Srinidhi (1991) and Vaysman (1998), agency costs can occur
because performance evaluation reflects the transfer price, which, in turn, depends on the relative
bargaining power rather than relative contribution to MNC after-tax profit. Solutions to this
problem include, for example, Choi and Day’s (1998) conclusion that top management can
24

address the tradeoff between tax avoidance and management incentives by using incentive
compensation based on multiple performance measures. In our negotiated transfer pricing model,
division management performance evaluation depends on division profit, but profit does not
depend on the negotiated transfer price. This removes the transfer price as a source of agency
costs and sub-optimality.
Negotiated Transfer Pricing: A New Approach
Our negotiated transfer pricing model builds on Hansen and Kimbrell (1991), Halperin and
Srinidhi (1991), and Vaysman (1998). We borrow the following assumptions: (1) The MNC
divisions face different tax rates, (2) division management compensation depends on division
profit, (3) division managements possess private information about their respective division’s
operations and market, (4) divisions play a positive-sum game, and (5), if negotiation impasse
occurs at the end of the bargaining period, top management sets the transfer price (i.e.,
centralized transfer pricing). By contrast, the transfer price in our model is not used as a sharing
mechanism for the joint gain (or loss) in after-tax division profit that enters into the management
compensation computer program. The negotiated transfer price only minimizes the MNC’s
global tax liability (subject to the arm’s length constraint).14 Division management performance-
based compensation depends on after-tax division profit. We assume private division information
(between division managements, and between divisions and top management) concerning each
division’s respective cost and revenue functions, reaction functions, other relevant operating
information and markets, which is consistent with our DDM assumption. The divisions may
share this private information with each other, if faced with adequate incentives to do so.
Nonetheless, we assume that, in the context of private division information, division
14 In the event of a negotiation impasse, the transfer price also coordinates and allocates resources (i.e., the quantity of intra-firm trade) within the decentralized MNC.
25

managements possess common knowledge or publicly-available information, including
information publicly-available within the MNC such as the fact that their negotiations occur in a
positive-sum game. Division managements exhibit bounded rationality, but exercise due
diligence when making management decisions to operate their divisions competently.
When relative bargaining power determines the transfer price, it can adversely affect
manager morale, effort, and productivity. This element of arbitrariness can lead to agency costs.
In our negotiated transfer pricing model, taxable division profit depends on the negotiated
transfer price, but the division profit used for performance evaluation does not. In a bargaining
structure that separates transfer price and performance evaluation decisions, the modified Horst
(1971) CDM solution reemerges. The negotiated transfer price no longer must achieve goal
congruence (i.e., aligning division management’s profit goals with top management’s, or
reducing agency costs) and now plays a more limited role of minimizing the MNC’s world-wide
tax liability only. Some agency costs may remain (e.g., agency costs associated with how the
firm allocates the joint gain between divisions), but they are unrelated to the transfer price. The
form of the allocation mechanism, which division managements may or may not view as fair, is
not critical to our analysis. We will show that an unfair allocation mechanism does not
undermine our modified Horst (1971) solution for negotiated transfer pricing.
Top management implements the following two-stage bargaining structure. In stage one,
division managements negotiate the transfer price and quantity of intra-firm trade to maximize
the expected joint gain in after-tax division profit. In stage two, division managements negotiate
the split in joint gain (loss). The incentive to maximize joint after-tax division profit is rooted in
the following assumptions: (1) Performance evaluation does not depend on the negotiated
transfer price; (2) division managements are rational; (3) division managements hold the
26

authority to negotiate the transfer price and quantity of intra-firm trade; (4) negotiations take
place in a positive-sum game, where (5) this fact is publicly-available, common knowledge; (6)
the length of the bargaining period is limited; and (7) negotiation impasse triggers centralized
transfer pricing. Assumption 1 ensures that the negotiated transfer price does not cause agency
costs. Any concern about the tradeoff between a decentralized MNC’s ability to reach optimal
profits (i.e., the modified CDM Horst (1971) result) while “fostering divisional autonomy”
(Chalos and Haka 1990, p. 625) becomes extraneous. The above assumptions make cooperation
strictly preferable. That is, cooperation dominates a negotiation impasse and a cooperative
solution obtains. In the context of a decentralized MNC facing different tax rates, a negotiation
impasse triggers top management to choose a non-equilibrium transfer price (i.e., ).
leads autonomous division managements to select a sub-optimal, non-equilibrium
quantity of intra-firm trade (i.e.,
Cent 012 12P P≠
Cent 012 12P ≠ P
Cent 012 12X X< ). Negotiation impasse places division managements
in the passive role of selecting an intra-firm quantity supplied and demanded as a reaction to the
centralized transfer price. With cooperation, division managements negotiate a transfer price,
, at either the upper or lower arm’s length boundary (a boundary solution), since this
maximizes the joint gain in after-tax division profit, ceteris paribus, that they will divide in stage
two. They choose the highest (lowest) allowable transfer price when ( t ), ceteris
paribus, which equals the upper (lower) arm’s-length boundary. They also choose
Neg12P
1 2t t< 1 2t>
Neg 012 12X X=
because it maximizes the joint gain in after-tax division profit, ceteris paribus. Although each
division management possesses private information, the existence and knowledge of the positive-
sum game (reinforced by centralized transfer pricing triggered by negotiation impasse) produces
the incentive for rational division managements to cooperate and share relevant information,
27
information that allows them to select the equilibrium intra-firm quantity of trade and the transfer
price on the arm’s length boundary. Notice that, unlike Hirshleifer (1956, 1964), an optimum
result does not depend on complete information. Under incomplete information, division
managements, in the pursuit of their economic self-interest, cooperate and reveal to each other
their respective reaction functions, other relevant operating and market information, and share
transfer pricing studies prepared by outside experts, which are publicly available within the
MNC.
Hansen and Kimbrell (1991) suggest three reasons why division managements know that
negotiations are positive-sum: “(1) the role of a central authority in supplying information; (2)
the expectation that a responsible divisional manager will gather information about his operating
environment; and, (3) open communication which will likely lead to an exchange of information
that, in turn, will lead to a mutual recognition of a joint benefit (in support of this notion, well
documented examples of collusion among competing firms in open markets must be
considered)” (p. 96). Top management can adopt “the role of supplying information to
managers” (p. 88) to encourage division managements to choose the centralized outcome. Top
management’s role of information assimilator does not undermine the firm’s DDM structure,
since “gathering and disseminating information does not constitute an infringement on the
decision-making rights of divisional managers” (p. 88). Further, division managements are
“reasonably informed about their division’s operating environment even without information
being supplied by a central authority” (p. 88). We take this view one step further. We assume
incomplete information, where each party (i.e., top management, division 1, and division 2)
possesses private information. Even with private information, competent, rational division
managements already know that they play a positive-sum game, especially since competent
28

higher-level professionals within an MNC know publicly-available, common knowledge.
In stage two, divisions divide the joint gain (loss) in division after-tax profit. Since a
given bargaining outcome probably reflects each party’s relative bargaining power (Chalos and
Haka 1990; Chatterjee and Samuelson 1987; Abdel-Khalik and Lusk 1974; and Dupuch and
Drake 1964), a generalized Nash bargaining solution allocates the joint gain between divisions.
Specifically, the relative bargaining strength of division managements determines the allocation
of the joint gain. This assumption is not critical to our analysis, however.
Compliance with tax law requires the decentralized MNC to choose the transfer price on,
or within, the arm’s length boundary, but not outside it. By selecting a negotiated transfer price
on the arm’s length boundary and producing an efficient quantity of intra-firm trade, top
management reaches its goal of minimizing its global tax burden (i.e., tax avoidance) while not
evading its tax responsibility. The MNC reports each division’s before-tax (i.e., taxable) arm’s
length profit on its tax return in each country (or on a consolidated tax return) using the
negotiated transfer price. In stage two, division managements negotiate the split of the joint gain
(loss) in after-tax profit between themselves using another method, not involving the transfer
price. For performance evaluation purposes, top management enters into its division
management compensation program a measure of division profit that adjusts for the negotiated
allocation of the joint gain (loss).15
The MNC calculates its after-tax income, for both financial statements and performance
evaluations, as follows. First, the MNC hires a qualified, independent third party to perform and
15 No need exists for a second set of accounting books, because the arm’s length negotiated transfer price and division management expenses, adjusted for the compensation determined by the negotiated allocation of the joint gain, appear in one set of accounting books that computes (GAAP) accounting income for financial reporting purposes and taxable income for income tax purposes. Of course, taxable income may differ from accounting income on the financial statements due to the differences between (GAAP) financial accounting and tax rules, but this difference does not reflect different transfer prices. The MNC reports the same negotiated transfer price, and the income derived from that transfer price, on its tax returns as it does on its financial statements.
29

construct a contemporaneous transfer pricing study for the relevant intra-firm trade. In the
transfer pricing study, the third party calculates a reliable interquartile range (IQR) of transfer
prices for the subject intra-firm transfer(s). Second, sharing information on each division’s costs
and revenues (and other relevant operating information) and knowing the reliable IQR in stage
one of their negotiations, division managements choose the transfer price at the upper or lower
arm’s length boundary (i.e., ) and the quantity of intra-firm trade at Neg UB LB12 12 12P P or P=
Neg 012 12X X= . Third, in stage two, division managements split the joint gain (loss) in after-tax
division profit, and communicate this allocation to top management. Fourth, at the end of the
accounting period, the accounting department calculates each division’s before-tax profit using
the negotiated transfer price and quantity of intra-firm trade, which equal and t1Π t
2Π . The
divisions’ joint gain (loss) in after-tax division profit is as follows:
( ) ( ) ( ) ( )( ) ( ) ( ) ( )
t t t 1 t t t t t tJG MNC MNC 1 1 1 2 2 2
t 1 t 1 t 1 t 1 t 1 t 11 1 1 2 2 2
1 t B 1 t B
1 t B 1 t B
Π Π Π Π Π
Π Π
−
− − − − − −
⎡ ⎤= − = − ⋅ − + − ⋅ −⎢ ⎥⎣ ⎦⎡ ⎤− − ⋅ − + − ⋅ −⎢ ⎥⎣ ⎦
. (19)
Fifth, division performance evaluation profits, which depend on the gain (loss) in after-tax
profits to account for any global tax savings realized, are given as follows:
t t 11PE 1PE t JGΠ Π γ Π−= + ⋅ t and ( )t t 1
2PE 2PE t JG1 tΠ Π γ−= + − ⋅Π
)PE
. (20)
The parameter γ (1 ) measures the negotiated allocation of the joint gain (loss) to division 1
(division 2) for performance evaluation. Sixth, using the MNC’s management compensation
software program, division performance bonuses depend on division performance evaluation
profits as follows:
γ−
(t t1 1B f Π= and ( )t t
2 2B f Π= PE . (21)
Seventh, division before-tax (i.e., taxable) profit, which the MNC reports on its financial
30

statements and income tax returns, are as follows:
( )t t1Fin 1 1
tBΠ Π= − and ( )t t2Fin 2 2
tBΠ Π= − . (22)
Each division management’s base salary already appears in operating expenses in and t1Π t
2Π
calculated in step 4. In equation (22), we subtract division management bonuses to compute
before-tax division profit for financial and tax purposes. Eighth, the MNC calculates and reports
its tax liability for each division on its tax return (or consolidated MNC tax return), and
calculates its after-tax profits for financial reporting. The preceding calculations utilize the five
simultaneous equations in (19), (20), and (21) (i.e., five equations and five unknowns) to capture
the feedback effect that management bonuses, t1B and t
2B , exert on the joint gain in MNC profit,
tJGΠ .16
In sum, with our bargaining structure, the modified Horst (1971) CDM outcome emerges
irrespective of an inequitable allocation mechanism. Even under an allocation mechanism that
depends on bargaining power where the divisions wield extremely unequal bargaining powers,
the relatively stronger-bargaining division management faces an incentive to offer a concession
in stage two that makes the relatively weaker-bargaining division’s performance evaluation
profit at least as much as last period’s performance evaluation profit. The bargaining structure,
which includes a negotiated transfer price that does not influence performance evaluation and a
centrally-determined transfer price in the event of a negotiation impasse, provides that incentive.
By unlinking the transfer price decision from the division management compensation equation,
even under incomplete information a decentralized MNC can achieve the higher after-tax profits
equivalent to the modified Horst (1971) CDM outcome.
t16 The five unknown variables are JGΠ t
1PEΠ t2PEΠ 1
tB 2tB, , , and .
31

6. Licensing Intangible Assets Intra-Firm
MNC intra-firm transfers of intangible assets are extensive. Such transfers, arguably, constitute
the most important aspect of MNCs’ internal trade because much of the market value of modern
firms is derived from the use of intangible assets. Intangibles “have become the most critical
factor for competitiveness” in the global economy (Di Tommaso, Paci and Schweitzer 2004, p.
73). Nonetheless, “little research addresses transfer pricing for intangibles” (Johnson 2006, pp.
339-340). To our knowledge, only four papers directly analyze the economics of transfer pricing
for international intra-firm transfers of intangible assets, Horst (1973), Halperin and Srinidhi
(1996), Boos (2003), and Johnson (2006)17 18
Background and Literature Review
An intangible asset transfer can take the form of a license grant of the right to its use, or an
outright sale. We focus on the license of division 1’s intangible asset(s) intra-firm to division 2.
Intra-firm licensing of intangibles reflects a centralized ownership strategy, where both legal and
beneficial ownership lies with one company in a controlled group (as opposed to a joint, or
distributed, ownership strategy, where one company holds legal ownership but both companies
share beneficial ownership) (Adams and Godshaw 2002). A licensing strategy provides the
greatest opportunity for an MNC to shift profits because, when several companies within a
controlled group legally own separate intangibles (or separate baskets or blocks of intangibles),
“exploitation within the group is by way of a myriad of cross-licenses between operating
companies” (Adams and Godshaw 2002, p. 77) The number and total (dollar) value of cross-
17 An earlier version, Johnson (2005), appears at http://www0.gsb.columbia.edu/rast/Bastian.pdf. 18 In related work, Kopits (1976) estimates the loss in tax revenues generated by abusive transfer pricing practices with respect to intra-firm royalties and license fees by U.S. firms operating, through direct investment, in several industrialized and less developed host countries using 1968 data. Also, Grace and Berg (1990) examine cost sharing of R&D expenses within the MNC to shift profit.
32

licensed intangibles makes the transfer pricing analysis complex and burdensome for tax
authorities to audit, thereby creating a lower probability of a tax audit and an irrefutable tax
adjustment in an audit.
Lev (2001) discusses the “economic laws governing intangible assets”, including their
“partial excludability” and “nonrivalry” (p. 2).19 “The benefits of tangible and financial assets
can be effectively secured (appropriated) by their owners. …The well-defined property rights of
physical and financial assets enable owners to effectively exclude others from enjoying the
benefits of these assets” (p. 33), or to charge a price for their use. “In the case of intangible
investments, however, non-owners can rarely be precluded from enjoying some of the benefits of
the investments” (p. 33), which include direct benefits derived from their use and indirect
benefits (i.e., spillovers or beneficial externalities) to third parties or society. By their very nature
(i.e., many are knowledge-based assets), the mere possession of an intangible asset does not
exclude third parties from also possessing and using it. As described by Johnson (1970), “once
new knowledge has been created it has the character of a public good, in the sense that use of
such knowledge by one person does not preclude use of it by another” (p. 36) because “superior
knowledge developed by a firm can be understood and applied by other firms without their
having to incur the costs of developing the knowledge for themselves” (p. 52). Methods exist to
exclude third parties from using one’s intangible asset, most notably enforceable legal protection
afforded by patents and property rights. But, “patents and property rights are not always
considered effective methods of protecting new knowledge. There are at least three basic
limitations to their effectiveness: the ability of competitors to invent ‘around a patent’, the fact
19 Two important characteristics define pure public goods -- “non excludable” and “nonrival” (Varian 1992, p. 414). Non excludable in consumption means non-owners can enjoy their benefits without paying for their use, or free-ride. Nonrival in consumption means their owner’s use does not reduce the amount or quality of the good available for non-owners to use.
33

that some innovations are difficult to patent, and the fact that patents disclose enough
information to enable imitators to develop variants of the basic technology patented (Geroski,
1995)” (Di Tommaso, Paci and Schweitzer 2004, p. 89). Many firms adopt informal measures to
protect their intellectual property and intangible assets, such as keeping them a trade secret,
making it difficult for competitors to extract usable information through reverse engineering, and
requiring employee confidentiality agreements. Still, such means erect imperfect barriers to free
use. Expecting an unduly rapid dissemination of proprietary intangibles, firms also seek to create
competitive advantages through lead time, the learning curve, and marketing strategies. These
strategies foster company and brand loyalty to create barriers to the effective marketing and sale
of third-party products that use their intangible assets.
Intangible assets also are nonrival in consumption. Lev (2001) states “intangible assets
are, in general, nonrival; they can be deployed at the same time in multiple uses, where a given
deployment does not detract from the usefulness of the asset in other deployments. Accordingly,
many intangible inputs have zero or negligible opportunity costs beyond the original investment”
(p. 22). Nonrival intangible assets also entail a zero or negligible marginal cost of producing
each additional unit, however measured, of the intangible (Di Tommaso, Paci and Schweitzer
2004). Further, since the majority of intangibles are public goods that are nonrival (Boos 2003, p.
18), the majority of intangible assets entail zero (or negligible) marginal production costs.
Unlike a tangible product, which entails a positive marginal production cost, a nonrival
intangible asset entails zero (or negligible) marginal production costs. Once division 1 incurs the
fixed (or sunk) R&D cost of creating an intangible asset, the intangible exists and the right to its
use can transfer to division 2 with zero (or negligible) marginal production cost to division 1.
Johnson (2006) correctly points out, “because of the public good nature of the asset, transferring
34

the asset to Division 2 does not preclude Division 1 from using the asset itself or from
transferring it to other divisions” (p. 344). Once it exists, one person’s (or entity’s) use of the
intangible asset does not reduce the quantity of the intangible asset, however measured, available
for others to use. While an intangible asset’s creation often requires a substantial initial R&D
investment, its dissemination, or production, typically involves zero marginal production costs:
“The cost structure of many information-related intangibles … is characterized by large (and
often sunk) initial investment and marginal-to-zero production costs” (Lev 2001, p. 44) (The
term “marginal” here refers to negligible variable production costs, or negligible marginal
production costs). The MNC can grant additional licenses of an existing intangible asset to others
without developing or producing more units of the intangible asset.
Horst (1973) considers a transfer of a tangible product that embodies division 1’s
intangible asset. The tangible product embodies the intangible as a product feature or a
trademark or trade name, an intangible product feature. In the ordinary course of business,
however, division 1 does not transfer to division 2 the right to exploit commercially the
intangible asset, except, as is customary in the sale of a product, to identify the product feature,
trademark, or trade name to market and sell the product. No royalty payment is appropriate under
the arm’s length standard, since rights to the intangible asset did not transfer to division 2 (Reilly
and Schweihs 1998, p. 472). Typically, for tangible products with product differentiation created
by a valuable intangible feature, the wholesale price exceeds those of non-differentiated
substitute goods. The final 1993 U.S. transfer pricing regulations in §1.482-3(f) “include an
express statement that imbedded intangibles will not be considered a transfer of the intangible if
the controlled purchaser does not acquire any rights to exploit the intangible, other than the right
to resell the tangible property under normal commercial practices” (Cole 2001, Chapter 8, p.
35
22).20 By contrast, this section considers the intra-firm transfer of an intangible asset in the form
of division 1 granting a license to division 2 for the right to use the intangible.
Although Horst (1973) focuses on different issues, he alludes to an important aspect of
intangible assets, when he refers to “the ‘public good’ nature of technology” (p. 81). In his
analysis, both division 1 and division 2 sell an identical tangible product in their respective
countries (i.e., horizontal integration). Division 1’s R&D creates an intangible asset that is
embodied by a new technology in an existing tangible product, which makes the product more
attractive to consumers in both countries. Horst assumes that division 1’s R&D investment leads
to an identical increase in demand for the product faced by each division. This assumption,
presumably, reflects identical consumer preferences (at least with respect to the new
technological aspect of the final product). Horst (1973) argues that this assumption reflects “the
‘public good’ nature of technology within the multinational firm” (p. 81), referring to Johnson
(1970).
Halperin and Srinidhi (1996) consider transfer pricing for intra-firm transfers of
intangible assets internationally. They analyze how transfer price determination under three U.S.
transfer pricing methods (TPMs)21 influences an MNC’s ability to achieve resource efficiency.
20 “Coordination with intangible property rules. The value of an item of tangible property may be affected by the value of intangible property, such as a trademark affixed to the tangible property (embedded intangible). Ordinarily, the transfer of tangible property with an embedded intangible will not be considered a transfer of such intangible if the controlled purchaser does not acquire any rights to exploit the intangible property other than rights relating to the resale of the tangible property under normal commercial practices. … If the transfer of tangible property conveys to the recipient a right to exploit an embedded intangible (other than in connection with the resale of that item of tangible property), it may be necessary to determine the arm’s length consideration for such intangible separately from the tangible property, applying methods appropriate to determining the arm’s length result for a transfer of intangible property under §1.482-4. For example, if the transfer of a machine conveys the right to exploit a manufacturing process incorporated in the machine, then the arm’s length consideration for the transfer of that right must be determined separately under §1.482-4” (§1.482-3(f); italics original). 21 TPMs help taxpayers to determine a reliable arm’s length price or range of prices, and the arm’s length profit or income based on arm’s length intra-firm prices. Under §1.482.4(a), the calculation of an arm’s length royalty for intangibles may use one or more of four TPMs: The Comparable Uncontrolled Transaction method (§1.482-4(c)),
36

They assume CDM, however. In contrast, our analysis assumes DDM with a predetermined
exogenous arm’s length range.22
Boos (2003) analyzes an MNC’s international transfer pricing for intra-firm licensed
intangibles under the assumptions of CDM and complete information. Boos concludes the intra-
firm royalty rate is indeterminate when unconstrained23 and the MNC chooses the highest
(lowest) allowable royalty rate when 1 2t t< ( ), which is the modified Horst (1971) result
under CDM. Boos acknowledges the public good nature of most intangibles and the fact that
“public good intangibles … once produced [,] …can be transferred at no or negligible marginal
costs” (p. 18). In her analysis, however, Boos assumes a positive marginal cost of producing
each unit of the intangible for transfer.
1 2t t>
24 In our analysis of the decentralized MNC, we assume a
zero marginal cost of producing the intangible asset for intra-firm transfer.
Finally, Johnson (2006) considers transfer pricing for intangibles under DDM, focusing
on the effects of different internal transfer pricing policies on the efficiency of each division’s
R&D investment decision. Johnson considers the following transfer pricing policies: (1)
0δV/δT > 0V/δ/ 22 =
the Comparable Profits method (§1.482-5), the Profit Split method (§1.482-6), or unspecified methods (§1.482-4(d)). In §1.482, an intangible asset is called “intangible property”. 22 We implicitly assume an exogenous arm’s length range that reflects the most reliable TPM as determined under the “best method rule” (§1.482-1(c)), in full compliance with the “arm’s length standard” (§1.482-1(b)(1)). U.S. tax law uses the IQR because: “In some cases, application of a pricing method will produce a single result that is the most reliable measure of an arm’s length result. [However,] In other cases, application of a method may produce a number of results from which a range of reliable results may be derived” (§1.482-1(e)). “A taxpayer will not be subject to adjustment if its results fall within such range (arm’s length range)” (§1.482-1(e)). “The interquartile range ordinarily provides an acceptable measure of this range” (§1.482-1(e)(2)(iii)(B)). The interquartile range is calculated according to §1.482-1(e)(2)(iii)(C). . 23 Constraints may include DDM and/or an exogenous arm’s length constraint imposed by tax authorities. 24 Since a demand-influencing intangible “can be either be a new product technology or a marketing intangible” (p. 49), Boos (2003) assumes “trademark M as [the] reference intangible for both [a] technology and marketing intangible” (p. 49). “The costs of producing M are V(M)” (p. 49). V(M) is the variable cost of producing the intangible M, which corresponds to the V(T) function from her analysis of a new process technology (which is a cost-influencing intangible) (p. 45). In that analysis, “The costs of producing the technology T are V(T) where
, δ ” (p. 45).
37

Centralizing transfer pricing, where top management sets the royalty rate before divisions make
R&D investments; (2) negotiated transfer pricing, where divisions negotiate the royalty rate after
division 1 invests in R&D and cannot renegotiate the original license contract, and (3) negotiated
transfer pricing, where divisions can renegotiate the royalty rate after division 1 invests in
R&D.25 Under negotiated transfer pricing with renegotiation, Johnson concludes renegotiation
can generate efficient ex ante investment incentives for both divisions. In a discussion, Baldenius
(2006) suggests Johnson’s “key contribution really lies in highlighting the importance of the
opportunity cost of internal transfers, i.e., the role of alternative uses for the asset” (p. 375). As
Johnson notes, “transfer pricing for intangible assets is different from transfer pricing for
tangible goods in important ways” (p. 341), including their “public good” nature, about which
she states “once it has been developed, it can be disseminated at zero cost” (p. 344). Presumably,
she means that the intangible is nonrival. On the other hand, because of “the inability of local
legal systems to fully protect the asset from appropriation by other parties” (p. 344), it is non-
excludable, absent strong legal protections.26 Therefore, Johnson assumes that division 1’s
marginal opportunity cost of transferring the intangible asset internally, which she defines as “the
price the outside firm is willing to pay” (p. 341) for the intangible, equals zero. That is, “[i]f the
asset is a public good, … there are no opportunity costs associated with its transfer” (p. 353).27
25 Johnson (2006) assumes the intra-firm intangible transfer reassigns ownership, as indicated by various references to the seller and buyer (rather than to a licensor and licensee) and to the initial and final owner. A “royalty” is paid for the right to use another’s intangible asset as part of a license contract, while a purchase price is paid for the sale of an intangible asset. Johnson assumes the purchase price takes the form of a royalty rate because U.S. tax law favors using a royalty rate for transfers of intangibles (p. 345, footnote 13). Presumably, she refers to §1.482-4(f)(1): “Special rules for transfers of intangible property—(1) Form of consideration. If a transferee of an intangible pays nominal or no consideration and the transferor has retained a substantial interest in the property, the arm’s length consideration shall be in the form of a royalty, unless a different form is demonstrably more appropriate” (italics original). 26 To protect an intangible from appropriation, an MNC can limit division 1 from licensing it to third parties. 27 We argue that division 1’s marginal opportunity cost may not equal zero. The next best alternative use may involve division 1 using the intangible asset itself to manufacture and sell its own final product.
38

Facing zero marginal opportunity cost, division 1 possesses less bargaining power, expects a
smaller share of the negotiation surplus, and under-invests in developing the intangible asset.28
Intra-Firm Licensing of Intangible Assets in the Synthesis Model
This section considers how division 1’s (i.e., the licensor’s) zero marginal production cost of
transferring, under license, any quantity of the intangible asset to division 2 affects a
decentralized MNC’s transfer price response to a given change in relative tax rates. Specifically,
how strong are the incentives it faces to choose a transfer price outside the arm’s length
boundary? First, to establish a baseline, we consider the general case with normally-sloped
internal supply and demand curves. Second, we examine the special case where division 1’s
marginal production cost equals zero. For any given licensed quantity of the intangible asset,
however measured, division 1’s marginal cost of supplying the intangible asset is zero, which we
illustrate graphically by a horizontal internal supply curve located on the quantity axis in Figure
3. We then compare the two alternative cases.
The Synthesis Model with Intra-Firm Licensing. With intra-firm goods or service trade,
equals the price-per-unit of the intra-firm good or service,
12P
12X , that division 2 uses in its
production and sale of the final good, . If intra-firm trade involves a licensed intangible asset,
equals the royalty-per-unit of the intra-firm intangible asset,
2Y
12P 12X , used by division 2 in its
production and sale of the final good, . Since, in practice, it is difficult to measure the actual 2Y
28 Johnson (2006) calls this a “hold-up” problem. We argue, however, that a significant hold-up problem may not exist with intra-firm licensing. The typical licensor experiences a significant incentive to invest in developing the intangible asset because its investment return (i.e., royalty payment) links to the licensee’s sales revenue for the final product, which, in turn, creates the incentive to develop fully the intangible asset to ensure high licensee sales revenue. The typical licensor retains the right to use the intangible asset, and/or to license it to third parties, which further promotes the licensor’s incentive to develop fully the intangible asset. We assume that division 1 has fully developed the intangible asset and, therefore, a hold-up problem does not exist.
39

quantity of the licensor’s intangible asset used by the licensee, 12X , the typical royalty links to
the quantity of the final good sold, . Further, to better reflect the marginal increase in market
power or profitability enjoyed by the licensee through its use of the licensor’s intangible asset,
typically the royalty base equals the licensee’s sales revenue,
2Y
2 2P Y . We assume that the royalty
applies to 100 percent of division 2’s sales revenue, 2 2P Y (which, based on the royalty contract,
accrues separately from the sales of its other products). Without the license to use division 1’s
intangible asset, division 2 would not generate sales receipts for the final good.29 The total
royalty payment per period, R , equals the royalty rate, , times the royalty base, 12r 2 2P Y :
(12 2 2 )R r P Y= ⋅ . The royalty-per-unit of the final good sold by division 2 is 12 2r P , which also is
the transfer price (i.e., 12 12 2P r P≡ ). By convention, we assume that . Thus, the
royalty-per-unit,
( )2 12Y f X X= = 12
12 2Pr , reverts back to the royalty-per-unit of the intangible asset used by
division 2, 12X . With 12 12 2P r P≡ , equations (2’) and (3’) become the following:
( 12X )1 12 2 12 1Π r P X C= − ; and (2'')
( )2 2 12 2 12X r12 2 12Π P X γ P X= − − . (3'')
Under DDM, ( ) ( ) ( )12 12 12 2 12 2 12 1212X X r P X r ;P X r= ⋅ == .
The General Case. The transfer price for an intangible intra-firm transfer equals 12 2r P . The
29 This does not mean that division 2 may not sell a similar product. For example, if the intangible reflects a design or new product technology, the new product feature may make an existing product more useful to, and therefore in higher demand by, consumers than the existing product without the new feature. Division 2 sells the new product and pays a royalty based on that product’s sales revenue, and also sells a similar product without the new feature. By contrast, if the intangible improves an existing product feature, then 2 2P Y is division 2’s incremental sales revenue because it reflects sales above its sales absent the licensed intangible. Division 2 then produces good 2 with the old product feature and with the improved product feature, paying a royalty only on its sales of good 2 with the improved product feature.
40

transfer price response to a given change in tax rates equals those in equations (14) and (15), but
with 12 2r P substituted for . That is, 12P
( ) *12 2 12
1 1
d r P dP AAdt dt CC= = and ( ) *
12 2 12
2 2
d r P dP BBdt dt CC= = .30 (24)
Top management, in its selection of the royalty rate, maximizes after-tax profit, which means the
second-order condition for profit-maximization holds (i.e., ). Under DDM, CC 0<
(12 12 12 )X X r= . The MNC’s internal demand (supply) curve for the licensed intangible asset
slopes downward (upward) (see Figure 2).31 Under centralized transfer pricing, division 2
(division 1) chooses a quantity of the intangible asset to license from division 1 (license to
division 2) to maximize ( ), subject to the selected by top management. To maximize 2Π 1Π 12r
MNCΠ , top management responds to changes in relative national corporate profit tax rates by
adjusting the royalty rate, , which effectively adjusts the transfer price, 12r12r 2P . The signs and
magnitudes of the comparative static results, ( )*12d r 2
1
Pdt and ( )*12 2
2
d r Pdt , equal those for
tangible transfers. See equations (16), (17), and (18).
A Horizontal Licensor Supply Curve. Due to the nonrival nature of an intangible asset, division
1’s marginal cost of producing additional units of the intangible asset equals zero (i.e., '1C 0= )
and remains zero at every quantity of the intangible asset licensed (i.e., ). Figure 3
illustrates this with a horizontal internal supply curve for the intangible asset located on the
quantity axis. The intangible asset’s past and ongoing development costs, as well as any
''1C = 0
30 See Appendix A for the definitions of AA, BB and CC. 31 See Appendix A for the derivation of the slopes.
41

maintenance costs (such as annual patent fees), remain fixed and do not vary in relation to the
quantity of the intangible asset licensed (and in relation to the royalty base, licensee sales
revenue).
Since division 1’s marginal cost curve is its internal supply curve, the supply and demand
curves intersect at a transfer price of zero. Refer to ( )0
12 2r P in Figure 3. At this transfer price (and
implied royalty rate, ), the optimal quantity of intangible asset licensed intra-firm, , is
larger than with a positive-sloped supply curve. The tax authorities still constrain the transfer
price to lie within a positive arm’s length range, illustrated by the two horizontal dashed lines in
Figure 3. When complying with tax law, centralized transfer pricing produces an inefficient
quantity of intra-firm trade within the
012r = 0 0
12X
1 2t t12X < -to- range. Under the MNC’s optimal internal
transfer pricing policy, negotiated transfer pricing, our bargaining structure creates sufficient
incentives for division managements to agree on a transfer price at either the upper or lower
arm’s length boundary, and to select the optimal quantity of intra-firm trade,
1 2t t12X >
012X . For intra-firm
intangible licensing under our negotiated transfer price bargaining structure, the lawful MNC
shifts a larger before-tax profit from one country to another for a given change in its transfer
price. For example, regarding a change in transfer price from the upper to the lower arm’s length
boundary (i.e., a change corresponding to country 1’s tax rate becoming higher than country 2’s),
the profit shift to division 2 is measured by area ACDF in Figure 3, while the profit shift for
tangible goods trade is area ABEF.32 The larger (dollar) profit shift per (dollar) transfer price
adjustment for intangible asset licenses gives tax authorities in high-tax countries good reason
32 By contrast, if the transfer price applies to both tax returns and performance evaluations, relative bargaining or market power within the MNC’s internal market probably would lead to a negotiated transfer price within the arm’s length boundaries. An internal solution for the transfer price associates with a lower quantity of intra-firm trade, as determined by division 2’s demand curve at the selected internal transfer price.
42

for concern about the potential for transfer pricing abuses. In other words, intra-firm intangible
asset trade may increase the incentive for transfer price abuse as well as for tax competition
between jurisdictions, important issues for tax authorities.
When an MNC perceives the arm’s length range as a guideline, rather than a strict
constraint, it estimates the probability of a tax audit (or a tax adjustment in an audit) along with
the potential tax savings when deciding if, or by how much, to violate the arm’s length range
(Kant 1988). In theory, our arm’s length constraint is fixed but, in practice, it may vary. The
probability of audit (or tax adjustment in audit) relates inversely with the inexact nature of arm’s
length transfer price determination and the disinclination of tax enforcement. Given the inexact
nature of the valuation and determination of the arm’s length transfer price for intangibles, more
room exists to push the envelope than with tangible goods trade. Practitioners know that the
relative abundance of comparable uncontrolled transactions makes the determination of the
arm’s length range for tangible goods fairly concrete, while the relative lack of comparable
uncontrolled license agreements for licensed intangibles makes the determination of the arm’s
length range for intangibles more debatable and controversial. The difficulty in arm’s length
transfer price determination for intangibles makes the estimated arm’s length range for
intangibles inherently less reliable and, thus, subject to greater challenge and compromise. In
general, less reliable arm’s length price estimates cause taxpayers to perceive a lower probability
of audit (or adjustment when audited) for a given deviation from the arm’s length range. For
given incentives to practice transfer pricing abuse, a weaker arm’s length constraint increases the
likelihood of abuse, ceteris paribus.
In sum, our analysis shows that MNCs experience a greater incentive to violate the arm’s
length range when transferring intangible assets intra-firm under license. For a given tax rate
43

change under negotiated transfer pricing, the larger quantity of intra-firm trade for intangibles
raises the potential tax savings for each (dollar) transfer price deviation outside the arm’s length
range, strengthening the incentive and potential for transfer price abuse.33 A perceived weaker
arm’s length constraint releases that potential for abuse. Thus, tax authorities should audit a
greater number of intangible asset transactions and invest greater resources to train tax audit
specialists to identify and audit transfer pricing abuses for intangibles relative to tangibles. A
binding arm’s length constraint makes this result moot because a greater desire to shift profit
cannot materialize. In practice, however, MNCs can, and do, set transfer prices outside the arm’s
length boundary, reflecting the view that the arm’s length range for intangibles is a guideline
rather than an unwavering, perfectly-enforced constraint.
7. Conclusion
This paper reviews and extends the existing literature on transfer pricing for tangible goods and
intangible asset licenses, focusing on the MNC with a DDM structure. Horst (1971) provides a
benchmark model for the MNC under CDM. We introduce a synthesis model to review the
existing literature. In addition to our literature review, our extensions develop a strategy for the
decentralized MNC to achieve the first-best outcome of Horst (1971) through negotiated transfer
pricing. To do so, we separate the performance evaluation of division managers from their
transfer price decision. That is, the transfer price only affects the relocation of profit between
countries to minimize the MNC’s tax liability, subject to transfer pricing regulations.
Performance evaluation relies on a management compensation program that uses a different
measure of performance than the profit distribution reported for tax purposes. Further, our
synthesis model considers royalties on the licensing of intangible assets between divisions of a
33 Governments also experience a greater incentive to engage in tax competition.
44
decentralized MNC, finding a greater incentive for MNC’s to practice abusive transfer pricing
for intangibles than tangibles (as well as a greater incentive for governments to engage in tax
competition).
In our negotiated transfer pricing analysis, top management implements a two-step
bargaining process. In step one, division managements cooperate and negotiate the transfer price
and quantity of intra-firm trade to maximize (minimize) the joint gain (loss) in after-tax profit. In
step two, division managements divide the joint gain (loss) in profit. With our bargaining
structure, divisions face sufficient economic incentives to make firm-wide optimal decisions at
the division level. They select the transfer price on either the upper or lower arm’s length
boundary and the equilibrium intra-firm quantity of trade to maximize (minimize) the MNC’s
gain (loss) in after-tax profit. The MNC uses the negotiated transfer price to calculate its profits
for both financial statement and tax purposes. To evaluate the performance of each division for
their bonuses, however, divisions negotiate an allocation of the joint gain (loss) in MNC after-tax
profit and communicate that allocation to top management for entry into its compensation
program. The separation of the transfer price choice from the calculation of performance bonuses
ensures the first-best solution of Horst (1971), which we call the modified Horst solution.
One might criticize our analysis because it assumes a binding arm’s length constraint. For
both tangible and intangible intra-firm transfers under DDM, we conclude the MNC selects a
negotiated transfer price on the upper or lower boundaries of an (implicitly) undisputed, binding
arm’s length range, but not outside that range. In this context, does the analysis of transfer
pricing abuse appear meaningful? When applying our model in practice, we relax the binding
arm’s length constraint assumption.
In practice, the type of intra-firm transfer (i.e., tangible or intangible) can affect the
45

nature of the arm’s length range. With tangible products, the availability of comparable (or near-
comparable) uncontrolled transactions and prices, as well as the more visible and understandable
link between the price of tangible products and their underlying determinants, make the
estimation of the arm’s length range relatively transparent. Practitioners hired by MNCs cannot
easily move the arm’s length constraint (using alternative TPMs, or applying a given TPM in a
different way) or select a transfer price outside a given arm’s length range.
With intra-firm intangible licenses, a reliable arm’s length range for the royalty rate
proves more difficult to estimate due to the typical lack of access to privately kept comparable
(or near-comparable) license agreements, the lack of comparability (or near-comparability) of
available license agreements (due to the inherently diverse nature of proprietary intangible
assets), and the less visible and understandable link between the price of intangible transfers and
their fundamental determinants. As a result, subjectivity plays a large part in the royalty rate
determination and less agreement exists about the arm’s length range, such that in practice the
arm’s length range tax authorities estimate provides a guideline rather than a binding constraint.
As a result, MNCs are tempted to select a transfer price outside the arm’s length guideline range
depending on the probability of a tax audit and the probability of an adjustment in a tax audit. A
lower probability enhances the temptation.
In general, practitioners are more likely to challenge the arm’s length range estimated by
tax authorities for intangible transfers and offer an alternative transfer pricing analysis, often
resulting in a much different estimate of the arm’s length range. Not only are practitioners more
willing to move the arm’s length range based on the less precise nature and lower reliability of
estimating the arm’s length range for intangibles, MNCs are more willing to take a chance on
selecting a transfer price outside the guideline arm’s length range. In this sense, when applying
46

our theoretical results to practice, we view the arm’s length constraint for intangibles as a less
binding, more flexible constraint that allows motivated MNCs to manipulate their transfer prices
for intangibles by a greater magnitude than for their tangibles. Since the MNC experiences a
greater incentive to manipulate its transfer prices for intangibles than tangibles and the nature of
transfer price determination for intangibles is less precise, it is imperative for tax authorities to
devote more resources to auditing intra-firm trade of intangibles. This concern becomes all the
more important as a large portion of international trade occurs through intra-firm transfers with
an increasing portion involving intangible assets.
References: Abdel-Khalik, A. Rashad, and Edward J. Lusk. 1974. Transfer Pricing—A Synthesis. The
Accounting Review 49(1): 8-23. Adams, Chris D., and Gerald M. Godshaw. 2002. Intellectual Property and Transfer Pricing.
International Tax Review (Supplement: Intellectual Property) 13(4): 74-81. Baldenius, Tim. 2006. Discussion of ‘Divisional Performance Measurement and Transfer Pricing
for Intangible Assets’. Review of Accounting Studies 11(2-3); 367-376. Bartlett, Christopher A., and Sumantra Ghoshal. 1993. Beyond the M-Form: Toward a
Managerial Theory of the Firm.” Strategic Management Journal 14: 23-46. Bernard, Jean-Thomas, and Robert J Weiner. 1990. Multinational Corporations, Transfer Prices,
and Taxes: Evidence from the U.S. Petroleum Industry, in Razin and Slemrod, eds. Taxation in the Global Economy. Chicago: University of Chicago Press.
Bernard, Jean-Thomas, and Robert J Weiner. 1989. Multinational Corporations, Transfer Prices,
and Taxes: Evidence from the U.S. Petroleum Industry. NBER Working Paper No. 3013. Bond, Eric W. 1980. Optimal Transfer Pricing When Tax Rates Differ. Southern Economic
Journal 47(1): 191-200. Booth, E. J. R., and Oscar W. Jensen. 1977. Transfer Prices in the Global Corporation Under
Internal and External Constraints. Canadian Journal of Economics 10: 434-446. Borkowski, Susan C. 1992. Organizational and International Factors Affecting Multinational
Transfer Pricing, in Most, Kenneth S., ed., Advances in International Accounting, Volume 5. A Research Annual. Greenwich, Connecticut: JAI Press, pp. 173-192.
47

Boos, Monica. 2003. International Transfer Pricing: The Valuation of Intangible Assets. The Hague, The Netherlands: Kluwer Law International.
Chalos, Peter, and Susan Haka. 1990. Transfer Pricing Under Bilateral Bargaining. The
Accounting Review 65(3): 624-641. Chatterjee, Kaylan and Larry Samuelson. 1987. Bargaining with Two-Sided Incomplete
Information: An Infinite Horizon Model With Alternating Offers. Review of Economic Studies LIV (1987): 175-192.
Choi, Yoon K. and Theodore E. Day. 1998. Transfer Pricing, Incentive Compensation and Tax
Avoidance in a Multi-Division Firm. Review of Quantitative Finance and Accounting 11: 139-164.
Cole, Robert T (Editor and principal author). 2001. Practical Guide to U.S. Transfer Pricing. 2nd
Edition, Arlington, Virginia, USA: Tax Analysts.. Copithorne, L. W. 1971. International Corporate Transfer Prices and Government Policy.
Canadian Journal of Economics IV: 324-341. Dawson, Peter C. 1999. Transfer Price Determination in a Multinational Corporation:
Decentralized Decision-Making, Agency Costs, and Strategic Interaction. Ph.D. Dissertation, The University of Connecticut.
Dean, Joel. 1955. Decentralization and Intra-Company Pricing. Harvard Business Review 33(4):
65-74. Diewert, W. Erwin, William F. Alterman, and Lorraine Eden. 2004. Transfer Prices and Import
and Export Price Indexes: Theory and Practice. June 4, 2004 version, which was presented at the SSHRC Conference on Price Index Concepts and Measurement held at the Fairmont Waterfront Hotel, Vancouver Canada, June 30-July 3, 2004.
Diewert, W. Erwin, William F. Alterman, and Lorraine Eden. 2005. Transfer Prices and Import
and Export Price Indexes: Theory and Practice. March 18, 2005 version. University of British Columbia, Department of Economics, Discussion Paper 05-08.
Di Tommaso, Marco R., Daniele Paci and Stuart O. Schweitzer. 2004. Clustering of Intangibles,
pp. 73-102 in Bianchi, Patrizio, and Sandrine Labory, Eds., The Economic Importance of Intangible Assets, Burlington VT, USA: Ashgate Publishing Company.
Donnenfeld, Shabtai, and Thomas J. Prusa. 1995. Monitoring and Coordination in MNCs:
Implications for Transfer Pricing and Intra-Firm Trade. Journal of Economic Integration 10(2): 230-255.
48

Dorgan, Byron. 2002. Dorgan Releases Study that Shows Multinational Corporations use Phony Pricing Schemes to Avoid $53.1 Billion in U.S. Taxes, News Release, November 1, 2002, Byron Dorgan, U.S. Senator, North Dakota, 713 Hart Senate Office Building. Website: http://dorgan/senate.gov/newsroom/record.cfm?id=187978.
Dupuch, Nicholas, and David F. Drake. 1964. Accounting Implications of a Mathematical
Programming Approach to the Transfer Pricing Problem. Journal of Accounting Research 2: 10-24.
Dworin, Lowell. 1990. Transfer Pricing Issues. National Tax Journal 43(3): 285-291. Eccles, Robert G. 1985a. Transfer Price as a Problem of Agency, in Principals and Agents: The
Structure of Business, Pratt, John W. and Richard Zeckhauser, eds. Boston, MA: Harvard Business School Press, pp. 151-186.
Eccles, Robert G. 1985b. The Transfer Pricing Problem: A Theory for Practice. Lexington,
Massachusetts: Lexington Books. Eden, Lorraine. 1985. The Microeconomics of Transfer Pricing. Chapter 2 in Rugman, Alan M.,
and Lorraine Eden, Multinationals and Transfer Pricing, New York: St. Martins Press, pp. 13-46.
Eden, Lorraine. 2003. The Internationalization Benefits of Transfer Pricing Manipulation. Bush
School Working Paper #315, The Bush School of Government and Public Service, Texas A&M University.
Ernst & Young. 2007. 2007-2008 Global Transfer Pricing Survey: Global Transfer Pricing
Trends, Practices, and Analyses. International Tax Services department. Website: http://www.ey.com/global/content.nsf/International/2007-2008_Transfer_Pricing_Global_Survey (Last visited on January 17, 2008).
Geroski, Paul. 1995. Markets for Technology: Knowledge, Innovation and Appropriability, in
Stoneman, P., Ed., Handbook of the Economics of Innovation and Technological Change, Oxford: Blackwell.
Grabski, Severin V. 1985. Transfer Pricing in Complex Organizations: A Review and Integration
of Recent Empirical and Analytical Research.” Journal of Accounting Literature 4: 33-75.
Grace, Martin F. and Sanford V. Berg. 1990. Multinational Enterprises, Tax Policy and R&D
Expenses. Southern Economic Journal, 57: 125-138. Grubert, Harry, and John Mutti. 1991. Taxes, Tariffs and Transfer Pricing in Multinational
Corporate Decision-Making. Review of Economics and Statistics 73(2): 285-293.
49

Guttman, George. 1999. International Panels Explore Challenges of Transfer Pricing. Tax Notes. 85: 590. (this summary document refers to the original 6-page document, Doc 1999-35039, which was released on October 28, 1999).
Halperin, Robert M., and Bin Srinidhi. 1991. U.S. Income Tax Transfer-Pricing Rules and
Resource Allocation: The Case of Decentralized Multinational Firms. The Accounting Review 66(1): 141-157.
Halperin, Robert, and Bin Srinidhi. 1996. U.S. Income Tax Transfer Pricing Rules For
Intangibles as Approximations of Arm’s Length Pricing. The Accounting Review 71(1): 61-80.
Hansen, Don R., and Janet I. Kimbrell. 1991. Transfer Pricing and Efficiency: A Game Theoretic
Perspective for Divisionalized Firms, in Schwartz, Bill N., ed., Advances in Accounting, vol. 9, Greenwich, Connecticut: JAI Press, pp. 79-101.
Harris, David, Randall Morck, Joel Slemrod, and Bernard Yeung. 1993. Income Shifting in U.S.
Multinational Corporations, in Giovannini, Hubard, and Slemrod, eds. Studies in International Taxation. Chicago: University of Chicago Press.
Hass, Jerome E. 1968. Transfer Pricing in a Decentralized Firm. Management Science 14(6): B-
310 - B-331. Hines, James R. and Eric M. Rice. 1994. Fiscal Paradise: Foreign Tax Havens and American
Business. Quarterly Journal of Economics 109(1): 149-182. Hirshleifer, Jack. 1956. On The Economics of Transfer Pricing. Journal of Business 29: 172-184. Hirshleifer, Jack. 1964. Internal Pricing and Decentralized Decisions. Chapter 2 in Management
Controls: New Directions in Basic Research, by Bonini, Charles P., Robert K. Jaedicke, and Harvey M. Wagner, Eds. New York: McGraw-Hill, pp. 27-37.
Horst, Thomas. 1971. The Theory of the Multinational Firm: Optimal Behavior under Different
Tariff and Tax Rates. Journal of Political Economy 79: 1059-1072. Horst, Thomas. 1973. The Simple Analysis of Multi-National Firm Behaviour. Chapter 5 in
International Trade and Money, Connolly, Michael B., and Alexander K Swoboda, Eds. George Allen & Unwin LTD, 1973. pp. 72-84.
Jenkins, Gordon E., and Brian D. Wright. 1975. Taxation of Income of Multinational
Corporations: The Case of the U.S. Petroleum Industry. Review of Economics and Statistics 57(1): 1-11.
50
Johnson, Nicole Bastian. 2005. Divisional Performance Measurement and Transfer Pricing for Intangible Assets. Working Paper. Haas School of Business, University of California, Berkeley. Website: http://www0.gsb.columbia.edu/rast/Bastian.pdf (last visited March 18, 2008).
Johnson, Nicole Bastian. 2006. Divisional Performance Measurement and Transfer Pricing for
Intangible Assets. Review of Accounting Studies 11: 339-365. Johnson, Harry G. 1970. The Efficiency and Welfare Implications of the International
Corporation, in Kindleberger, C. P., editor, The International Corporation: A Symposium. Cambridge, MA: MIT Press, pp. 35-56.
Kant, Chandler. 1988. Endogenous Transfer Pricing and The Effects of Uncertain Regulation.
Journal of International Economics 24: 147-157. Kopits, George F. 1976. Intra-Firm Royalties Crossing Frontiers and Transfer Pricing Behavior.
Economic Journal 86: 791-805. Lall, Sanjaya. 1973. Transfer-Pricing by Multinational Manufacturing Firms. Oxford Bulletin of
Economics and Statistics 35(3): 173-195. Lecraw, Donald J. 1985. Some Evidence on Transfer Pricing by Multinational Corporations.
Chapter 12 in Rugman, Alan M., and Lorraine Eden, Multinationals and Transfer Pricing. New York: St. Martins Press, pp. 223-240.
Lev, Baruch. 2001. Intangibles: Management, Measurement, and Reporting. Washington, D.C.:
Brookings Institution Press. Pak, Simon J., and John S. Zdanowicz. 1994(a). An Estimate of Lost U.S. Federal Income Tax
Revenues Due to Over-Invoiced Imports & Under-Invoiced Exports. Trade Research Institute, Report 9404-01.
Pak, Simon J., and John S. Zdanowicz. 1994(b). A Statistical Analysis of the U.S. Merchandise
Trade Data Base And Its Uses in Transfer Pricing Compliance and Enforcement", Tax Management Transfer Pricing Report 3(1): 50-57.
Pak, Simon J., and John S Zdanowicz. 2002. U.S. Trade with the World: An Estimate of 2001
Lost U.S. Federal Income Tax Revenues due to Over-Invoiced Imports and Under-Invoiced Exports. Executive Summary to the U.S. Senate. Website: http://dorgan.senate.gov/newsroom/extras/pak-zdan.pdf (Last visited on January 18, 2008).
Price Waterhouse. 1984. Transfer Pricing Practices of American Industry. Mimeo. Columbus
Ohio.
51

Reilly, Robert F., and Robert P. Schweihs. 1998. Valuing Intangible Assets. McGraw-Hill: New York.
Ronen, Joshua, and George McKinney, III. 1970. Transfer Pricing for Divisional Autonomy.
Journal of Accounting Research (Spring): 99-112. Schaub, H. James. 1978. Transfer Pricing in a Decentralized Organization. Management
Accounting (April): 33-36, 42. Schjelderup, Guttorm, and Lars Sørgard. 1995. The Multinational Firm, Transfer Pricing and
The Nature of Competition. Center For Economic Studies Working Paper No. 95, Munich Germany.
Sharav, Itzhak. 1974. Transfer Pricing—Diversity of Goals and Practices. The Journal of
Accountancy (April): 56-62. Spicer, Barry H. 1988. Towards An Organizational Theory of the Transfer Pricing Process.
Accounting, Organizations and Society 13(3): 303-322. Stanley, Georgin. 2001. Transfer Pricing Takes Centre Stage. International Tax Review. 12(9):
25-31. Tang, Roger Y. W., C. K. Walter, and Robert H. Raymond. 1979. Transfer Pricing—Japanese
vs. American Style. Management Accounting (January): 12-16. Vaitsos, Constantine V. 1974. Intercountry Income Distribution and Transnational Enterprises.
Oxford: Clarendon Press. Vancil, Richard F. 1978. Decentralization: Managerial Ambiguity by Design. Homewood, IL:
Dow Jones-Irwin. Varian, Hal R. 1992. Microeconomic Analysis. Third Edition. New York: W. W. Norton &
Company. Vaysman, Igor. 1998. A Model of Negotiated Transfer Pricing. Journal of Accounting and
Economics 25: 349-384. Williamson, Oliver. 1975. Markets and Hierarchies: Analysis and Antitrust Implications. New
York: The Free Press. Wu, Frederick H., and Douglas Sharp. 1979. An Empirical Study of Transfer Pricing Practice.
The International Journal of Accounting 14: 71-99.
52

Appendix A:
Hirshleifer (1956, 1964): The first-order conditions for division 1 and 2 come from equations
(2) and (3) as follows:
'1s 12 112
dΠ P C 0dX = − = and '2d 2 2 1212
dΠ P γ P 0dX = − − = .
Take the total differential, set it equal to zero, and solve, giving the following results:
s *s ' 12
''1212 1
dX 1X 0dP C= = > and d *
d ' 12''12
12 2
dX 1X 0dP γ= = − < .
With increasing marginal costs, and . ''1C > 0
=
''2γ 0>
Derivation of Price Effects: The total differential of top management’s first-order condition is
. 1 2 12[AA] dt [BB] dt [CC] dP 0− − +
Solving produces the following:
*
12
1
dP AAdt CC
= and *
12
2
dP BBdt CC
= ,
where , ( )' '12 1 12 12AA P C X X⎡ ⎤= − +⎣ ⎦ ( )' '
2 2 12 12 12BB P γ P X X⎡ ⎤= − − −⎣ ⎦ , and
( ) ){ ( ) ( } ( ) ( ) ( ){ }2 2' ' '' '12 12 1 12 12 X X C P C X− + − '' ' ' '' ' ''
1 12 2 12 12 2 2 2 12 12CC 1 t 1 t 2 X X γ P γ P X= − + − − − + − − .
Based on the assumption of profit-maximization, the second-order condition holds (i.e.,
). With linear supply and demand curves, CC 0< CC 0< , which is derived as follows. With
s ''12
d ''12
''12X X X= =
1<
0= 12 2CC 2 X t
''2γ 0> ''
1C >
20 t 1< < 1 2t t< 1 2t t>
, . With
increasing marginal costs ( , ), positive national tax rates between zero and one
( , ), and ( ) when the MNC operates along the
( ) ( ) ( ) ( )2 2' ' ' '' '1 1 2 12 2t C t 1 γ X t 1⎡ ⎤= − − + −⎢ ⎥⎣ ⎦
0
d12
( )'1 12X+
10 t< X ( s12X ) curve,
(see the next subsection for the derivation of these tax conditions). CC 0<
53

Derivation of Tax Conditions: When operating along division 1’s supply curve, top
management’s first-order condition is
( )( )( )
212' '
12 2 12 12 12
1 tX1 tP γ P X X
−−=
−− − −.
Given and , we know 10 t 1< < 20 t 1< <( )( )
2
1
1 t0
1 t−
>−
, which means
( )' '12 12P X⎡
⎣ 2 2 12P γ X 0− − − <⎤⎦ . We also know ( )'2 2 12P γ P 0− − > and '
12X 0> when the MNC
operates along the supply curve, which means ( )' '2 2 12 12P γ P X X− − < 12 . Therefore,
( )( )
2
1
1 t1
1 t−
>−
,
and . When the MNC operates along division 2’s demand curve, top management’s first-
order condition is
1t > 2t
( ) ( )( )
' '12 1 12 12 2
12 1
P C X X 1 tX 1 t
⎡ ⎤− − + −⎣ ⎦ =− −
.
We know ( )( )
2
1
1 t0
1 t−
>−
, which means ( )' '12 1 12 12P C X X 0⎡ ⎤− + >⎣ ⎦ . We also know and ( )'
12 1P C 0− >
'12X 0< when the MNC operates along the demand curve, which means ( )' '
1 12P C X− <12 12X .
Therefore, ( )( )
2
1
1 t1
1 t−
<−
, and . 1 2t t<
Intangible Assets: The terms in equation (20) equal the following:
12 12 2P r P≡ , ( )' '12 2 1 12 12AA r P C X X⎡ ⎤= − +⎣ ⎦ , ( )' '
2 2 12 2 12 12BB P γ r P X X⎡ ⎤= − − −⎣ ⎦ , and
( ) ( ) ( ){ }( ) ( ) ( ){ }
2' ' '' ' ''1 12 12 1 12 2 1 12
2' ' '' ' ''2 12 12 2 2 2 12 2 12
1 t 2 X X C r P C XCC
+ 1 t 2 X X γ P γ r P X
⎡ ⎤− − + −⎢ ⎥= ⎢ ⎥⎢ ⎥− − − + − −⎣ ⎦
.
54

Slopes of Demand and Supply Curves: Division 2’s first-order condition for profit
maximization equals the following:
'22 2 12 2
12
Π P γ r P 0X∂ = − − =∂ .
It chooses a quantity of the intangible asset to license intra-firm at the point where its net
marginal revenue from selling good 2, 2 12 2P r P− , equals its marginal cost of producing good 2,
. The total differential of the first-order condition provides the slope of division 2’s demand
curve as follows:
'2γ
( )d
d ' 12''12212 2
dX 1X 0γd r P= = − < , or ( )12 2 ''
d 212
d r Pγ 0dX = − < .
Division 1’s first-order condition equals the following:
'112 2 1
12
Π r P C 0X∂ = − =∂ .
It chooses a quantity of the intangible asset to supply under the license where the marginal
royalty revenue, 12 2r P , equals the marginal cost of producing the intangible asset, . The total
differential provides the slope of division 1’s supply curve generates the following:
'1C
( )s
s ' 12''12112 2
dX 1X 0Cd r P= = > , or ( )12 2 ''
s 112
d r PC 0dX = > .
55
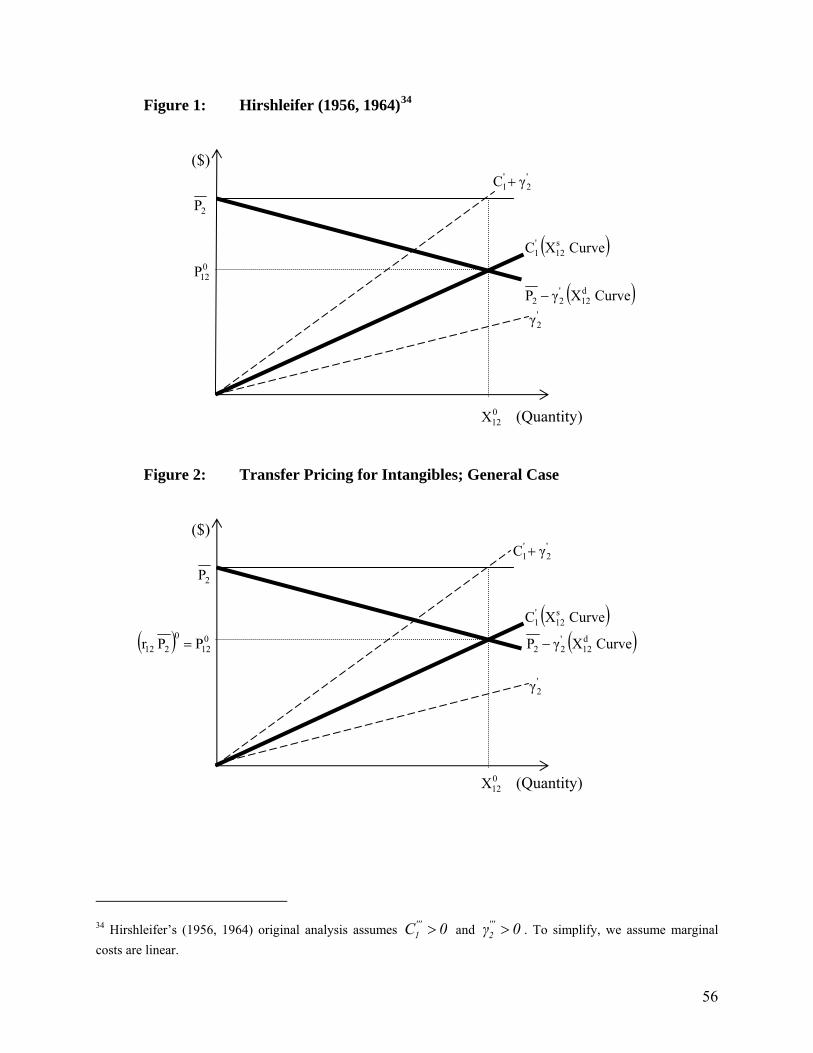
Figure 1: Hirshleifer (1956, 1964)34
($) '
2'1 γC +
2P ( )CurveXC s
12'1
012P
( )CurveXγP d12
'22 −
'2γ
(Quantity) 0
12X
Figure 2: Transfer Pricing for Intangibles; General Case
($) '
2'1 γC +
2P ( )CurveXC s
12'1
( ) 012
0212 PPr = ( )CurveXγP d
12'22 −
'
2γ (Quantity) 0
12X
'''1C 0> '''
2 0>34 Hirshleifer’s (1956, 1964) original analysis assumes and γ . To simplify, we assume marginal costs are linear.
56

Figure 3: Transfer Pricing for Intangibles: Horizontal Supply
($) '
2γ 2P
A B C
F E D
( )0212 Pr
(Quantity) 21 tt12X < 21 tt
12X > 012X
( ) 2
UB12
*tt212 PrPr
21=< ( )CurveXC s
12'1
( ) 2LB
12*
tt212 PrPr21=> ( )CurveXγP d
12'22 −
Arm’s Length Range
57