internet ofwind 4
TRANSCRIPT
Internet of Wind 4.0NextGen SCADAGregor Biering,
Team Lead Application Development
RWE Renewables International GmbH
Internet of Wind 4.0, RWE Renewables, Gregor Biering
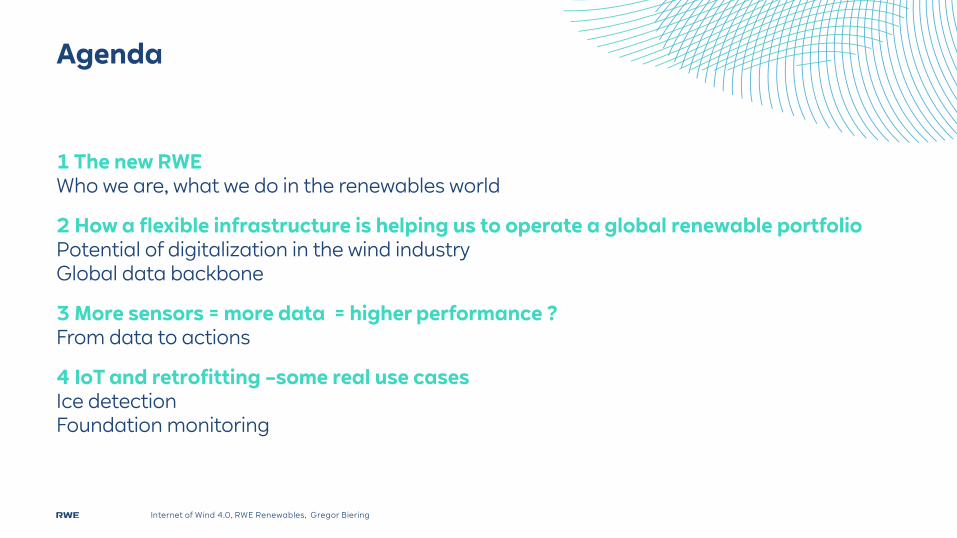
1 The new RWEWho we are, what we do in the renewables world
2 How a flexible infrastructure is helping us to operate a global renewable portfolioPotential of digitalization in the wind industryGlobal data backbone
3 More sensors = more data = higher performance ?From data to actions
4 IoT and retrofitting –some real use casesIce detectionFoundation monitoring
Agenda
Internet of Wind 4.0, RWE Renewables, Gregor Biering
The new RWE
65%
26%
6%3%
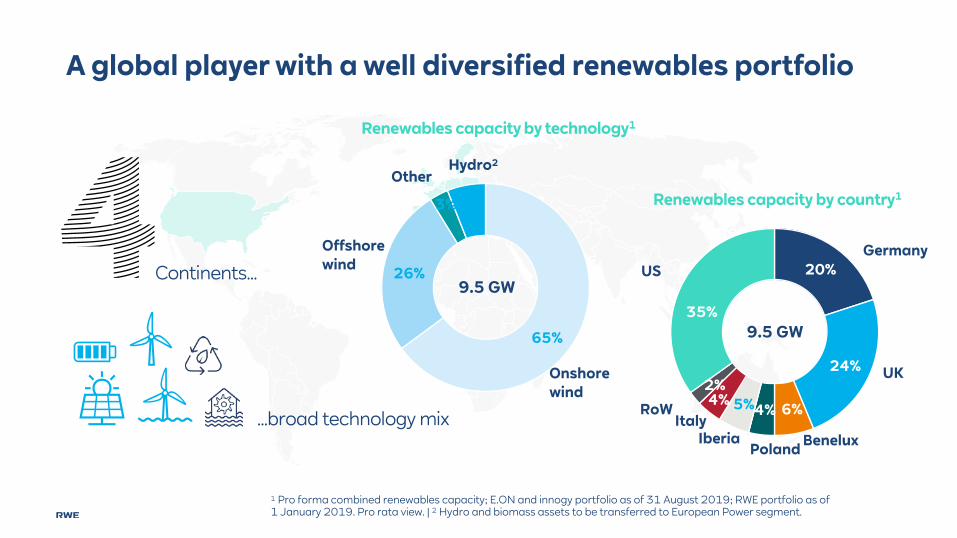
Renewables capacity by technology1
A global player with a well diversified renewables portfolio
20%
24%
6%4%5%
35%
2%4%
Renewables capacity by country1
9.5 GW
9.5 GW
Onshorewind
Offshorewind
Hydro2
Other
Germany
UK
Iberia BeneluxItaly
US
RoW
Poland
1 Pro forma combined renewables capacity; E.ON and innogy portfolio as of 31 August 2019; RWE portfolio as of 1 January 2019. Pro rata view. | 2 Hydro and biomass assets to be transferred to European Power segment.
Continents…
…broad technology mix

Globally owned renewables capacity1
RWE Renewables well positioned from the start
1 Excluding Chinese players. Includes onshore wind, offshore wind, solar, small hydro, marine, geothermal and biomass. | Source: BNEF, as of 31 Aug 2019.
RWE Renewables
No. worldwide
No. in Europe
No. in offshore wind

Internet of Wind 4.0, RWE Renewables, Gregor Biering
Three women, three men, different nationalities - one board

Internet of Wind 4.0, RWE Renewables, Gregor Biering
We are “operating in a box” – bound in three dimensions: Unit margin (Price – cost)/ unitTime to produceOutput performance
Output/ performance
Time
Unit margin

Internet of Wind 4.0, RWE Renewables, Gregor Biering
Reduce O&M costsReactive to predictive maintenance Optimize revenuesInsource margins – self-perform as economic Risk & opportunity management
Optimize costs and revenues
Increase energetic availabilityIncrease lifetime of windfarmDecrease maintenance timesAvoid unplanned outagesReduce return to service times Dynamic maintenance schemes
Increase the time we can operate
Identify underperforming assetsOptimize turbine performanceReduce losses inside the wind farmOptimize control algorithm
Increase Output / performance
Business performance Optimization

Utilizing the central data pools in different Apps is creating benefits for the business
Internet of Wind 4.0, RWE Renewables, Gregor Biering
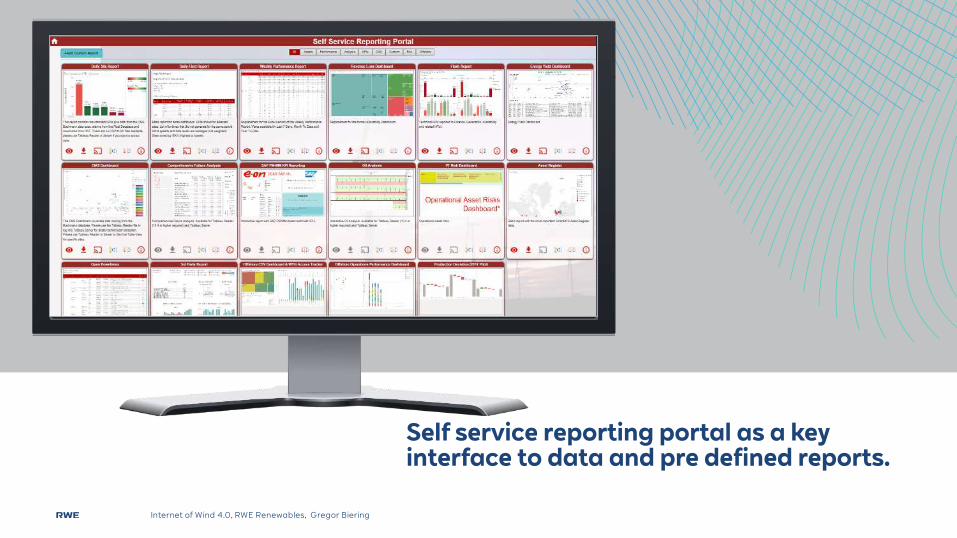
Self service reporting portal as a key interface to data and pre defined reports.
Internet of Wind 4.0, RWE Renewables, Gregor Biering

How a flexible infrastructure is helping us to operate a global renewable portfolio
Internet of Wind 4.0, RWE Renewables, Gregor Biering
Internet of Wind 4.0, RWE Renewables, Gregor Biering
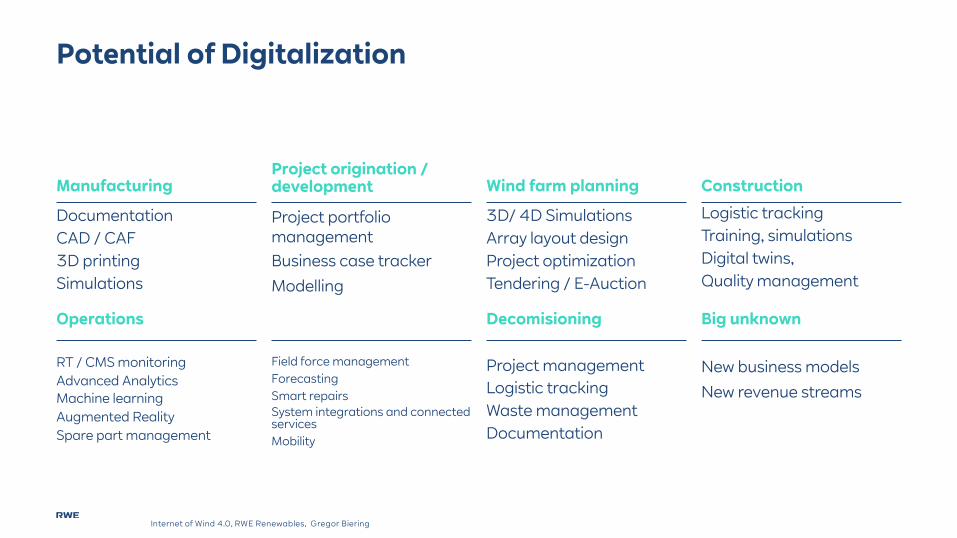
Logistic trackingTraining, simulationsDigital twins, Quality management
Construction
3D/ 4D SimulationsArray layout designProject optimizationTendering / E-Auction
Wind farm planning
Project portfolio managementBusiness case trackerModelling
Project origination / development
DocumentationCAD / CAF3D printingSimulations
Manufacturing
Potential of Digitalization
New business modelsNew revenue streams
Big unknown
Project managementLogistic trackingWaste managementDocumentation
Decomisioning
Field force managementForecastingSmart repairsSystem integrations and connected servicesMobility
RT / CMS monitoringAdvanced AnalyticsMachine learningAugmented RealitySpare part management
Operations

Infrastructure at the Wind- and PV farm
Analytics& Reports
RT Apps
SQL Server
CMS
SCADA
SQL
Server
CMS
Bluebox
O&M
Greenbox
Real time
Historical
Connecting Infrastructure at the assets
Central Infrastructure and applications
Internet of Wind 4.0, RWE Renewables, Gregor Biering
How to connect to the assets and manage the data?
Majority of components are not standardized but related to a dedicated supplier or technology
Bridging layer to transport and standardize towards a central infrastructure
Processing layer
Strong separation between the different layers

Internet of Wind 4.0, RWE Renewables, Gregor Biering
Where to store and process the data?
Central Infrastructure and applications
Processing layer
Analytics& Reports
RT Apps
SQL Server
CMS
vs
Flexible on short term and peak resource demands(faster deployment on „hardware“)
Just cost effective if deployed cloud native
Subscription / license cost increased by business growthTraining requiredLess control on security, data, updates and version
Predictable hardware costsFull control on security, data, updates and versionGreater ability to customize
Not flexible on short term and peak resourcedemands (slow deployment on hardware)Ongoing maintenance efforts
Pros
Con
Pros
Con
On premise
Cloud

Internet of Wind 4.0, RWE Renewables, Gregor Biering
How to enable cloud / on premise best-of-breed?
Central Infrastructure and applications
Processing layer
Analytics& Reports
RT Apps
SQL Server
CMS
a
vs
Advanced Analytics
Machine learning
Process automation related to reporting
Datalake
RT / CMS monitoring with predicable growth
Proprietary system without cloud native options
Simulations
Gateway / management layer
On premise
Cloud
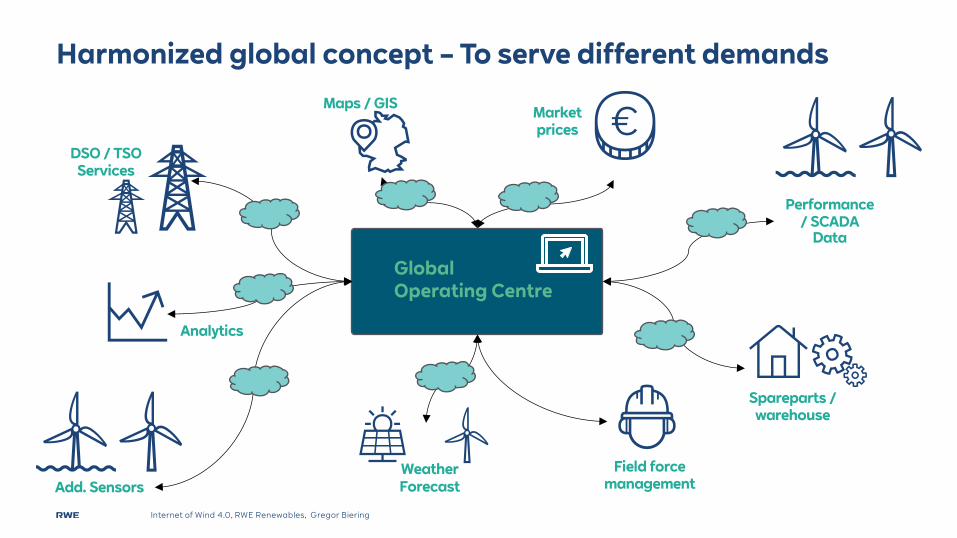
Harmonized global concept – To serve different demands
Add. Sensors
Analytics
Maps / GIS
Field forcemanagement
Spareparts / warehouse
Performance / SCADA
Data
DSO / TSO Services
Market prices
WeatherForecast
Global Operating Centre
Internet of Wind 4.0, RWE Renewables, Gregor Biering

Harmonized global concept – Based on a hybrid infrastructure
Internet of Wind 4.0, RWE Renewables, Gregor Biering
Global Operating Centre
On premise Multi CloudLocal componentsCloud 1 Cloud 2
Solutiondeployment has changed over time
Local devices are require to gather data. Amount of devices increases
New solutions are developed cloudnative if possible. Existing solutions aremigrated.
Cloud enables more flexibility in regardsto analytics and process automation

More sensors = more data = higher performance ?
Internet of Wind 4.0, RWE Renewables, Gregor Biering
Internet of Wind 4.0, RWE Renewables, Gregor Biering
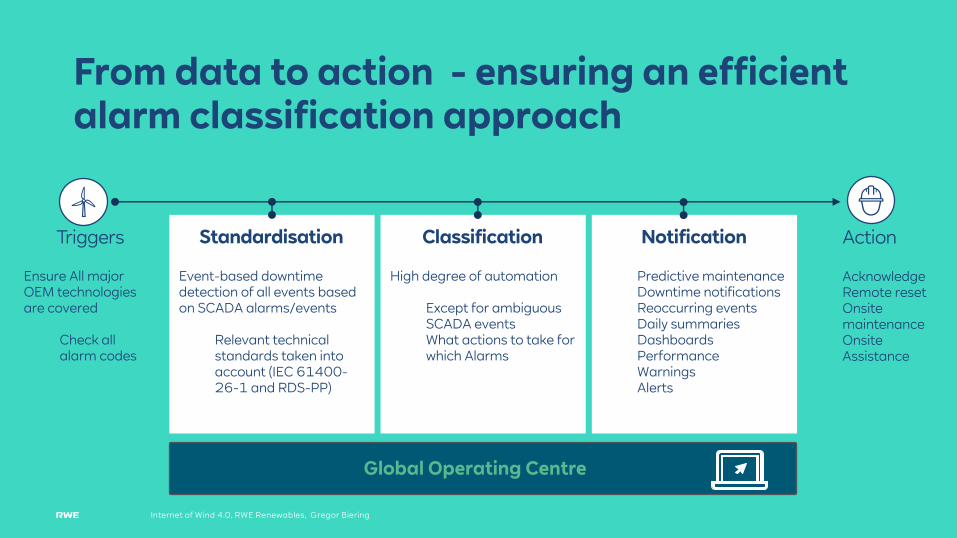
From data to action - ensuring an efficient alarm classification approach
Standardisation Classification Notification
Predictive maintenanceDowntime notificationsReoccurring eventsDaily summaries DashboardsPerformance Warnings Alerts
Triggers Action
Ensure All major OEM technologies are covered
Check all alarm codes
Event-based downtime detection of all events based on SCADA alarms/events
Relevant technical standards taken into account (IEC 61400-26-1 and RDS-PP)
High degree of automation
Except for ambiguous SCADA eventsWhat actions to take for which Alarms
AcknowledgeRemote reset Onsite maintenanceOnsite Assistance
Global Operating Centre
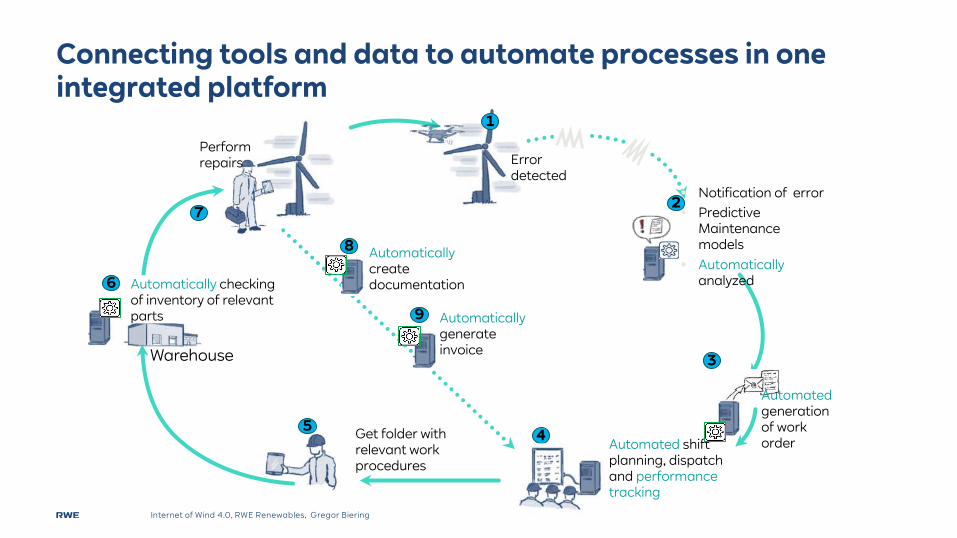
Connecting tools and data to automate processes in one integrated platform
Automatedgeneration of work orderAutomated shift
planning, dispatch and performance tracking
Automatically checking of inventory of relevant parts
Automaticallycreate documentation
Automaticallygenerate invoice
1
3
4
6
7
8
9
5
§ Notification of error§ Predictive
Maintenance models
§ Automaticallyanalyzed
2
Get folder with relevant work procedures
Warehouse
Perform repairs Error
detected
Internet of Wind 4.0, RWE Renewables, Gregor Biering

Internet of Wind 4.0, RWE Renewables, Gregor Biering
With common installed hardware significant amounts of 10min SCADA data are collected that can be used for predictive maintenance (PM)
SCADA data usually include mechanical, electrical and hydraulic data plus event codes
RWE Renewables developed the PredATur® tool to:
Utilize machine learning methods to identify turbines with deviating signalsProvide a user interface for analysts and technicians to check the turbines signals and alertsAutomatically categorize downtimes and provide a user friendly way to re-categorizeConnect SAP to link maintenance with downtime information and PM detectionsAnalyze vibration measurements, if available
Systematic data analysis – increase efficiency and reduce costs with PredATur® (Predictive Analytics of Turbines)
Motivation
Internet of Wind 4.0, RWE Renewables, Gregor Biering
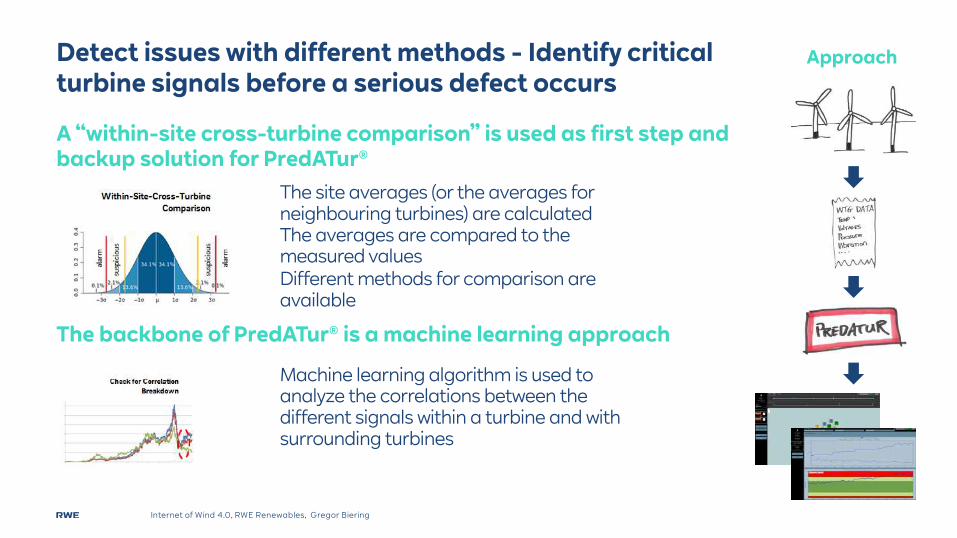
A “within-site cross-turbine comparison” is used as first step and backup solution for PredATur®
The backbone of PredATur® is a machine learning approach
Detect issues with different methods - Identify critical turbine signals before a serious defect occurs
Approach
The site averages (or the averages for neighbouring turbines) are calculatedThe averages are compared to the measured valuesDifferent methods for comparison are available
Machine learning algorithm is used to analyze the correlations between the different signals within a turbine and with surrounding turbines
Internet of Wind 4.0, RWE Renewables, Gregor Biering
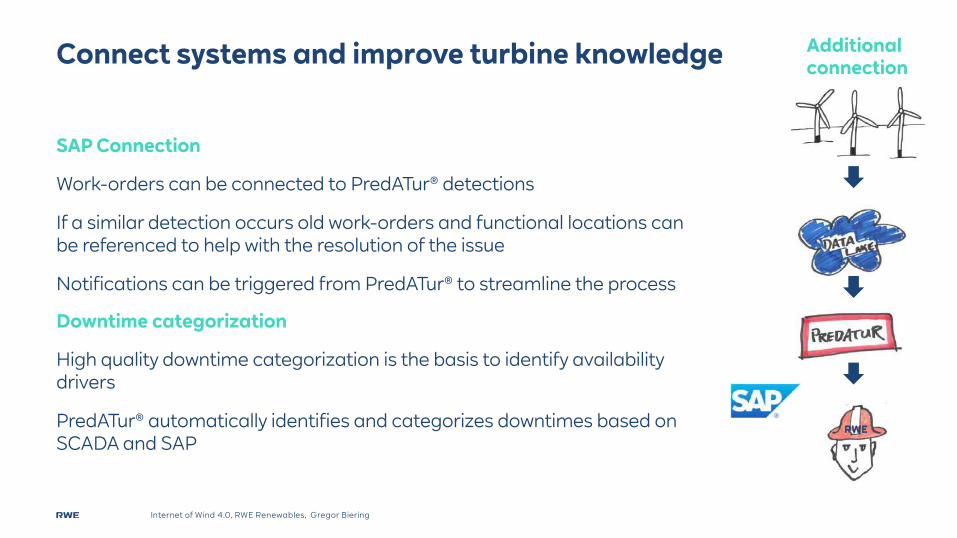
SAP Connection
Work-orders can be connected to PredATur® detections
If a similar detection occurs old work-orders and functional locations can be referenced to help with the resolution of the issue
Notifications can be triggered from PredATur® to streamline the process
Downtime categorization
High quality downtime categorization is the basis to identify availability drivers
PredATur® automatically identifies and categorizes downtimes based on SCADA and SAP
Connect systems and improve turbine knowledge Additional connection
Internet of Wind 4.0, RWE Renewables, Gregor Biering
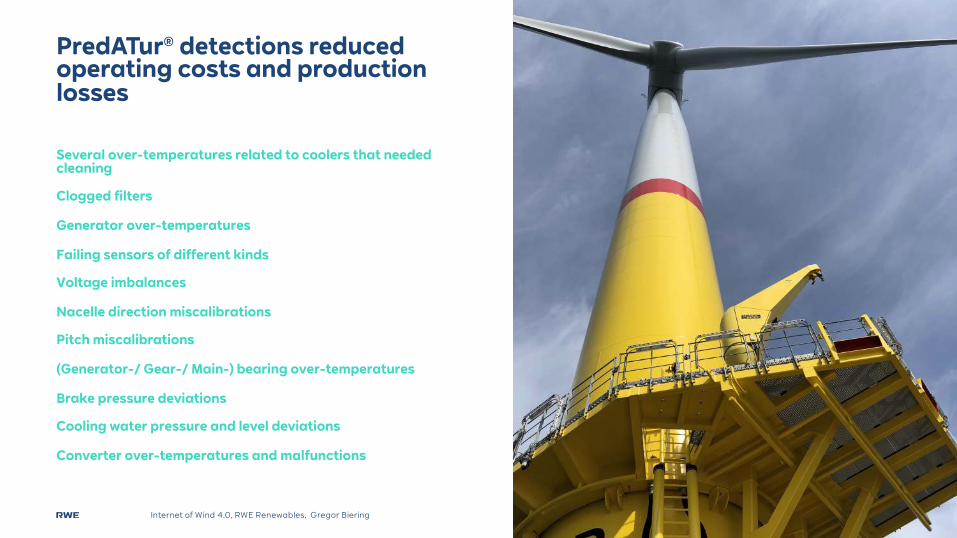
Several over-temperatures related to coolers that needed cleaning
Clogged filters
Generator over-temperatures
Failing sensors of different kinds
Voltage imbalances
Nacelle direction miscalibrations
Pitch miscalibrations
(Generator-/ Gear-/ Main-) bearing over-temperatures
Brake pressure deviations
Cooling water pressure and level deviations
Converter over-temperatures and malfunctions
PredATur® detections reduced operating costs and production losses

IoT and retrofitting –some real use cases
Internet of Wind 4.0, RWE Renewables, Gregor Biering
Internet of Wind 4.0, RWE Renewables, Gregor Biering
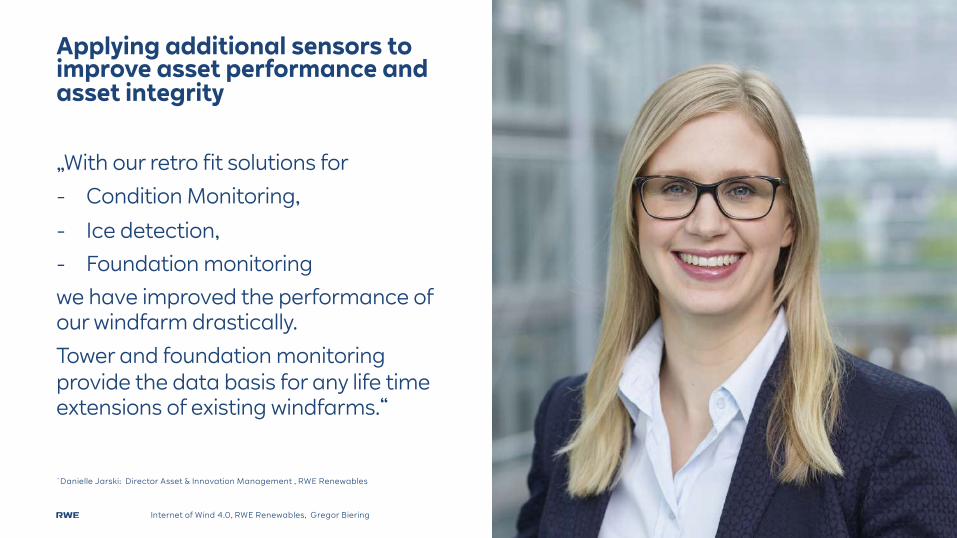
´Danielle Jarski: Director Asset & Innovation Management , RWE Renewables
„With our retro fit solutions for - Condition Monitoring,
- Ice detection,- Foundation monitoringwe have improved the performance of our windfarm drastically. Tower and foundation monitoring provide the data basis for any life time extensions of existing windfarms.“
Applying additional sensors to improve asset performance and asset integrity
Internet of Wind 4.0, RWE Renewables, Gregor Biering
Icing
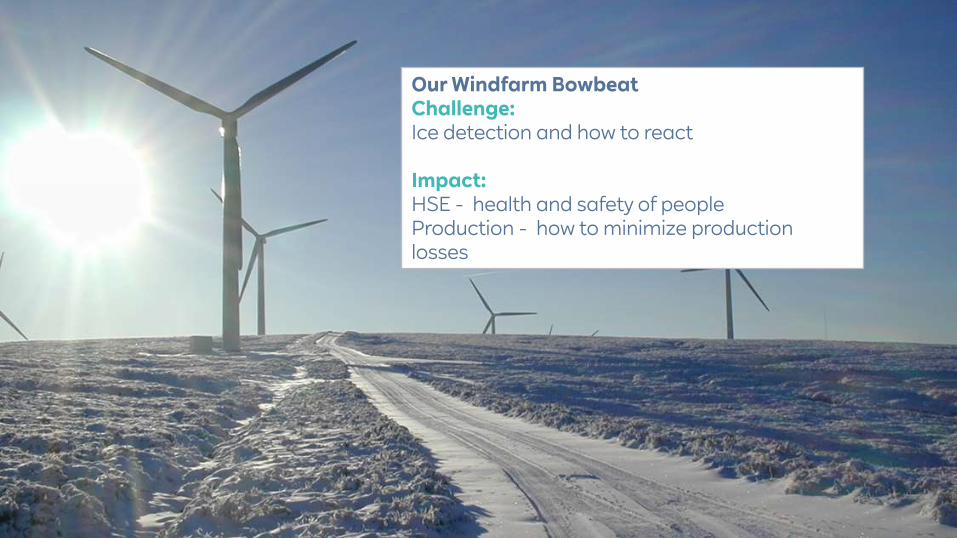
Our Windfarm BowbeatChallenge: Ice detection and how to react
Impact: HSE - health and safety of peopleProduction - how to minimize production losses
Internet of Wind 4.0, RWE Renewables, Gregor Biering
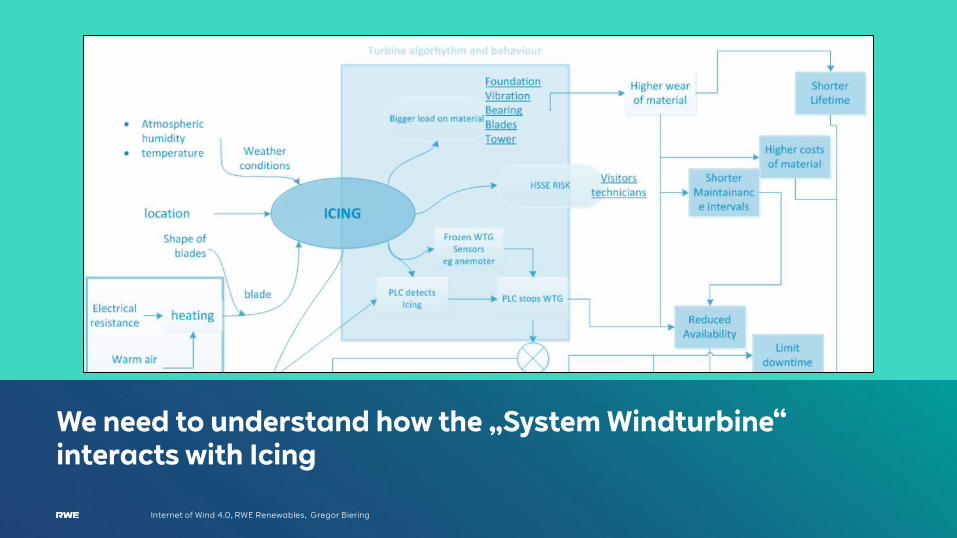
We need to understand how the „System Windturbine“ interacts with Icing
Internet of Wind 4.0, RWE Renewables, Gregor Biering
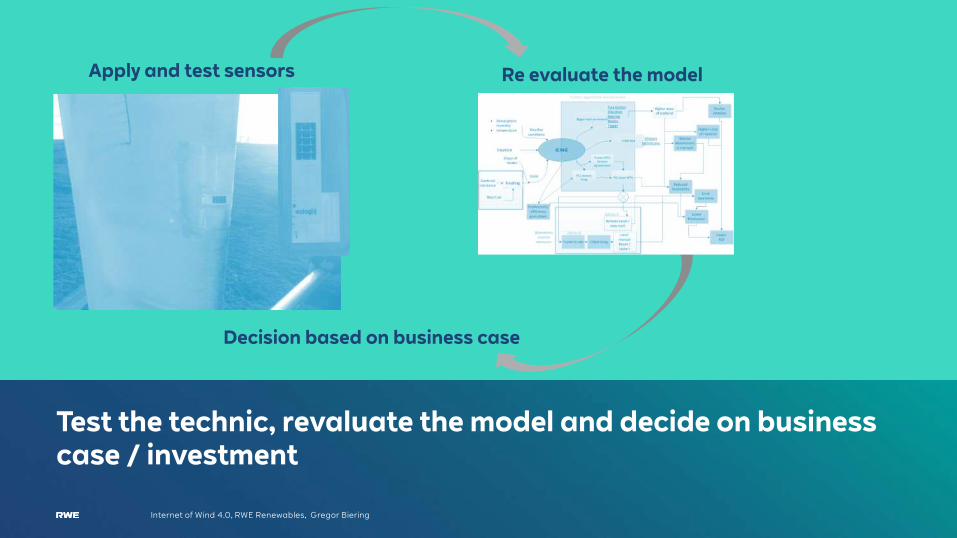
Test the technic, revaluate the model and decide on business case / investment
Apply and test sensors Re evaluate the model
Decision based on business case

Internet of Wind 4.0, RWE Renewables, Gregor Biering
Tower and foundation monitoring create the basis for lifetime extension
Internet of Wind 4.0, RWE Renewables, Gregor Biering
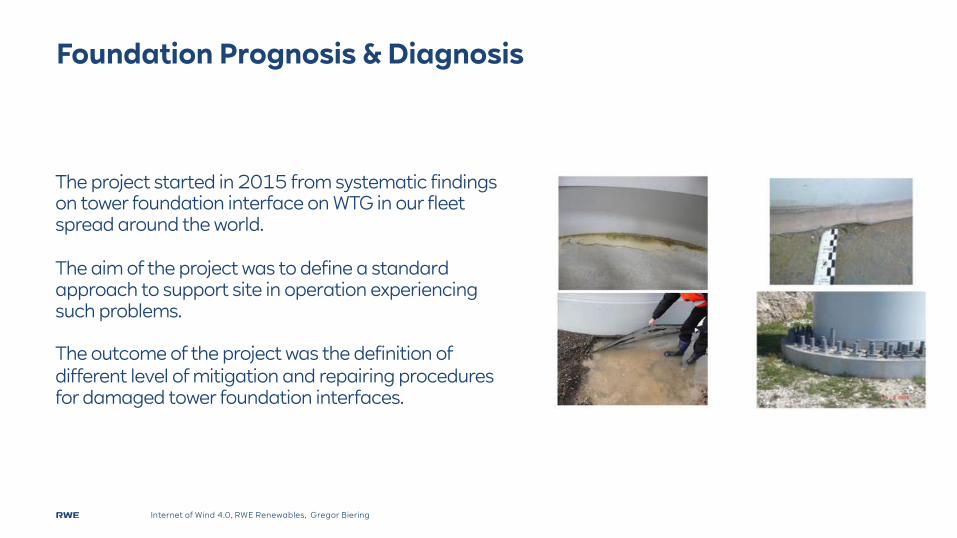
Foundation Prognosis & Diagnosis
The project started in 2015 from systematic findings on tower foundation interface on WTG in our fleet spread around the world.
The aim of the project was to define a standard approach to support site in operation experiencing such problems.
The outcome of the project was the definition of different level of mitigation and repairing procedures for damaged tower foundation interfaces.
Internet of Wind 4.0, RWE Renewables, Gregor Biering
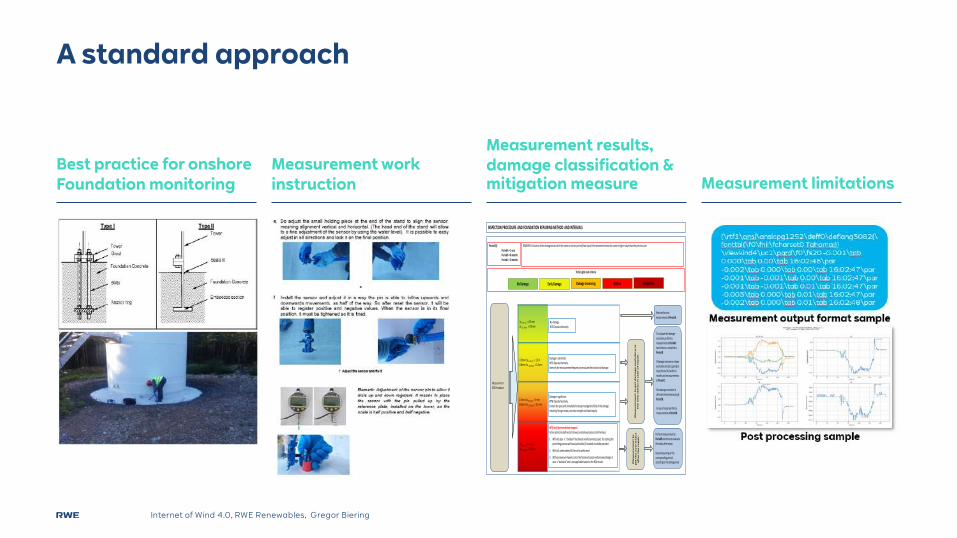
Measurement limitations
Measurement results, damage classification & mitigation measure
Measurement work instruction
Best practice for onshore Foundation monitoring
A standard approach
Measurement ECR Procedure
Me
asu
re
me
nt t
o g
et d
am
ag
e e
vo
lutio
n o
r
th
e n
ew
sta
tu
s in
ca
se
of r
ep
air
.
Perform the next measurement at Period A.
Perform measurement at Period B two times to evaluate the status after repair.
Keep meassuring at the corresponding period according to the damage level.
Period (X):Period A = 1 yearPeriod B = 6 monthsPeriod C = 3 months
To evaluate the damage evolution, perform a measurement at Period Ctwo times to a complete a Period B.
If damage increases or shows evolution contact a specialist to perform a RCA within 6 months and meassurements at Period C.
If no damage evolution is detected, keep meassuring at Period B.
In case of repair perform a meassurement at Period B.
REMARKS: Evolution of the damage means after the same or shorter period (from repair) the movement shows the same or higher value than the previous one.
Ds 8-12 m/s < 0.5 mmDs 12-18 m/s < 0.8 mm
No damage.WTG Operate Normally.
1.5mm <Ds 8-12 m/s < 3 mm1.8mm <Ds 12-18 m/s < 3.5 mm
Damage is significant. WTG Operate Normally.Contact the specialist inmediatly for deep investigation (RCA) of the damageincluding: Design review, concrete strength and slab integrity.
Ds 8-12 m/s > 3 mmDs 12-18 m/s > 3.5 mm
WTG shall be immediately stopped.Action plan to be defined as follows (orientative proccess and timelines):
1. Within 3 days a "standard" mechanical reinforcement project for starting the permitting process with local authorities (if needed) should be provided .
2. Within 2 weeks a deep RCA must be performed.
3. Within maximum 4 weeks, tailor the final mechanical reinforcement design in case a "standard" one is not applicable based on the RCA results.
0.5mm <Ds 8-12 m/s < 1.5 m0.8mm <Ds 12-18 m/s < 1.8 mm
Damage is identified.WTG Operate Normally.Intensify the meassurement frequency to evaluate the evolution of damage.
Me
asu
re
me
nt t
o
ge
t t
he
ne
w s
ta
tu
s
aft
er t
he
re
pa
ir.
Trafic Lights code criteria:
No Damage Early Damage Damage Increasing Critical Dangerous
INSPECTION PROCEDURE AND FOUNDATION REPAIRING METHOD AND INTERVALS
Internet of Wind 4.0, RWE Renewables, Gregor Biering
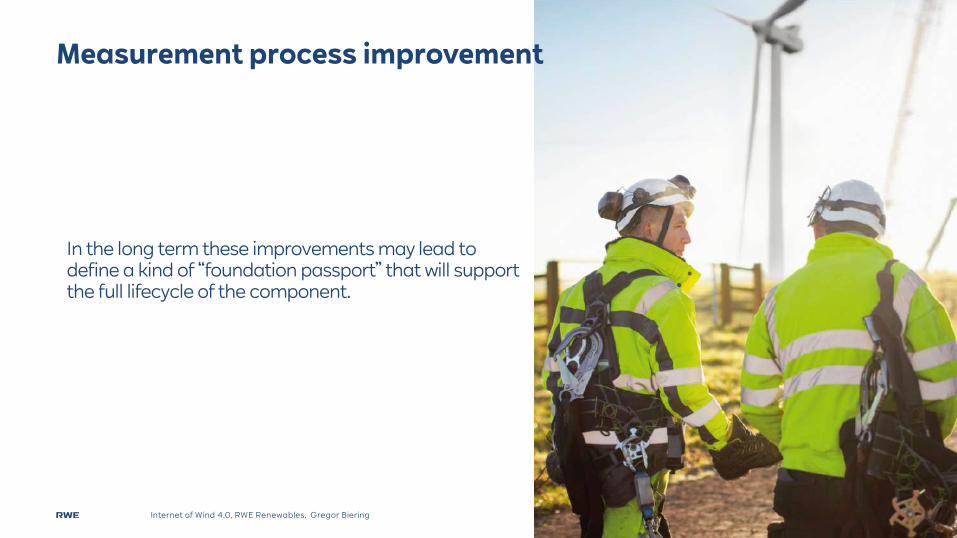
Measurement process improvement
In the long term these improvements may lead to define a kind of “foundation passport” that will support the full lifecycle of the component.
Internet of Wind 4.0, RWE Renewables, Gregor Biering
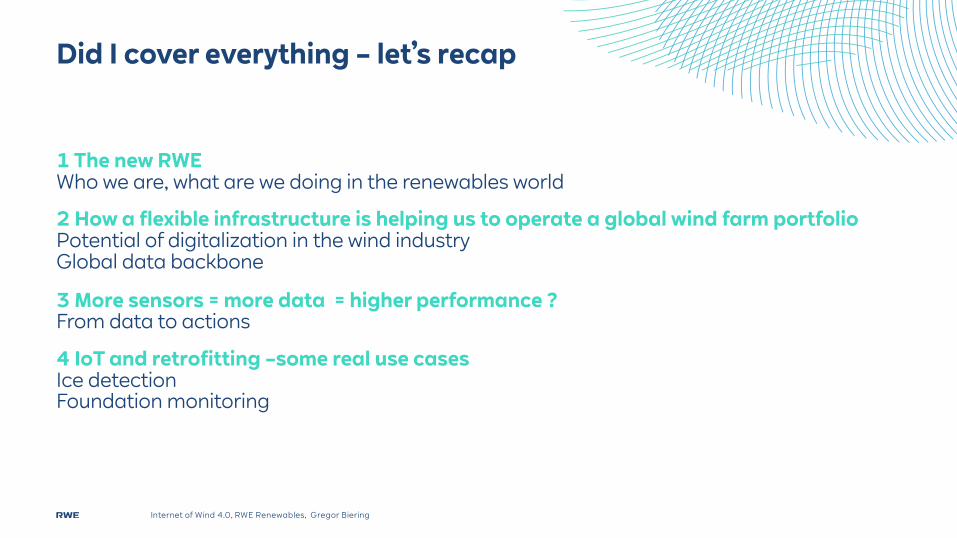
1 The new RWEWho we are, what are we doing in the renewables world
2 How a flexible infrastructure is helping us to operate a global wind farm portfolioPotential of digitalization in the wind industryGlobal data backbone
3 More sensors = more data = higher performance ?From data to actions
4 IoT and retrofitting –some real use casesIce detectionFoundation monitoring
Did I cover everything – let’s recap

Harmonized global concept – Based on a hybrid infrastructure
Internet of Wind 4.0, RWE Renewables, Gregor Biering
This document contains forward-looking statements. These statements are based on the current views, expectations, assumptions and information of the management, and are based on information currently available to the management. Forward-looking statements shall not be construed as a promise for the materialisation of future results and developments and involve known and unknown risks and uncertainties. Actual results, performance or events may differ materially from those described in such statements due to, among other things, changes in the general economic and competitive environment, risks associated with capital markets, currency exchange rate fluctuations, changes in international and national laws and regulations, in particular with respect to tax laws and regulations, affecting the Company, and other factors. Neither the Company nor any of its affiliates assumes any obligations to update any forward-looking statements.
All figures regarding the renewables business are based on pro forma combined innogy and E.ON publicly available data.
Disclaimer

Thank you