interplay between minor and major groove-binding transcription
TRANSCRIPT

Interplay between Minor and Major Groove-bindingTranscription Factors Sox2 and Oct1 in Translocation on DNAStudied by Paramagnetic and Diamagnetic NMR*
Received for publication, February 13, 2012, and in revised form, March 5, 2012 Published, JBC Papers in Press, March 6, 2012, DOI 10.1074/jbc.M112.352864
Yuki Takayama1 and G. Marius Clore2
From the Laboratory of Chemical Physics, NIDDK, National Institutes of Health, Bethesda, Maryland 20892-0520
Background: Transcription factors must locate their specific sites within the genome.Results: Using NMR, we demonstrate the existence of sparsely populated, transient states that facilitate target location inSox2�DNA and Oct1�Sox2�DNA complexes.Conclusion: Rapid target searching by sparsely populated states of Sox2 and Oct1 involves two pathways: one-dimensionalsliding and transfer between DNA.Significance: Protein interactions in multiprotein�DNA complexes modulate translocation pathways.
The pathways whereby Sox2 scans DNA to locate its specificbinding site are investigated byNMR in specific and nonspecificSox2�DNA complexes and in a specific ternary complex withOct1 on the Hoxb1 regulatory element. Direct transfer of Sox2between nonspecific sites on different DNA molecules occurswithout dissociation into free solution at a rate of�106 M�1 s�1,whereas one-dimensional sliding proceeds with a diffusion con-stant of >0.1 �m2�s�1. Translocation of Sox2 from one specificDNA site to another occurs via jumping, involving complete dis-sociation into free solution (kd �5–6 s�1) followed by reassocia-tion (ka �5 � 108 M�1 s�1). In the presence of Oct1 bound to anadjacent specific site, kd is reduced by more than 10-fold. Para-magnetic relaxation measurements, however, demonstrate thatsparsely populated (<1%), transient states involving nonspecifi-cally bound Sox2 in rapid exchange with specifically boundSox2 are sampled in both binary Sox2�DNA- and ternaryOct1�Sox2�Hoxb1-DNA-specific complexes. Moreover, Sox2modulates the mechanism of translocation of Oct1. Both Sox2and the Oct1 POUHD domain are transiently released from thespecific ternary complex by sliding to an adjacent nonspecificsite, followed by direct transfer to another DNA molecule,whereas the Oct1 POUS domain is fixed to its specific sitethrough direct interactions with Sox2. Intermolecular translo-cation of POUHD results in the formation of a bridged interme-diate spanning two DNA molecules, enhancing the probabilityof complete intermolecular translocation of Oct1. By way ofcontrast, in the specific Oct1�DNA binary complex, POUSundergoes direct intermolecular translocation, whereas POUHD
scans the DNA by sliding.
To control gene regulation, transcription factors must beable to efficiently locate their specific target site(s) within anoverwhelming sea of nonspecific sites. Kinetic and theoreticalstudies have suggested that three mechanisms are involved inthis search process: jumping, sliding, and intersegment transfer(1–6). Jumping involves the complete dissociation of the tran-scription factor from the DNA, followed by reassociation at adistal DNA site, either on the same DNA molecule or anotherDNAmolecule. The transcription factor can also diffuse in onedimension along the DNA, tracking the grooves of the DNAwhile maintaining its orientation relative to the DNA (7), aprocess that has been termed rotation-coupled sliding (8).Finally, a transcription factor can undergo direct transfer fromone DNA site to either a distal site on the same DNAmoleculeor to another DNAmolecule without ever dissociating into freesolution. This involves a flycastmechanism (9) whereby a tail ordomain is used to search for other DNA sites, resulting in thetransient formation of a bridged complex, followed by the firstorder transfer of the remainder of the transcription factor to thenew site (4, 10, 11).We have previously made use of NMR paramagnetic relax-
ation enhancement (PRE)3 and z-exchange spectroscopy todirectly demonstrate the occurrence of sliding, jumping, andintersegment transfer for the homeodomain transcription fac-tor HoxD9 (12, 13) and the bidomain transcription factor Oct1(10, 14). In the context of PRE studies on specific complexes,these processes manifest themselves as sparsely populated(�1%), spectroscopically invisible states whose footprints areobserved on the PRE profiles of the predominant (�99%) spe-cies, namely the specific complex (12). Further, residual dipolarcoupling data on nonspecific complexes demonstrated that theorientations of HoxD9 and Oct1 relative to the long axis of theDNA are maintained during the sliding process (7, 10); thus,these transcription factors track the grooves on the DNA byrotation-coupled sliding. HoxD9 and Oct1 are both majorgroove DNA-binding proteins, but little is known of the behav-
* This work was supported, in whole or in part, by the National Institutes ofHealth, NIDDK, Intramural Program and by the AIDS Targeted AntiviralProgram of the Office of the Director of the National Institutes of Health (toG. M. C.).
1 Supported by a Japan Society for the Promotion of Science Research Fellow-ship for Japanese Biomedical and Behavioral Researchers at the NationalInstitutes of Health.
2 To whom correspondence should be addressed: Laboratory of ChemicalPhysics, Bldg. 5, NIDDK, National Institutes of Health, Bethesda, MD 20892-0520. Tel.: 301-496-0788; Fax: 301-496-0825; E-mail: [email protected].
3 The abbreviations used are: PRE, paramagnetic relaxation enhancement;TROSY, transverse relaxation optimized z-exchange spectroscopy; HSQC,heteronuclear single quantum correlation.
THE JOURNAL OF BIOLOGICAL CHEMISTRY VOL. 287, NO. 18, pp. 14349 –14363, April 27, 2012Published in the U.S.A.
APRIL 27, 2012 • VOLUME 287 • NUMBER 18 JOURNAL OF BIOLOGICAL CHEMISTRY 14349
at National Institutes of H
ealth Library, on April 27, 2012
ww
w.jbc.org
Dow
nloaded from
ior ofminor groove binding proteins. In addition,many eukary-otic transcription factors form multiprotein complexes on theDNA, thereby enabling combinatorial control of transcription.An example of a multiprotein transcription factor assembly
is the ternary complex formed by Oct1 and Sox2 on theHoxb1regulatory element (15). Oct1 plays a critical role in neuraldevelopment, cell growth, and differentiation (15–17) andcomprises twomajor groove binding helix-turn-helix domains,POUS andPOUHD, connected by a flexible (�23-residue) linker(18, 19). Sox2 is a member of the HMG-box family of architec-tural factors that bind in the minor groove and bend the DNAby 50–90° (20–22). The solution structure of the ternaryOct1�Sox2�Hoxb1-DNA complex has been solved byNMR (23).Recent z-exchange NMR experiments have shown that the rateof direct transfer of Oct1 between specific sites located on dif-ferentDNAmolecules is reduced by over an order ofmagnitudein the presence of Sox2 bound to a specific site immediatelyadjacent to the Oct1-specific site (14). Here we make use ofPRE, z-exchange, and line width NMRmeasurements to charac-terize transcription factor translocation in the Sox2�Hoxb1-DNAbinary and the Oct1�Sox2�Hoxb1-DNA ternary complexes. Thedata illustrate how interactions between transcription factorsmodulate the mechanism of translocation.
EXPERIMENTAL PROCEDURES
Sample Preparation—The POU region (POUS � POUHD) ofhuman Oct1 (residues 280–442) and the HMG-box domain ofSox2 (residues 38–121) were expressed and purified asdescribed previously (23). Uniform 2H/15N isotopic labelingwas achieved by growing E. coli BL21-CodonPlus(DE3)-RIPLcells in minimal medium dissolved in 99.9% D2O using d7-glu-cose and 15NH4Cl as the sole carbon and nitrogen sources,respectively. Single-stranded unmodified and EDTA- or rhod-amine-conjugated DNA oligonucleotides were purchased fromInvitrogen and Midland Certified Reagents, respectively, andpurified by ion exchange chromatography on a Mono-Q (GEHealthcare) column with a NaCl gradient in a buffer of 50 mM
Tris-HCl, pH 7.5, and 1 mM EDTA. After strand annealing,DNA duplexes were further purified by ion exchange chroma-tography to remove any residual single-stranded DNA (24).NMR samples were prepared in 10 mM PIPES, 94% H2O, 6%D2O, pH6.5. Throughout thiswork, the concentrations ofNaClused for the various samples refer to the concentration of addedNaCl and do not take into account the presence of counterionsbound to the phosphate backbone. For example, 0 mM NaClmeans that there is no added NaCl but does not imply that thesample is completely devoid of NaCl; thus, for a 29-bp DNAduplex at a concentration of 0.5 mM with no added NaCl, theconcentration of sodium counterions can be estimated to be�30 mM.NMR Spectroscopy—All NMR experiments were carried out
at 303 K on Bruker 500- and 600-MHz spectrometers equippedwith z-gradient triple resonance cryoprobes. Spectra were pro-cessed using NMRPipe (25), and analyzed using the programsXIPP4 and NMRView (26).
Intermolecular exchange rates for the translocation of Sox2between two DNA duplexes bearing slightly different specifictarget sites were determined using transverse relaxation opti-mized z-exchange spectroscopy (TROSY) (27) with at leasteight different mixing times ranging from 20 to 600 ms. Fittingof the time dependence of the 1HN/15N auto and exchangecross-peaks to obtain rate constants was as described (13).Intermolecular exchange rates for the translocation of Sox2
between two nonspecific DNA duplexes of differing sequencewere derived from Lorentzian line shape fitting in either the 1Hor 15N dimensions of 1H-15N heteronuclear single quantumcorrelation (HSQC) spectra as described previously (7). Thedata for residues exhibiting 1HN or 15N chemical shift differ-ences greater than 30Hz at a 1H frequency of 500MHz (namelyLys26, His34, and Lys40) were used for analysis.PRE transverse 1HN-�2 rates were measured on Oct1�
Sox2�Hoxb1-DNA ternary complexes comprising either 0.4mM2H/15N-labeled Oct1, 0.44 mM unlabeled Sox2 (i.e. at naturalisotopic abundance), and 0.44 mM DNA-EDTA or 0.44 mM
unlabeled Oct1, 0.4 mM 2H/15N-labeled Sox2, and 0.44 mM
DNA-EDTA.TheDNAduplexes are 29 base pairs in length andcomprise the specific Oct1- and Sox2-binding sites from theHoxb1 promoter (23). The DNA-dT-EDTA was chelated toeither Mn2� (paramagnetic) or Ca2� (diamagnetic), and the1HN-�2 rates were obtained by taking the difference betweenthe 1HN-R2 transverse relaxation rates between the paramag-netic and diamagnetic samples. 1HN-R2 values were obtainedusing a two-time point measurement with a �T difference of11.6 ms as described previously (28) with a TROSY-based1H-15N correlation pulse scheme (10, 29). For the Sox2�DNAbinary complex, the sample conditionswere exactly the same asthose employed for the ternary Oct1�Sox2�DNA complexexcept for the absence of Oct1 and a longer�T value of 18.4msfor the two-time point measurement.To analyze the relative contributions from intra- and inter-
molecular translocation,mixed samples weremade comprisingOct1, Sox2, and an equal mixture of two DNA duplexes, onecontaining the specific binding sites for Oct1 and Sox2 and thesecond representing a nonspecific DNAduplex for the 2H/15N-labeled protein being monitored. When the nonspecific DNAduplex is tagged with a paramagnetic label, the only PRE effectsobserved are those arising from intermolecular translocation,but when the paramagnetic label is attached to theDNAduplexcomprising the two specific sites, both intra- and intermolecu-lar translocation can give rise to PREs. To look at inter- andintramolecular translocation of Oct1 in the presence of Sox2,the samples comprised either 0.4 mM 2H/15N-labeled Oct1,0.45 mM unlabeled Sox2, 0.45 mM specific DNA (containingboth the Oct1- and Sox2-specific sites), and 0.45 mM nonspe-cific DNA or 0.4 mM 2H/15N-labeled Oct1, 0.9 mM unlabeledSox2, 0.45mM specific DNA, and 0.45mMnonspecific DNA forOct1 but containing the specific Sox2 site. To look at inter- andintramolecular translocation of Sox2 in the presence of Oct1,the samples comprised either 0.4mM 2H/15N-labeled Sox2, 0.45mM unlabeled Oct1, 0.45 mM specific DNA (containing boththe Sox2- and Oct1-specific sites), and 0.45 mM nonspecificDNA or 0.4 mM 2H/15N-labeled Sox2, 0.9 mM unlabeled Oct1,4 D. S. Garrett and G. Marius Clore, unpublished data.
Translocation of Sox2 and Oct1 on DNA
14350 JOURNAL OF BIOLOGICAL CHEMISTRY VOLUME 287 • NUMBER 18 • APRIL 27, 2012
at National Institutes of H
ealth Library, on April 27, 2012
ww
w.jbc.org
Dow
nloaded from
0.45 mM specific DNA, and 0.45 mM nonspecific DNA for Sox2but containing the specific Oct1 site.PRE 1HN-�2 rates were back-calculated from the structures
of the specific Oct1�Sox2�Hoxb1-DNA ternary and Sox2�Hoxb1-DNA binary complexes (23) using a three-conformerensemble representation for the EDTA-Mn2� groups toaccount for their flexibility (30). The coordinates of the EDTA-Mn2� moieties were optimized by simulated annealing inXplor-NIH (31), and agreement between observed and calcu-lated values is expressed as a PRE Q-factor given by the equa-tion, Q � (�(�2
obs(i) �2calc(i))2/��2
obs(i))1⁄2, where the super-scripts “obs” and “calc” represent observed and calculatedvalues, respectively, and i denotes the residue number (30).Fluorescence Anisotropy—The apparent equilibrium dissoci-
ation constant KD for the binding of Sox2 to nonspecific DNAat 25 °C was determined by fluorescence anisotropy using aJobin-Yvon FluoroMax-3 spectrometer as described previously(7). The wavelengths for excitation and emission were 550 and580 nm, respectively. Sox2 was titrated (0–26.2 �M final con-centration) into a rhodamine-conjugated nonspecific 29-bpDNA duplex (1.5 �M) dissolved in 10 mM sodium phosphatebuffer, 150 mM NaCl, and 1 mM EDTA at pH 7.4. The KD wascalculated from the titration data as described previously (32).
RESULTS AND DISCUSSION
We first present data on the binding of Sox2 to nonspecificDNAusing fluorescence anisotropymeasurements and charac-terize intra- and intermolecular translocation of Sox2 on non-specific DNA by PRE and line width measurements. We thenpresent z-exchange data for the intermolecular translocation ofSox2 between specific sites and examine the impact of Oct1on this exchange process in the context of a specificOct1�Sox2�Hoxb1-DNA ternary complex. Finally, using PREmeasurements, we examine intra- and intermolecular translo-cation involving transient sparsely populated states, first ofSox2 in the context of a specific Sox2�Hoxb1-DNA binary com-plex and then of both Oct1 and Sox2 in the context of a specificOct1�Sox2�Hoxb1-DNA ternary complex.Interaction between Sox2 and 29-bpNonspecificDNADuplex—
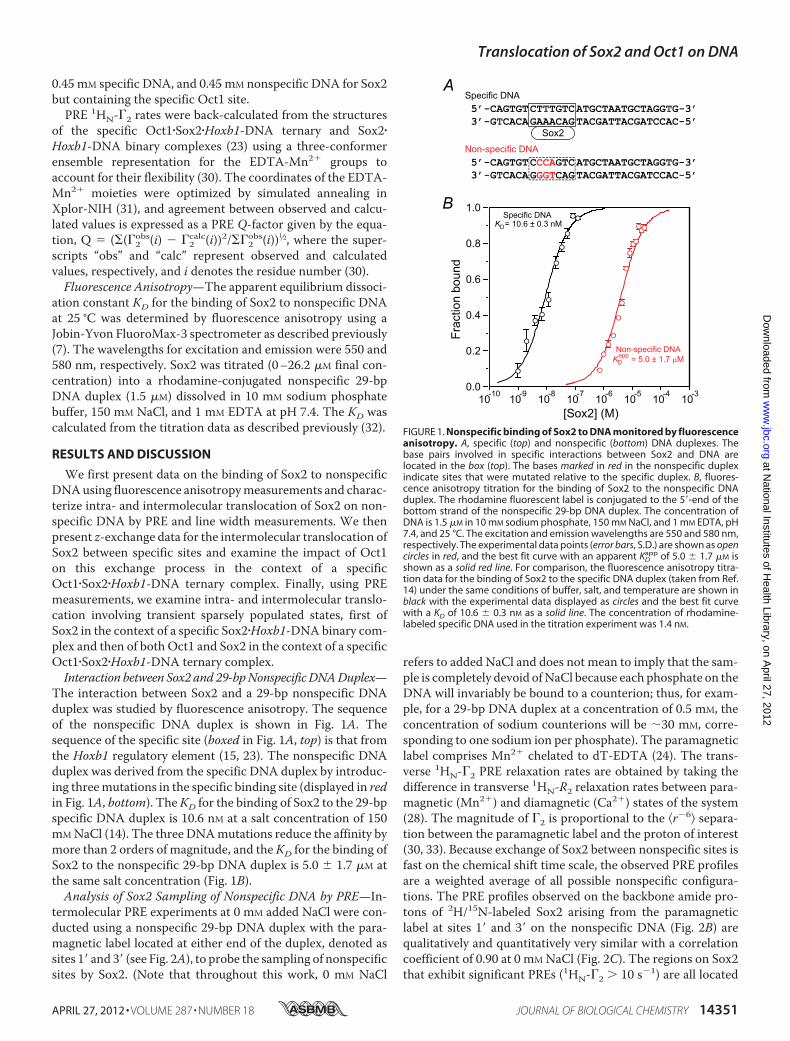
The interaction between Sox2 and a 29-bp nonspecific DNAduplex was studied by fluorescence anisotropy. The sequenceof the nonspecific DNA duplex is shown in Fig. 1A. Thesequence of the specific site (boxed in Fig. 1A, top) is that fromthe Hoxb1 regulatory element (15, 23). The nonspecific DNAduplex was derived from the specific DNA duplex by introduc-ing threemutations in the specific binding site (displayed in redin Fig. 1A, bottom). TheKD for the binding of Sox2 to the 29-bpspecific DNA duplex is 10.6 nM at a salt concentration of 150mMNaCl (14). The three DNAmutations reduce the affinity bymore than 2 orders of magnitude, and the KD for the binding ofSox2 to the nonspecific 29-bp DNA duplex is 5.0 1.7 �M atthe same salt concentration (Fig. 1B).Analysis of Sox2 Sampling of Nonspecific DNA by PRE—In-
termolecular PRE experiments at 0 mM added NaCl were con-ducted using a nonspecific 29-bp DNA duplex with the para-magnetic label located at either end of the duplex, denoted assites 1� and 3� (see Fig. 2A), to probe the sampling of nonspecificsites by Sox2. (Note that throughout this work, 0 mM NaCl
refers to added NaCl and does not mean to imply that the sam-ple is completely devoid ofNaCl because each phosphate on theDNA will invariably be bound to a counterion; thus, for exam-ple, for a 29-bp DNA duplex at a concentration of 0.5 mM, theconcentration of sodium counterions will be �30 mM, corre-sponding to one sodium ion per phosphate). The paramagneticlabel comprises Mn2� chelated to dT-EDTA (24). The trans-verse 1HN-�2 PRE relaxation rates are obtained by taking thedifference in transverse 1HN-R2 relaxation rates between para-magnetic (Mn2�) and diamagnetic (Ca2�) states of the system(28). The magnitude of �2 is proportional to the �r6 separa-tion between the paramagnetic label and the proton of interest(30, 33). Because exchange of Sox2 between nonspecific sites isfast on the chemical shift time scale, the observed PRE profilesare a weighted average of all possible nonspecific configura-tions. The PRE profiles observed on the backbone amide pro-tons of 2H/15N-labeled Sox2 arising from the paramagneticlabel at sites 1� and 3� on the nonspecific DNA (Fig. 2B) arequalitatively and quantitatively very similar with a correlationcoefficient of 0.90 at 0 mM NaCl (Fig. 2C). The regions on Sox2that exhibit significant PREs (1HN-�2 � 10 s1) are all located
FIGURE 1. Nonspecific binding of Sox2 to DNA monitored by fluorescenceanisotropy. A, specific (top) and nonspecific (bottom) DNA duplexes. Thebase pairs involved in specific interactions between Sox2 and DNA arelocated in the box (top). The bases marked in red in the nonspecific duplexindicate sites that were mutated relative to the specific duplex. B, fluores-cence anisotropy titration for the binding of Sox2 to the nonspecific DNAduplex. The rhodamine fluorescent label is conjugated to the 5�-end of thebottom strand of the nonspecific 29-bp DNA duplex. The concentration ofDNA is 1.5 �M in 10 mM sodium phosphate, 150 mM NaCl, and 1 mM EDTA, pH7.4, and 25 °C. The excitation and emission wavelengths are 550 and 580 nm,respectively. The experimental data points (error bars, S.D.) are shown as opencircles in red, and the best fit curve with an apparent KD
app of 5.0 1.7 �M isshown as a solid red line. For comparison, the fluorescence anisotropy titra-tion data for the binding of Sox2 to the specific DNA duplex (taken from Ref.14) under the same conditions of buffer, salt, and temperature are shown inblack with the experimental data displayed as circles and the best fit curvewith a KD of 10.6 0.3 nM as a solid line. The concentration of rhodamine-labeled specific DNA used in the titration experiment was 1.4 nM.
Translocation of Sox2 and Oct1 on DNA
APRIL 27, 2012 • VOLUME 287 • NUMBER 18 JOURNAL OF BIOLOGICAL CHEMISTRY 14351
at National Institutes of H
ealth Library, on April 27, 2012
ww
w.jbc.org
Dow
nloaded from
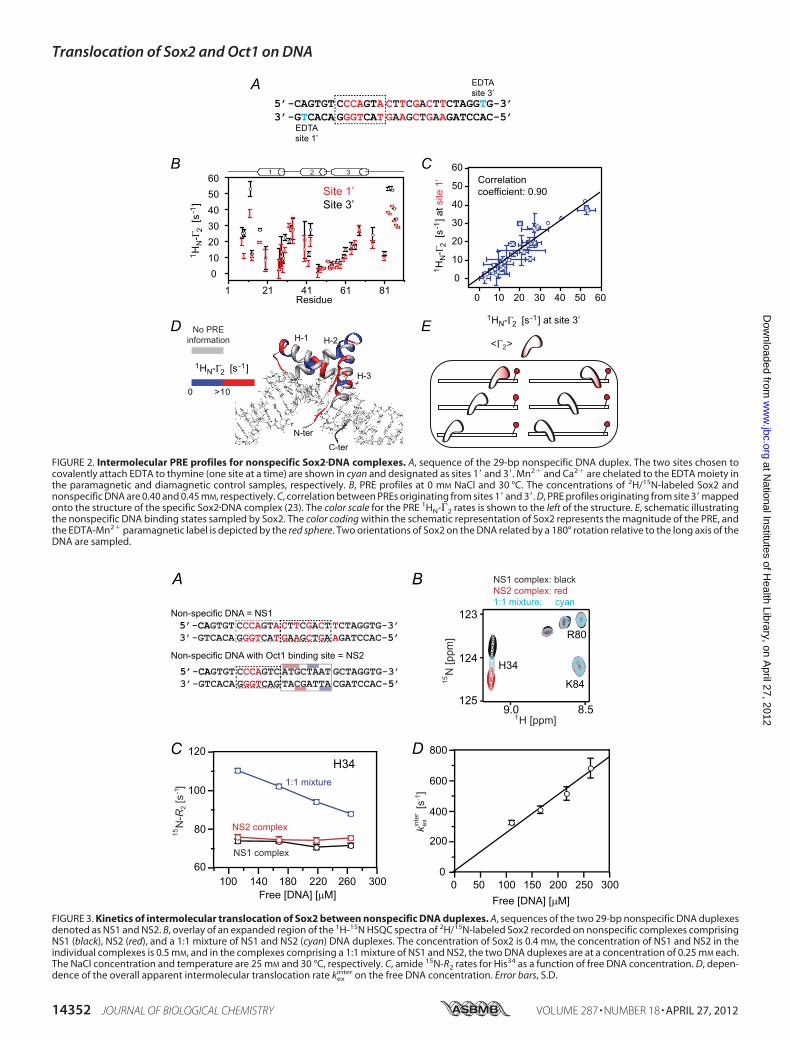
FIGURE 2. Intermolecular PRE profiles for nonspecific Sox2�DNA complexes. A, sequence of the 29-bp nonspecific DNA duplex. The two sites chosen tocovalently attach EDTA to thymine (one site at a time) are shown in cyan and designated as sites 1� and 3�. Mn2� and Ca2� are chelated to the EDTA moiety inthe paramagnetic and diamagnetic control samples, respectively. B, PRE profiles at 0 mM NaCl and 30 °C. The concentrations of 2H/15N-labeled Sox2 andnonspecific DNA are 0.40 and 0.45 mM, respectively. C, correlation between PREs originating from sites 1� and 3�. D, PRE profiles originating from site 3� mappedonto the structure of the specific Sox2�DNA complex (23). The color scale for the PRE 1HN-�2 rates is shown to the left of the structure. E, schematic illustratingthe nonspecific DNA binding states sampled by Sox2. The color coding within the schematic representation of Sox2 represents the magnitude of the PRE, andthe EDTA-Mn2� paramagnetic label is depicted by the red sphere. Two orientations of Sox2 on the DNA related by a 180° rotation relative to the long axis of theDNA are sampled.
FIGURE 3. Kinetics of intermolecular translocation of Sox2 between nonspecific DNA duplexes. A, sequences of the two 29-bp nonspecific DNA duplexesdenoted as NS1 and NS2. B, overlay of an expanded region of the 1H-15N HSQC spectra of 2H/15N-labeled Sox2 recorded on nonspecific complexes comprisingNS1 (black), NS2 (red), and a 1:1 mixture of NS1 and NS2 (cyan) DNA duplexes. The concentration of Sox2 is 0.4 mM, the concentration of NS1 and NS2 in theindividual complexes is 0.5 mM, and in the complexes comprising a 1:1 mixture of NS1 and NS2, the two DNA duplexes are at a concentration of 0.25 mM each.The NaCl concentration and temperature are 25 mM and 30 °C, respectively. C, amide 15N-R2 rates for His34 as a function of free DNA concentration. D, depen-dence of the overall apparent intermolecular translocation rate kex
inter on the free DNA concentration. Error bars, S.D.
Translocation of Sox2 and Oct1 on DNA
14352 JOURNAL OF BIOLOGICAL CHEMISTRY VOLUME 287 • NUMBER 18 • APRIL 27, 2012
at National Institutes of H
ealth Library, on April 27, 2012
ww
w.jbc.org
Dow
nloaded from
in structural elements that are in close proximity to the DNA(Fig. 2D). One can therefore conclude that Sox2 samplesnumerous binding sites in two orientations, related by a 180°rotation relative to the long axis of the DNA (Fig. 2E). ThesePRE results are very similar to those previously observed for thesampling of nonspecificDNA-binding sites by anothermemberof the HMG-box family, namely the nonspecific architecturalfactor HMG-B1 (32).Rates of Inter- and Intramolecular Translocation of Sox2 on
Nonspecific DNA—To analyze the rates of intermoleculartranslocation of Sox2 between nonspecific DNA duplexes, wecarried out Lorentzian line shape analysis of cross-peaks in the1H-15N HSQC spectra of three samples: two complexes withdifferent nonspecific DNA duplexes (NS1 and NS2) and a sam-ple comprising a 1:1 mixture of the two nonspecific DNAduplexes (Fig. 3A). An expanded region of the 1H-15N HSQCspectra for the three samples is shown in Fig. 3B. Residues
exhibiting 1HN or 15N chemical shift differences of �30 Hz at a1H frequency of 500 MHz between the two nonspecific com-plexes, namely Lys26, His34, and Lys40, were used for line shapeanalysis. The cross-peaks in the sample comprising an equimo-lar mixture of the two nonspecific complexes appear halfwaybetween the corresponding cross-peaks for the two samplescontaining only one nonspecific DNA duplex and are broad-ened due to the exchange contribution from intermolecular
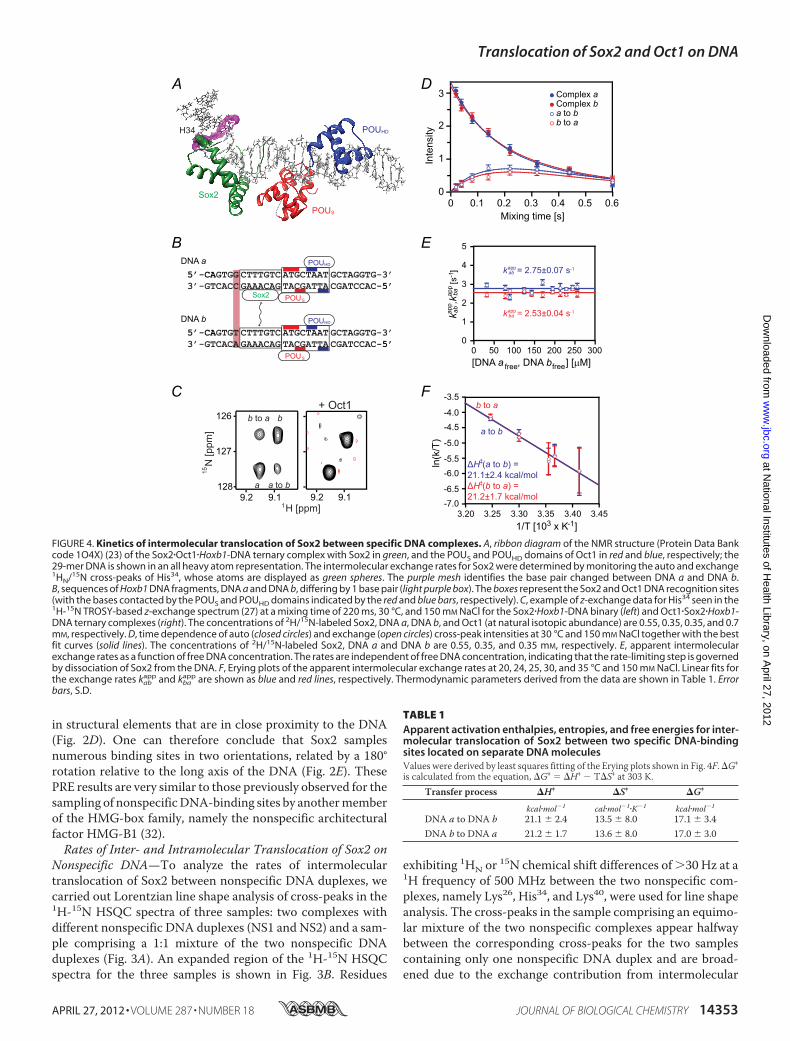
FIGURE 4. Kinetics of intermolecular translocation of Sox2 between specific DNA complexes. A, ribbon diagram of the NMR structure (Protein Data Bankcode 1O4X) (23) of the Sox2�Oct1�Hoxb1-DNA ternary complex with Sox2 in green, and the POUS and POUHD domains of Oct1 in red and blue, respectively; the29-mer DNA is shown in an all heavy atom representation. The intermolecular exchange rates for Sox2 were determined by monitoring the auto and exchange1HN/15N cross-peaks of His34, whose atoms are displayed as green spheres. The purple mesh identifies the base pair changed between DNA a and DNA b.B, sequences of Hoxb1 DNA fragments, DNA a and DNA b, differing by 1 base pair (light purple box). The boxes represent the Sox2 and Oct1 DNA recognition sites(with the bases contacted by the POUS and POUHD domains indicated by the red and blue bars, respectively). C, example of z-exchange data for His34 seen in the1H-15N TROSY-based z-exchange spectrum (27) at a mixing time of 220 ms, 30 °C, and 150 mM NaCl for the Sox2�Hoxb1-DNA binary (left) and Oct1�Sox2�Hoxb1-DNA ternary complexes (right). The concentrations of 2H/15N-labeled Sox2, DNA a, DNA b, and Oct1 (at natural isotopic abundance) are 0.55, 0.35, 0.35, and 0.7mM, respectively. D, time dependence of auto (closed circles) and exchange (open circles) cross-peak intensities at 30 °C and 150 mM NaCl together with the bestfit curves (solid lines). The concentrations of 2H/15N-labeled Sox2, DNA a and DNA b are 0.55, 0.35, and 0.35 mM, respectively. E, apparent intermolecularexchange rates as a function of free DNA concentration. The rates are independent of free DNA concentration, indicating that the rate-limiting step is governedby dissociation of Sox2 from the DNA. F, Erying plots of the apparent intermolecular exchange rates at 20, 24, 25, 30, and 35 °C and 150 mM NaCl. Linear fits forthe exchange rates kab
app and kbaapp are shown as blue and red lines, respectively. Thermodynamic parameters derived from the data are shown in Table 1. Error
bars, S.D.
TABLE 1Apparent activation enthalpies, entropies, and free energies for inter-molecular translocation of Sox2 between two specific DNA-bindingsites located on separate DNA moleculesValues were derived by least squares fitting of the Erying plots shown in Fig. 4F.�G‡
is calculated from the equation, �G‡ � �H‡ T�S‡ at 303 K.Transfer process �H‡ �S‡ �G‡
kcal�mol1 cal�mol1�K1 kcal�mol1
DNA a to DNA b 21.1 2.4 13.5 8.0 17.1 3.4DNA b to DNA a 21.2 1.7 13.6 8.0 17.0 3.0
Translocation of Sox2 and Oct1 on DNA
APRIL 27, 2012 • VOLUME 287 • NUMBER 18 JOURNAL OF BIOLOGICAL CHEMISTRY 14353
at National Institutes of H
ealth Library, on April 27, 2012
ww
w.jbc.org
Dow
nloaded from
translocation between the two DNA duplexes. The apparentintermolecular translocation rate can be readily obtained fromLorentzian line shape analysis of the cross-peaks in the threesamples as described by Iwahara et al. (7). The observed trans-verse relaxation rate (R2mix) for a given resonance in themixtureis equal to the population-weighted average of the correspond-ing R2 rates for the individual nonspecific complexes plus anexchange contribution Rexinter (Fig. 3C). The apparent intermo-lecular translocation rate, kexinter (which is equal to the sumof thetwo apparent first-order rate constants for the transfer of Sox2from NS1 to NS2 and from NS2 to NS1), is given by the equa-tion, kexinter � 4�2pNS1pNS2���2/Rexinter, where pNS1 and pNS2 arethe populations of the two nonspecific complexes (in thisinstance 0.5 each), and � is the chemical shift differencebetween the two nonspecific complexes (measured in Hertz).
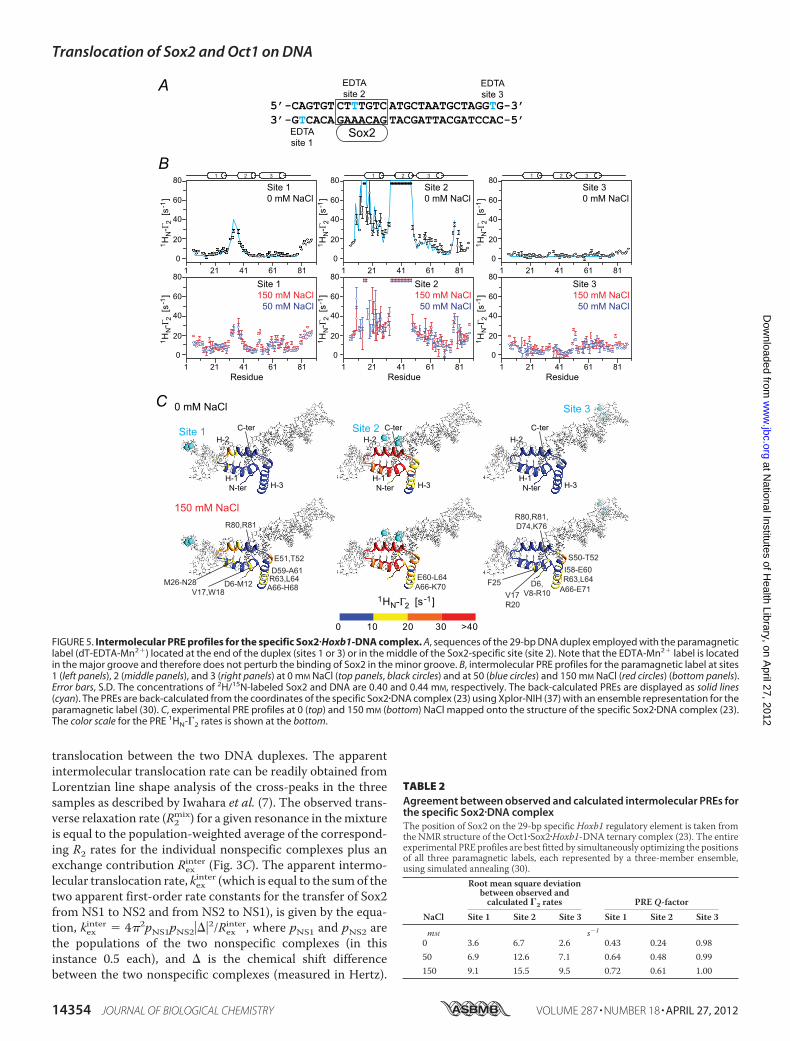
FIGURE 5. Intermolecular PRE profiles for the specific Sox2�Hoxb1-DNA complex. A, sequences of the 29-bp DNA duplex employed with the paramagneticlabel (dT-EDTA-Mn2�) located at the end of the duplex (sites 1 or 3) or in the middle of the Sox2-specific site (site 2). Note that the EDTA-Mn2� label is locatedin the major groove and therefore does not perturb the binding of Sox2 in the minor groove. B, intermolecular PRE profiles for the paramagnetic label at sites1 (left panels), 2 (middle panels), and 3 (right panels) at 0 mM NaCl (top panels, black circles) and at 50 (blue circles) and 150 mM NaCl (red circles) (bottom panels).Error bars, S.D. The concentrations of 2H/15N-labeled Sox2 and DNA are 0.40 and 0.44 mM, respectively. The back-calculated PREs are displayed as solid lines(cyan). The PREs are back-calculated from the coordinates of the specific Sox2�DNA complex (23) using Xplor-NIH (37) with an ensemble representation for theparamagnetic label (30). C, experimental PRE profiles at 0 (top) and 150 mM (bottom) NaCl mapped onto the structure of the specific Sox2�DNA complex (23).The color scale for the PRE 1HN-�2 rates is shown at the bottom.
TABLE 2Agreement between observed and calculated intermolecular PREs forthe specific Sox2�DNA complexThe position of Sox2 on the 29-bp specific Hoxb1 regulatory element is taken fromthe NMR structure of the Oct1�Sox2�Hoxb1-DNA ternary complex (23). The entireexperimental PRE profiles are best fitted by simultaneously optimizing the positionsof all three paramagnetic labels, each represented by a three-member ensemble,using simulated annealing (30).
NaCl
Root mean square deviationbetween observed andcalculated �2 rates PRE Q-factor
Site 1 Site 2 Site 3 Site 1 Site 2 Site 3
mM s1
0 3.6 6.7 2.6 0.43 0.24 0.9850 6.9 12.6 7.1 0.64 0.48 0.99150 9.1 15.5 9.5 0.72 0.61 1.00
Translocation of Sox2 and Oct1 on DNA
14354 JOURNAL OF BIOLOGICAL CHEMISTRY VOLUME 287 • NUMBER 18 • APRIL 27, 2012
at National Institutes of H
ealth Library, on April 27, 2012
ww
w.jbc.org
Dow
nloaded from
kexinter is linearly proportional to the free DNA concentration(Fig. 3D), indicative of a direct transfer mechanism from oneDNA duplex to the other without involving the dissociation ofSox2 into free solution (13). The second order rate constant fordirect transfer from oneDNAduplex to the other is 1.3 0.2�106 M1 s1. Note that a mechanism involving dissociation ofSox2 into free solution, followed by reassociation, would beindependent of the free DNA concentration, and the measuredexchange rate would be equal to the first order dissociation rateconstant (7, 13).The R2 rates for the individual complexes include an
exchange contribution from intramolecular translocation or
sliding (7). Because the latter R2 rates are independent of freeDNA concentration and because one can assume that the aver-age chemical shift difference between the nonspecific sites on asingle DNA duplex will be approximately equal to the averagechemical difference between the complexes with the NS1 andNS2 DNA duplexes, one can conclude that the rate of intramo-lecular translocation ismuch faster than that for intermoleculartranslocation (7). A lower limit for this rate can be derived fromthe extrapolated value of kexinter obtained from the free DNAconcentration atwhich the value ofR2mix falls to theR2 values forthe individual nonspecific complexes (6). From Fig. 3C, thisoccurs when the free DNA concentration reaches �360 �M,
Specific DNA
Sample 2: Inter- and intramolecular PREsSample 1: Intermolecular PRE only
EDTA+
5’-CAGTGT CTTTGTC ATGCTAATGCTAGGTG-3’3’-GTCACA GAAACAG TACGATTACGATCCAC-5’
A
Sox2
5’-CAGTGT CCCAGTC ATGCTAATGCTAGGTG-3’3’-GTCACA GGGTCAG TACGATTACGATCCAC-5’
EDTA
+
5’-CAGTGT CTTTGTC ATGCTAATGCTAGGTG-3’3’-GTCACA GAAACAG TACGATTACGATCCAC-5’
Sox2
Non-specific DNA5’-CAGTGT CCCAGTC ATGCTAATGCTAGGTG-3’3’-GTCACA GGGTCAG TACGATTACGATCCAC-5’
0
10
20
30
40
1 21 41 61 81
0.81.01.21.4
1 21 41 61 81Γ (
Sam
ple
2)2 Γ (
Sam
ple
1)2
H -Γ
[s
]1
N2
-1
1 32
Residue
B
C
D
N-ter C-ter(R81~)
H-1
H-2
H-3
Sample 2Sample 1
S50-T52
Non-specific DNA with EDTA-Mn 2+
Specific DNA with EDTA/Mn2+
H72/D74/K76
2Γ ratio<1.1 1.2
50-52 72-76 81-87
ESliding
Sliding
Intersegmentaltransfer
Site 3
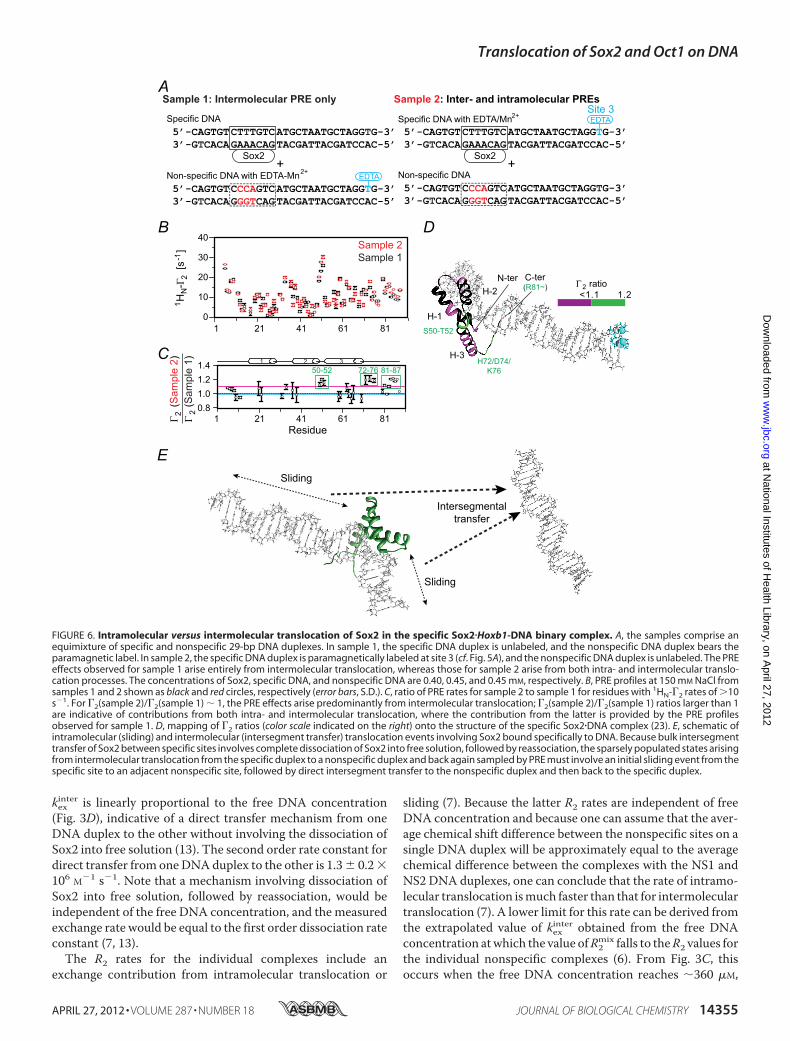
FIGURE 6. Intramolecular versus intermolecular translocation of Sox2 in the specific Sox2�Hoxb1-DNA binary complex. A, the samples comprise anequimixture of specific and nonspecific 29-bp DNA duplexes. In sample 1, the specific DNA duplex is unlabeled, and the nonspecific DNA duplex bears theparamagnetic label. In sample 2, the specific DNA duplex is paramagnetically labeled at site 3 (cf. Fig. 5A), and the nonspecific DNA duplex is unlabeled. The PREeffects observed for sample 1 arise entirely from intermolecular translocation, whereas those for sample 2 arise from both intra- and intermolecular translo-cation processes. The concentrations of Sox2, specific DNA, and nonspecific DNA are 0.40, 0.45, and 0.45 mM, respectively. B, PRE profiles at 150 mM NaCl fromsamples 1 and 2 shown as black and red circles, respectively (error bars, S.D.). C, ratio of PRE rates for sample 2 to sample 1 for residues with 1HN-�2 rates of �10s1. For �2(sample 2)/�2(sample 1) � 1, the PRE effects arise predominantly from intermolecular translocation; �2(sample 2)/�2(sample 1) ratios larger than 1are indicative of contributions from both intra- and intermolecular translocation, where the contribution from the latter is provided by the PRE profilesobserved for sample 1. D, mapping of �2 ratios (color scale indicated on the right) onto the structure of the specific Sox2�DNA complex (23). E, schematic ofintramolecular (sliding) and intermolecular (intersegment transfer) translocation events involving Sox2 bound specifically to DNA. Because bulk intersegmenttransfer of Sox2 between specific sites involves complete dissociation of Sox2 into free solution, followed by reassociation, the sparsely populated states arisingfrom intermolecular translocation from the specific duplex to a nonspecific duplex and back again sampled by PRE must involve an initial sliding event from thespecific site to an adjacent nonspecific site, followed by direct intersegment transfer to the nonspecific duplex and then back to the specific duplex.
Translocation of Sox2 and Oct1 on DNA
APRIL 27, 2012 • VOLUME 287 • NUMBER 18 JOURNAL OF BIOLOGICAL CHEMISTRY 14355
at National Institutes of H
ealth Library, on April 27, 2012
ww
w.jbc.org
Dow
nloaded from
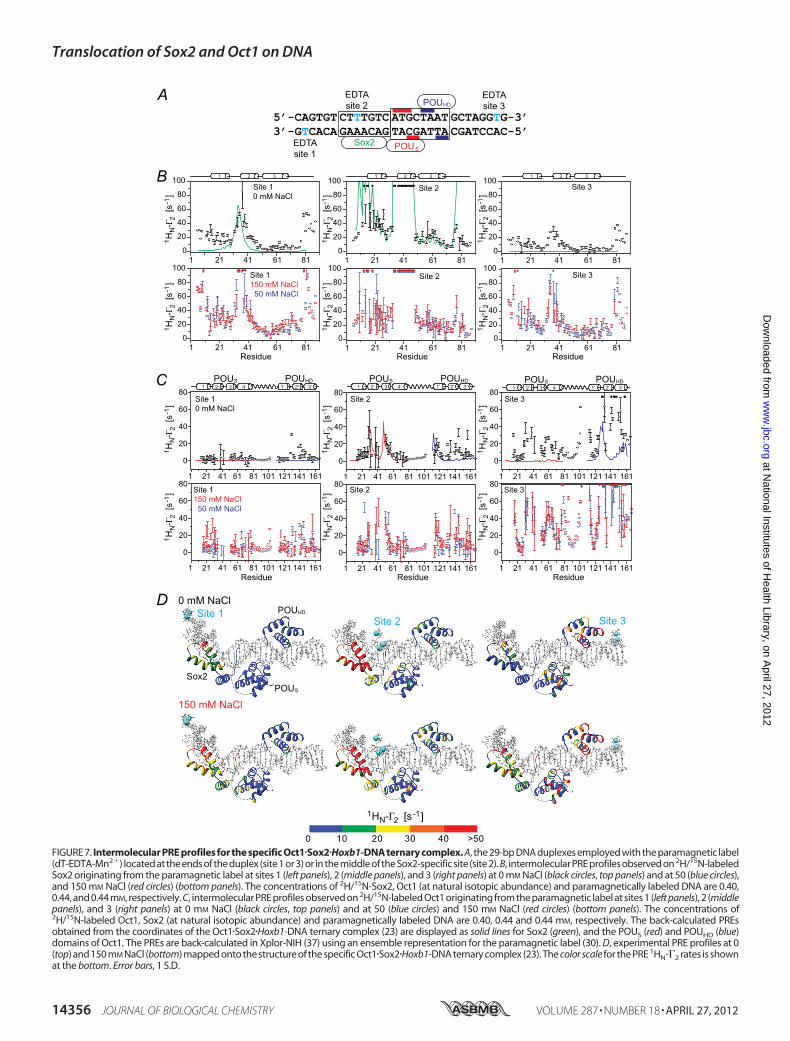
FIGURE 7. Intermolecular PRE profiles for the specific Oct1�Sox2�Hoxb1-DNA ternary complex. A, the 29-bp DNA duplexes employed with the paramagnetic label(dT-EDTA-Mn2�) located at the ends of the duplex (site 1 or 3) or in the middle of the Sox2-specific site (site 2). B, intermolecular PRE profiles observed on 2H/15N-labeledSox2 originating from the paramagnetic label at sites 1 (left panels), 2 (middle panels), and 3 (right panels) at 0 mM NaCl (black circles, top panels) and at 50 (blue circles),and 150 mM NaCl (red circles) (bottom panels). The concentrations of 2H/15N-Sox2, Oct1 (at natural isotopic abundance) and paramagnetically labeled DNA are 0.40,0.44, and 0.44 mM, respectively. C, intermolecular PRE profiles observed on 2H/15N-labeled Oct1 originating from the paramagnetic label at sites 1 (left panels), 2 (middlepanels), and 3 (right panels) at 0 mM NaCl (black circles, top panels) and at 50 (blue circles) and 150 mM NaCl (red circles) (bottom panels). The concentrations of2H/15N-labeled Oct1, Sox2 (at natural isotopic abundance) and paramagnetically labeled DNA are 0.40, 0.44 and 0.44 mM, respectively. The back-calculated PREsobtained from the coordinates of the Oct1�Sox2�Hoxb1-DNA ternary complex (23) are displayed as solid lines for Sox2 (green), and the POUS (red) and POUHD (blue)domains of Oct1. The PREs are back-calculated in Xplor-NIH (37) using an ensemble representation for the paramagnetic label (30). D, experimental PRE profiles at 0(top) and 150 mM NaCl (bottom) mapped onto the structure of the specific Oct1�Sox2�Hoxb1-DNA ternary complex (23). The color scale for the PRE 1HN-�2 rates is shownat the bottom. Error bars, 1 S.D.
Translocation of Sox2 and Oct1 on DNA
14356 JOURNAL OF BIOLOGICAL CHEMISTRY VOLUME 287 • NUMBER 18 • APRIL 27, 2012
at National Institutes of H
ealth Library, on April 27, 2012
ww
w.jbc.org
Dow
nloaded from
which corresponds to a kexinter value of �900 s1. Becauseexchange between all nonspecific sites, including those locatedat either end of theDNA, is fast on the chemical shift time scale,the lower limit for the one-dimensional diffusion constant D1for intramolecular translocation is given by 2kexinter, where L isthe distance between the nonspecific sites at the extreme endsof the DNA, and the factor of 2 arises because there are twobinding orientations. For a 29-bp DNA duplex and a bindingsite size of 7 base pairs, L is equal to 3.4 Å � (29 7) � 75 Å,yielding a lower limit of �0.1 �m2�s1 for D1, consistent withvalues of D1 derived for other proteins by single moleculeexperiments (5, 8).Intermolecular Translocation of Sox2 between 29-bp Specific
DNA Duplexes—To measure the rate of transfer of Sox2between two specific sites, we used an experimental design sim-ilar to that described previously (13, 14). A single base pairmutationwas introduced in theHoxb1 promoter (DNA a) adja-cent to the recognition site (DNA b). This sequence alterationhas no significant effect on the binding affinity for Sox2 butresults in small differences in the 1HN/15N chemical shiftsof several backbone amide groups (residues Met33–Ser39)between the two binary complexes (referred to as complexes aand b). Because Sox2 binds tightly to its cognate DNAsequenceswith aKD of 10.6 nM at 150mMNaCl (14), the 1H-15NTROSY correlation spectrum for a 1:1 mixture of complexes aand b contains peaks from both binary complexes (Fig. 4C). Toanalyze the exchange kinetics for the translocation of Sox2between the two specific DNA sites, we carried out a TROSY-based z-exchange experiment (27). The apparent exchangerates, kabapp and kbaapp, were determined by fitting the timedependence of the intensities of auto and exchange cross-peaks(Fig. 4D) to the McConnell equations (34). At 30 °C, kabapp andkbaapp are independent of the concentration of free DNA withvalues of 2.8 0.1 and 2.5 0.1 s1 (Fig. 4E). These dataindicate that transfer of Sox2 from one specific duplex to theother occurs entirely via dissociation of Sox2 into free solutionfollowed by reassociation, and is rate-limited by the dissocia-tion rate constants given by the equations, kaoff � 2kabapp andkboff � 2kbaapp, where the statistical factor of 2 arises from thefact that transfer of Sox2 between DNA molecules of thesame sequence is of equal probability to transfer betweenDNA molecules of differing sequence (13). Given the mea-sured KD of 10.6 nM, the corresponding association rate con-
stants for the binding of Sox2 to DNA a and DNA b are 5.2 �108 and 4.8 � 108 M1 s1.
These results are distinct from those obtained with thehomeodomainHoxD9 andOct1, where the apparent first orderexchange rate constants for intermolecular translocationbetween specific sites were linearly dependent on the concen-tration of free DNA, indicative of the presence of a direct trans-fer pathway between DNA sites without dissociation into freesolution. In the case of HoxD9, the dissociation/reassociationpathwaywas too slow to detect, whereas in the case of Oct1, thedissociation rate constants could be determined by extrapola-tion of the apparent intermolecular translocation rates to zerofree DNA concentration. The dissociation rate constants forOct1 at 30 °C range from 3.7 to 5.1 s1, comparable with thevalues determined here for Sox2 under the same experimentalconditions.Erying plots of the temperature dependence of the apparent
intermolecular translocation rates for Sox2 (Fig. 4F) yield esti-mates of �21 and �4 kcal�mol1 for the activation enthalpy(�H‡) and entropy (T�S‡ at 30 °C), respectively (Table 1). Thus,the energy barrier for the dissociation of Sox2 from its specificDNA site is primarily enthalpic.In our previous study (14), we showed that Sox2 dramatically
decreases the rate of intermolecular translocation of Oct1between specific DNA-binding sites. The same phenomenon isobserved for intermolecular translocation of Sox2 in the pres-ence of Oct1. No exchange cross-peaks are detectable for inter-molecular translocation of Sox2 between Oct1�Sox2�Hoxb1-DNA ternary complexes (Fig. 4C, right). Even at higher ionicstrength and temperature (260 mM NaCl at 40 °C), exchangecross-peaks in the ternary complexes could not be detected.This can be accounted for by the decrease in KD from 10.6 nMfor the binary Sox2�Hoxb1-DNA complex to 0.6 nM for the ter-nary Oct1�Sox2�Hoxb1-DNA ternary complex (14). Given a15N-T1 relaxation rate of �1 s, the minimum exchange ratemeasurable by z-exchange spectroscopy is �0.2 s1. Thus, theintermolecular translocation rate of Sox2 between specific sitesin ternary complexes is at least an order of magnitude slowerthan in the binary complexes.Translocation of Sox2 in Specific Binary Complexes Probed by
PRE—Given the slow dissociation of the specific Sox2�DNAcomplex, intra- and intermolecular translocation of Sox2bound to its specific DNA target site must involve short lived,
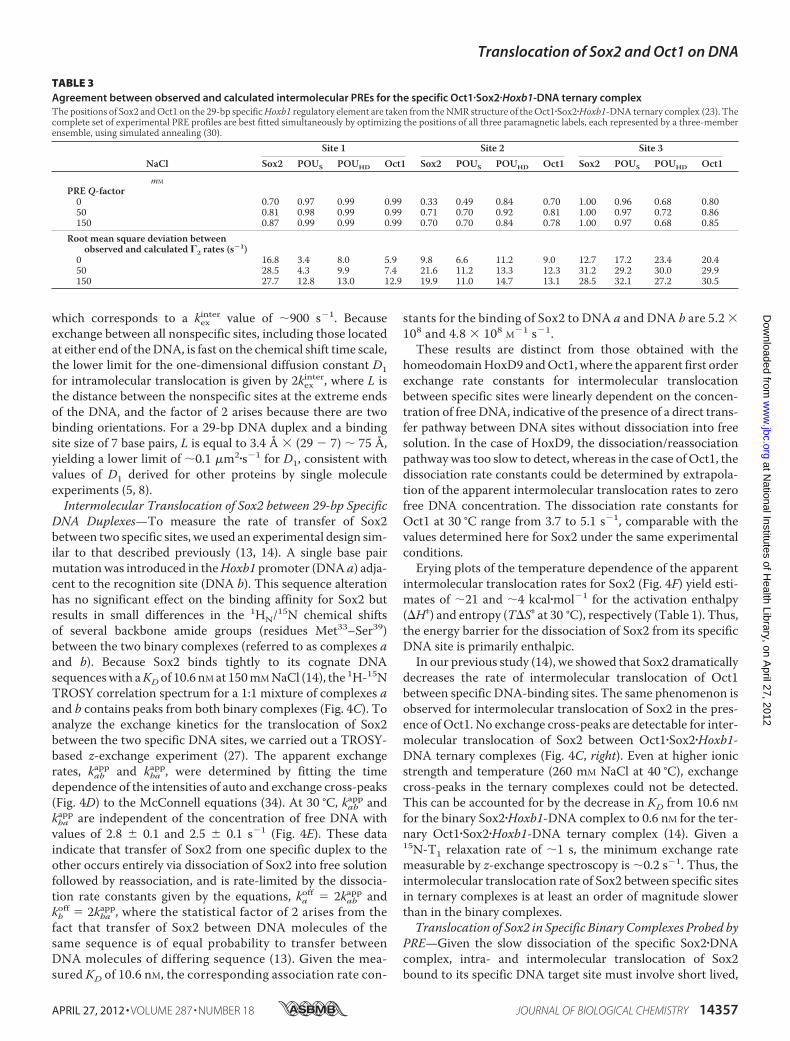
TABLE 3Agreement between observed and calculated intermolecular PREs for the specific Oct1�Sox2�Hoxb1-DNA ternary complexThe positions of Sox2 andOct1 on the 29-bp specificHoxb1 regulatory element are taken from theNMR structure of theOct1�Sox2�Hoxb1-DNA ternary complex (23). Thecomplete set of experimental PRE profiles are best fitted simultaneously by optimizing the positions of all three paramagnetic labels, each represented by a three-memberensemble, using simulated annealing (30).
NaClSite 1 Site 2 Site 3
Sox2 POUS POUHD Oct1 Sox2 POUS POUHD Oct1 Sox2 POUS POUHD Oct1
mM
PRE Q-factor0 0.70 0.97 0.99 0.99 0.33 0.49 0.84 0.70 1.00 0.96 0.68 0.8050 0.81 0.98 0.99 0.99 0.71 0.70 0.92 0.81 1.00 0.97 0.72 0.86150 0.87 0.99 0.99 0.99 0.70 0.70 0.84 0.78 1.00 0.97 0.68 0.85
Root mean square deviation betweenobserved and calculated �2 rates (s�1)
0 16.8 3.4 8.0 5.9 9.8 6.6 11.2 9.0 12.7 17.2 23.4 20.450 28.5 4.3 9.9 7.4 21.6 11.2 13.3 12.3 31.2 29.2 30.0 29.9150 27.7 12.8 13.0 12.9 19.9 11.0 14.7 13.1 28.5 32.1 27.2 30.5
Translocation of Sox2 and Oct1 on DNA
APRIL 27, 2012 • VOLUME 287 • NUMBER 18 JOURNAL OF BIOLOGICAL CHEMISTRY 14357
at National Institutes of H
ealth Library, on April 27, 2012
ww
w.jbc.org
Dow
nloaded from
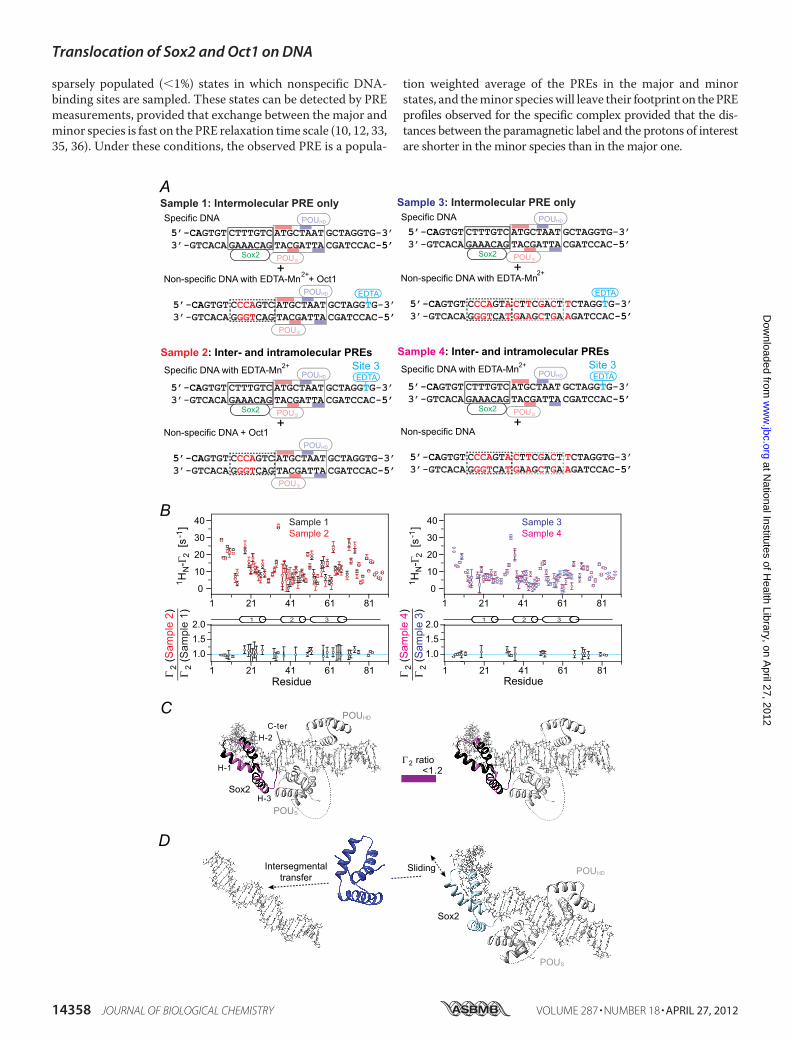
sparsely populated (�1%) states in which nonspecific DNA-binding sites are sampled. These states can be detected by PREmeasurements, provided that exchange between the major andminor species is fast on the PRE relaxation time scale (10, 12, 33,35, 36). Under these conditions, the observed PRE is a popula-
tion weighted average of the PREs in the major and minorstates, and theminor specieswill leave their footprinton thePREprofiles observed for the specific complex provided that the dis-tances between the paramagnetic label and the protons of interestare shorter in theminor species than in themajor one.
Translocation of Sox2 and Oct1 on DNA
14358 JOURNAL OF BIOLOGICAL CHEMISTRY VOLUME 287 • NUMBER 18 • APRIL 27, 2012
at National Institutes of H
ealth Library, on April 27, 2012
ww
w.jbc.org
Dow
nloaded from
The 29-bp specific DNA duplex was paramagneticallylabeled at three sites separately, on either end of theDNAand inthe Sox2 recognition site (Fig. 5A). Note that EDTA is attachedto T on the major groove side of the DNA, and therefore thepresence of the paramagnetic label in the middle of the Sox2recognition site does not perturb the binding of Sox2 in theminor groove. PREs were recorded at 0 mM NaCl (Fig. 5B, toppanels) and at higher salt concentrations (50 and 150mMNaCl;Fig. 5B, bottom panels). The PRE profiles mapped onto thestructure of the specific Sox2�DNA complex are shown in Fig.5C, and a summary of PRE Q-factors (30) reporting the agree-ment between observed and calculated PRE profiles is providedin Table 2.We first consider the PRE profiles at 0 mM added NaCl (Fig.
5B, top panels). The overall experimental PRE profiles agreewell with the back-calculated profiles for the specificSox2�DNA complex. A more detailed examination, however,shows that although the PREs for sites 1 and 2 agreewell (Q-fac-tor � 0.43 and 0.24, respectively), the agreement at site 3 isactually poor in terms of Q-factor (Q � 0.98) although notunreasonable in terms of root mean square difference betweenobserved and calculated PRE rates (2.6 s1) (Table 2). This isbecause no PREs arising from site 3 are predicted from thestructure of the specific complex, whereas some small butsignificant PRE effects (less than 7 s1) are in fact observed atthe N terminus (residues 6–15), the N-terminal end of helix2 (residues 34–37), and the middle of helix 3 (around residue63) (Fig. 5B, top right panel). Thus, although Sox2 clearlyspends the vast majority of its time bound to its specific DNAtarget site, a small population (�1%) must sample alternateconfigurations that come close to the paramagnetic labellocated at site 3. When the salt concentration is increased to50 or 150 mM NaCl (Fig. 5B, bottom panels), the values of allthe PREs arising from site 3 are increased, but the overallPRE profiles remain qualitatively similar to those obtained at0 mM NaCl. This is a consequence of the increase inexchange rate between the specific complex and the sparselypopulated states sampling nonspecific sites on the DNAduplex.To analyze the contributions from intra- (sliding) and inter-
molecular translocation to the PRE profiles, we carried out aseries of experiments involving samples comprising an equalmixture of specific and nonspecific DNA duplexes (12) (Fig. 6).In the first set of PRE experiments (sample 1), the paramagneticlabel was placed on the nonspecific DNA (Fig. 6A, top), and
therefore any observedPREs canonly arise from intermoleculartranslocation involving transient excursions from the specificDNA to the nonspecific DNA and back to the specific DNA. Inthe second set of experiments, the paramagnetic label wasplaced on the specific DNA duplex (sample 2; Fig. 6A, bottom)with the nonspecific DNA unlabeled. The PREs observed insample 2will therefore comprise effects arising fromboth intra-and intermolecular translocation. Thus, if the PRE ratio forsample 1 to sample 2 for a particular paramagnetic center-pro-ton vector has a value of 1, that PRE must arise predominantlyfrom intermolecular translocation. The results of these experi-ments are summarized in Fig. 6B. The ratios of the sample 1 tosample 2 PREs are almost equal to 1 within experimental errorwith the exception of the PREs for residues 50–52 and theC-terminal tail (residues 72–76 and 81–87), indicating that thePRE effects are largely due to intermolecular translocation. Inthe case of residues 50–52, 72–76, and 81–87, all of whichpoint in the direction of the paramagnetic label in the specificcomplex, there is a small (�20%) contribution from sliding(with sample 1 to sample 2 PRE ratios of �1.2). Because disso-ciation of Sox2 from its specific site into free solution is slow(�5 s1 as measured by z-exchange spectroscopy; cf. Fig. 4),rapid intermolecular translocation must occur by Sox2 slidingout of the specific site to make a nonspecific interaction withDNA followed by intersegment transfer from the nonspecificsite(s) (Fig. 6D).Translocation of Oct1 and Sox2 on Hoxb1-DNA in Ternary
Complex Probed by PRE—The experimental PRE profiles forthe ternary Oct1�Sox2�Hoxb1-DNA complex (Fig. 7A) at 0 mM
NaCl (top panels in Fig. 7, B andC) do not agree well with thoseback-calculated for the specificOct1�Sox2�Hoxb1-DNA ternarycomplex (Table 3), in contrast to binary Sox2�DNA (Table 2)and Oct1�DNA (10) complexes. For Sox2, large PRE effects(�10 s1) are observed at the N and C termini (residues 6–16and 77–88) and within helix 2 (residues 34–40) from sites 1and 3 (Fig. 7B). For Oct1, larger than expected PREs areobserved within the POUHD domain from all three paramag-netic sites, and large PREs are observed within the POUSdomain from the paramagnetic label at site 3 (Fig. 7C). Thesedata indicate that although both Sox2 and Oct1 spend the vastmajority of their time bound to their adjacent specific sites (Fig.7, A and D), a small population (�1%) must sample alternateconfigurations that come close to the paramagnetically labeledsites. When the salt concentration is increased to 50 or 150mM
NaCl (Fig. 7,B andC, bottompanels), themagnitude of all of the
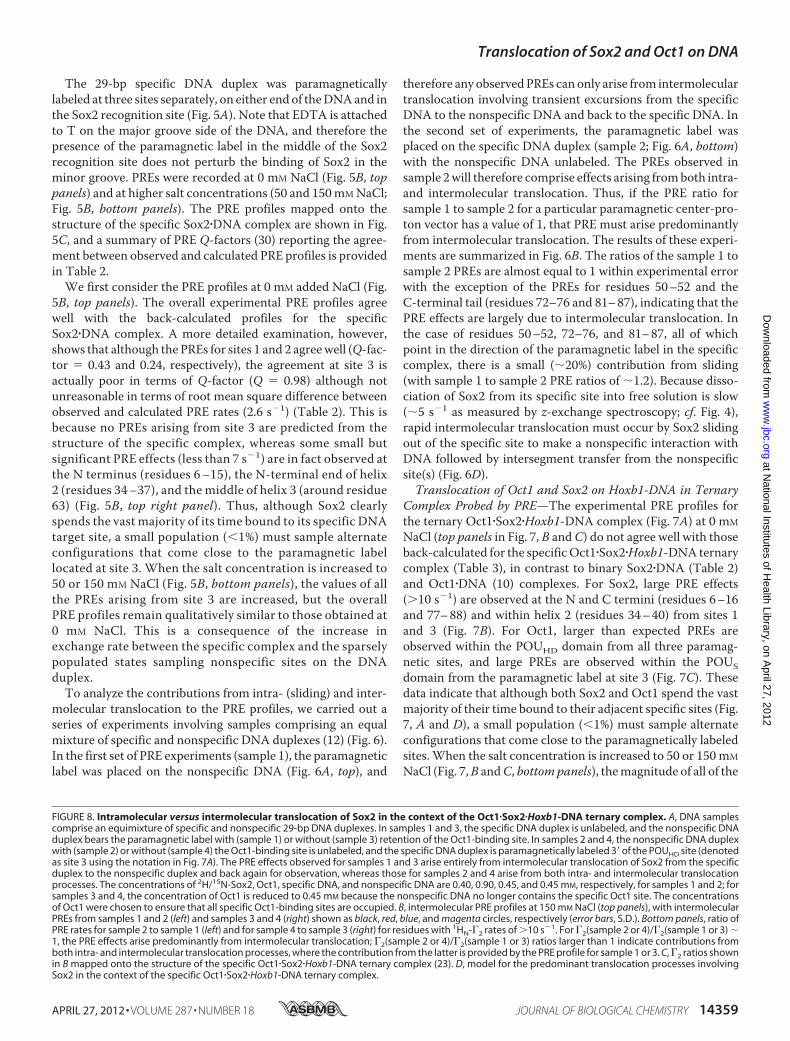
FIGURE 8. Intramolecular versus intermolecular translocation of Sox2 in the context of the Oct1�Sox2�Hoxb1-DNA ternary complex. A, DNA samplescomprise an equimixture of specific and nonspecific 29-bp DNA duplexes. In samples 1 and 3, the specific DNA duplex is unlabeled, and the nonspecific DNAduplex bears the paramagnetic label with (sample 1) or without (sample 3) retention of the Oct1-binding site. In samples 2 and 4, the nonspecific DNA duplexwith (sample 2) or without (sample 4) the Oct1-binding site is unlabeled, and the specific DNA duplex is paramagnetically labeled 3� of the POUHD site (denotedas site 3 using the notation in Fig. 7A). The PRE effects observed for samples 1 and 3 arise entirely from intermolecular translocation of Sox2 from the specificduplex to the nonspecific duplex and back again for observation, whereas those for samples 2 and 4 arise from both intra- and intermolecular translocationprocesses. The concentrations of 2H/15N-Sox2, Oct1, specific DNA, and nonspecific DNA are 0.40, 0.90, 0.45, and 0.45 mM, respectively, for samples 1 and 2; forsamples 3 and 4, the concentration of Oct1 is reduced to 0.45 mM because the nonspecific DNA no longer contains the specific Oct1 site. The concentrationsof Oct1 were chosen to ensure that all specific Oct1-binding sites are occupied. B, intermolecular PRE profiles at 150 mM NaCl (top panels), with intermolecularPREs from samples 1 and 2 (left) and samples 3 and 4 (right) shown as black, red, blue, and magenta circles, respectively (error bars, S.D.). Bottom panels, ratio ofPRE rates for sample 2 to sample 1 (left) and for sample 4 to sample 3 (right) for residues with 1HN-�2 rates of �10 s1. For �2(sample 2 or 4)/�2(sample 1 or 3) �1, the PRE effects arise predominantly from intermolecular translocation; �2(sample 2 or 4)/�2(sample 1 or 3) ratios larger than 1 indicate contributions fromboth intra- and intermolecular translocation processes, where the contribution from the latter is provided by the PRE profile for sample 1 or 3. C, �2 ratios shownin B mapped onto the structure of the specific Oct1�Sox2�Hoxb1-DNA ternary complex (23). D, model for the predominant translocation processes involvingSox2 in the context of the specific Oct1�Sox2�Hoxb1-DNA ternary complex.
Translocation of Sox2 and Oct1 on DNA
APRIL 27, 2012 • VOLUME 287 • NUMBER 18 JOURNAL OF BIOLOGICAL CHEMISTRY 14359
at National Institutes of H
ealth Library, on April 27, 2012
ww
w.jbc.org
Dow
nloaded from
PREs is increased, due to increased exchange rates between thespecific complex and the sparsely populated nonspecific com-plexes, but the overall PRE profiles remain qualitatively thesame.
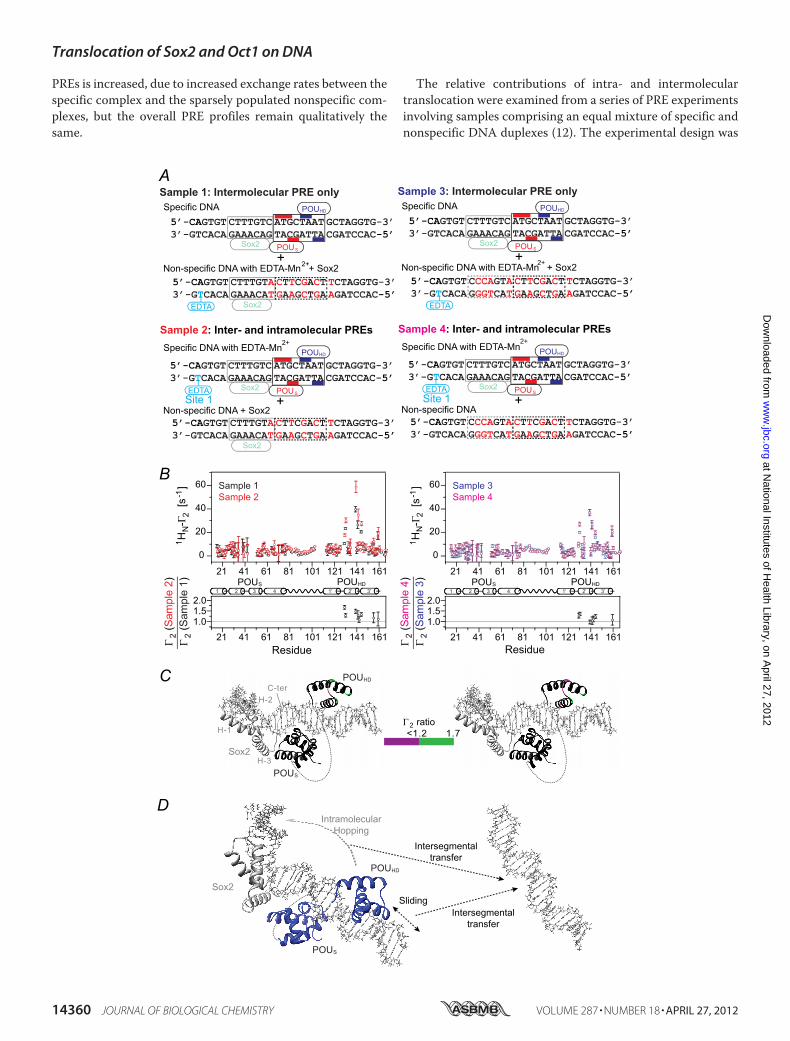
The relative contributions of intra- and intermoleculartranslocation were examined from a series of PRE experimentsinvolving samples comprising an equal mixture of specific andnonspecific DNA duplexes (12). The experimental design was
Translocation of Sox2 and Oct1 on DNA
14360 JOURNAL OF BIOLOGICAL CHEMISTRY VOLUME 287 • NUMBER 18 • APRIL 27, 2012
at National Institutes of H
ealth Library, on April 27, 2012
ww
w.jbc.org
Dow
nloaded from
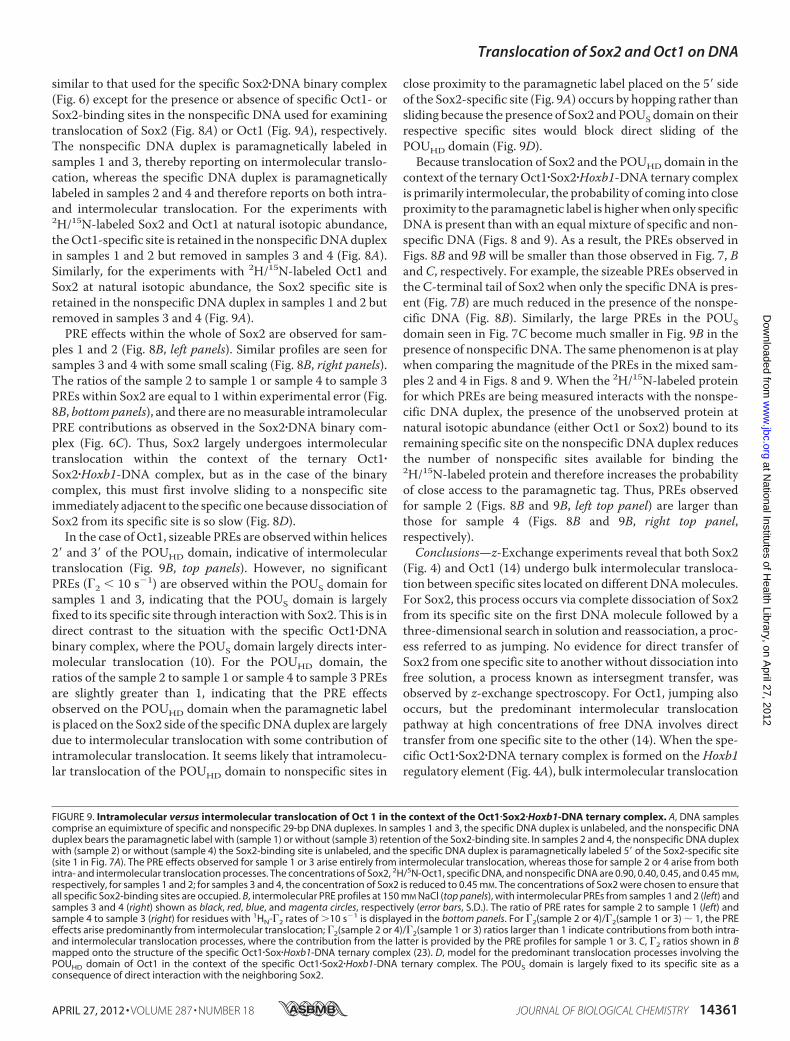
similar to that used for the specific Sox2�DNA binary complex(Fig. 6) except for the presence or absence of specific Oct1- orSox2-binding sites in the nonspecific DNA used for examiningtranslocation of Sox2 (Fig. 8A) or Oct1 (Fig. 9A), respectively.The nonspecific DNA duplex is paramagnetically labeled insamples 1 and 3, thereby reporting on intermolecular translo-cation, whereas the specific DNA duplex is paramagneticallylabeled in samples 2 and 4 and therefore reports on both intra-and intermolecular translocation. For the experiments with2H/15N-labeled Sox2 and Oct1 at natural isotopic abundance,theOct1-specific site is retained in the nonspecificDNAduplexin samples 1 and 2 but removed in samples 3 and 4 (Fig. 8A).Similarly, for the experiments with 2H/15N-labeled Oct1 andSox2 at natural isotopic abundance, the Sox2 specific site isretained in the nonspecific DNA duplex in samples 1 and 2 butremoved in samples 3 and 4 (Fig. 9A).PRE effects within the whole of Sox2 are observed for sam-
ples 1 and 2 (Fig. 8B, left panels). Similar profiles are seen forsamples 3 and 4 with some small scaling (Fig. 8B, right panels).The ratios of the sample 2 to sample 1 or sample 4 to sample 3PREs within Sox2 are equal to 1 within experimental error (Fig.8B, bottompanels), and there are nomeasurable intramolecularPRE contributions as observed in the Sox2�DNA binary com-plex (Fig. 6C). Thus, Sox2 largely undergoes intermoleculartranslocation within the context of the ternary Oct1�Sox2�Hoxb1-DNA complex, but as in the case of the binarycomplex, this must first involve sliding to a nonspecific siteimmediately adjacent to the specific one because dissociation ofSox2 from its specific site is so slow (Fig. 8D).In the case of Oct1, sizeable PREs are observed within helices
2� and 3� of the POUHD domain, indicative of intermoleculartranslocation (Fig. 9B, top panels). However, no significantPREs (�2 � 10 s1) are observed within the POUS domain forsamples 1 and 3, indicating that the POUS domain is largelyfixed to its specific site through interactionwith Sox2. This is indirect contrast to the situation with the specific Oct1�DNAbinary complex, where the POUS domain largely directs inter-molecular translocation (10). For the POUHD domain, theratios of the sample 2 to sample 1 or sample 4 to sample 3 PREsare slightly greater than 1, indicating that the PRE effectsobserved on the POUHD domain when the paramagnetic labelis placed on the Sox2 side of the specific DNAduplex are largelydue to intermolecular translocation with some contribution ofintramolecular translocation. It seems likely that intramolecu-lar translocation of the POUHD domain to nonspecific sites in
close proximity to the paramagnetic label placed on the 5� sideof the Sox2-specific site (Fig. 9A) occurs by hopping rather thansliding because the presence of Sox2 and POUS domain on theirrespective specific sites would block direct sliding of thePOUHD domain (Fig. 9D).Because translocation of Sox2 and the POUHD domain in the
context of the ternaryOct1�Sox2�Hoxb1-DNA ternary complexis primarily intermolecular, the probability of coming into closeproximity to the paramagnetic label is higherwhenonly specificDNA is present than with an equal mixture of specific and non-specific DNA (Figs. 8 and 9). As a result, the PREs observed inFigs. 8B and 9B will be smaller than those observed in Fig. 7, Band C, respectively. For example, the sizeable PREs observed inthe C-terminal tail of Sox2 when only the specific DNA is pres-ent (Fig. 7B) are much reduced in the presence of the nonspe-cific DNA (Fig. 8B). Similarly, the large PREs in the POUSdomain seen in Fig. 7C become much smaller in Fig. 9B in thepresence of nonspecific DNA. The same phenomenon is at playwhen comparing the magnitude of the PREs in the mixed sam-ples 2 and 4 in Figs. 8 and 9. When the 2H/15N-labeled proteinfor which PREs are being measured interacts with the nonspe-cific DNA duplex, the presence of the unobserved protein atnatural isotopic abundance (either Oct1 or Sox2) bound to itsremaining specific site on the nonspecific DNA duplex reducesthe number of nonspecific sites available for binding the2H/15N-labeled protein and therefore increases the probabilityof close access to the paramagnetic tag. Thus, PREs observedfor sample 2 (Figs. 8B and 9B, left top panel) are larger thanthose for sample 4 (Figs. 8B and 9B, right top panel,respectively).Conclusions—z-Exchange experiments reveal that both Sox2
(Fig. 4) and Oct1 (14) undergo bulk intermolecular transloca-tion between specific sites located on different DNAmolecules.For Sox2, this process occurs via complete dissociation of Sox2from its specific site on the first DNA molecule followed by athree-dimensional search in solution and reassociation, a proc-ess referred to as jumping. No evidence for direct transfer ofSox2 from one specific site to another without dissociation intofree solution, a process known as intersegment transfer, wasobserved by z-exchange spectroscopy. For Oct1, jumping alsooccurs, but the predominant intermolecular translocationpathway at high concentrations of free DNA involves directtransfer from one specific site to the other (14). When the spe-cific Oct1�Sox2�DNA ternary complex is formed on the Hoxb1regulatory element (Fig. 4A), bulk intermolecular translocation
FIGURE 9. Intramolecular versus intermolecular translocation of Oct 1 in the context of the Oct1�Sox2�Hoxb1-DNA ternary complex. A, DNA samplescomprise an equimixture of specific and nonspecific 29-bp DNA duplexes. In samples 1 and 3, the specific DNA duplex is unlabeled, and the nonspecific DNAduplex bears the paramagnetic label with (sample 1) or without (sample 3) retention of the Sox2-binding site. In samples 2 and 4, the nonspecific DNA duplexwith (sample 2) or without (sample 4) the Sox2-binding site is unlabeled, and the specific DNA duplex is paramagnetically labeled 5� of the Sox2-specific site(site 1 in Fig. 7A). The PRE effects observed for sample 1 or 3 arise entirely from intermolecular translocation, whereas those for sample 2 or 4 arise from bothintra- and intermolecular translocation processes. The concentrations of Sox2, 2H/5N-Oct1, specific DNA, and nonspecific DNA are 0.90, 0.40, 0.45, and 0.45 mM,respectively, for samples 1 and 2; for samples 3 and 4, the concentration of Sox2 is reduced to 0.45 mM. The concentrations of Sox2 were chosen to ensure thatall specific Sox2-binding sites are occupied. B, intermolecular PRE profiles at 150 mM NaCl (top panels), with intermolecular PREs from samples 1 and 2 (left) andsamples 3 and 4 (right) shown as black, red, blue, and magenta circles, respectively (error bars, S.D.). The ratio of PRE rates for sample 2 to sample 1 (left) andsample 4 to sample 3 (right) for residues with 1HN-�2 rates of �10 s1 is displayed in the bottom panels. For �2(sample 2 or 4)/�2(sample 1 or 3) � 1, the PREeffects arise predominantly from intermolecular translocation; �2(sample 2 or 4)/�2(sample 1 or 3) ratios larger than 1 indicate contributions from both intra-and intermolecular translocation processes, where the contribution from the latter is provided by the PRE profiles for sample 1 or 3. C, �2 ratios shown in Bmapped onto the structure of the specific Oct1�Sox�Hoxb1-DNA ternary complex (23). D, model for the predominant translocation processes involving thePOUHD domain of Oct1 in the context of the specific Oct1�Sox2�Hoxb1-DNA ternary complex. The POUS domain is largely fixed to its specific site as aconsequence of direct interaction with the neighboring Sox2.
Translocation of Sox2 and Oct1 on DNA
APRIL 27, 2012 • VOLUME 287 • NUMBER 18 JOURNAL OF BIOLOGICAL CHEMISTRY 14361
at National Institutes of H
ealth Library, on April 27, 2012
ww
w.jbc.org
Dow
nloaded from

between specific sites for both Sox2 (Fig. 4) and Oct1 (14) isslowed down by more than an order of magnitude and can nolonger be detected by z-exchange spectroscopy. From the per-spective of gene regulation, this implies that once the specificternary Oct1�Sox2�Hoxb1-DNA complex is formed, the searchprocess for other potential target sites by the Oct1 and Sox2molecules bound to a particular regulatory element will beslowed down but, importantly, not eliminated (see below).Intermolecular translocation between specific binding sites
observed by z-exchange spectroscopy involves the major spec-troscopically “visible” species (i.e. the specific complexes whosespectra can be directly observed). However, fast translocationof Sox2 and Oct1, in the context of both binary and ternaryspecific complexes, occurs both along the DNA via sliding(intramolecular translocation) and between DNA moleculesvia direct intersegment transfer (Figs. 5–9). These processescan be detected by PRE and involve sparsely populated statesbound to nonspecific sites that are in fast exchange with thespecific complexes on whose spectra the PRE profiles are mea-sured. The transiently populated states reveal their footprint onthe PRE profiles measured on the major species because underfast exchange conditions, the observed PREs are a populationweighted average, and the �r6 dependence of the PRE ensuresthat any short paramagnetic center to proton distances presentin the minor species will have a large impact on the PRE ratesobserved on the major species, especially if the correspondingparamagnetic center to proton distances are long in the majorspecies.Both PRE (Fig. 2) and Lorentzian line width analysis (Fig. 3)
of nonspecific Sox2�DNA complexes indicate the presence ofrapid intra- and intermolecular translocation between nonspe-cific sites, corresponding to sliding and direct intersegmenttransfer, respectively. These species represent the entitieswhose footprints are observed in the PRE profiles measured onthe specific complexes. Sliding is a first order process and istherefore independent of the concentration of nonspecificDNA. In vivo, the length of DNA over which sliding occurs willdepend on two factors: 1) the competition between sliding andintermolecular translocation and 2) the presence of other pro-teins on the DNA that may block further ongoing sliding,thereby promoting either dissociation or intersegment transfer.The apparent rate of intersegment transfer between nonspe-cific DNA sites is directly proportional to the concentration ofDNA and will therefore play a major role in vivo because theconcentration of nonspecific DNA within the nucleus isextremely high.The data presented here suggest the following model
whereby Sox2 efficiently explores the DNA landscape to locateits specific target site. Sox2 searches for its specific target siteusing both direct (intersegment) transfer between nonspecificsites on different DNA duplexes and sliding along nonspecificDNA (Fig. 6E). Once Sox2 and Oct1 form a specific ternarycomplex with Hoxb1-DNA, further sampling of DNA sites isreduced but can still occur by initial sliding to an adjacent non-specific site followed by intersegment transfer (Fig. 8D). Oct1alone explores the DNA landscape by making use of the com-plementary interplay of intramolecular sliding by the POUHDdomain and intersegment transfer of the POUS domain (10),
with the latter acting as a flycast. Once the ternary complexwith Sox2 is formed, however, the POUS domain is largely fixedto its specific site as a result of direct contact with Sox2. ThePOUHD domain, however, can still sample other DNA sites, asevidenced by the PRE data (Figs. 7 and 9), by an initial slidingevent to an adjacent nonspecific site, as in the case of Sox2,followed by either intersegment transfer to another DNAmol-ecule or by direct hopping to another nonspecific site on thesameDNAmolecule (Fig. 9D). In the former instance, a bridgedintermediate is formed inwhich the POUSdomain and Sox2 arelocated on the first DNA molecule, whereas the POUHDdomain is bound to the second DNA molecule. The formationof this bridged complex can promote the completion of therelease of Oct1 from the ternary complex by a first order pro-cess involving dissociation of the POUS domain from the firstDNA, followed by association on to the secondDNA. This con-trasts to the mechanism used in the specific Oct1�DNA binarycomplexwhere the POUSdomain locates the secondDNAmol-ecule by intersegment transfer, thereby promoting the subse-quent transfer of the POUHD domain (10). Thus, direct inter-action of Sox2 with the POUS domain of Oct1 bound toadjacent cognate sites on the DNAmodulates the translocationpathway employed byOct1 to scan alternative DNA target sitesvia transient, sparsely populated states.
Acknowledgments—We thank Drs. Garrett, Baber, and Ying for tech-nical support and Dr. Carole Bewley for useful discussions.
REFERENCES1. Berg, O. G., and von Hippel, P. H. (1985) Diffusion-controlled macromo-
lecular interactions. Annu. Rev. Biophys. Biophys. Chem. 14, 131–1602. von Hippel, P. H., and Berg, O. G. (1989) Facilitated target location in
biological systems. J. Biol. Chem. 264, 675–6783. Halford, S. E., and Marko, J. F. (2004) How do site-specific DNA-binding
proteins find their targets? Nucleic Acids Res. 32, 3040–30524. Vuzman, D., Azia, A., and Levy, Y. (2010) Searching DNA via a “Monkey
Bar” mechanism. The significance of disordered tails. J. Mol. Biol. 396,674–684
5. Gorman, J., Plys, A. J., Visnapuu, M. L., Alani, E., and Greene, E. C. (2010)Visualizing one-dimensional diffusion of eukaryotic DNA repair factorsalong a chromatin lattice. Nat. Struct. Mol. Biol. 17, 932–938
6. Clore, G.M. (2011) Exploring translocation of proteins on DNA by NMR.J. Biomol. NMR 51, 209–219
7. Iwahara, J., Zweckstetter,M., andClore, G.M. (2006) NMR structural andkinetic characterization of a homeodomain diffusing and hopping on non-specific DNA. Proc. Natl. Acad. Sci. U.S.A. 103, 15062–15067
8. Blainey, P. C., Luo, G., Kou, S. C., Mangel,W. F., Verdine, G. L., Bagchi, B.,and Xie, X. S. (2009) Nonspecifically bound proteins spin while diffusingalong DNA. Nat. Struct. Mol. Biol. 16, 1224–1229
9. Levy, Y., Onuchic, J. N., andWolynes, P. G. (2007) Fly-casting in protein-DNA binding. Frustration between protein folding and electrostatics fa-cilitates target recognition. J. Am. Chem. Soc. 129, 738–739
10. Takayama, Y., and Clore, G. M. (2011) Intra- and intermolecular translo-cation of the bi-domain transcription factor Oct1 characterized by liquidcrystal and paramagnetic NMR. Proc. Natl. Acad. Sci. U.S.A. 108,E169–E176
11. Vuzman, D., Polonsky, M., and Levy, Y. (2010) Facilitated DNA search bymultidomain transcription factors. Cross-talk via a flexible linker.Biophys.J. 99, 1202–1211
12. Iwahara, J., and Clore, G. M. (2006) Detecting transient intermediates inmacromolecular binding by paramagnetic NMR.Nature 440, 1227–1230
13. Iwahara, J., and Clore, G.M. (2006) Direct observation of enhanced trans-
Translocation of Sox2 and Oct1 on DNA
14362 JOURNAL OF BIOLOGICAL CHEMISTRY VOLUME 287 • NUMBER 18 • APRIL 27, 2012
at National Institutes of H
ealth Library, on April 27, 2012
ww
w.jbc.org
Dow
nloaded from
location of a homeodomain between DNA cognate sites by NMR ex-change spectroscopy. J. Am. Chem. Soc. 128, 404–405
14. Doucleff,M., andClore, G.M. (2008)Global jumping and domain-specificintersegment transfer between DNA cognate sites of the multidomaintranscription factor Oct-1. Proc. Natl. Acad. Sci. U.S.A. 105, 13871–13876
15. Di Rocco, G., Gavalas, A., Popperl, H., Krumlauf, R., Mavilio, F., and Zap-pavigna, V. (2001) The recruitment of SOX/OCT complexes and the dif-ferential activity of HOXA1 and HOXB1 modulate the Hoxb1 autoregu-latory enhancer function. J. Biol. Chem. 276, 20506–20515
16. Sturm, R. A., Das, G., and Herr, W. (1988) The ubiquitous octamer-bind-ing protein Oct-1 contains a POU domain with a homeobox subdomain.Genes Dev. 2, 1582–1599
17. Andersen, B., and Rosenfeld, M. G. (2001) POU domain factors in theneuroendocrine system. Lessons from developmental biology provide in-sights into human disease. Endocr. Rev. 22, 2–35
18. Herr,W., Sturm, R. A., Clerc, R. G., Corcoran, L. M., Baltimore, D., Sharp,P. A., Ingraham, H. A., Rosenfeld, M. G., Finney, M., and Ruvkun, G.(1988) The POU domain. A large conserved region in the mammalianpit-1, oct-1, oct-2, and Caenorhabditis elegans unc-86 gene products.Genes Dev. 2, 1513–1516
19. Klemm, J. D., Rould, M. A., Aurora, R., Herr, W., and Pabo, C. O. (1994)Crystal structure of the Oct-1 POU domain bound to an octamer site.DNA recognition with tethered DNA-binding modules. Cell 77, 21–32
20. Kamachi, Y., Uchikawa, M., and Kondoh, H. (2000) Pairing SOX off: withpartners in the regulation of embryonic development. Trends Genet. 16,182–187
21. Dailey, L., and Basilico, C. (2001) Coevolution of HMG domains and ho-meodomains and the generation of transcriptional regulation by Sox/POU complexes. J. Cell. Physiol. 186, 315–328
22. Murphy, E. C., Zhurkin, V. B., Louis, J.M., Cornilescu, G., andClore, G.M.(2001) Structural basis for SRY-dependent 46-X,Y sex reversal. Modula-tion of DNA bending by a naturally occurring point mutation. J. Mol. Biol.312, 481–499
23. Williams, D. C., Jr., Cai, M., and Clore, G. M. (2004) Molecular basis forsynergistic transcriptional activation by Oct1 and Sox2 revealed from thesolution structure of the 42-kDa Oct1�Sox2�Hoxb1-DNA ternary tran-scription factor complex. J. Biol. Chem. 279, 1449–1457
24. Iwahara, J., Anderson, D. E., Murphy, E. C., and Clore, G. M. (2003)EDTA-derivatized deoxythymidine as a tool for rapid determination ofprotein binding polarity to DNA by intermolecular paramagnetic relax-ation enhancement. J. Am. Chem. Soc. 125, 6634–6635
25. Delaglio, F., Grzesiek, S., Vuister, G. W., Zhu, G., Pfeifer, J., and Bax, A.(1995) NMRPipe. A multidimensional spectral processing system basedon UNIX pipes. J. Biomol. NMR 6, 277–293
26. Johnson, B. A., and Blevins, R. A. (1994) J. Biomol. NMR 4, 603–61427. Sahu, D., Clore, G. M., and Iwahara, J. (2007) TROSY-based z-exchange
spectroscopy. Application to the determination of the activation energyfor intermolecular protein translocation between specific sites on differ-ent DNA molecules. J. Am. Chem. Soc. 129, 13232–13237
28. Iwahara, J., Tang, C., and Marius Clore, G. (2007) Practical aspects of 1Htransverse paramagnetic relaxation enhancementmeasurements onmac-romolecules. J. Magn. Reson. 184, 185–195
29. Fawzi, N. L., Doucleff, M., Suh, J. Y., and Clore, G. M. (2010) Mechanisticdetails of a protein-protein association pathway revealed by paramagneticrelaxation enhancement titration measurements. Proc. Natl. Acad. Sci.U.S.A. 107, 1379–1384
30. Iwahara, J., Schwieters, C. D., and Clore, G. M. (2004) Ensemble approachfor NMR structure refinement against 1H paramagnetic relaxation en-hancement data arising from a flexible paramagnetic group attached to amacromolecule. J. Am. Chem. Soc. 126, 5879–5896
31. Schwieters, C.D., Kuszewski, J. J., Tjandra,N., andClore, G.M. (2003) TheXplor-NIH NMR molecular structure determination package. J. Magn.Reson. 160, 65–73
32. Iwahara, J., Schwieters, C. D., and Clore, G. M. (2004) Characterization ofnonspecific protein-DNA interactions by 1H paramagnetic relaxation en-hancement. J. Am. Chem. Soc. 126, 12800–12808
33. Clore, G. M., and Iwahara, J. (2009) Theory, practice, and applications ofparamagnetic relaxation enhancement for the characterization of tran-sient low-population states of biological macromolecules and their com-plexes. Chem. Rev. 109, 4108–4139
34. McConnell, H. M. (1958) Reaction rates by nuclear magnetic resonance.J. Chem. Phys. 28, 430–431
35. Tang, C., Iwahara, J., and Clore, G. M. (2006) Visualization of transientencounter complexes in protein-protein association. Nature 444,383–386
36. Tang, C., Schwieters, C. D., and Clore, G. M. (2007) Open-to-closed tran-sition in apo maltose-binding protein observed by paramagnetic NMR.Nature 449, 1078–1082
37. Schwieters, C. D., Kuszewski, J. J., and Clore, G. M. (2006) Using Xplor-NIH for NMR molecular structure determination. Prog. Nucl. Magn.Reson. Spectrosc. 48, 47–62
Translocation of Sox2 and Oct1 on DNA
APRIL 27, 2012 • VOLUME 287 • NUMBER 18 JOURNAL OF BIOLOGICAL CHEMISTRY 14363
at National Institutes of H
ealth Library, on April 27, 2012
ww
w.jbc.org
Dow
nloaded from