interpolation vs. extrapolation: evaluating the model dependency of counterfactuals using r heather...
TRANSCRIPT

Interpolation vs. Interpolation vs. Extrapolation: Extrapolation:
Evaluating the Model Evaluating the Model Dependency of Dependency of
Counterfactuals Using RCounterfactuals Using RHeather StollHeather Stoll
Department of Political ScienceDepartment of Political ScienceUniversity of California, Santa BarbaraUniversity of California, Santa Barbara

Plan of AttackPlan of Attack
1.1. The methodologist’s dilemmaThe methodologist’s dilemma
2.2. All about RAll about R
3.3. Example: assessing counterfactual Example: assessing counterfactual model dependency (King and Zeng model dependency (King and Zeng 2006a, 2006b)2006a, 2006b)
4.4. Implementation via R package Implementation via R package WhatIf (Stoll, King and Zeng 2006)WhatIf (Stoll, King and Zeng 2006)
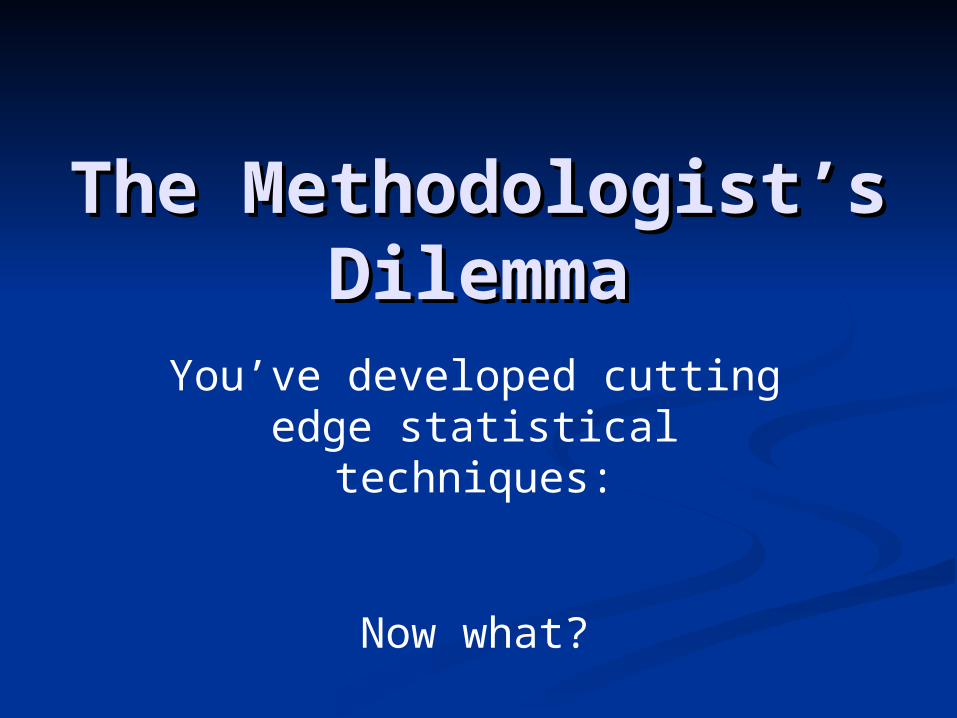
The Methodologist’s The Methodologist’s DilemmaDilemma
You’ve developed cutting edge statistical techniques:
Now what?

Three ChoicesThree Choices
Assume applied researchers will write Assume applied researchers will write their own code to implement new their own code to implement new techniquestechniques
Wait for commercial software Wait for commercial software packages to implement thempackages to implement them
Costner approach: “Build it and they Costner approach: “Build it and they will come”will come”

All About RAll About R

Why R?Why R?
Open source statistical computing Open source statistical computing environmentenvironment
UNIX/LINUX, Windows, and MacOS versionsUNIX/LINUX, Windows, and MacOS versions Object-oriented, user-friendly programming Object-oriented, user-friendly programming
language “not unlike” S of SPLUSlanguage “not unlike” S of SPLUS Widely used by statisticians and Widely used by statisticians and
methodologists in many fieldsmethodologists in many fields Implements range of statistical and graphical Implements range of statistical and graphical
techniques, both commonplace and techniques, both commonplace and specializedspecialized

R’s Default CapabilitiesR’s Default Capabilities
Linear and nonlinear modelingLinear and nonlinear modeling Clustering and classification analysisClustering and classification analysis Classical statistical testsClassical statistical tests Non-parametricsNon-parametrics Time series analysisTime series analysis Matrix and algebraic operationsMatrix and algebraic operations Publication-quality graphicsPublication-quality graphics And much, much more…And much, much more…

A Picture is Worth 1000 A Picture is Worth 1000 WordsWords
© R Foundation, from www.r-project.org
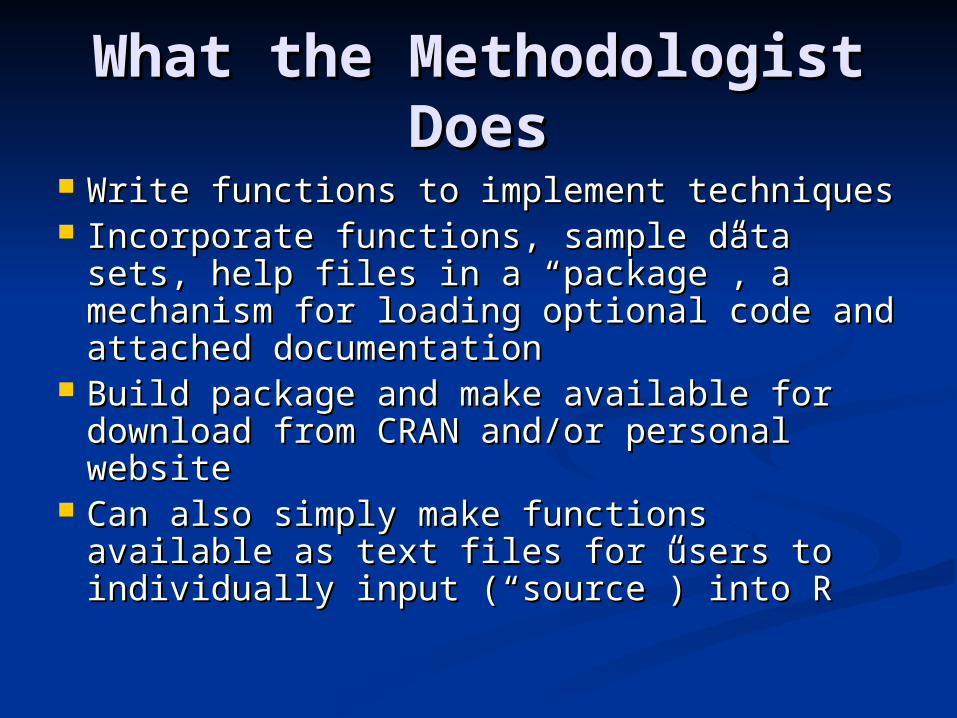
What the Methodologist What the Methodologist DoesDoes
Write functions to implement techniquesWrite functions to implement techniques Incorporate functions, sample data sets, Incorporate functions, sample data sets,
help files in a “package”, a mechanism help files in a “package”, a mechanism for loading optional code and attached for loading optional code and attached documentationdocumentation
Build package and make available for Build package and make available for download from CRAN and/or personal download from CRAN and/or personal websitewebsite
Can also simply make functions available Can also simply make functions available as text files for users to individually input as text files for users to individually input (“source”) into R(“source”) into R

What the User DoesWhat the User Does Install R from CRAN (http://www.r-Install R from CRAN (http://www.r-
project.org)project.org) Launch RLaunch R Type: Type:
install.packages(“PackageName”) install.packages(“PackageName”) and then library(PackageName)and then library(PackageName)
Call desired functionsCall desired functions And …And …
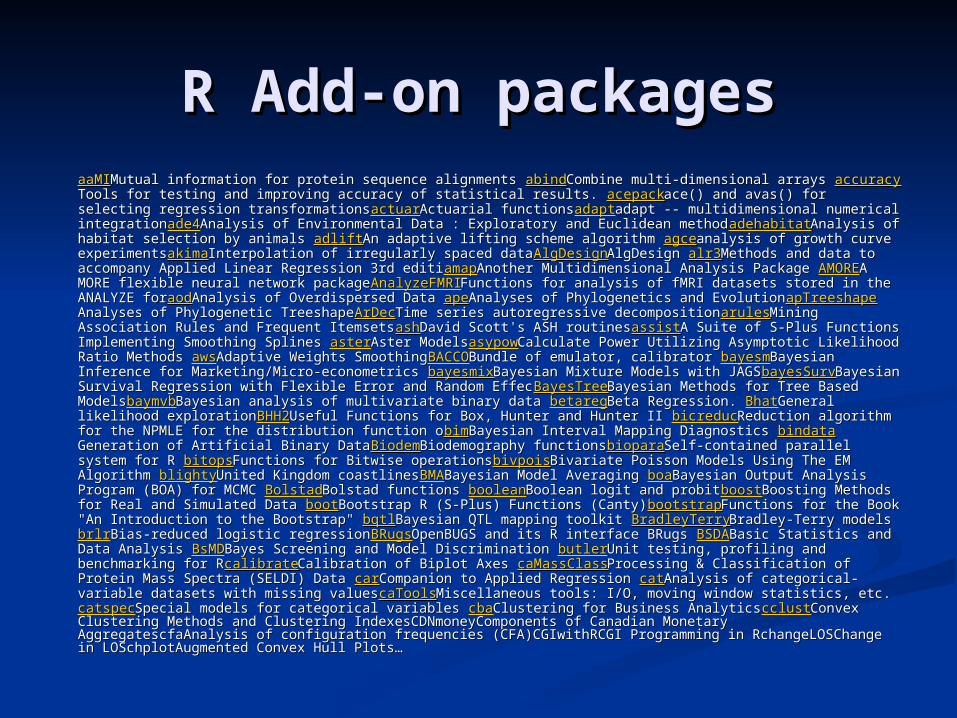
R Add-on packagesR Add-on packagesaaMIaaMIMutual information for protein sequence alignments Mutual information for protein sequence alignments abindabindCombine multi-dimensional arrays Combine multi-dimensional arrays accuracyaccuracyTools for testing and improving accuracy of statistical results. Tools for testing and improving accuracy of statistical results. acepackacepackace() and avas() for ace() and avas() for selecting regression transformationsselecting regression transformationsactuaractuarActuarial functionsActuarial functionsadaptadaptadapt -- multidimensional numerical adapt -- multidimensional numerical integrationintegrationade4ade4Analysis of Environmental Data : Exploratory and Euclidean methodAnalysis of Environmental Data : Exploratory and Euclidean methodadehabitatadehabitatAnalysis Analysis of habitat selection by animals of habitat selection by animals adliftadliftAn adaptive lifting scheme algorithm An adaptive lifting scheme algorithm agceagceanalysis of growth curve analysis of growth curve experimentsexperimentsakimaakimaInterpolation of irregularly spaced dataInterpolation of irregularly spaced dataAlgDesignAlgDesignAlgDesign AlgDesign alr3alr3Methods and data to Methods and data to accompany Applied Linear Regression 3rd editiaccompany Applied Linear Regression 3rd editiamapamapAnother Multidimensional Analysis Package Another Multidimensional Analysis Package AMOREAMOREA MORE flexible neural network packageA MORE flexible neural network packageAnalyzeFMRIAnalyzeFMRIFunctions for analysis of fMRI datasets Functions for analysis of fMRI datasets stored in the ANALYZE forstored in the ANALYZE foraodaodAnalysis of Overdispersed Data Analysis of Overdispersed Data apeapeAnalyses of Phylogenetics and Analyses of Phylogenetics and EvolutionEvolutionapTreeshapeapTreeshapeAnalyses of Phylogenetic TreeshapeAnalyses of Phylogenetic TreeshapeArDecArDecTime series autoregressive Time series autoregressive decompositiondecompositionarulesarulesMining Association Rules and Frequent ItemsetsMining Association Rules and Frequent ItemsetsashashDavid Scott's ASH routinesDavid Scott's ASH routinesassistassistA Suite of S-Plus Functions Implementing Smoothing Splines A Suite of S-Plus Functions Implementing Smoothing Splines asterasterAster ModelsAster ModelsasypowasypowCalculate Calculate Power Utilizing Asymptotic Likelihood Ratio Methods Power Utilizing Asymptotic Likelihood Ratio Methods awsawsAdaptive Weights SmoothingAdaptive Weights SmoothingBACCOBACCOBundle of Bundle of emulator, calibrator emulator, calibrator bayesmbayesmBayesian Inference for Marketing/Micro-econometrics Bayesian Inference for Marketing/Micro-econometrics bayesmixbayesmixBayesian Bayesian Mixture Models with JAGSMixture Models with JAGSbayesSurvbayesSurvBayesian Survival Regression with Flexible Error and Random Bayesian Survival Regression with Flexible Error and Random EffecEffecBayesTreeBayesTreeBayesian Methods for Tree Based ModelsBayesian Methods for Tree Based ModelsbaymvbbaymvbBayesian analysis of multivariate Bayesian analysis of multivariate binary data binary data betaregbetaregBeta Regression. Beta Regression. BhatBhatGeneral likelihood explorationGeneral likelihood explorationBHH2BHH2Useful Functions for Box, Useful Functions for Box, Hunter and Hunter II Hunter and Hunter II bicreducbicreducReduction algorithm for the NPMLE for the distribution function oReduction algorithm for the NPMLE for the distribution function obimbimBayesian Interval Mapping Diagnostics Bayesian Interval Mapping Diagnostics bindatabindataGeneration of Artificial Binary DataGeneration of Artificial Binary DataBiodemBiodemBiodemography functionsBiodemography functionsbioparabioparaSelf-contained parallel system for R Self-contained parallel system for R bitopsbitopsFunctions for Bitwise Functions for Bitwise operationsoperationsbivpoisbivpoisBivariate Poisson Models Using The EM Algorithm Bivariate Poisson Models Using The EM Algorithm blightyblightyUnited Kingdom coastlinesUnited Kingdom coastlinesBMABMABayesian Model Averaging Bayesian Model Averaging boaboaBayesian Output Analysis Program (BOA) for MCMC Bayesian Output Analysis Program (BOA) for MCMC BolstadBolstadBolstad Bolstad functions functions booleanbooleanBoolean logit and probitBoolean logit and probitboostboostBoosting Methods for Real and Simulated Data Boosting Methods for Real and Simulated Data bootbootBootstrap R (S-Plus) Functions (Canty)Bootstrap R (S-Plus) Functions (Canty)bootstrapbootstrapFunctions for the Book "An Introduction to the Functions for the Book "An Introduction to the Bootstrap" Bootstrap" bqtlbqtlBayesian QTL mapping toolkit Bayesian QTL mapping toolkit BradleyTerryBradleyTerryBradley-Terry modelsBradley-Terry modelsbrlrbrlrBias-reduced Bias-reduced logistic regressionlogistic regressionBRugsBRugsOpenBUGS and its R interface BRugs OpenBUGS and its R interface BRugs BSDABSDABasic Statistics and Data Analysis Basic Statistics and Data Analysis BsMDBsMDBayes Screening and Model Discrimination Bayes Screening and Model Discrimination butlerbutlerUnit testing, profiling and benchmarking for RUnit testing, profiling and benchmarking for RcalibratecalibrateCalibration of Biplot Axes Calibration of Biplot Axes caMassClasscaMassClassProcessing & Classification of Protein Mass Spectra Processing & Classification of Protein Mass Spectra (SELDI) Data (SELDI) Data carcarCompanion to Applied Regression Companion to Applied Regression catcatAnalysis of categorical-variable datasets with Analysis of categorical-variable datasets with missing valuesmissing valuescaToolscaToolsMiscellaneous tools: I/O, moving window statistics, etc. Miscellaneous tools: I/O, moving window statistics, etc. catspeccatspecSpecial models Special models for categorical variables for categorical variables cbacbaClustering for Business AnalyticsClustering for Business AnalyticscclustcclustConvex Clustering Methods and Convex Clustering Methods and Clustering IndexesCDNmoneyComponents of Canadian Monetary AggregatescfaAnalysis of Clustering IndexesCDNmoneyComponents of Canadian Monetary AggregatescfaAnalysis of configuration frequencies (CFA)CGIwithRCGI Programming in RchangeLOSChange in configuration frequencies (CFA)CGIwithRCGI Programming in RchangeLOSChange in LOSchplotAugmented Convex Hull Plots…LOSchplotAugmented Convex Hull Plots…

Recent PoliSci R Recent PoliSci R Packages Packages
MCMCpack (Quinn): Bayesian MCMCpack (Quinn): Bayesian inference via Markov chain Monte Carloinference via Markov chain Monte Carlo
Anchors (Wand): Analyzing survey data Anchors (Wand): Analyzing survey data with anchoring vignetteswith anchoring vignettes
eco (Imai and Lu): Bayesian ecological eco (Imai and Lu): Bayesian ecological inference in 2x2 tablesinference in 2x2 tables
Matching (Sekhon): Multivariate and Matching (Sekhon): Multivariate and propensity score matching software for propensity score matching software for causal inferencecausal inference

Counterfactual Counterfactual Model DependencyModel Dependency

The first known attempt to answer this question was in 1909 by J.T.C. Moore-Brabazon, who earlier the same year was the first British pilot to fly in Britain. On the left is Moore-Brabazon in his personal French-built Voisin aero plane. On the right is a
pig in a wicker basket behind a sign that says "I am the first pig to fly."
What would happen if pigs could fly? Much social science inference is Much social science inference is counterfactualcounterfactual

The ProblemThe Problem Counterfactuals far Counterfactuals far
from data (unrealistic) from data (unrealistic) are model dependentare model dependent
But how far is too far?But how far is too far?
Model dependence Model dependence usually studied via usually studied via sensitivity analyses sensitivity analyses but this has many but this has many drawbacksdrawbacks Example of extreme model
dependence for out-of-sample predictions

Assessing Dependence via Assessing Dependence via DistanceDistance
Two procedures for assessing distance Two procedures for assessing distance of counterfactual from data:of counterfactual from data:
1.1. Determine whether counterfactual Determine whether counterfactual involves extrapolation or interpolationinvolves extrapolation or interpolation
2.2. Calculate proportion of observations Calculate proportion of observations “nearby” counterfactual using Gower’s “nearby” counterfactual using Gower’s non-parametric (or any other) distance non-parametric (or any other) distance metricmetric
Neither requires sensitivity analyses Neither requires sensitivity analyses of any sortof any sort
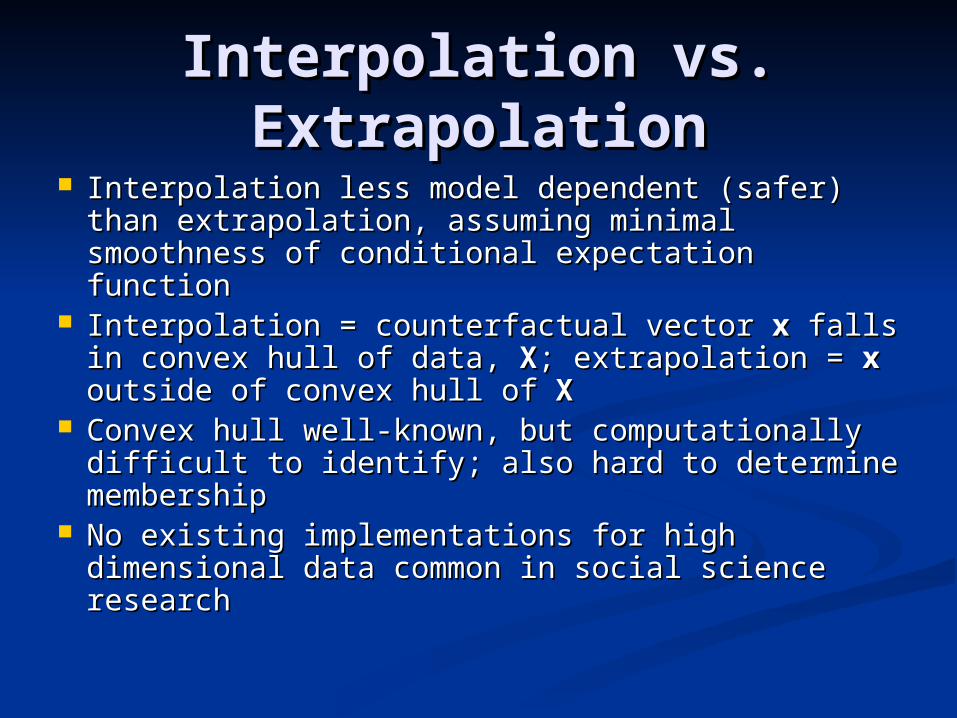
Interpolation vs. Interpolation vs. ExtrapolationExtrapolation
Interpolation less model dependent (safer) Interpolation less model dependent (safer) than extrapolation, assuming minimal than extrapolation, assuming minimal smoothness of conditional expectation functionsmoothness of conditional expectation function
Interpolation = counterfactual vector Interpolation = counterfactual vector xx falls in falls in convex hull of data, convex hull of data, XX;; extrapolation = extrapolation = xx outside of convex hull of outside of convex hull of XX
Convex hull well-known, but computationally Convex hull well-known, but computationally difficult to identify; also hard to determine difficult to identify; also hard to determine membershipmembership
No existing implementations for high No existing implementations for high dimensional data common in social science dimensional data common in social science researchresearch

Convex HullsConvex Hulls
Source: http://www.ifor.math.ethz.ch/~fukuda/polyfaq/polyfaq.html
Source: Wikipedia

SolutionSolution Check whether or not Check whether or not xx can be expressed can be expressed
as convex combination of all points in as convex combination of all points in XX; ; bypass identification of hullbypass identification of hull
Done by checking if feasible solution to Done by checking if feasible solution to standard form linear programming standard form linear programming problem with degenerate objective problem with degenerate objective function existsfunction exists
Computationally efficient even for large Computationally efficient even for large nn and and kk; makes use of existing algorithms; makes use of existing algorithms

Gower’s DistanceGower’s Distance
Sometimes may want to make finer distinctionSometimes may want to make finer distinction Measure distance between each observation Measure distance between each observation
and counterfactual using Gower’s metricand counterfactual using Gower’s metric Interpretation of GInterpretation of G22 = distance between two = distance between two
points as percentage of distance across points as percentage of distance across XX Summarize Summarize nn values of G values of G22 for each for each
counterfactual by:counterfactual by:1.1. Plotting empirical CDFPlotting empirical CDF
2.2. Calculating percentage of observations “nearby” Calculating percentage of observations “nearby” counterfactual (e.g., Gcounterfactual (e.g., G22 less than geometric less than geometric variability of variability of XX))

Implementation: R Implementation: R package WhatIfpackage WhatIf

Example: UN Example: UN PeacekeepingPeacekeeping
Doyle and Sambanis (2000): 124 post-WWII Doyle and Sambanis (2000): 124 post-WWII civil wars; study contribution of UN civil wars; study contribution of UN peacekeeping operations to peacebuilding peacekeeping operations to peacebuilding successsuccess
Counterfactuals of interest: for civil wars with Counterfactuals of interest: for civil wars with UN involvement, how much success if UN had UN involvement, how much success if UN had not gotten involved? For civil wars without not gotten involved? For civil wars without UN involvement, how much success if UN had?UN involvement, how much success if UN had?
Construct counterfactual dataset from factual Construct counterfactual dataset from factual by replacing dummy UN involvement variable by replacing dummy UN involvement variable with 1-variable; other 10 covariates kept as iswith 1-variable; other 10 covariates kept as is
Analyze using WhatIfAnalyze using WhatIf

R : Copyright 2005, The R Foundation for Statistical ComputingVersion 2.2.1 (2005-12-20 r36812)ISBN 3-900051-07-0
R is free software and comes with ABSOLUTELY NO WARRANTY.You are welcome to redistribute it under certain conditions.Type 'license()' or 'licence()' for distribution details.
Natural language support but running in an English locale
R is a collaborative project with many contributors.Type 'contributors()' for more information and'citation()' on how to cite R or R packages in publications.
Type 'demo()' for some demos, 'help()' for on-line help, or'help.start()' for an HTML browser interface to help.Type 'q()' to quit R.

> library(WhatIf)######################################################### ## WhatIf (Version 1.4-2, built 2006-01-23)## Complete documentation available from http://gking.harvard.edu/whatif ## #######################################################> data(peacef)> data(peacecf)> my.result <- whatif(data = peacef, cfact = peacecf)Loading required package: lpSolve> summary(my.result)> plot(my.result, numcf = 1, type = “b”)

Summary of Counterfactual Inference Analysis
Call: whatif(data = peacef, cfact = peacecf)
Total Number of Counterfactuals: 122
Number of Counterfactuals in Convex Hull: 0
Average Percent 'Nearby': 0.01303413
Counterfactual in Convex Hull, True or False, and Percentage of ObservedData Points 'Nearby' Counterfactual: Counterfactual In Hull Percent Nearby 1 FALSE 0.008196721 2 FALSE 0.008196721 3 FALSE 0.008196721 4 FALSE 0.008196721 5 FALSE 0.008196721 6 FALSE 0.008196721 7 FALSE 0.008196721 8 FALSE 0.008196721 …


Results of AnalysisResults of Analysis
All 122 counterfactuals extrapolations All 122 counterfactuals extrapolations (outside of convex hull)(outside of convex hull)
Few counterfactuals near most Few counterfactuals near most observations (on average, only 1.3% of observations (on average, only 1.3% of observations “nearby” as defined by observations “nearby” as defined by geometric variability)geometric variability)
Data contain little information for Data contain little information for answering key causal question: forecasts answering key causal question: forecasts based more on model specification than based more on model specification than evidenceevidence

ConsequencesConsequences
New model specification New model specification incorporating additional incorporating additional interaction terminteraction term
Original and modified models Original and modified models make similar in-sample make similar in-sample predictionspredictions
Out-of-sample predictions for Out-of-sample predictions for counterfactuals extremely counterfactuals extremely divergentdivergent
Hence: counterfactual Hence: counterfactual inferences in fact sensitive to inferences in fact sensitive to model specificationmodel specification

ConclusionConclusion
Need to know extent to which data Need to know extent to which data as opposed to model drives as opposed to model drives conclusions conclusions
Use R to make new techniques like Use R to make new techniques like these for analyzing counterfactual these for analyzing counterfactual model dependency available to model dependency available to applied researchersapplied researchers