interpretation of arterial blood gases (abg) -...
TRANSCRIPT

29-3-2015 W Vincken - UZ Brussel - VUB 1
Interpretation ofArterial Blood Gases (ABG)
Prof. Dr. W. VinckenHead Respiratory Division
Universitair Ziekenhuis Brussel (UZ Brussel)
Vrije Universiteit Brussel (VUB)
29-3-2015 W Vincken - UZ Brussel - VUB 2
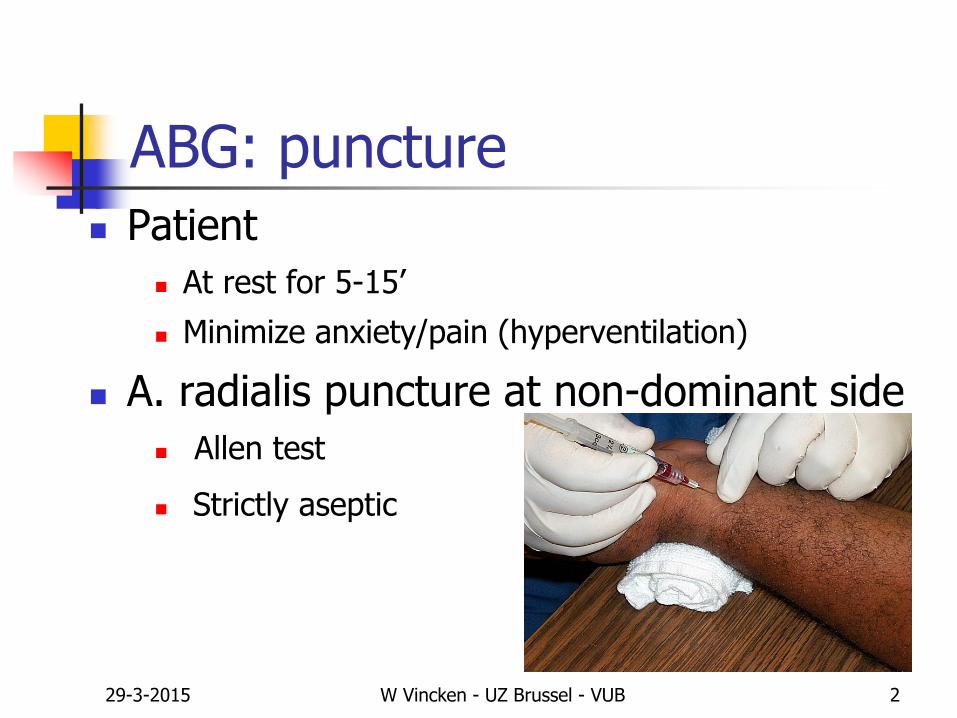
ABG: puncture
Patient
At rest for 5-15’
Minimize anxiety/pain (hyperventilation)
A. radialis puncture at non-dominant side
Allen test
Strictly aseptic
29-3-2015 W Vincken - UZ Brussel - VUB 3
ABG: puncture
Syringe
Glass > plastic (gas-permeable)
Polypropylene > polystyrol
Dry heparin
Max 5% of sample volume
Draw blood slowly up (avoid hemolysis)
29-3-2015 W Vincken - UZ Brussel - VUB 4
ABG: puncture
Remove air bubbles before mixing/cooling
Mix sample thoroughly turn 5 x up and down slowly
and roll horizontally for 5’’
Immediate transport (within 10’)
If not: Store at 0-4°C in icewater
Do not store directly on ice (hemolysis)
29-3-2015 W Vincken - UZ Brussel - VUB 5
Before interpretation of ABG
Make/take note of
FIO2: room air (0.21) or under O2 therapy
Body posture: sitting or supine
At rest or during exercise
29-3-2015 W Vincken - UZ Brussel - VUB 7
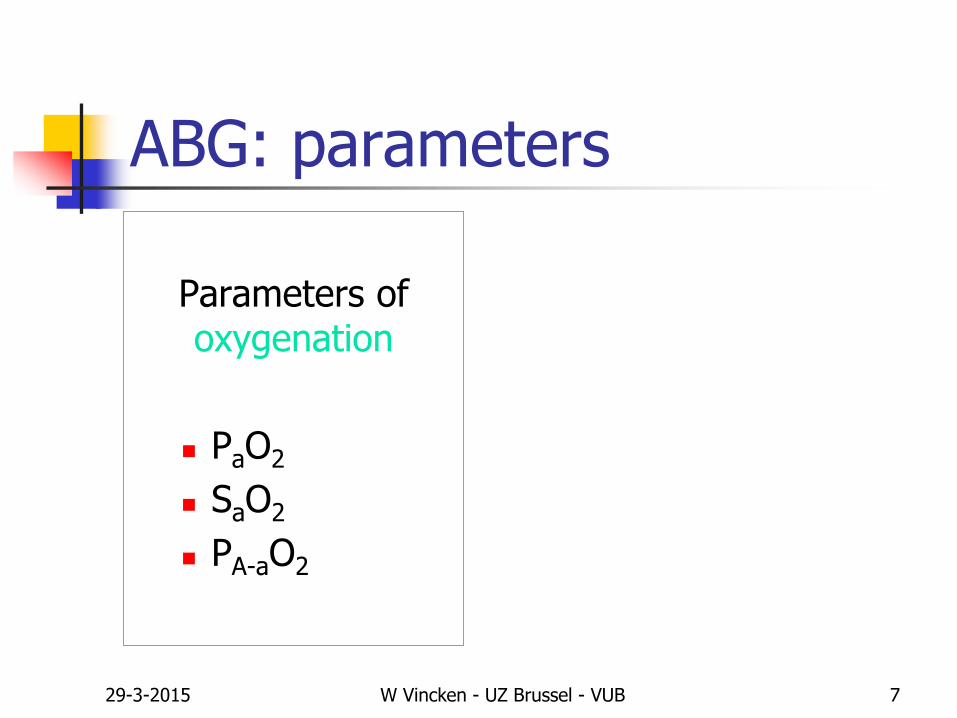
ABG: parameters
Parameters of oxygenation
PaO2
SaO2
PA-aO2
29-3-2015 W Vincken - UZ Brussel - VUB 8
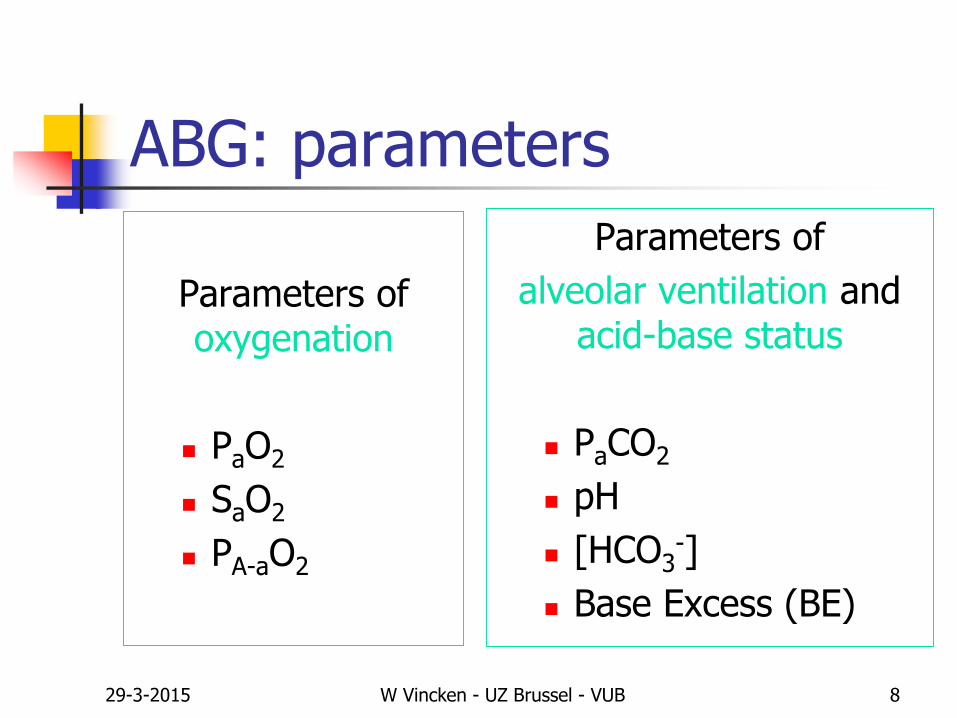
ABG: parameters
Parameters of oxygenation
PaO2
SaO2
PA-aO2
Parameters of
alveolar ventilation and acid-base status
PaCO2
pH
[HCO3-]
Base Excess (BE)
29-3-2015 W Vincken - UZ Brussel - VUB 9
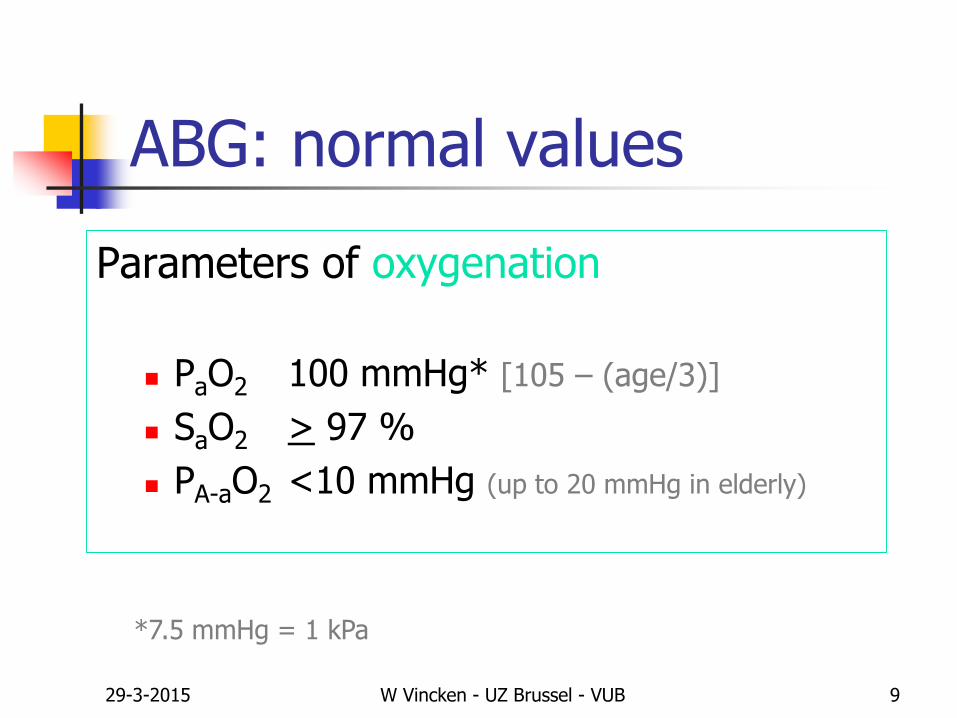
ABG: normal values
Parameters of oxygenation
PaO2 100 mmHg* [105 – (age/3)]
SaO2 > 97 %
PA-aO2 <10 mmHg (up to 20 mmHg in elderly)
*7.5 mmHg = 1 kPa
29-3-2015 W Vincken - UZ Brussel - VUB 10
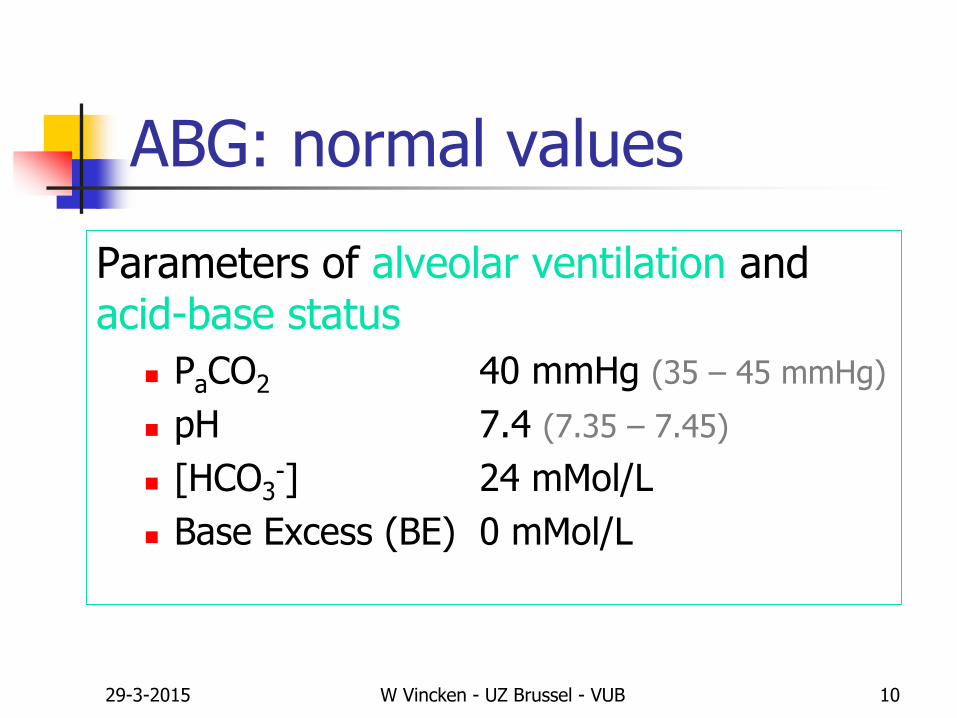
ABG: normal values
Parameters of alveolar ventilation and acid-base status
PaCO2 40 mmHg (35 – 45 mmHg)
pH 7.4 (7.35 – 7.45)
[HCO3-] 24 mMol/L
Base Excess (BE) 0 mMol/L

29-3-2015 W Vincken - UZ Brussel - VUB 11
Abnormal ABG: hyperoxemia
High PaO2
No pathophysiological substrate
(except mild hyperoxemia in extreme alveolar hyperventilation)
Usually indicates
sampling error (air in blood sample) or
high FIO2 (oxygen administration)
29-3-2015 W Vincken - UZ Brussel - VUB 12
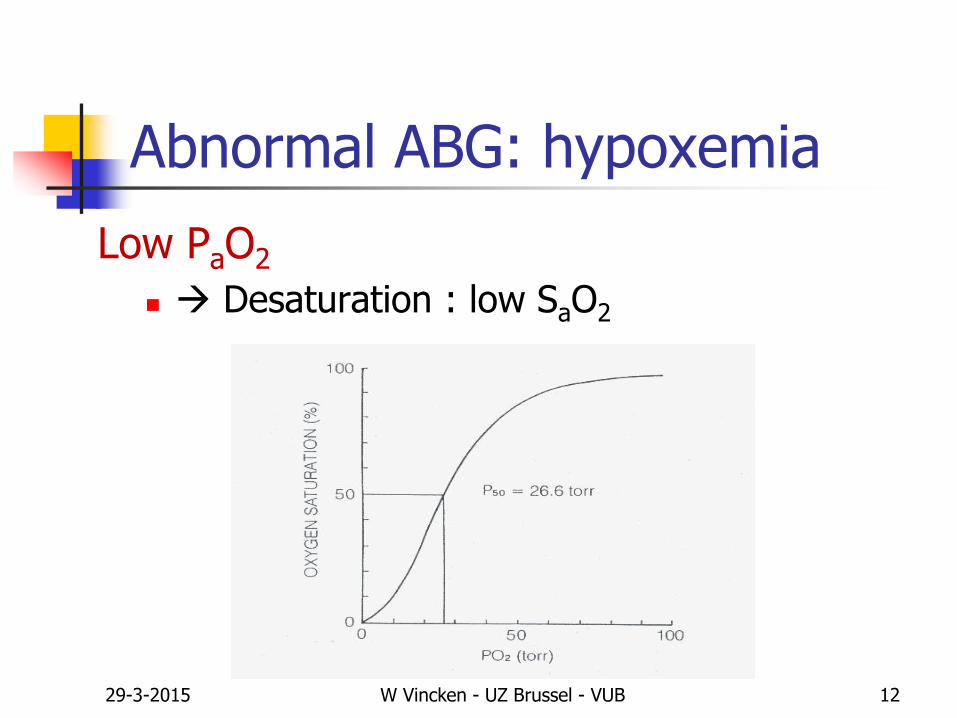
Abnormal ABG: hypoxemia
Low PaO2
Desaturation : low SaO2
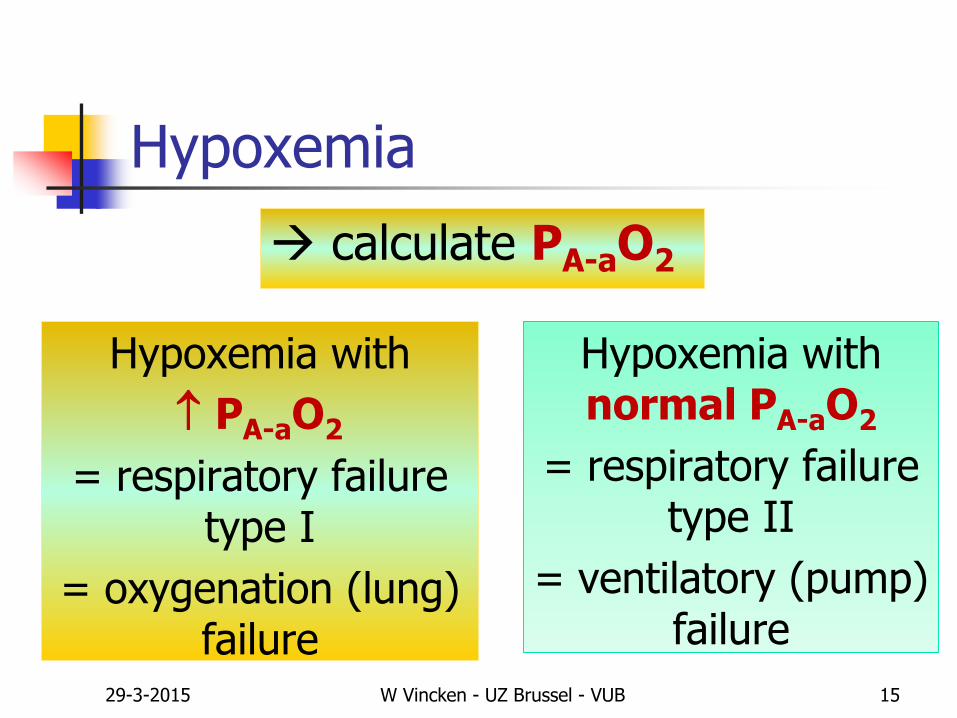
Hypoxemia
calculate PA-aO2
Hypoxemia with
PA-aO2
= respiratory failure type I
= oxygenation (lung) failure
Hypoxemia with normal PA-aO2
= respiratory failure type II
= ventilatory (pump) failure
29-3-2015 W Vincken - UZ Brussel - VUB 15
29-3-2015 W Vincken - UZ Brussel - VUB 17
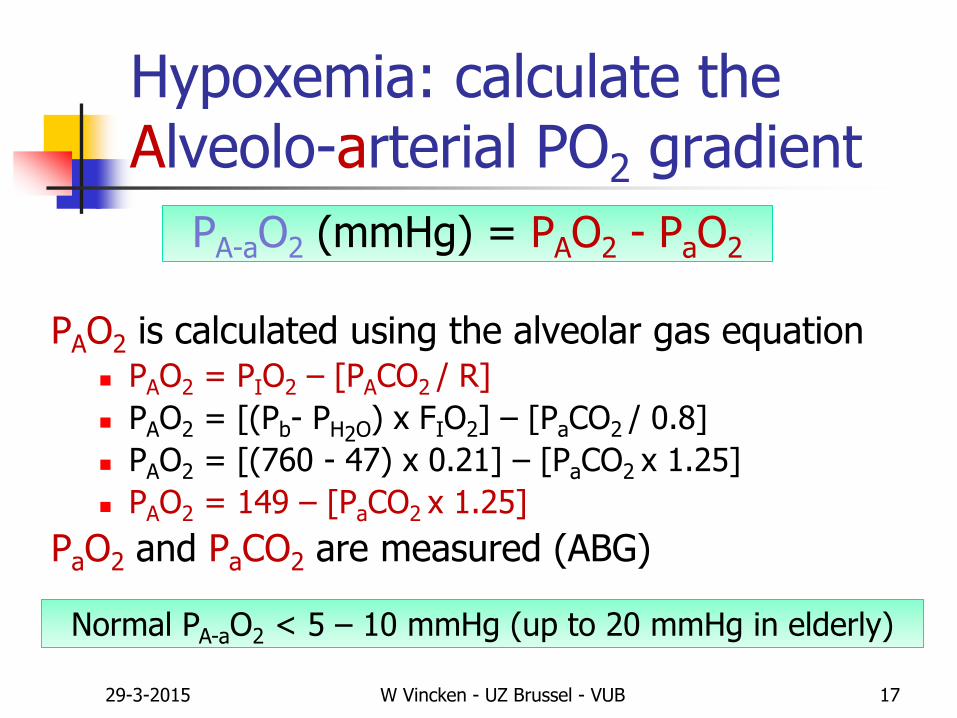
Hypoxemia: calculate theAlveolo-arterial PO2 gradient
PAO2 is calculated using the alveolar gas equation PAO2 = PIO2 – [PACO2 / R]
PAO2 = [(Pb- PH2O) x FIO2] – [PaCO2 / 0.8]
PAO2 = [(760 - 47) x 0.21] – [PaCO2 x 1.25]
PAO2 = 149 – [PaCO2 x 1.25]
PaO2 and PaCO2 are measured (ABG)
PA-aO2 (mmHg) = PAO2 - PaO2
Normal PA-aO2 < 5 – 10 mmHg (up to 20 mmHg in elderly)
29-3-2015 W Vincken - UZ Brussel - VUB 18
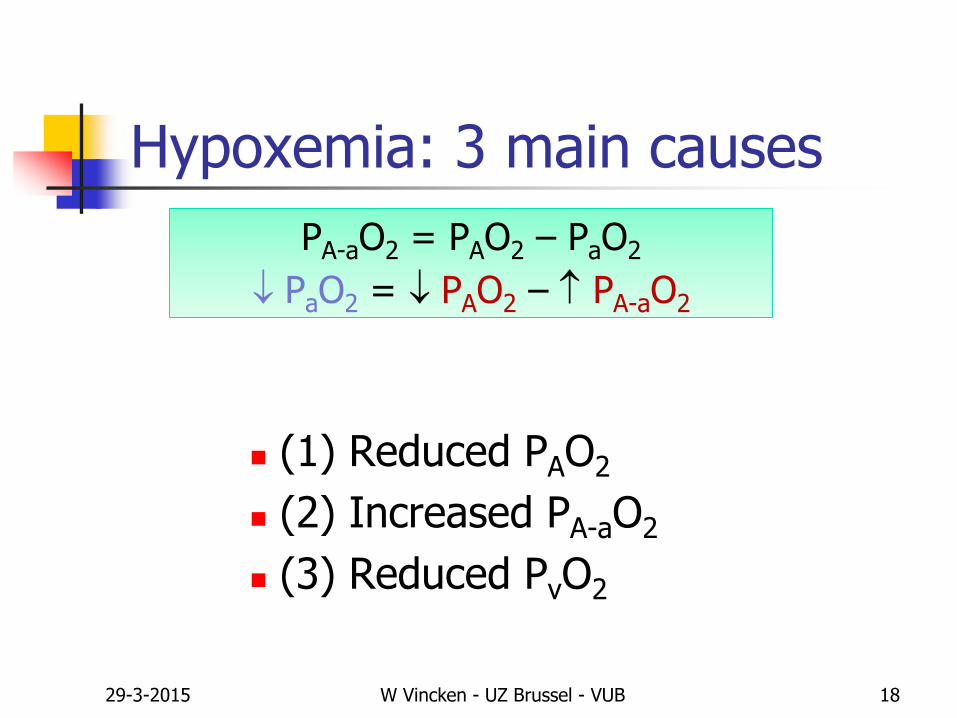
Hypoxemia: 3 main causes
(1) Reduced PAO2
(2) Increased PA-aO2
(3) Reduced PvO2
PA-aO2 = PAO2 – PaO2
PaO2 = PAO2 – PA-aO2
29-3-2015 W Vincken - UZ Brussel - VUB 19
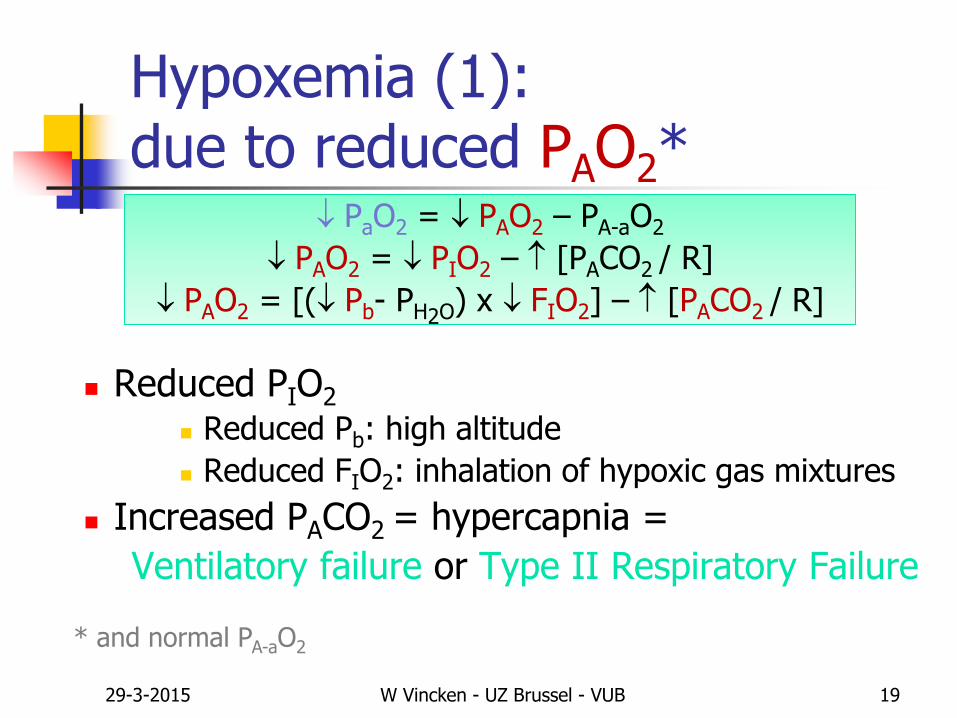
Hypoxemia (1):due to reduced PAO2*
Reduced PIO2
Reduced Pb: high altitude
Reduced FIO2: inhalation of hypoxic gas mixtures
Increased PACO2 = hypercapnia =
Ventilatory failure or Type II Respiratory Failure
PaO2 = PAO2 – PA-aO2
PAO2 = PIO2 – [PACO2 / R]
PAO2 = [( Pb- PH2O) x FIO2] – [PACO2 / R]
* and normal PA-aO2
29-3-2015 W Vincken - UZ Brussel - VUB 20
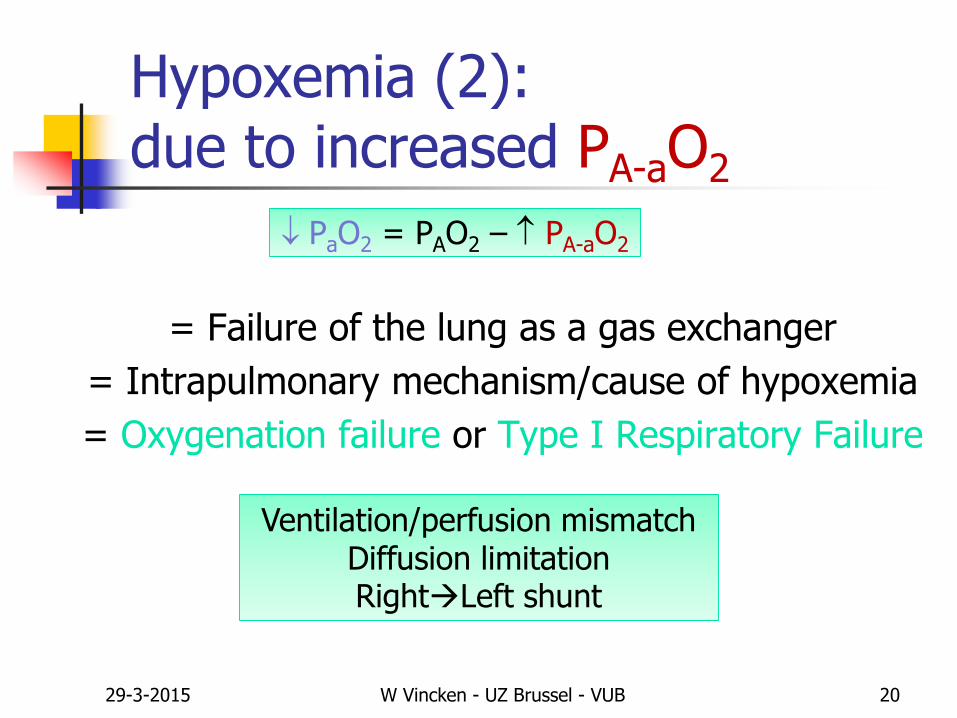
Hypoxemia (2):due to increased PA-aO2
= Failure of the lung as a gas exchanger
= Intrapulmonary mechanism/cause of hypoxemia
= Oxygenation failure or Type I Respiratory Failure
PaO2 = PAO2 – PA-aO2
Ventilation/perfusion mismatchDiffusion limitationRightLeft shunt
29-3-2015 W Vincken - UZ Brussel - VUB 21
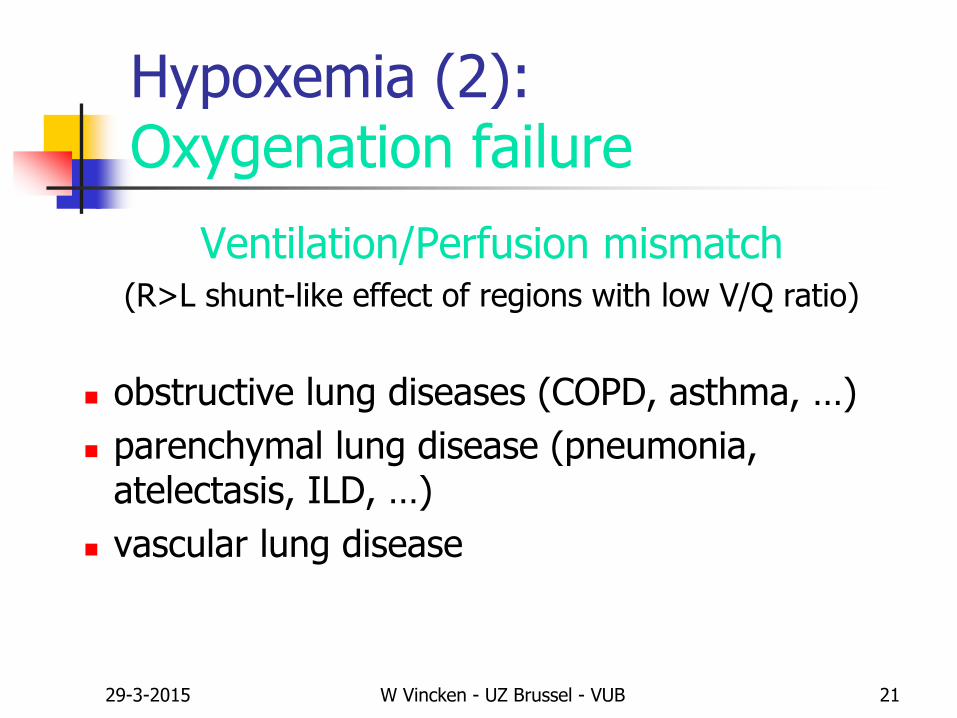
Hypoxemia (2):Oxygenation failure
Ventilation/Perfusion mismatch(R>L shunt-like effect of regions with low V/Q ratio)
obstructive lung diseases (COPD, asthma, …)
parenchymal lung disease (pneumonia, atelectasis, ILD, …)
vascular lung disease

29-3-2015 W Vincken - UZ Brussel - VUB 22
Diffusion limitation
(with exercise and reduced transit time of RBCs in pulmonary capillaries)
increased thickness of alveolocapillary membrane Interstitial lung diseases
reduced surface area of alveolocapillary membrane Emphysema
Hypoxemia (2):Oxygenation failure

29-3-2015 W Vincken - UZ Brussel - VUB 23
Anatomic RL shunt(leads to refractory hypoxemia)
intracardiac (ASD, VSD, …)
intrapulmonary (A-V malformations, fistulas)
Hypoxemia (2):Oxygenation failure
29-3-2015 W Vincken - UZ Brussel - VUB 29
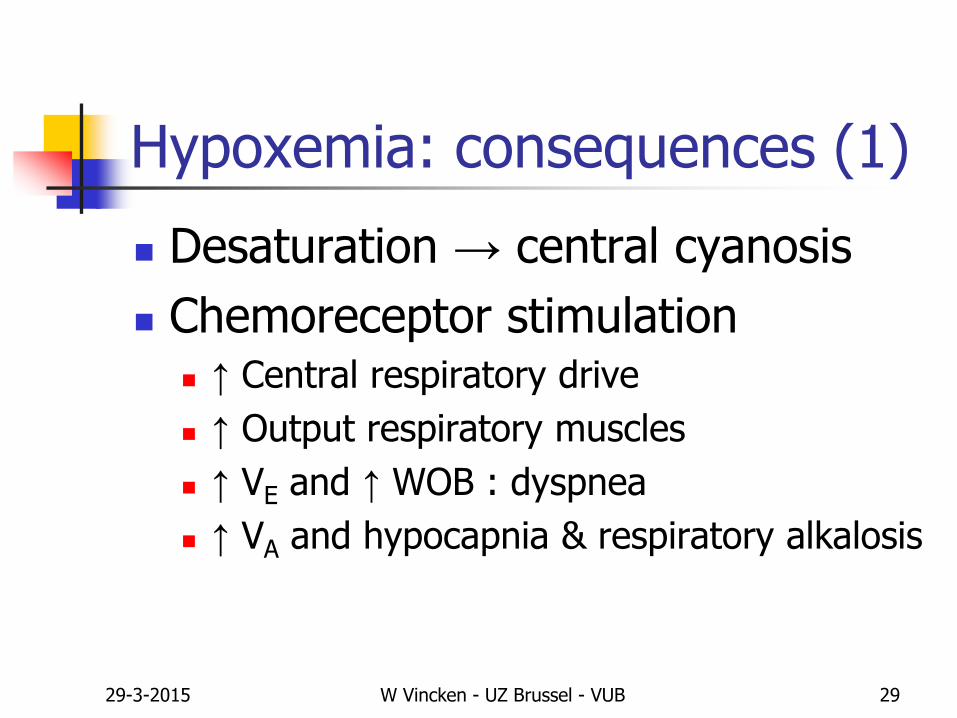
Hypoxemia: consequences (1)
Desaturation → central cyanosis
Chemoreceptor stimulation ↑ Central respiratory drive
↑ Output respiratory muscles
↑ VE and ↑ WOB : dyspnea
↑ VA and hypocapnia & respiratory alkalosis

29-3-2015 W Vincken - UZ Brussel - VUB 30
Hypoxemia: consequences (2)
Tissue hypoxia organ disfunction: CNS, CV, kidneys
anaerobic metabolism → lactic acidosis
Pulmonary vasoconstriction pulmonary hypertension
cor pulmonale & right heart failure
Increased renal erythropoetin production secondary polycythemia
29-3-2015 W Vincken - UZ Brussel - VUB 31
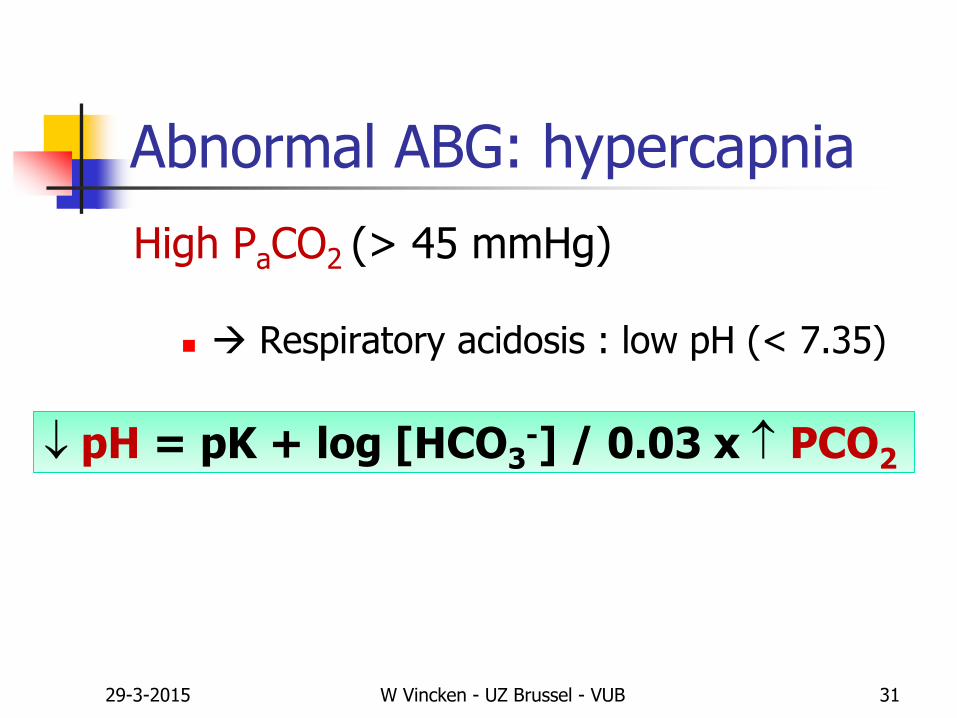
Abnormal ABG: hypercapnia
High PaCO2 (> 45 mmHg)
Respiratory acidosis : low pH (< 7.35)
pH = pK + log [HCO3-] / 0.03 x PCO2
29-3-2015 W Vincken - UZ Brussel - VUB 35
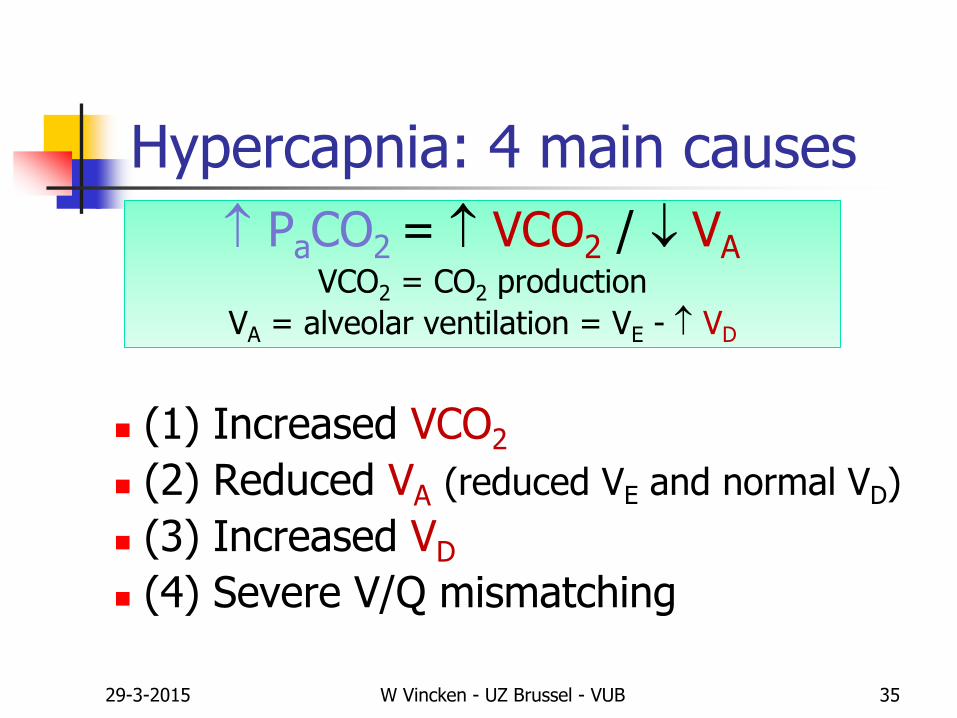
Hypercapnia: 4 main causes
(1) Increased VCO2
(2) Reduced VA (reduced VE and normal VD)
(3) Increased VD
(4) Severe V/Q mismatching
PaCO2 = VCO2 / VAVCO2 = CO2 production
VA = alveolar ventilation = VE - VD
29-3-2015 W Vincken - UZ Brussel - VUB 36
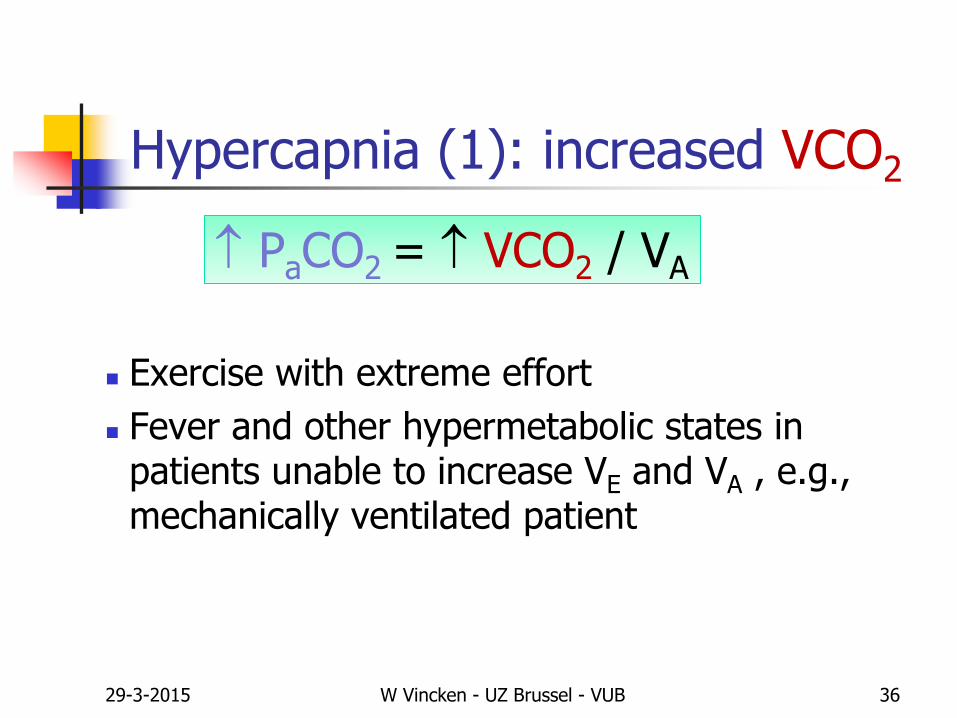
Hypercapnia (1): increased VCO2
Exercise with extreme effort
Fever and other hypermetabolic states in patients unable to increase VE and VA , e.g., mechanically ventilated patient
PaCO2 = VCO2 / VA

29-3-2015 W Vincken - UZ Brussel - VUB 37
Hypercapnia (2): reduced VA
Reduced VA = alveolar hypoventilation =Ventilatory failure or Type II respiratory failure
Any hypoxemia is secondary to hypercapnia,
i.e., the PA-aO2 is normal
Extrapulmonary mechanism/cause of hypoxemia:
Severe UAO
Failure of the ventilatory pump
PaCO2 = VCO2 / VA
29-3-2015 W Vincken - UZ Brussel - VUB 39
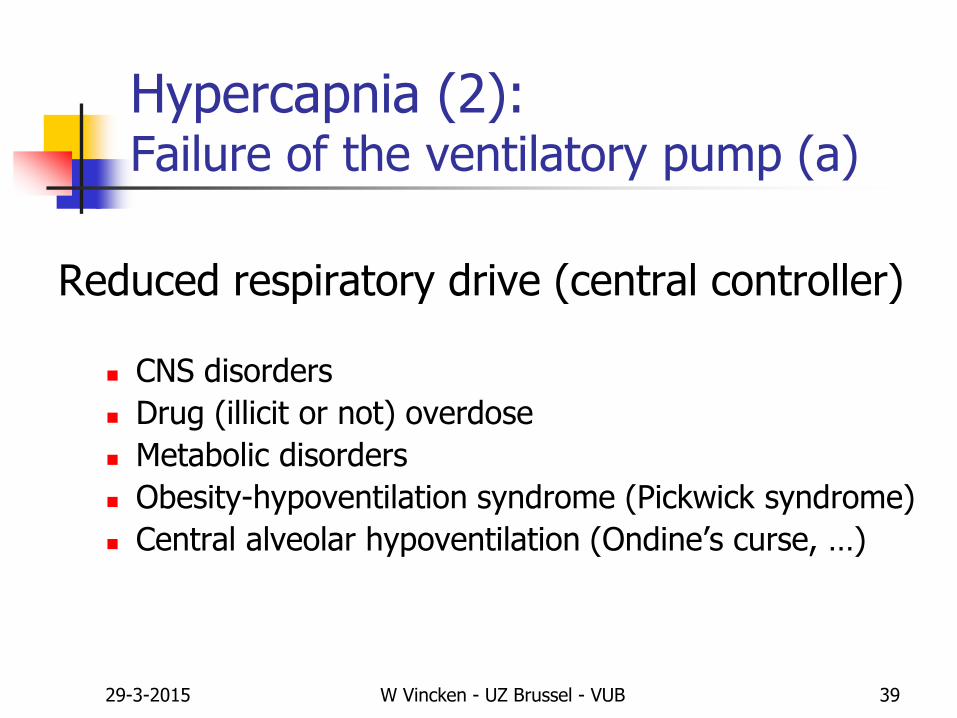
Reduced respiratory drive (central controller)
CNS disorders
Drug (illicit or not) overdose
Metabolic disorders
Obesity-hypoventilation syndrome (Pickwick syndrome)
Central alveolar hypoventilation (Ondine’s curse, …)
Hypercapnia (2):Failure of the ventilatory pump (a)

29-3-2015 W Vincken - UZ Brussel - VUB 40
Dysfunction of respiratory neuromuscular apparatus
Motor neurons (ALS, poliomyelitis, …)
Peripheral nerve (Guillain-Barré, phrenic neuropathy, …)
Myoneural junction (myastenia, drugs, …)
Muscle (myopathy, metabolic disorders, malnutrition, …)
Hypercapnia (2):Failure of the ventilatory pump (b)
29-3-2015 W Vincken - UZ Brussel - VUB 41
Chest wall disorders including severe obesity
Kyphoscoliosis
TBC sequellae incl. thoracoplasty
Severe obesity
Hypercapnia (2):Failure of the ventilatory pump (c)
29-3-2015 W Vincken - UZ Brussel - VUB 44
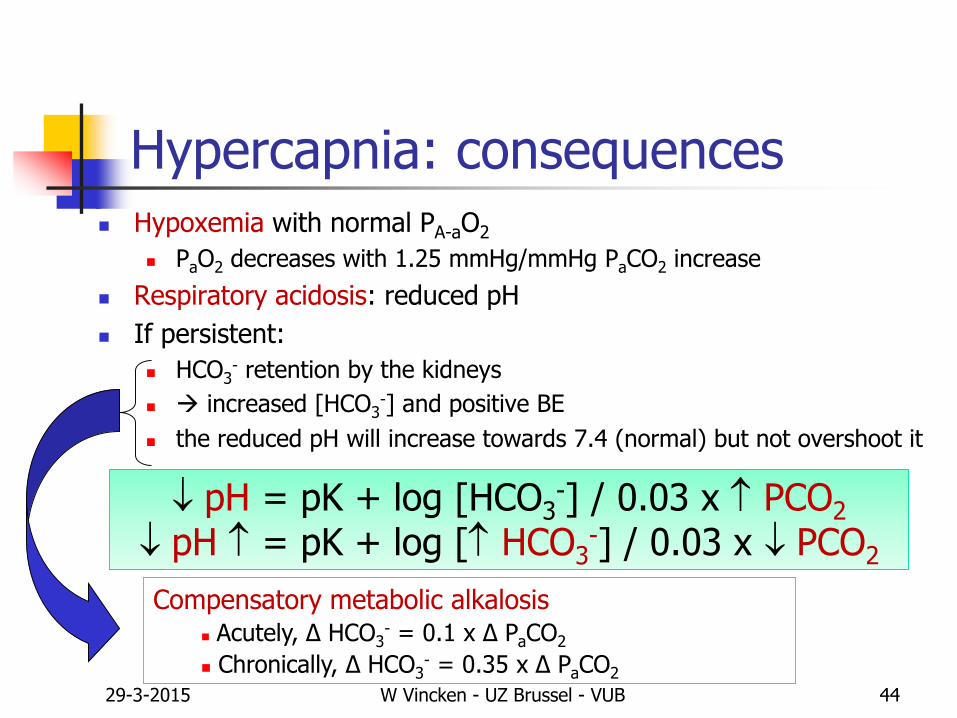
Hypercapnia: consequences Hypoxemia with normal PA-aO2
PaO2 decreases with 1.25 mmHg/mmHg PaCO2 increase
Respiratory acidosis: reduced pH
If persistent:
HCO3- retention by the kidneys
increased [HCO3-] and positive BE
the reduced pH will increase towards 7.4 (normal) but not overshoot it
Compensatory metabolic alkalosis Acutely, Δ HCO3
- = 0.1 x Δ PaCO2
Chronically, Δ HCO3- = 0.35 x Δ PaCO2
pH = pK + log [HCO3-] / 0.03 x PCO2
pH = pK + log [ HCO3-] / 0.03 x PCO2
29-3-2015 W Vincken - UZ Brussel - VUB 45
Clinical signs of hypercapnia
CNS: cerebral vasodilatation increased cerebral Q
intracranial hypertension
headache, papilledema
asterixis
lethargy, confusion progressing to coma ‘carbonarcosis’
Peripheral vasodilatation full bounding pulses with
warm, cherry-red skin
29-3-2015 W Vincken - UZ Brussel - VUB 47
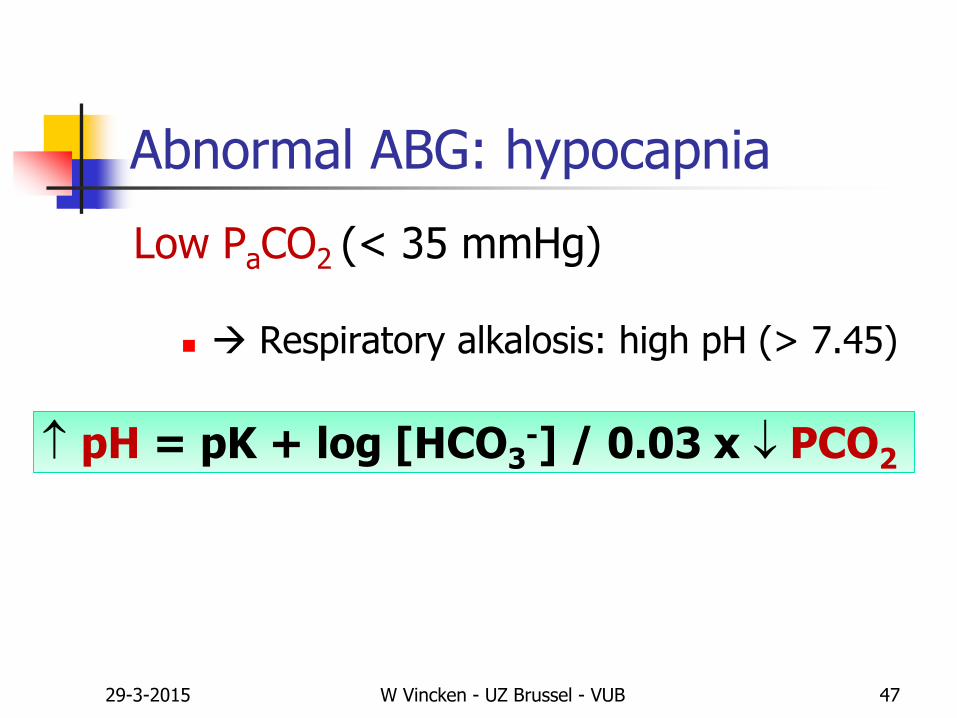
Abnormal ABG: hypocapnia
Low PaCO2 (< 35 mmHg)
Respiratory alkalosis: high pH (> 7.45)
pH = pK + log [HCO3-] / 0.03 x PCO2
29-3-2015 W Vincken - UZ Brussel - VUB 48
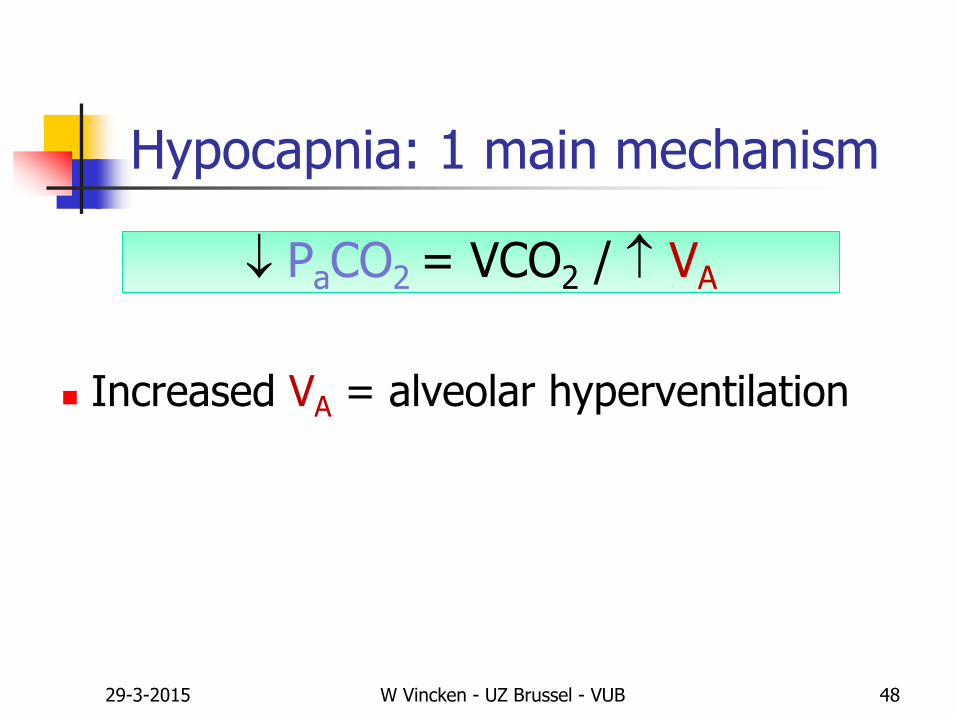
Hypocapnia: 1 main mechanism
Increased VA = alveolar hyperventilation
PaCO2 = VCO2 / VA
29-3-2015 W Vincken - UZ Brussel - VUB 49
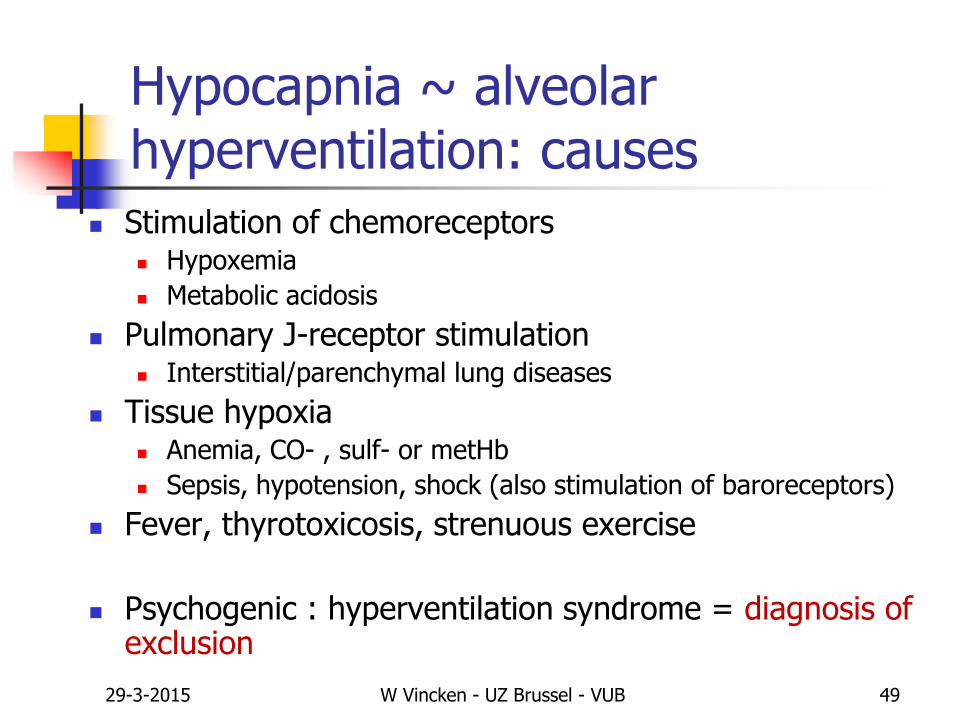
Hypocapnia ~ alveolar hyperventilation: causes
Stimulation of chemoreceptors Hypoxemia
Metabolic acidosis
Pulmonary J-receptor stimulation Interstitial/parenchymal lung diseases
Tissue hypoxia Anemia, CO- , sulf- or metHb
Sepsis, hypotension, shock (also stimulation of baroreceptors)
Fever, thyrotoxicosis, strenuous exercise
Psychogenic : hyperventilation syndrome = diagnosis of exclusion

29-3-2015 W Vincken - UZ Brussel - VUB 50
Hypocapnia: consequences
Respiratory alkalosis: increased pH
If persistent: HCO3
- excretion by the kidneys
reduced [HCO3-] and negative BE (= base deficit)
increased pH will decrease towards (but not below) 7.4
Compensatory metabolic acidosis Acutely, Δ HCO3
- = 0.2 x Δ PaCO2
Chronically, Δ HCO3- = 0.5 x Δ PaCO2
pH = pK + log [HCO3-] / 0.03 x PCO2
pH = pK + log [ HCO3-] / 0.03 x PCO2
29-3-2015 W Vincken - UZ Brussel - VUB 51
Abnormal ABG: acid-base disorders
Acidosis: low pH
Respiratory
Metabolic
Alkalosis: high pH
Respiratory
Metabolic
29-3-2015 W Vincken - UZ Brussel - VUB 52
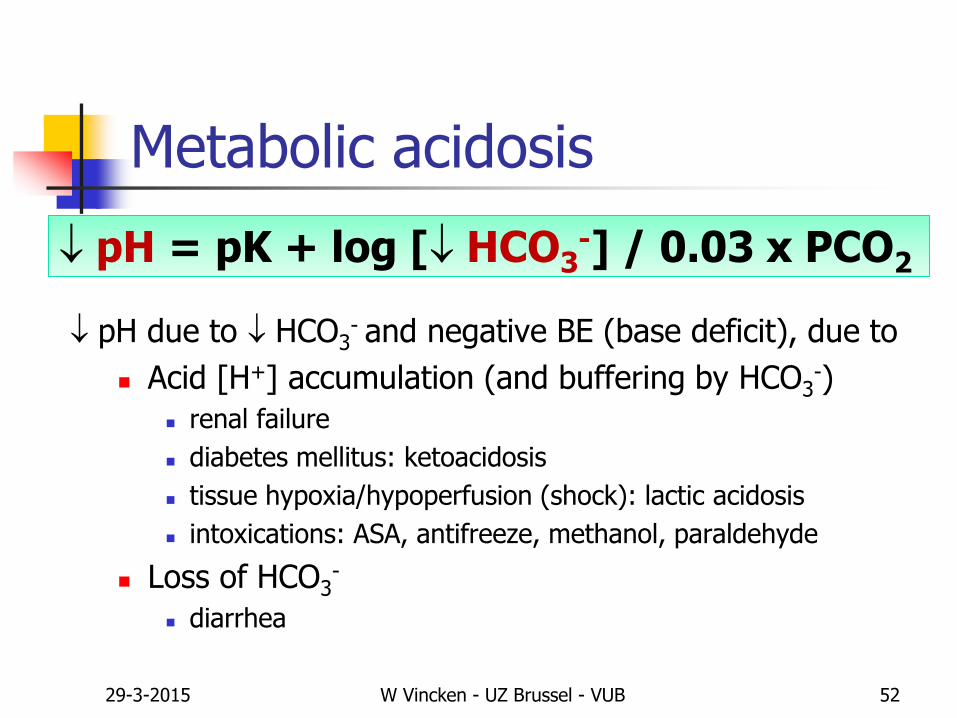
Metabolic acidosis
pH due to HCO3- and negative BE (base deficit), due to
Acid [H+] accumulation (and buffering by HCO3-)
renal failure
diabetes mellitus: ketoacidosis
tissue hypoxia/hypoperfusion (shock): lactic acidosis
intoxications: ASA, antifreeze, methanol, paraldehyde
Loss of HCO3-
diarrhea
pH = pK + log [ HCO3-] / 0.03 x PCO2
29-3-2015 W Vincken - UZ Brussel - VUB 53
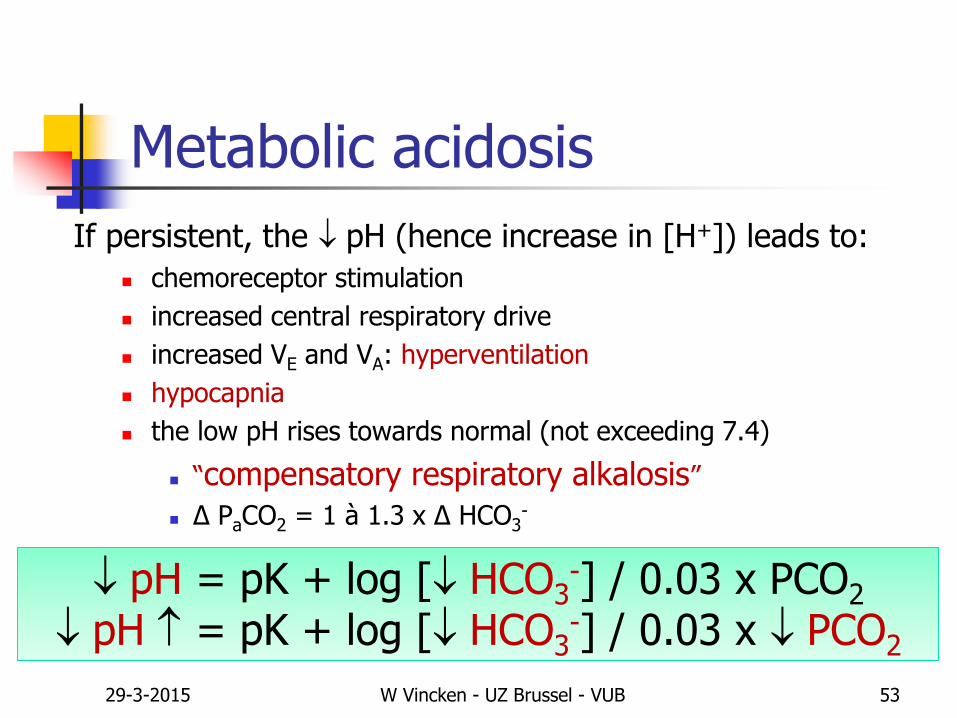
Metabolic acidosis
If persistent, the pH (hence increase in [H+]) leads to:
chemoreceptor stimulation
increased central respiratory drive
increased VE and VA: hyperventilation
hypocapnia
the low pH rises towards normal (not exceeding 7.4)
“compensatory respiratory alkalosis”
Δ PaCO2 = 1 à 1.3 x Δ HCO3-
pH = pK + log [ HCO3-] / 0.03 x PCO2
pH = pK + log [ HCO3-] / 0.03 x PCO2
29-3-2015 W Vincken - UZ Brussel - VUB 54
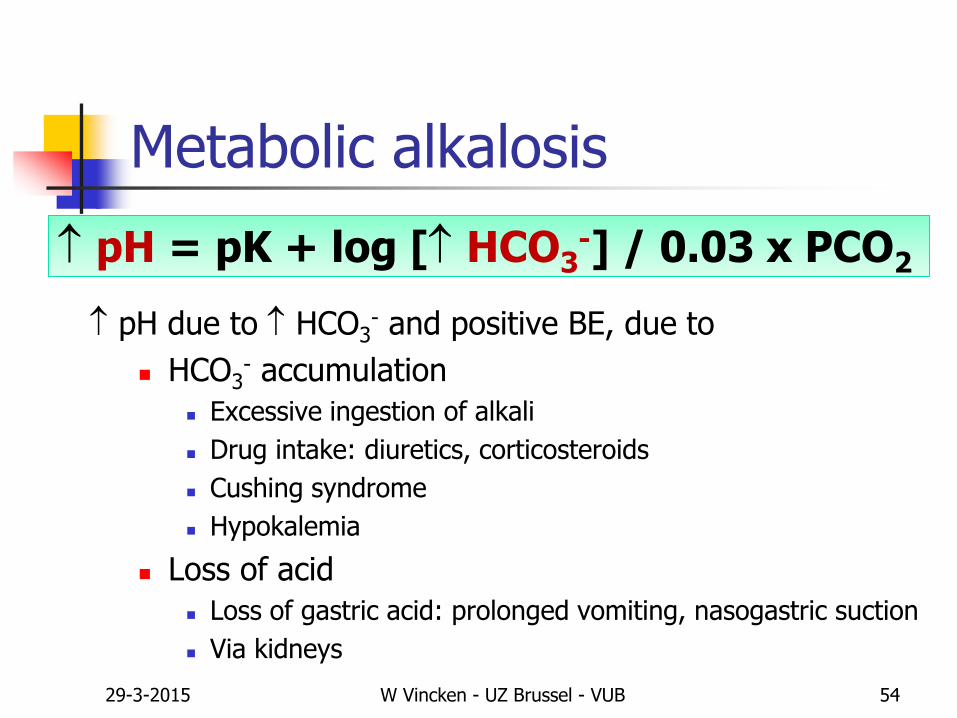
Metabolic alkalosis
pH due to HCO3- and positive BE, due to
HCO3- accumulation
Excessive ingestion of alkali
Drug intake: diuretics, corticosteroids
Cushing syndrome
Hypokalemia
Loss of acid
Loss of gastric acid: prolonged vomiting, nasogastric suction
Via kidneys
pH = pK + log [ HCO3-] / 0.03 x PCO2

29-3-2015 W Vincken - UZ Brussel - VUB 55
Metabolic alkalosis
If persistent, the pH (hence reduction in [H+]) leads to:
reduced chemoreceptor stimulation
reduced central respiratory drive
reduced VE and VA: hypoventilation
hypercapnia
the increased pH will decrease towards normal (but not below 7.4)
“compensatory respiratory acidosis”
Δ PaCO2 = 0.6 x Δ HCO3-
pH = pK + log [ HCO3-] / 0.03 x PCO2
pH = pK + log [ HCO3-] / 0.03 x PCO2
29-3-2015 W Vincken - UZ Brussel - VUB 56
Arterial Blood Gases : main use
Note sampling conditions
Careful sampling and handling
Detection of Respiratory Failure
Detection of Acid-Base disturbances
29-3-2015 W Vincken - UZ Brussel - VUB 57
Interpretation of ABG
Oxygenation
Look at PaO2 and SaO2
Calculate PA-aO2
Alveolar ventilation
Look at PaCO2
Acid-Base status
Look at pH, HCO3- and BE

29-3-2015 W Vincken - UZ Brussel - VUB 58
Thank you for listeningHope you learned something,
or at least enjoyed it
Prof. Dr. W. Vincken
Head Respiratory Division
UZ Brussel, VUB
29-3-2015 W Vincken - UZ Brussel - VUB 59
Interpretation of ABG
10 examples
29-3-2015 W Vincken - UZ Brussel - VUB 60
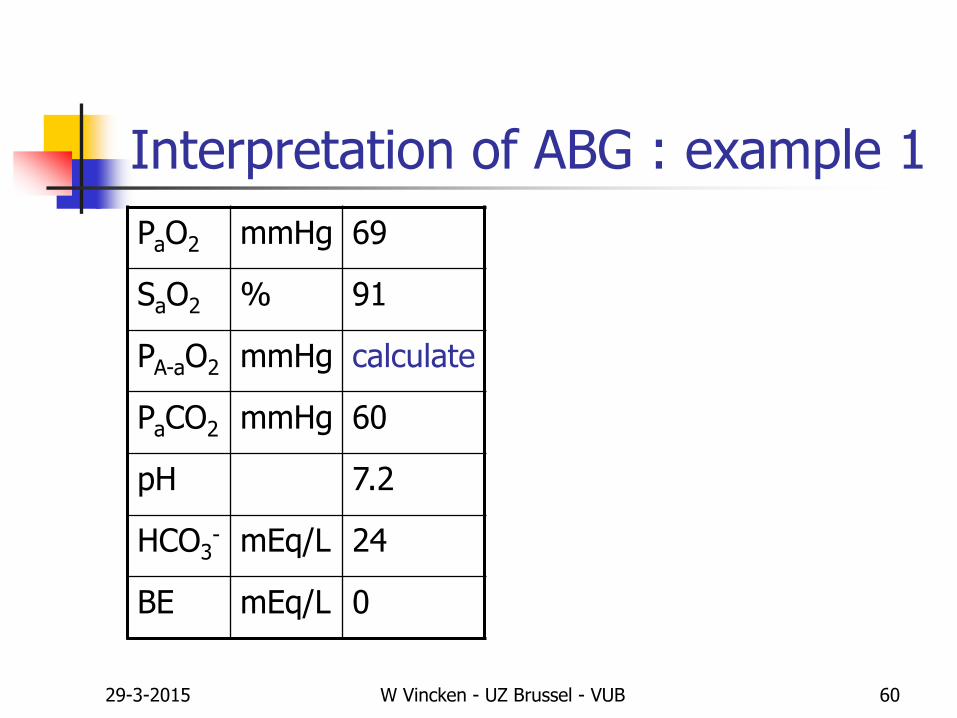
Interpretation of ABG : example 1
PaO2 mmHg 69
SaO2 % 91
PA-aO2 mmHg calculate
PaCO2 mmHg 60
pH 7.2
HCO3- mEq/L 24
BE mEq/L 0
29-3-2015 W Vincken - UZ Brussel - VUB 61
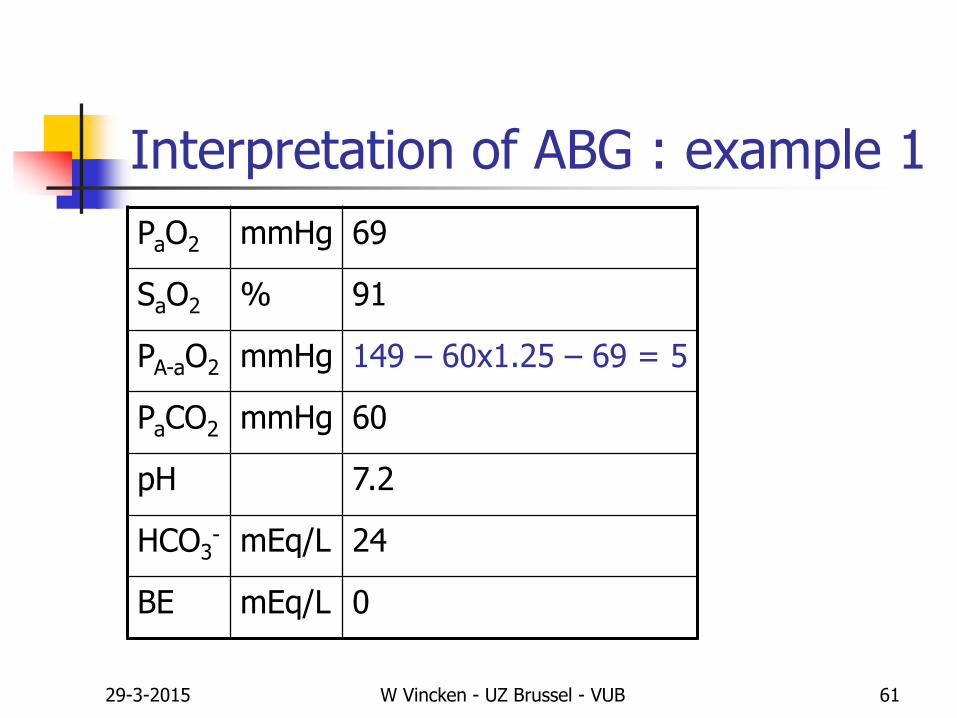
Interpretation of ABG : example 1
PaO2 mmHg 69
SaO2 % 91
PA-aO2 mmHg 149 – 60x1.25 – 69 = 5
PaCO2 mmHg 60
pH 7.2
HCO3- mEq/L 24
BE mEq/L 0

29-3-2015 W Vincken - UZ Brussel - VUB 62
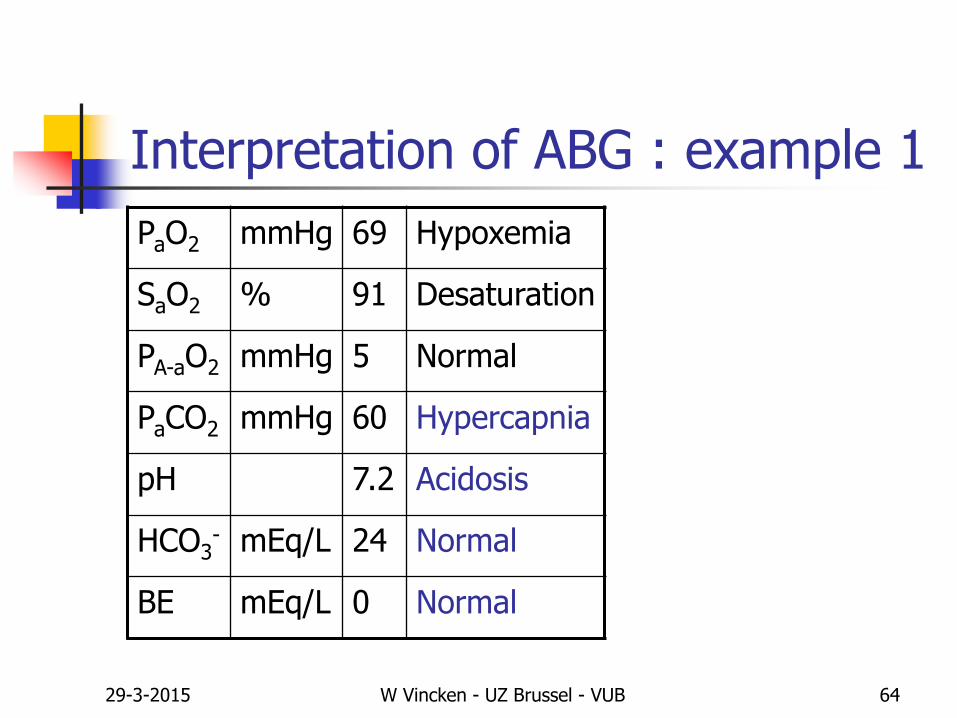
Interpretation of ABG : example 1
PaO2 mmHg 69 Hypoxemia
SaO2 % 91 Desaturation
PA-aO2 mmHg 5 Normal
PaCO2 mmHg 60
pH 7.2
HCO3- mEq/L 24
BE mEq/L 0
29-3-2015 W Vincken - UZ Brussel - VUB 63
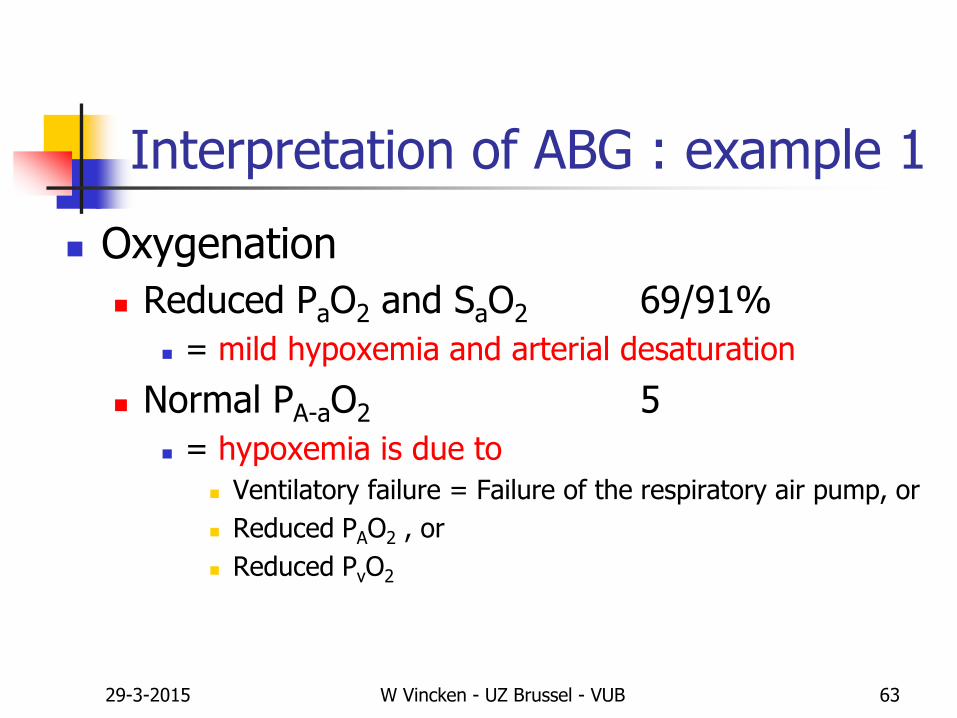
Interpretation of ABG : example 1
Oxygenation
Reduced PaO2 and SaO2 69/91%
= mild hypoxemia and arterial desaturation
Normal PA-aO2 5
= hypoxemia is due to
Ventilatory failure = Failure of the respiratory air pump, or
Reduced PAO2 , or
Reduced PvO2
29-3-2015 W Vincken - UZ Brussel - VUB 64
Interpretation of ABG : example 1
PaO2 mmHg 69 Hypoxemia
SaO2 % 91 Desaturation
PA-aO2 mmHg 5 Normal
PaCO2 mmHg 60 Hypercapnia
pH 7.2 Acidosis
HCO3- mEq/L 24 Normal
BE mEq/L 0 Normal
29-3-2015 W Vincken - UZ Brussel - VUB 65
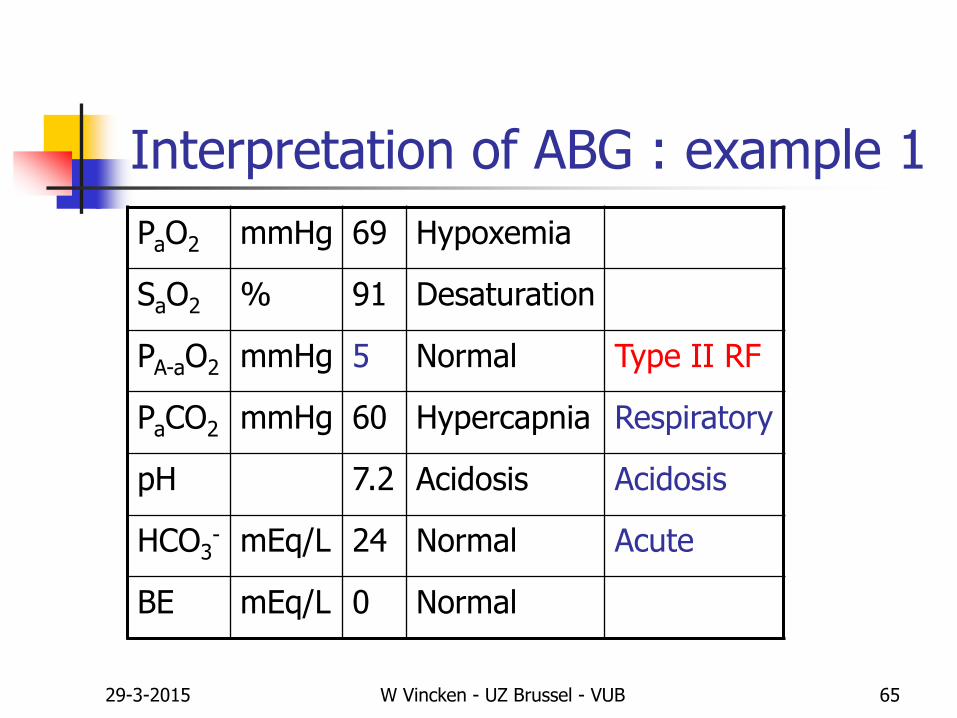
Interpretation of ABG : example 1
PaO2 mmHg 69 Hypoxemia
SaO2 % 91 Desaturation
PA-aO2 mmHg 5 Normal Type II RF
PaCO2 mmHg 60 Hypercapnia Respiratory
pH 7.2 Acidosis Acidosis
HCO3- mEq/L 24 Normal Acute
BE mEq/L 0 Normal

29-3-2015 W Vincken - UZ Brussel - VUB 66
Interpretation of ABG : example 2
PaO2 mmHg 69
SaO2 % 91
PA-aO2 mmHg calculate
PaCO2 mmHg 60
pH 7.37
HCO3- mEq/L 34
BE mEq/L + 10

29-3-2015 W Vincken - UZ Brussel - VUB 67
Interpretation of ABG : example 2
PaO2 mmHg 69
SaO2 % 91
PA-aO2 mmHg 149 – 60x1.25 – 69 = 5
PaCO2 mmHg 60
pH 7.37
HCO3- mEq/L 34
BE mEq/L + 10
29-3-2015 W Vincken - UZ Brussel - VUB 68
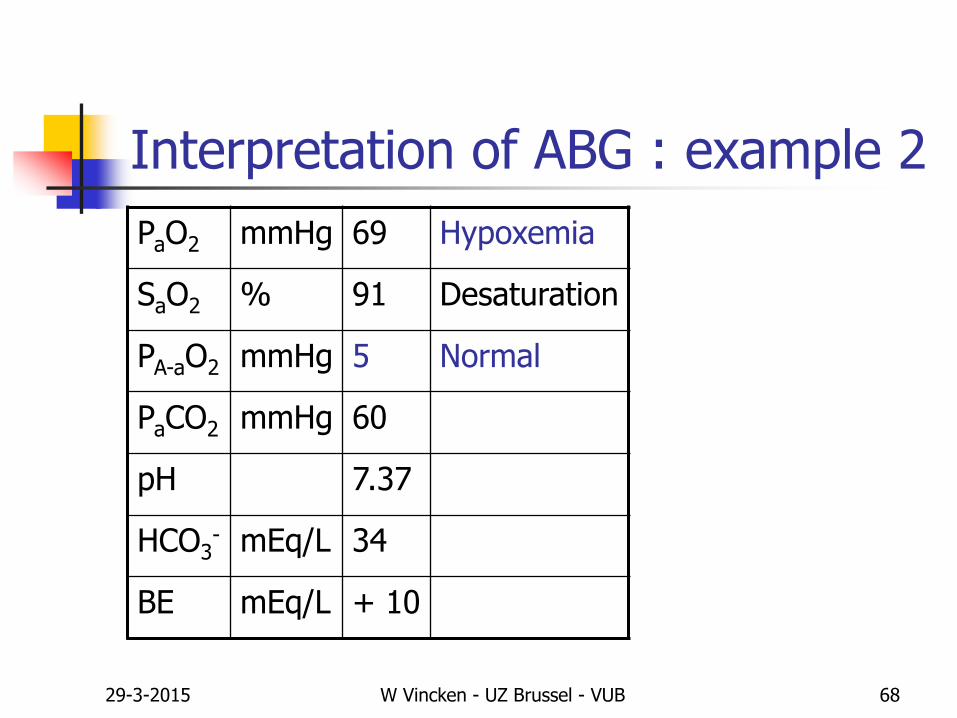
Interpretation of ABG : example 2
PaO2 mmHg 69 Hypoxemia
SaO2 % 91 Desaturation
PA-aO2 mmHg 5 Normal
PaCO2 mmHg 60
pH 7.37
HCO3- mEq/L 34
BE mEq/L + 10
29-3-2015 W Vincken - UZ Brussel - VUB 69
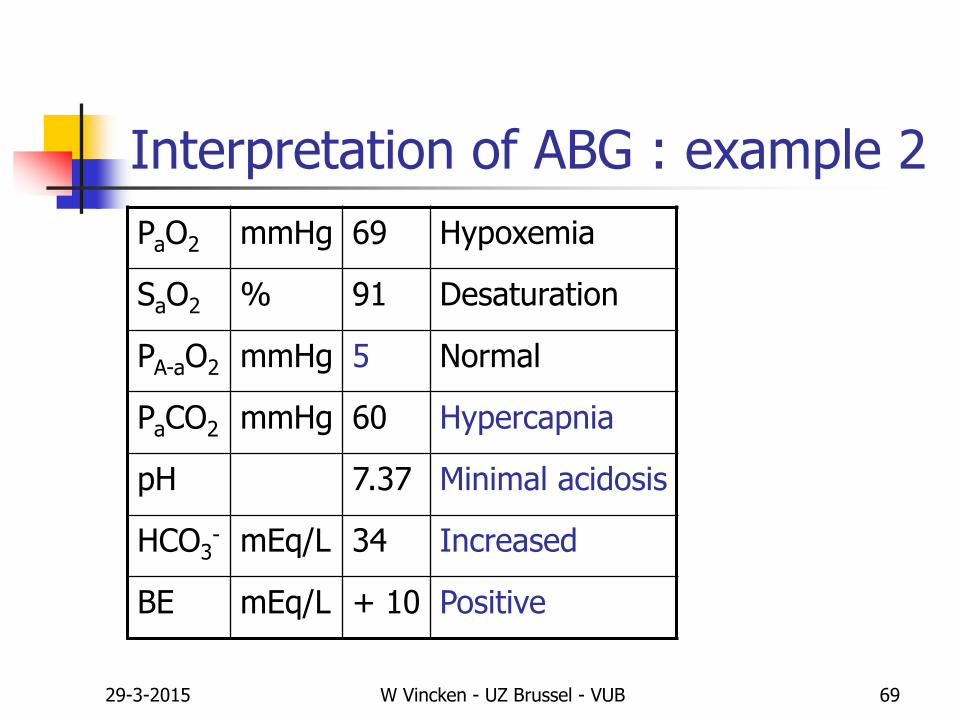
Interpretation of ABG : example 2
PaO2 mmHg 69 Hypoxemia
SaO2 % 91 Desaturation
PA-aO2 mmHg 5 Normal
PaCO2 mmHg 60 Hypercapnia
pH 7.37 Minimal acidosis
HCO3- mEq/L 34 Increased
BE mEq/L + 10 Positive
29-3-2015 W Vincken - UZ Brussel - VUB 70
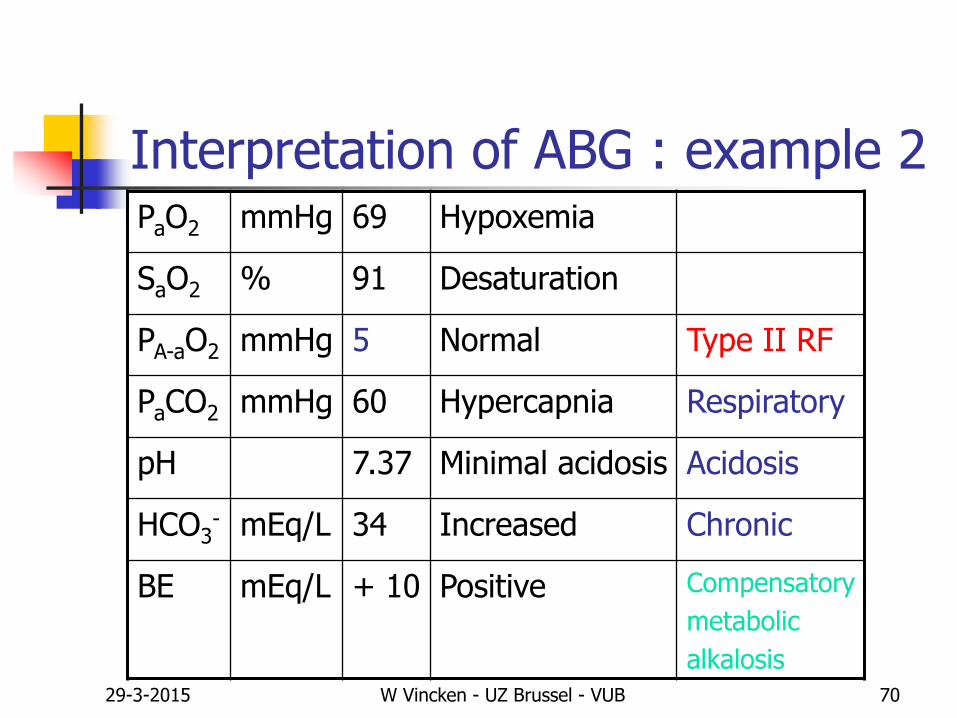
Interpretation of ABG : example 2PaO2 mmHg 69 Hypoxemia
SaO2 % 91 Desaturation
PA-aO2 mmHg 5 Normal Type II RF
PaCO2 mmHg 60 Hypercapnia Respiratory
pH 7.37 Minimal acidosis Acidosis
HCO3- mEq/L 34 Increased Chronic
BE mEq/L + 10 Positive Compensatory
metabolic
alkalosis
29-3-2015 W Vincken - UZ Brussel - VUB 71
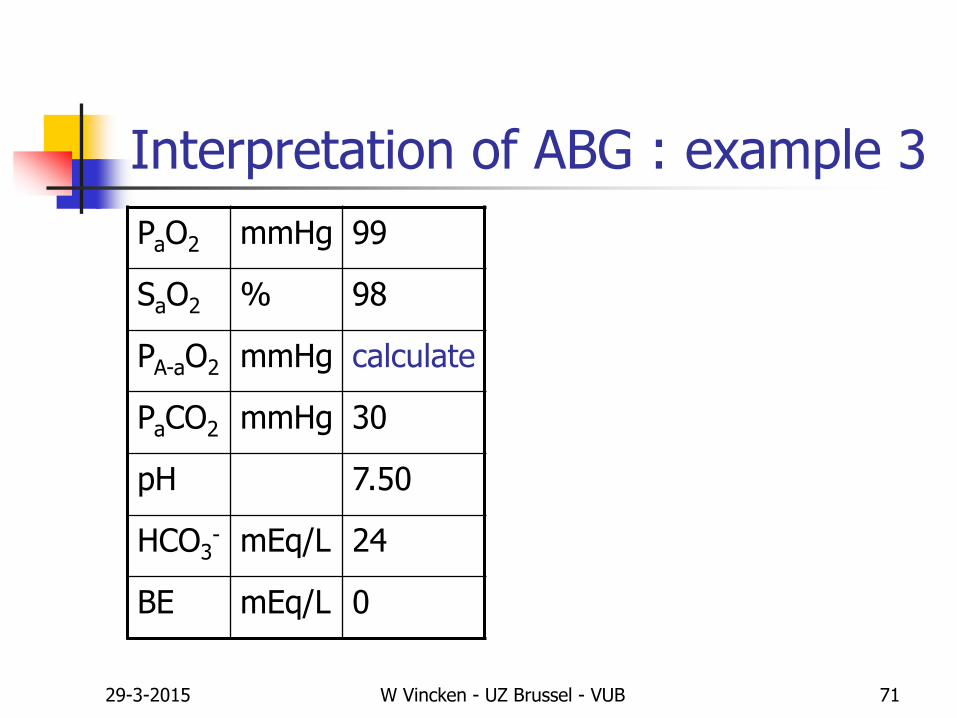
Interpretation of ABG : example 3
PaO2 mmHg 99
SaO2 % 98
PA-aO2 mmHg calculate
PaCO2 mmHg 30
pH 7.50
HCO3- mEq/L 24
BE mEq/L 0

29-3-2015 W Vincken - UZ Brussel - VUB 72
Interpretation of ABG : example 3
PaO2 mmHg 99
SaO2 % 98
PA-aO2 mmHg 149 – 30x1.25 – 99 = 12.5
PaCO2 mmHg 30
pH 7.50
HCO3- mEq/L 24
BE mEq/L 0
29-3-2015 W Vincken - UZ Brussel - VUB 73
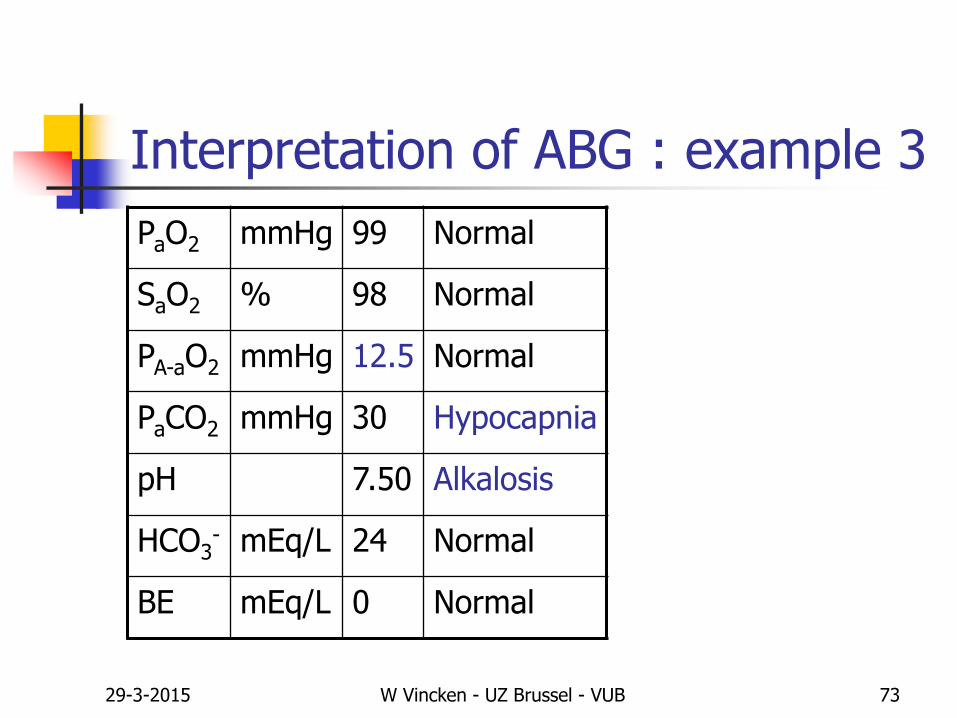
Interpretation of ABG : example 3
PaO2 mmHg 99 Normal
SaO2 % 98 Normal
PA-aO2 mmHg 12.5 Normal
PaCO2 mmHg 30 Hypocapnia
pH 7.50 Alkalosis
HCO3- mEq/L 24 Normal
BE mEq/L 0 Normal

29-3-2015 W Vincken - UZ Brussel - VUB 74
Interpretation of ABG : example 3
PaO2 mmHg 99 Normal
SaO2 % 98 Normal
PA-aO2 mmHg 12.5 Normal
PaCO2 mmHg 30 Hypocapnia Respiratory
pH 7.50 Alkalosis Alkalosis
HCO3- mEq/L 24 Normal Acute
BE mEq/L 0 Normal
29-3-2015 W Vincken - UZ Brussel - VUB 75
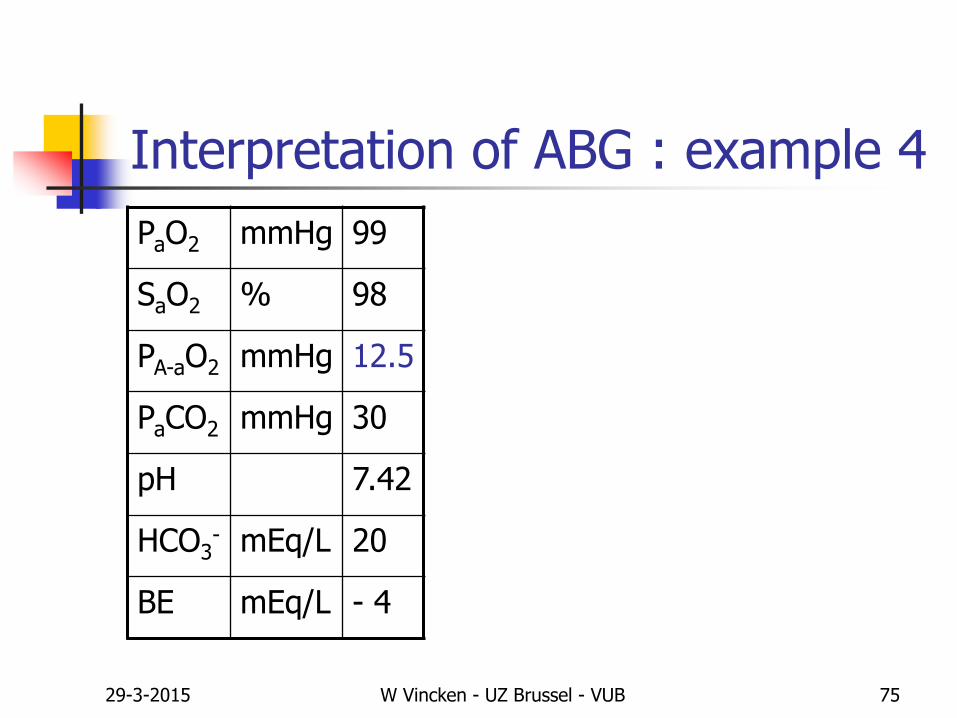
Interpretation of ABG : example 4
PaO2 mmHg 99
SaO2 % 98
PA-aO2 mmHg 12.5
PaCO2 mmHg 30
pH 7.42
HCO3- mEq/L 20
BE mEq/L - 4

29-3-2015 W Vincken - UZ Brussel - VUB 76
Interpretation of ABG : example 4
PaO2 mmHg 99 Normal
SaO2 % 98 Normal
PA-aO2 mmHg 12.5 Normal
PaCO2 mmHg 30
pH 7.42
HCO3- mEq/L 20
BE mEq/L - 4
29-3-2015 W Vincken - UZ Brussel - VUB 77
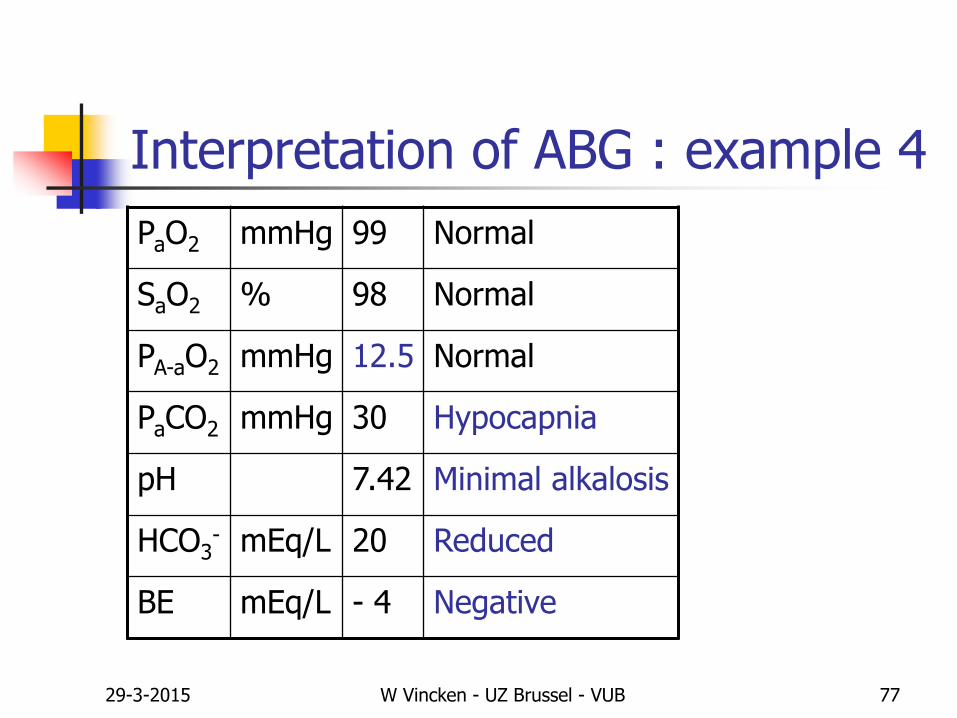
Interpretation of ABG : example 4
PaO2 mmHg 99 Normal
SaO2 % 98 Normal
PA-aO2 mmHg 12.5 Normal
PaCO2 mmHg 30 Hypocapnia
pH 7.42 Minimal alkalosis
HCO3- mEq/L 20 Reduced
BE mEq/L - 4 Negative
29-3-2015 W Vincken - UZ Brussel - VUB 78
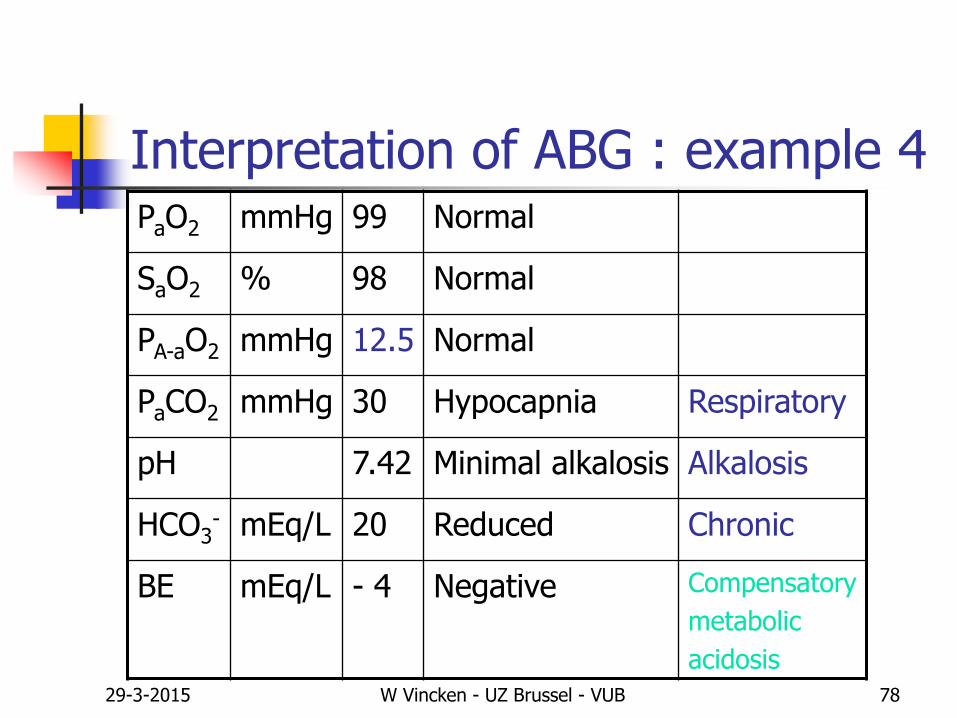
Interpretation of ABG : example 4PaO2 mmHg 99 Normal
SaO2 % 98 Normal
PA-aO2 mmHg 12.5 Normal
PaCO2 mmHg 30 Hypocapnia Respiratory
pH 7.42 Minimal alkalosis Alkalosis
HCO3- mEq/L 20 Reduced Chronic
BE mEq/L - 4 Negative Compensatory
metabolic
acidosis

29-3-2015 W Vincken - UZ Brussel - VUB 79
Interpretation of ABG : example 5
PaO2 mmHg 60
SaO2 % 88
PA-aO2 mmHg calculate
PaCO2 mmHg 32
pH 7.49
HCO3- mEq/L 24
BE mEq/L 0
29-3-2015 W Vincken - UZ Brussel - VUB 80
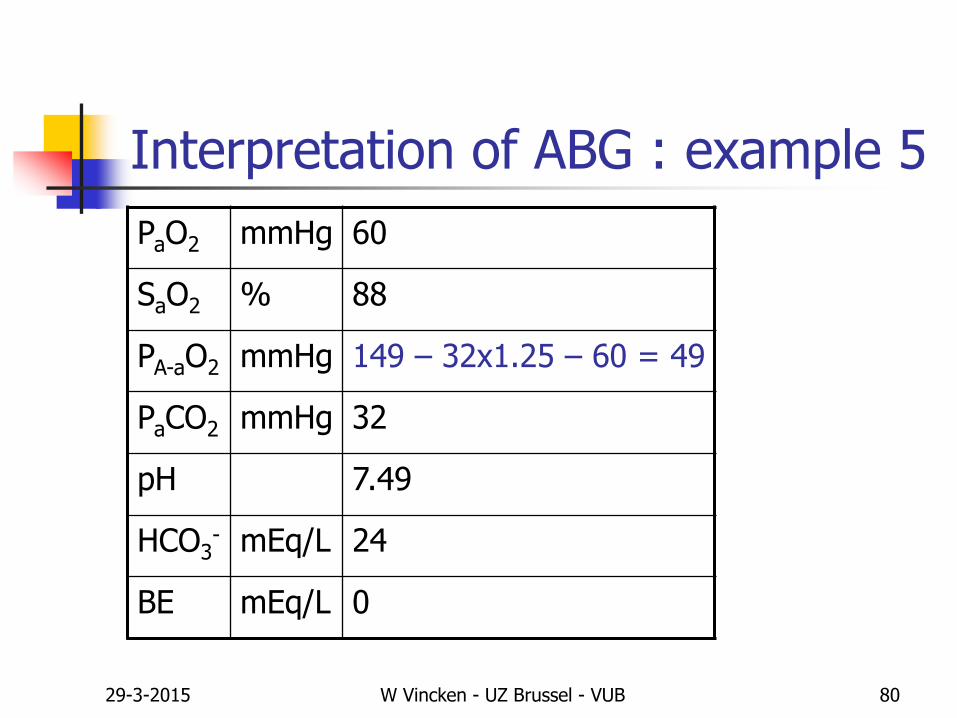
Interpretation of ABG : example 5
PaO2 mmHg 60
SaO2 % 88
PA-aO2 mmHg 149 – 32x1.25 – 60 = 49
PaCO2 mmHg 32
pH 7.49
HCO3- mEq/L 24
BE mEq/L 0
29-3-2015 W Vincken - UZ Brussel - VUB 81
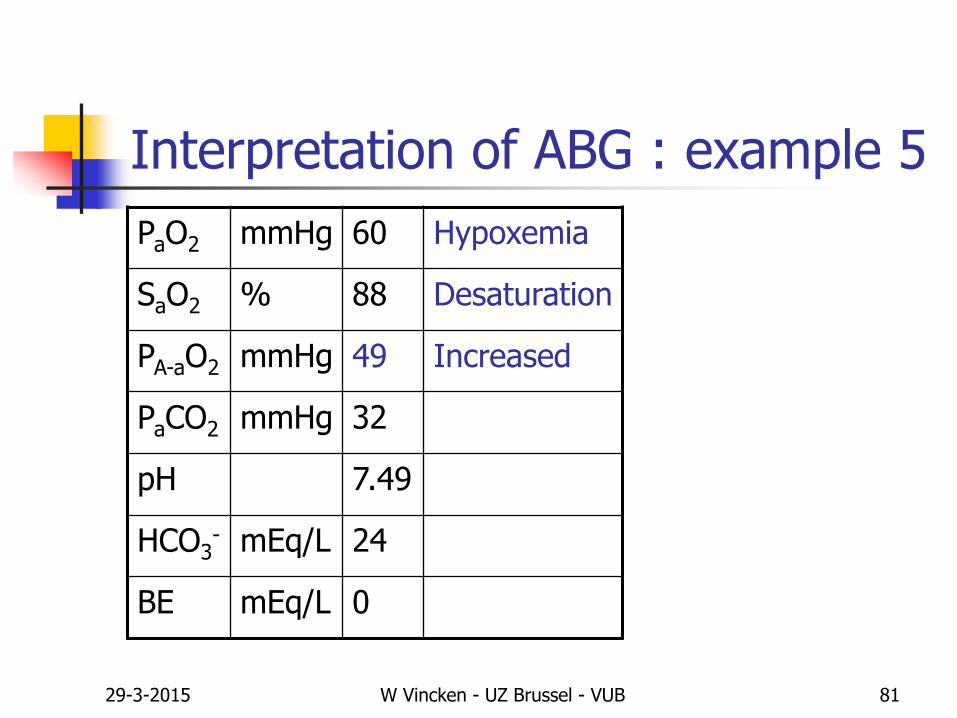
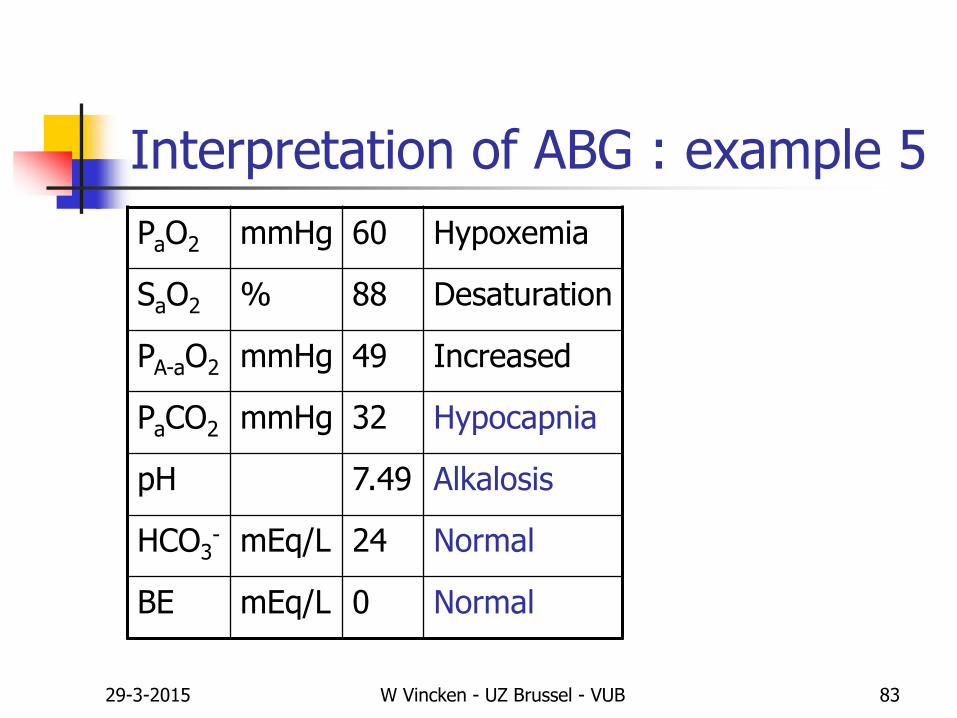
Interpretation of ABG : example 5
PaO2 mmHg 60 Hypoxemia
SaO2 % 88 Desaturation
PA-aO2 mmHg 49 Increased
PaCO2 mmHg 32
pH 7.49
HCO3- mEq/L 24
BE mEq/L 0
29-3-2015 W Vincken - UZ Brussel - VUB 82
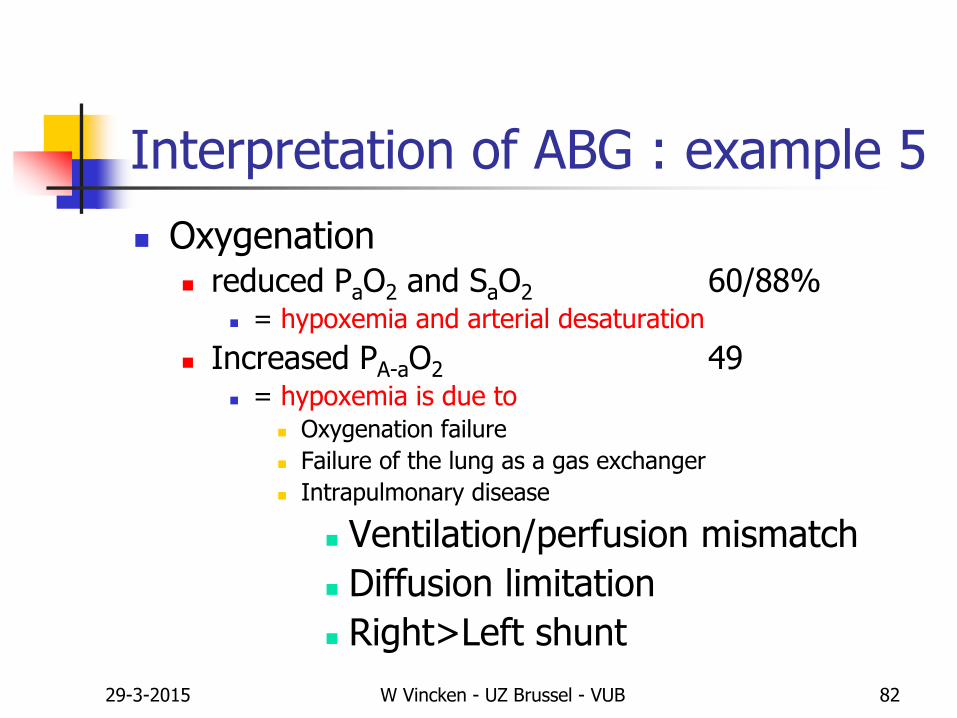
Interpretation of ABG : example 5
Oxygenation reduced PaO2 and SaO2 60/88%
= hypoxemia and arterial desaturation
Increased PA-aO2 49 = hypoxemia is due to
Oxygenation failure
Failure of the lung as a gas exchanger
Intrapulmonary disease
Ventilation/perfusion mismatch
Diffusion limitation
Right>Left shunt
29-3-2015 W Vincken - UZ Brussel - VUB 83
Interpretation of ABG : example 5
PaO2 mmHg 60 Hypoxemia
SaO2 % 88 Desaturation
PA-aO2 mmHg 49 Increased
PaCO2 mmHg 32 Hypocapnia
pH 7.49 Alkalosis
HCO3- mEq/L 24 Normal
BE mEq/L 0 Normal
29-3-2015 W Vincken - UZ Brussel - VUB 84
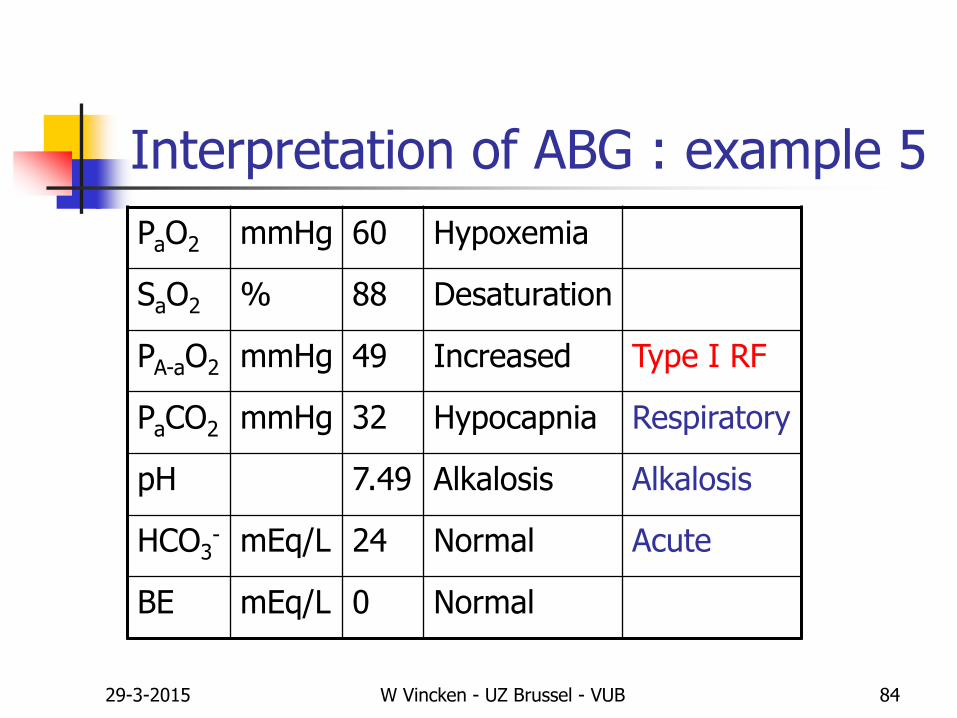
Interpretation of ABG : example 5
PaO2 mmHg 60 Hypoxemia
SaO2 % 88 Desaturation
PA-aO2 mmHg 49 Increased Type I RF
PaCO2 mmHg 32 Hypocapnia Respiratory
pH 7.49 Alkalosis Alkalosis
HCO3- mEq/L 24 Normal Acute
BE mEq/L 0 Normal
29-3-2015 W Vincken - UZ Brussel - VUB 85
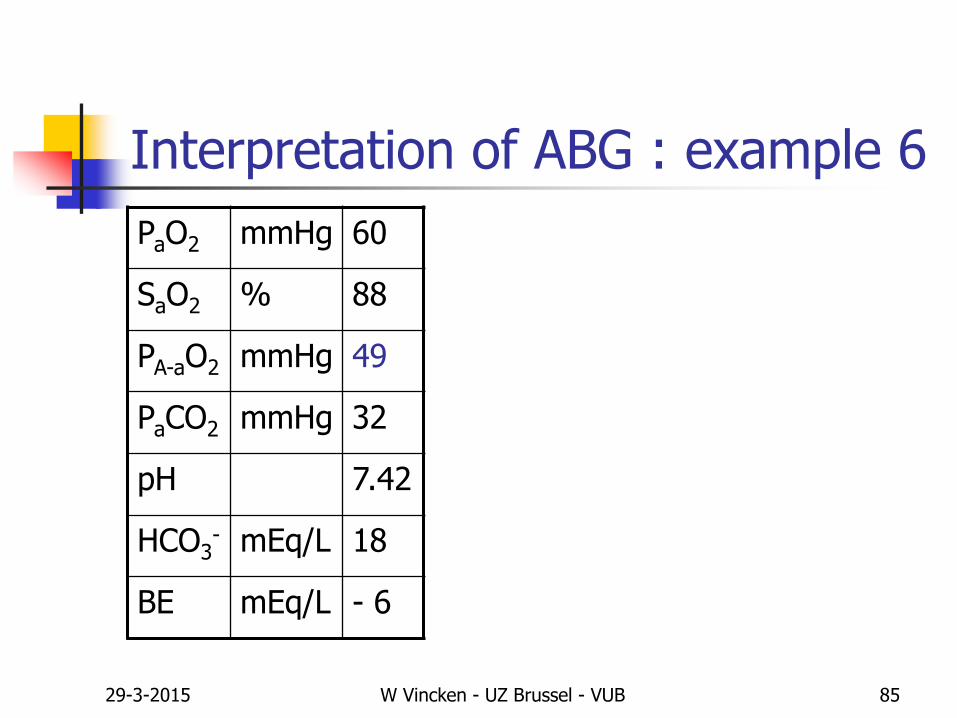
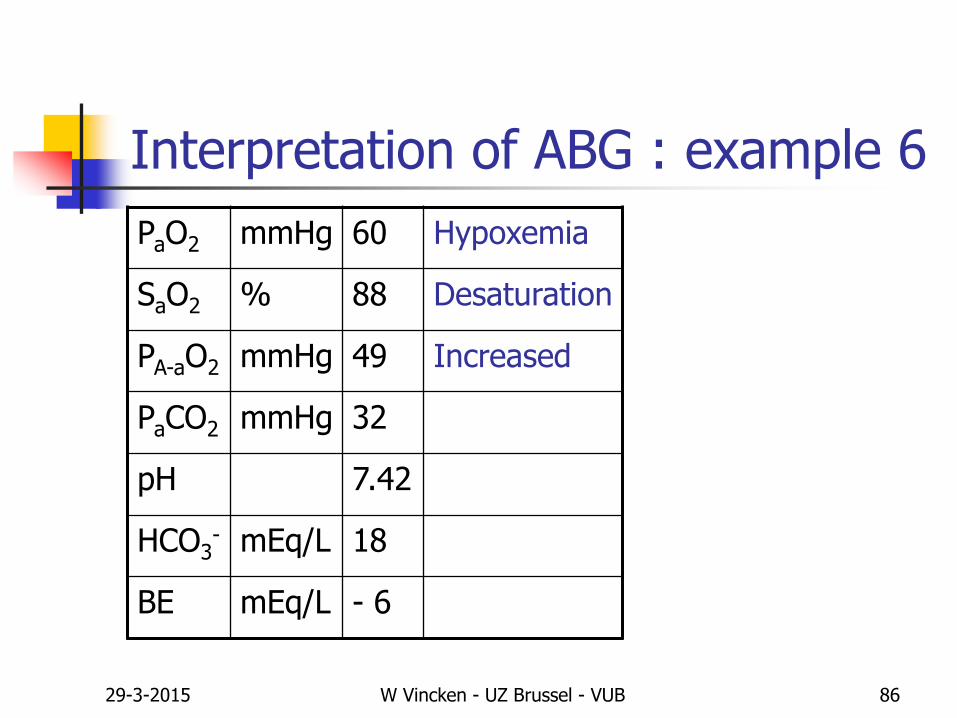
Interpretation of ABG : example 6
PaO2 mmHg 60
SaO2 % 88
PA-aO2 mmHg 49
PaCO2 mmHg 32
pH 7.42
HCO3- mEq/L 18
BE mEq/L - 6
29-3-2015 W Vincken - UZ Brussel - VUB 86
Interpretation of ABG : example 6
PaO2 mmHg 60 Hypoxemia
SaO2 % 88 Desaturation
PA-aO2 mmHg 49 Increased
PaCO2 mmHg 32
pH 7.42
HCO3- mEq/L 18
BE mEq/L - 6
29-3-2015 W Vincken - UZ Brussel - VUB 87
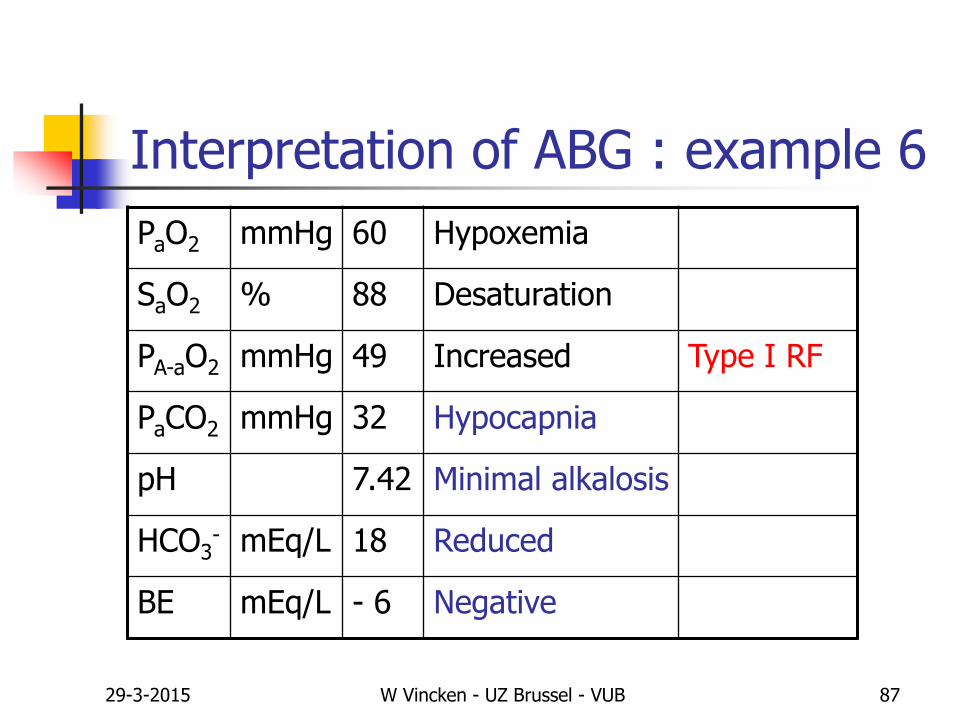
Interpretation of ABG : example 6
PaO2 mmHg 60 Hypoxemia
SaO2 % 88 Desaturation
PA-aO2 mmHg 49 Increased Type I RF
PaCO2 mmHg 32 Hypocapnia
pH 7.42 Minimal alkalosis
HCO3- mEq/L 18 Reduced
BE mEq/L - 6 Negative
29-3-2015 W Vincken - UZ Brussel - VUB 88
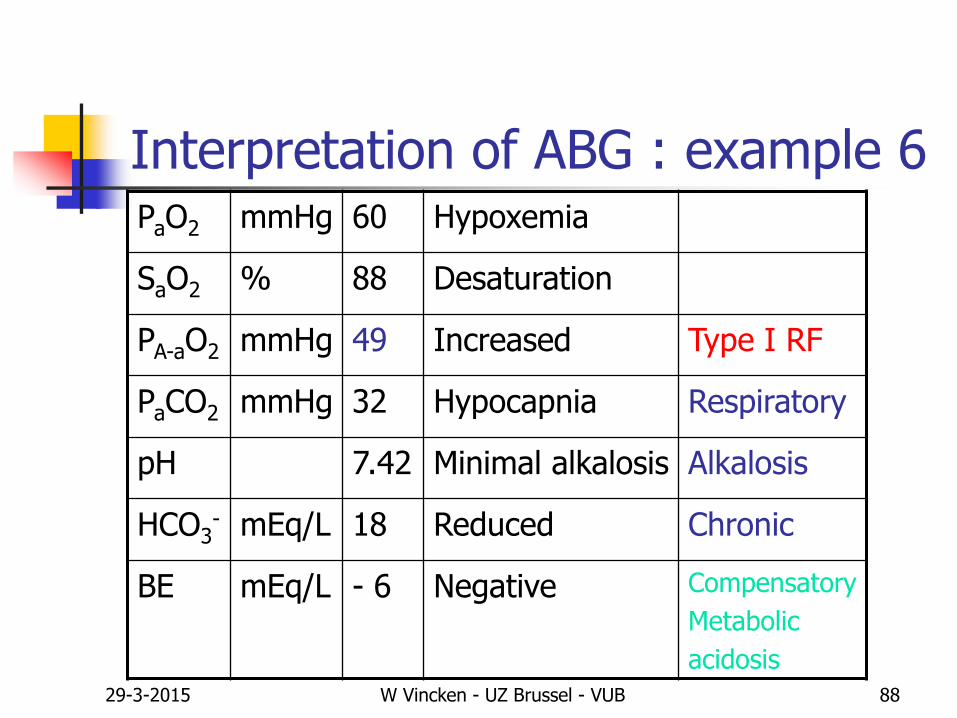
Interpretation of ABG : example 6PaO2 mmHg 60 Hypoxemia
SaO2 % 88 Desaturation
PA-aO2 mmHg 49 Increased Type I RF
PaCO2 mmHg 32 Hypocapnia Respiratory
pH 7.42 Minimal alkalosis Alkalosis
HCO3- mEq/L 18 Reduced Chronic
BE mEq/L - 6 Negative Compensatory
Metabolic
acidosis

29-3-2015 W Vincken - UZ Brussel - VUB 89
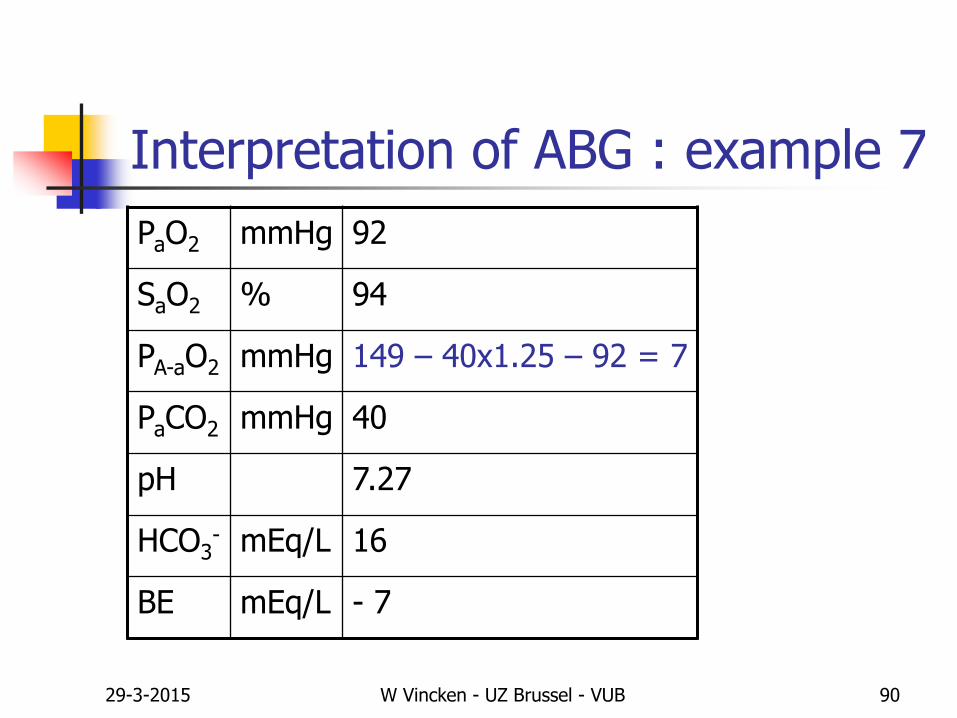
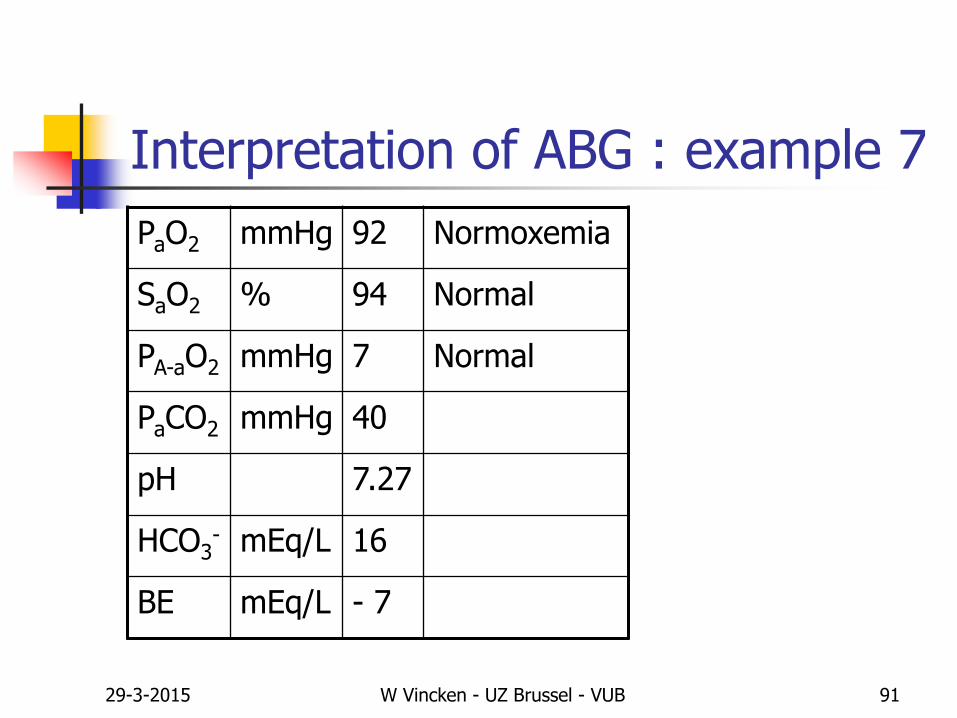
Interpretation of ABG : example 7
PaO2 mmHg 92
SaO2 % 94
PA-aO2 mmHg calculate
PaCO2 mmHg 40
pH 7.27
HCO3- mEq/L 16
BE mEq/L - 7
29-3-2015 W Vincken - UZ Brussel - VUB 90
Interpretation of ABG : example 7
PaO2 mmHg 92
SaO2 % 94
PA-aO2 mmHg 149 – 40x1.25 – 92 = 7
PaCO2 mmHg 40
pH 7.27
HCO3- mEq/L 16
BE mEq/L - 7
29-3-2015 W Vincken - UZ Brussel - VUB 91
Interpretation of ABG : example 7
PaO2 mmHg 92 Normoxemia
SaO2 % 94 Normal
PA-aO2 mmHg 7 Normal
PaCO2 mmHg 40
pH 7.27
HCO3- mEq/L 16
BE mEq/L - 7
29-3-2015 W Vincken - UZ Brussel - VUB 92
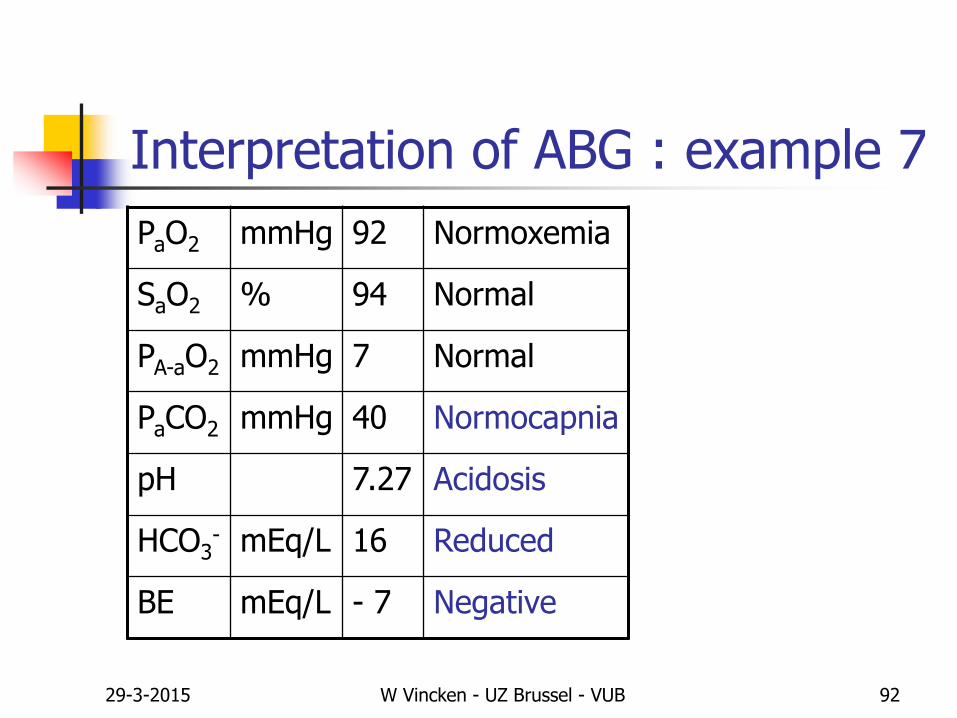
Interpretation of ABG : example 7
PaO2 mmHg 92 Normoxemia
SaO2 % 94 Normal
PA-aO2 mmHg 7 Normal
PaCO2 mmHg 40 Normocapnia
pH 7.27 Acidosis
HCO3- mEq/L 16 Reduced
BE mEq/L - 7 Negative
29-3-2015 W Vincken - UZ Brussel - VUB 93
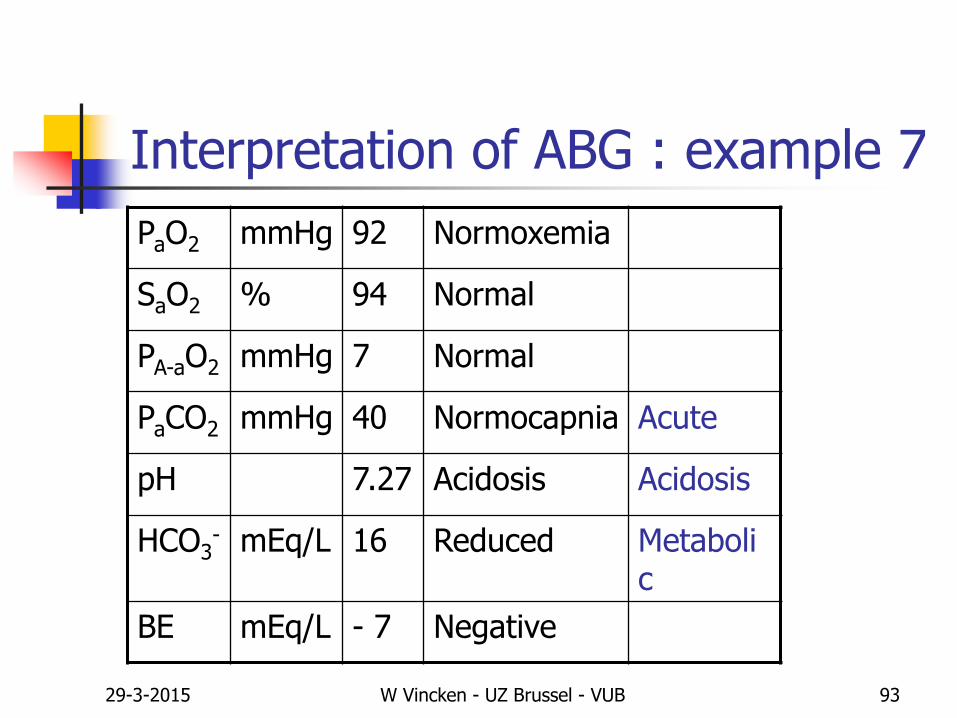
Interpretation of ABG : example 7
PaO2 mmHg 92 Normoxemia
SaO2 % 94 Normal
PA-aO2 mmHg 7 Normal
PaCO2 mmHg 40 Normocapnia Acute
pH 7.27 Acidosis Acidosis
HCO3- mEq/L 16 Reduced Metaboli
c
BE mEq/L - 7 Negative
29-3-2015 W Vincken - UZ Brussel - VUB 94
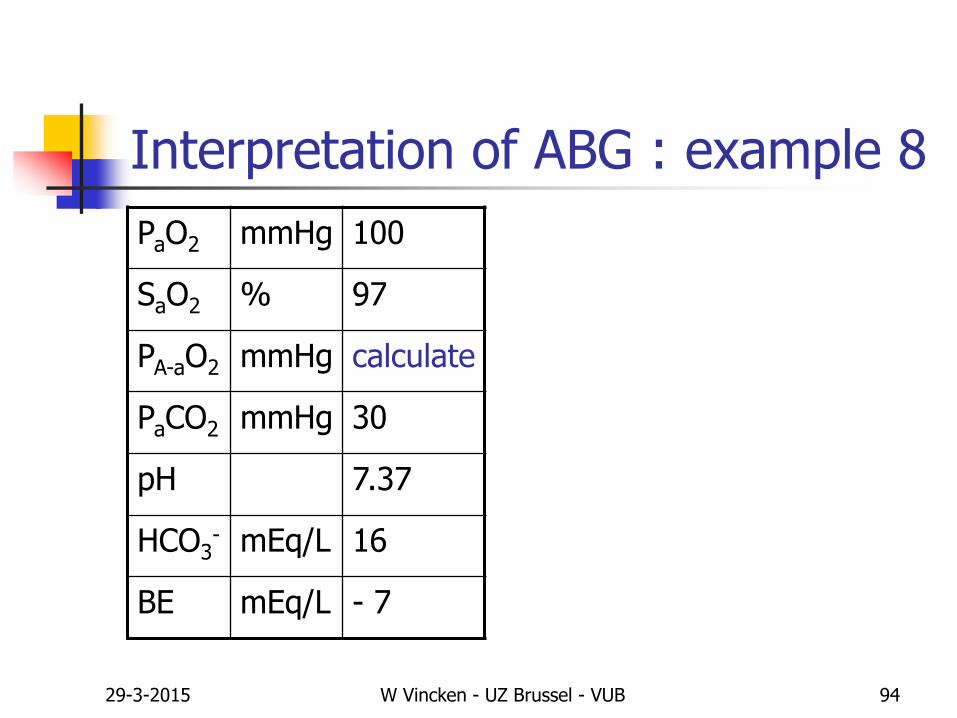
Interpretation of ABG : example 8
PaO2 mmHg 100
SaO2 % 97
PA-aO2 mmHg calculate
PaCO2 mmHg 30
pH 7.37
HCO3- mEq/L 16
BE mEq/L - 7

29-3-2015 W Vincken - UZ Brussel - VUB 95
Interpretation of ABG : example 8
PaO2 mmHg 100
SaO2 % 97
PA-aO2 mmHg 149 – 30x1.25 – 100 = 12
PaCO2 mmHg 30
pH 7.37
HCO3- mEq/L 16
BE mEq/L - 7
29-3-2015 W Vincken - UZ Brussel - VUB 96
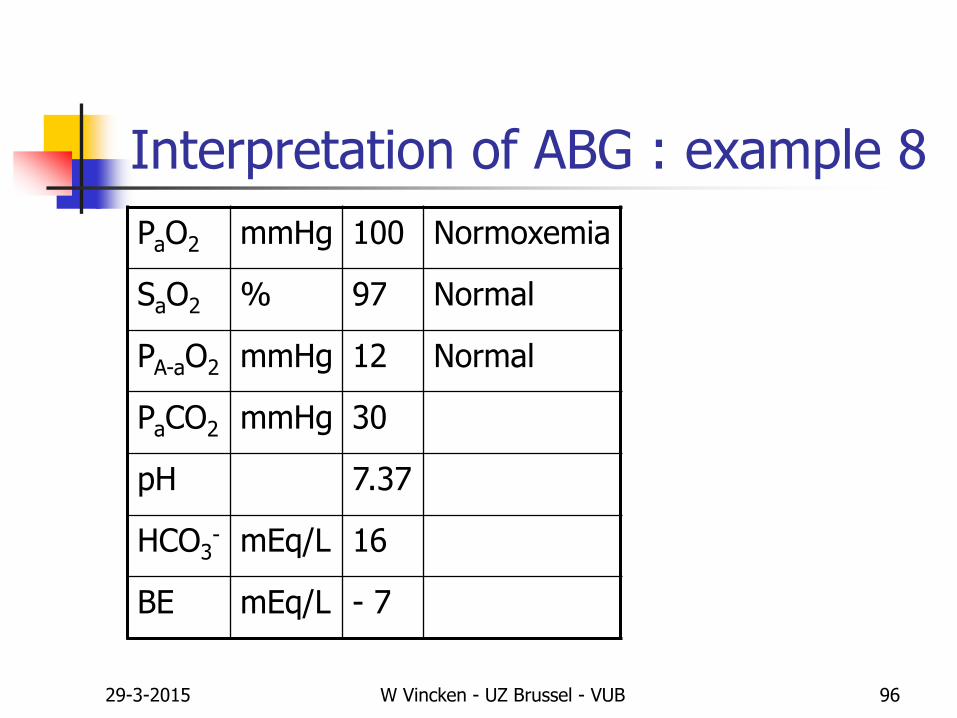
Interpretation of ABG : example 8
PaO2 mmHg 100 Normoxemia
SaO2 % 97 Normal
PA-aO2 mmHg 12 Normal
PaCO2 mmHg 30
pH 7.37
HCO3- mEq/L 16
BE mEq/L - 7

29-3-2015 W Vincken - UZ Brussel - VUB 97
Interpretation of ABG : example 8
PaO2 mmHg 100 Normoxemia
SaO2 % 97 Normal
PA-aO2 mmHg 12 Normal
PaCO2 mmHg 30 Hypocapnia
pH 7.37 Minimal acidosis
HCO3- mEq/L 16 Reduced
BE mEq/L - 7 Negative
29-3-2015 W Vincken - UZ Brussel - VUB 98
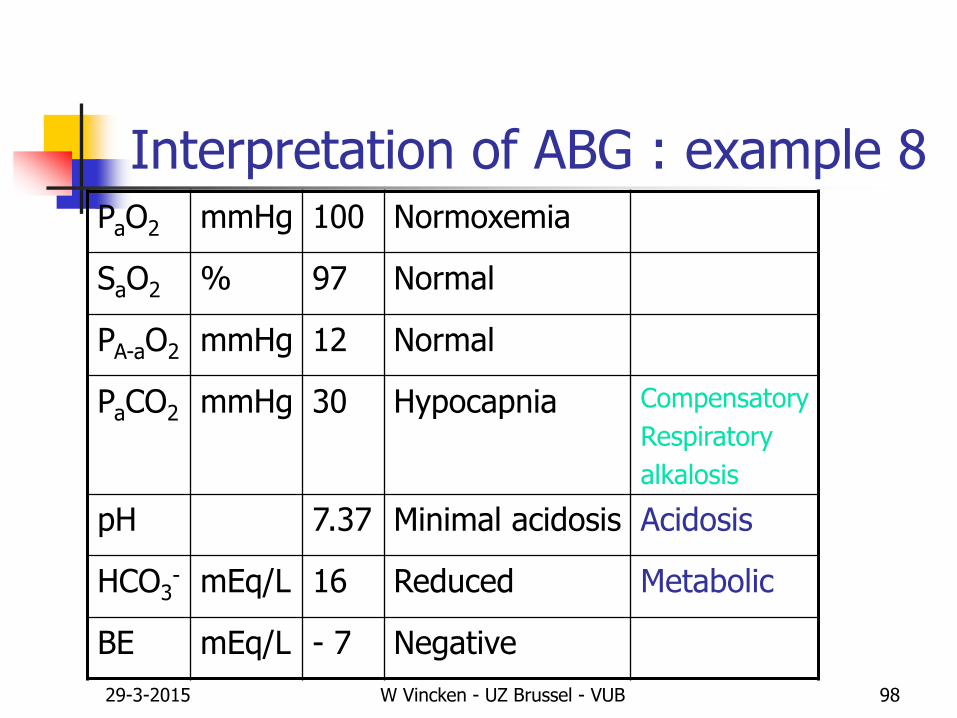
Interpretation of ABG : example 8PaO2 mmHg 100 Normoxemia
SaO2 % 97 Normal
PA-aO2 mmHg 12 Normal
PaCO2 mmHg 30 Hypocapnia Compensatory
Respiratory
alkalosis
pH 7.37 Minimal acidosis Acidosis
HCO3- mEq/L 16 Reduced Metabolic
BE mEq/L - 7 Negative
29-3-2015 W Vincken - UZ Brussel - VUB 99
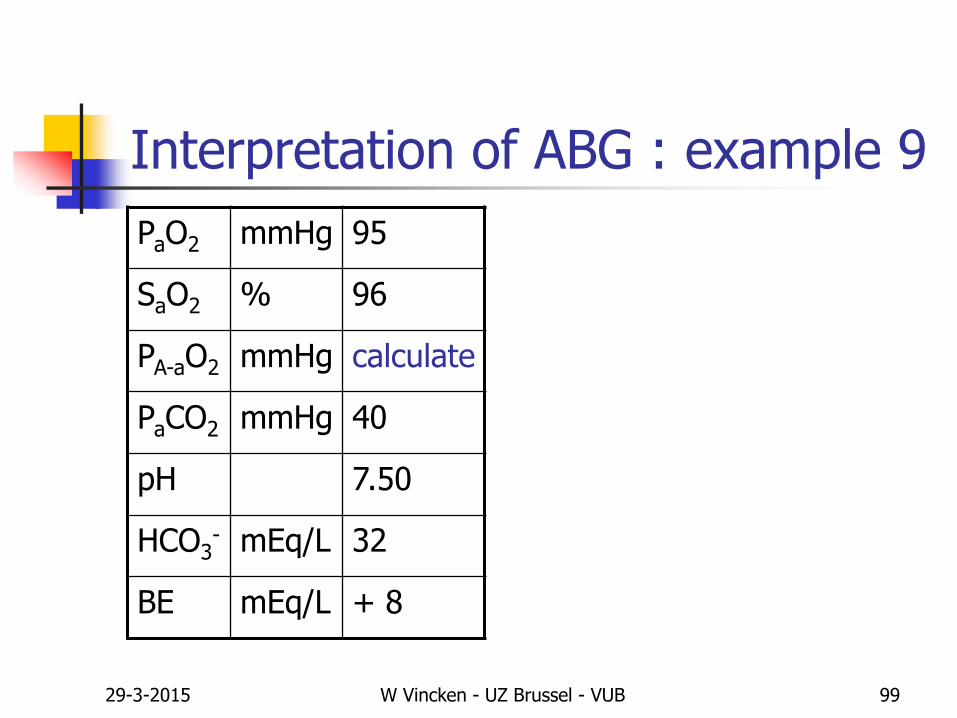
Interpretation of ABG : example 9
PaO2 mmHg 95
SaO2 % 96
PA-aO2 mmHg calculate
PaCO2 mmHg 40
pH 7.50
HCO3- mEq/L 32
BE mEq/L + 8

29-3-2015 W Vincken - UZ Brussel - VUB 100
Interpretation of ABG : example 9
PaO2 mmHg 95
SaO2 % 96
PA-aO2 mmHg 149 – 40x1.25 – 95 = 4
PaCO2 mmHg 40
pH 7.50
HCO3- mEq/L 32
BE mEq/L + 8

29-3-2015 W Vincken - UZ Brussel - VUB 101
Interpretation of ABG : example 9
PaO2 mmHg 95 Normoxemia
SaO2 % 96 Normal
PA-aO2 mmHg 4 Normal
PaCO2 mmHg 40
pH 7.50
HCO3- mEq/L 32
BE mEq/L + 8

29-3-2015 W Vincken - UZ Brussel - VUB 102
Interpretation of ABG : example 9
PaO2 mmHg 95 Normoxemia
SaO2 % 96 Normal
PA-aO2 mmHg 4 Normal
PaCO2 mmHg 40 Normocapnia
pH 7.50 Alkalosis
HCO3- mEq/L 32 Increased
BE mEq/L + 8 Positive
29-3-2015 W Vincken - UZ Brussel - VUB 103
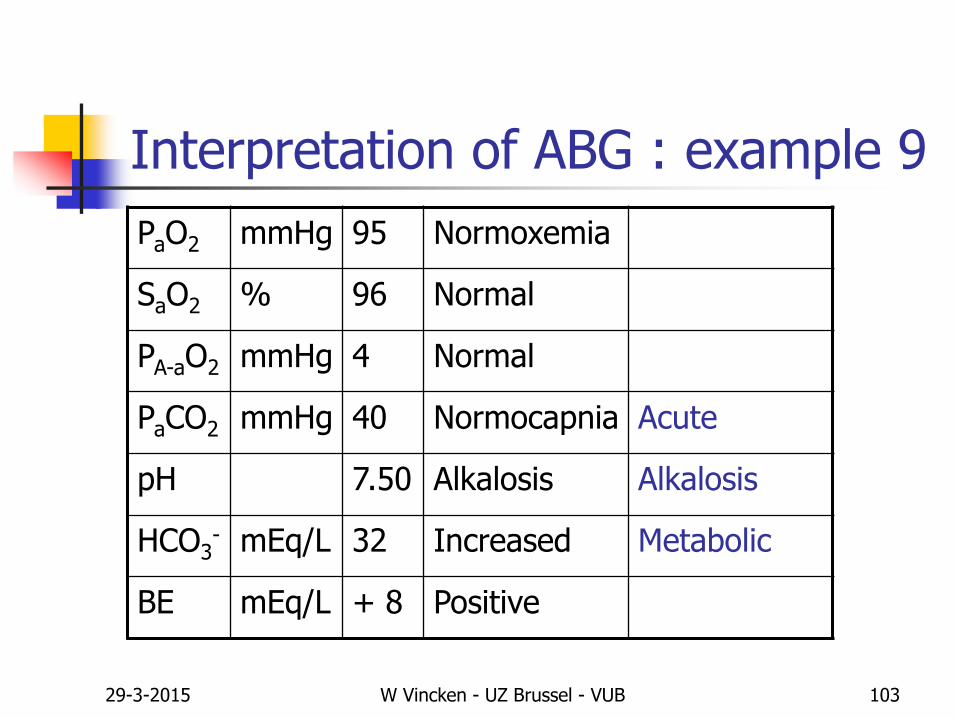
Interpretation of ABG : example 9
PaO2 mmHg 95 Normoxemia
SaO2 % 96 Normal
PA-aO2 mmHg 4 Normal
PaCO2 mmHg 40 Normocapnia Acute
pH 7.50 Alkalosis Alkalosis
HCO3- mEq/L 32 Increased Metabolic
BE mEq/L + 8 Positive
29-3-2015 W Vincken - UZ Brussel - VUB 104
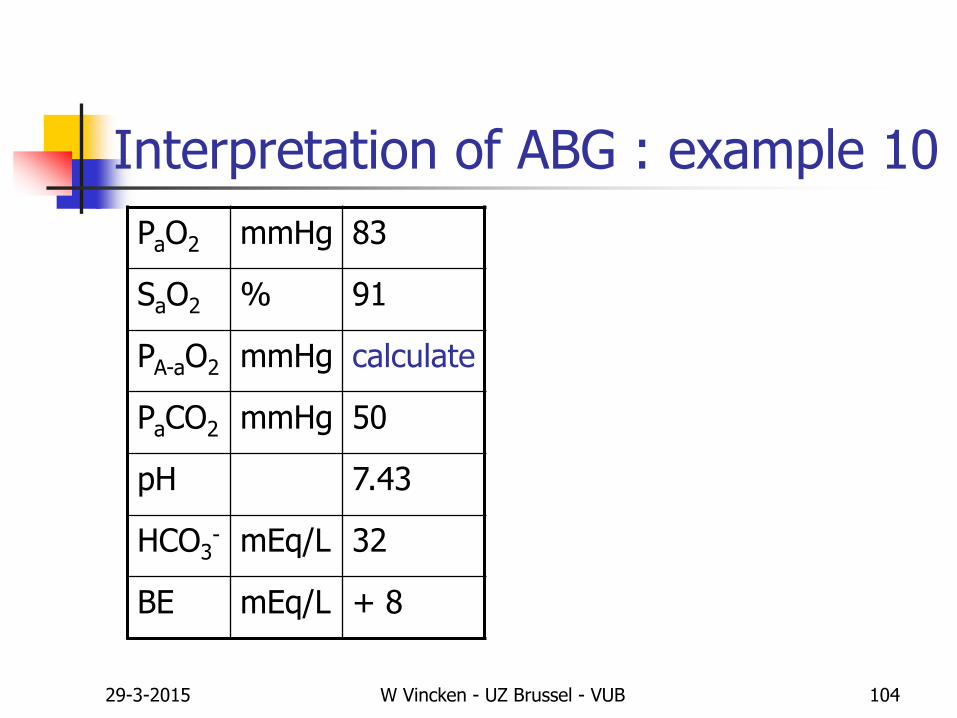
Interpretation of ABG : example 10
PaO2 mmHg 83
SaO2 % 91
PA-aO2 mmHg calculate
PaCO2 mmHg 50
pH 7.43
HCO3- mEq/L 32
BE mEq/L + 8

29-3-2015 W Vincken - UZ Brussel - VUB 105
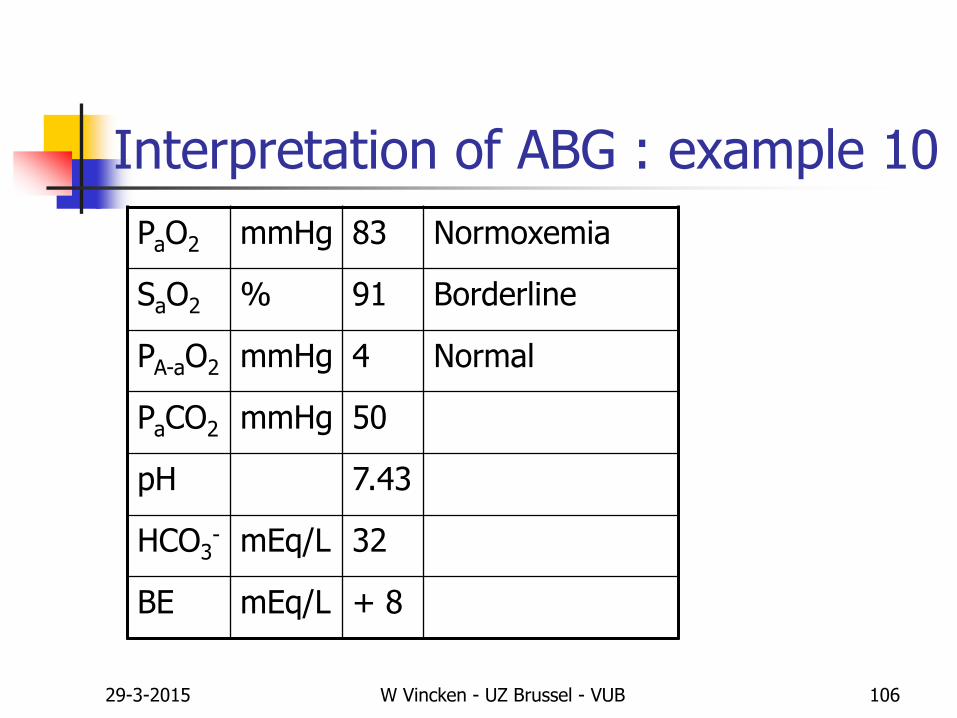
Interpretation of ABG : example 10
PaO2 mmHg 83
SaO2 % 91
PA-aO2 mmHg 149 – 50x1.25 – 83 = 4
PaCO2 mmHg 50
pH 7.43
HCO3- mEq/L 32
BE mEq/L + 8
29-3-2015 W Vincken - UZ Brussel - VUB 106
Interpretation of ABG : example 10
PaO2 mmHg 83 Normoxemia
SaO2 % 91 Borderline
PA-aO2 mmHg 4 Normal
PaCO2 mmHg 50
pH 7.43
HCO3- mEq/L 32
BE mEq/L + 8
29-3-2015 W Vincken - UZ Brussel - VUB 107
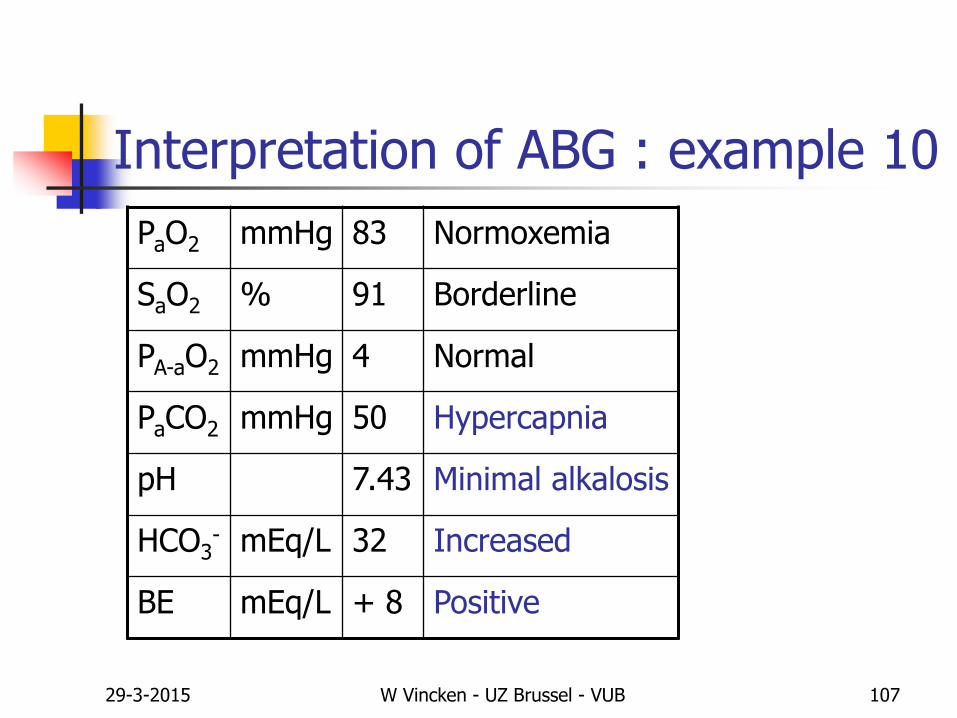
Interpretation of ABG : example 10
PaO2 mmHg 83 Normoxemia
SaO2 % 91 Borderline
PA-aO2 mmHg 4 Normal
PaCO2 mmHg 50 Hypercapnia
pH 7.43 Minimal alkalosis
HCO3- mEq/L 32 Increased
BE mEq/L + 8 Positive
29-3-2015 W Vincken - UZ Brussel - VUB 108
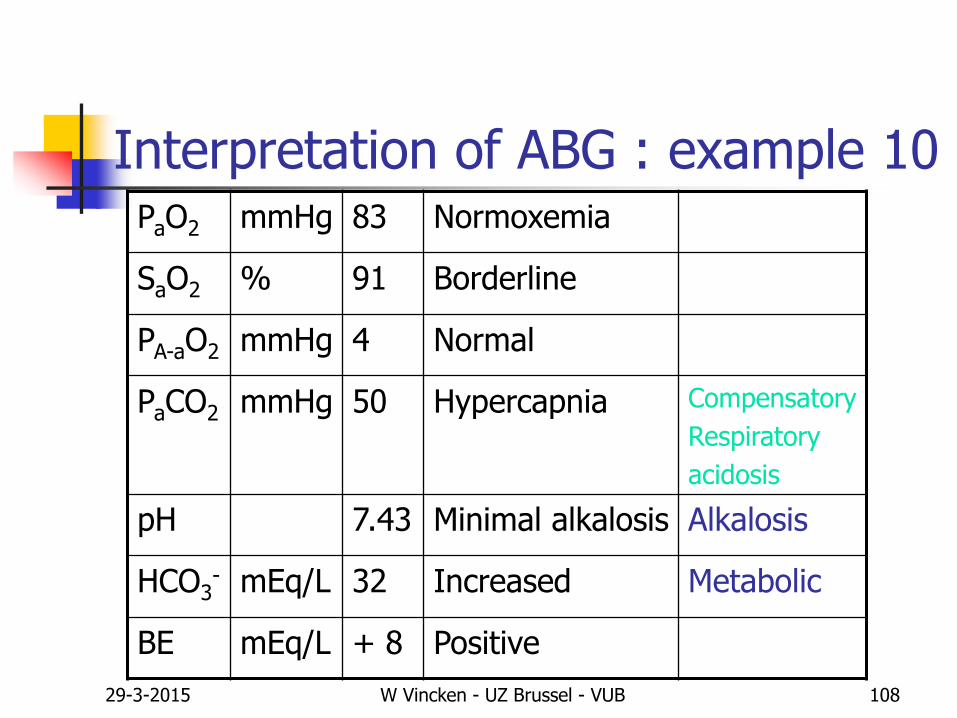
Interpretation of ABG : example 10PaO2 mmHg 83 Normoxemia
SaO2 % 91 Borderline
PA-aO2 mmHg 4 Normal
PaCO2 mmHg 50 Hypercapnia Compensatory
Respiratory
acidosis
pH 7.43 Minimal alkalosis Alkalosis
HCO3- mEq/L 32 Increased Metabolic
BE mEq/L + 8 Positive
29-3-2015 W Vincken - UZ Brussel - VUB 109
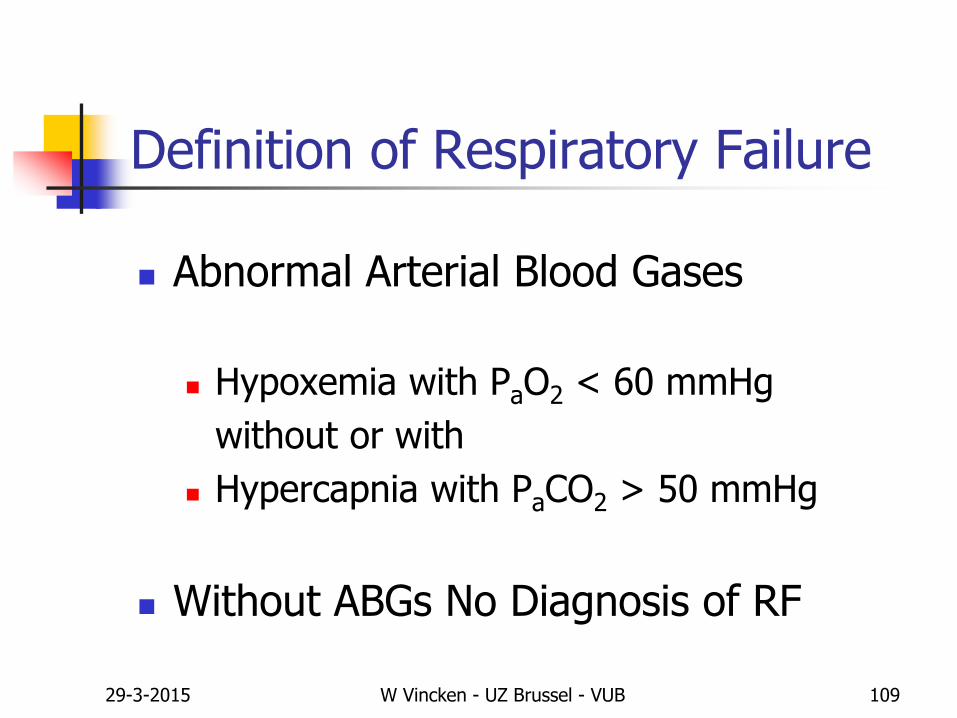
Definition of Respiratory Failure
Abnormal Arterial Blood Gases
Hypoxemia with PaO2 < 60 mmHg
without or with
Hypercapnia with PaCO2 > 50 mmHg
Without ABGs No Diagnosis of RF
29-3-2015 W Vincken - UZ Brussel - VUB 110
Classification of Respiratory Failure According to type of onset/duration
Acute Respiratory Failure
Chronic Respiratory Failure
Acute on Chronic Respiratory Failure
29-3-2015 W Vincken - UZ Brussel - VUB 111
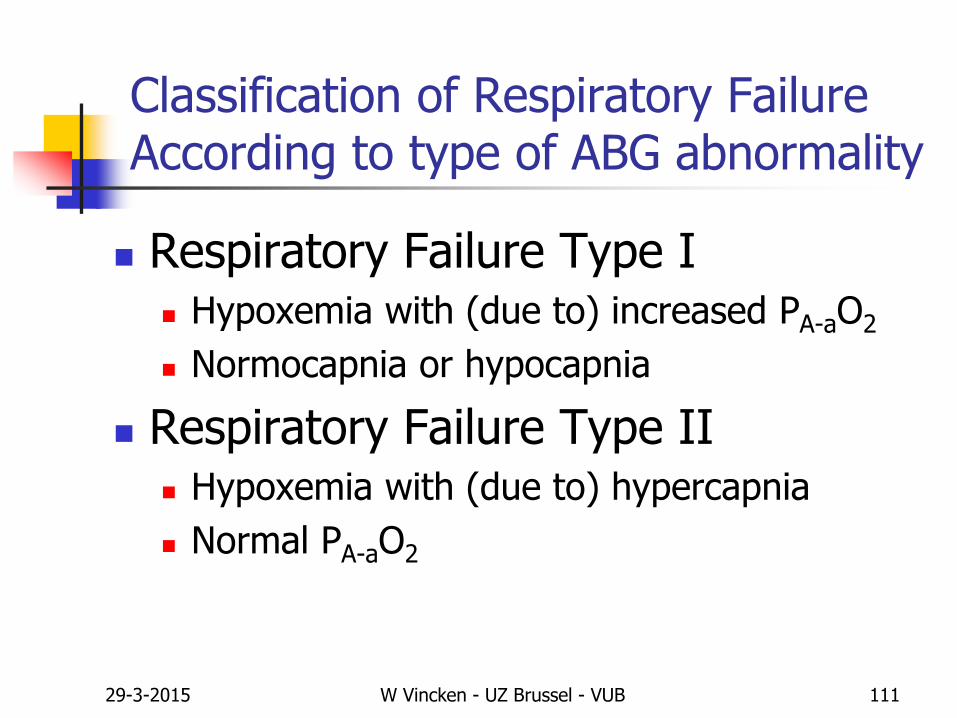
Classification of Respiratory Failure According to type of ABG abnormality
Respiratory Failure Type I Hypoxemia with (due to) increased PA-aO2
Normocapnia or hypocapnia
Respiratory Failure Type II Hypoxemia with (due to) hypercapnia
Normal PA-aO2
29-3-2015 W Vincken - UZ Brussel - VUB 112
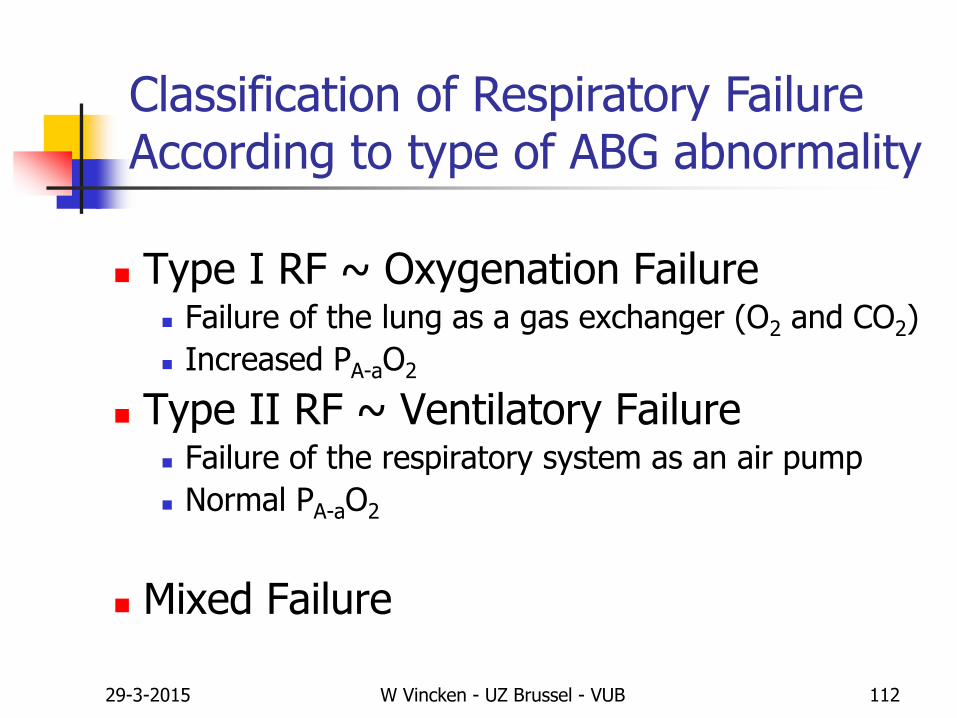
Type I RF ~ Oxygenation Failure Failure of the lung as a gas exchanger (O2 and CO2)
Increased PA-aO2
Type II RF ~ Ventilatory Failure Failure of the respiratory system as an air pump
Normal PA-aO2
Mixed Failure
Classification of Respiratory Failure According to type of ABG abnormality
29-3-2015 W Vincken - UZ Brussel - VUB 113
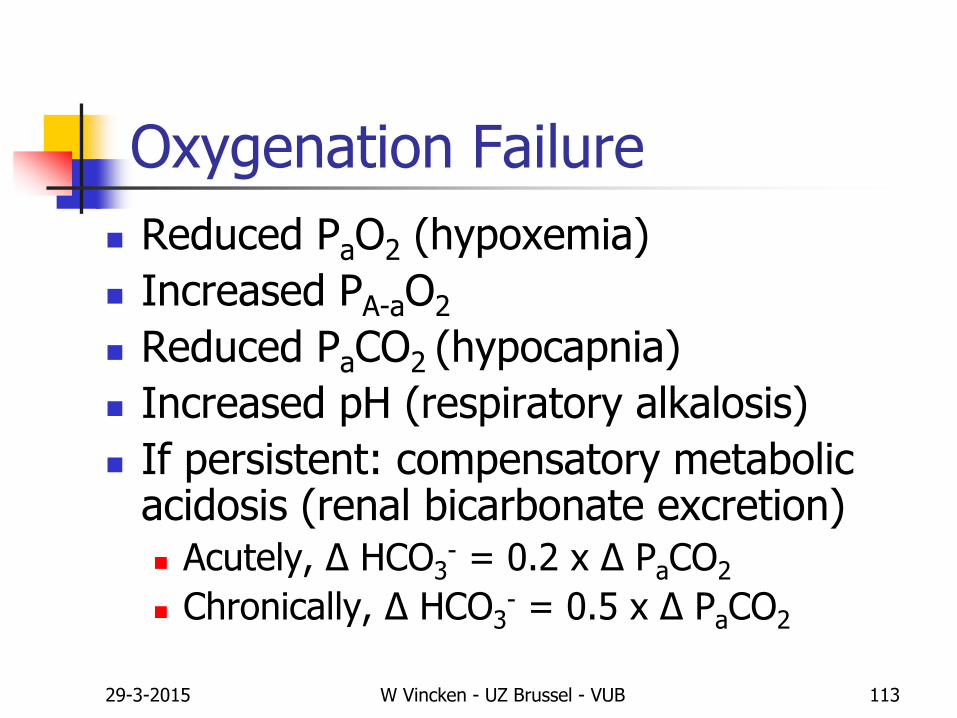
Oxygenation Failure
Reduced PaO2 (hypoxemia)
Increased PA-aO2
Reduced PaCO2 (hypocapnia)
Increased pH (respiratory alkalosis)
If persistent: compensatory metabolic acidosis (renal bicarbonate excretion) Acutely, Δ HCO3
- = 0.2 x Δ PaCO2
Chronically, Δ HCO3- = 0.5 x Δ PaCO2

29-3-2015 W Vincken - UZ Brussel - VUB 114
Oxygenation Failure
Abnormal Chest X-Ray
Diffuse pulmonary diseases
Localised pulmonary diseases
Normal Chest X-Ray
Anatomic R>L shunts
Asthma (except for hyperinflation)
Pulmonary embolism/vascular disease
29-3-2015 W Vincken - UZ Brussel - VUB 115
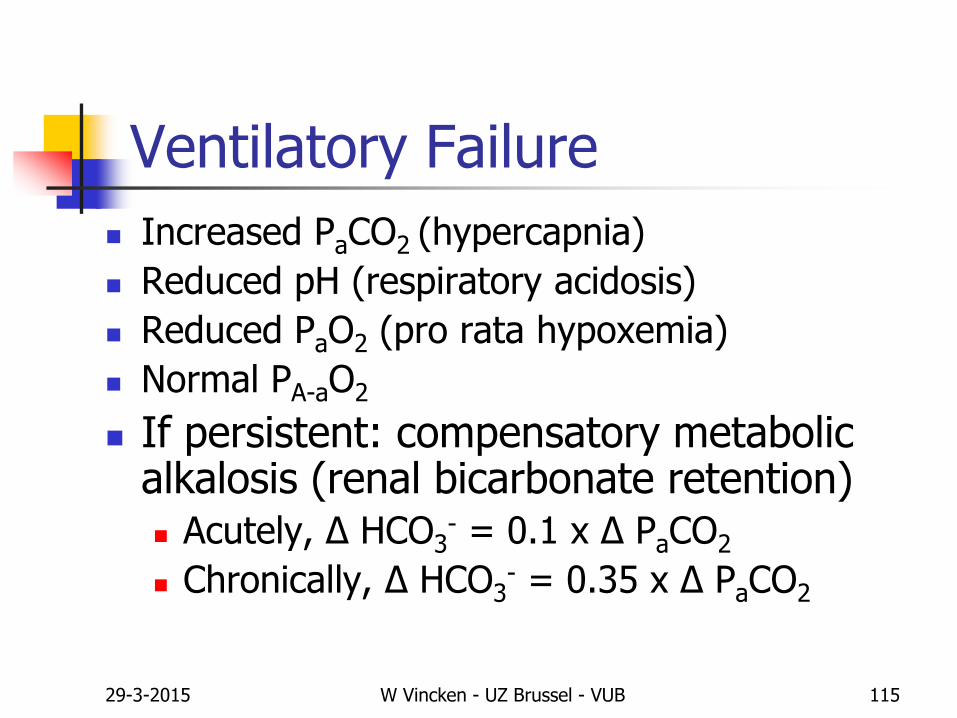
Ventilatory Failure
Increased PaCO2 (hypercapnia)
Reduced pH (respiratory acidosis)
Reduced PaO2 (pro rata hypoxemia)
Normal PA-aO2
If persistent: compensatory metabolic alkalosis (renal bicarbonate retention) Acutely, Δ HCO3
- = 0.1 x Δ PaCO2
Chronically, Δ HCO3- = 0.35 x Δ PaCO2
29-3-2015 W Vincken - UZ Brussel - VUB 116
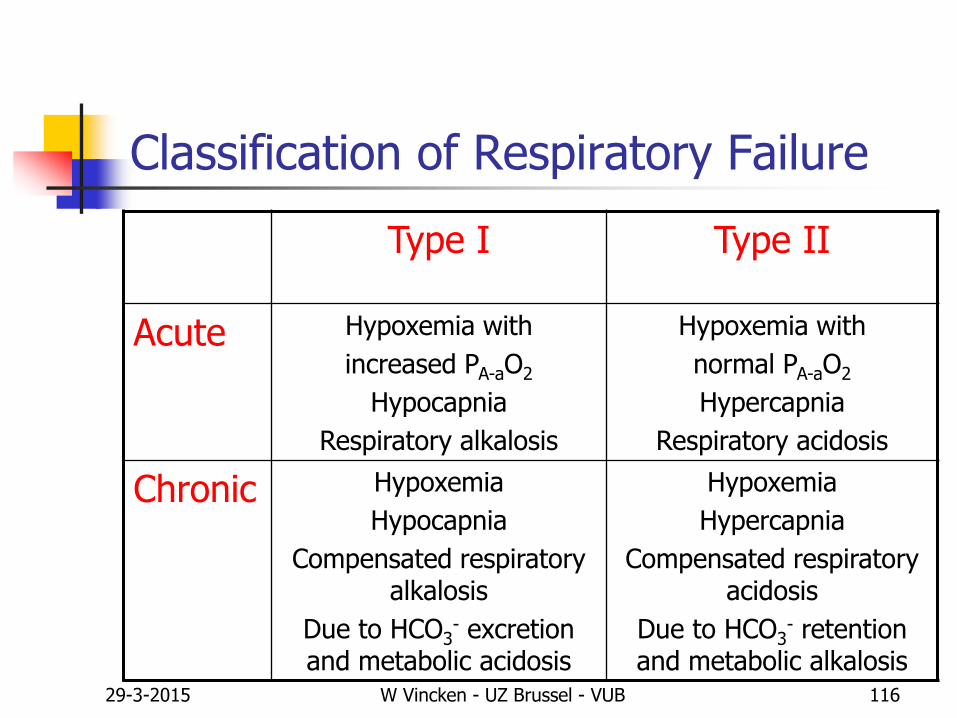
Classification of Respiratory Failure
Type I Type II
Acute Hypoxemia with
increased PA-aO2
Hypocapnia
Respiratory alkalosis
Hypoxemia with
normal PA-aO2
Hypercapnia
Respiratory acidosis
Chronic Hypoxemia
Hypocapnia
Compensated respiratory alkalosis
Due to HCO3- excretion
and metabolic acidosis
Hypoxemia
Hypercapnia
Compensated respiratory acidosis
Due to HCO3- retention
and metabolic alkalosis
29-3-2015 W Vincken - UZ Brussel - VUB 117
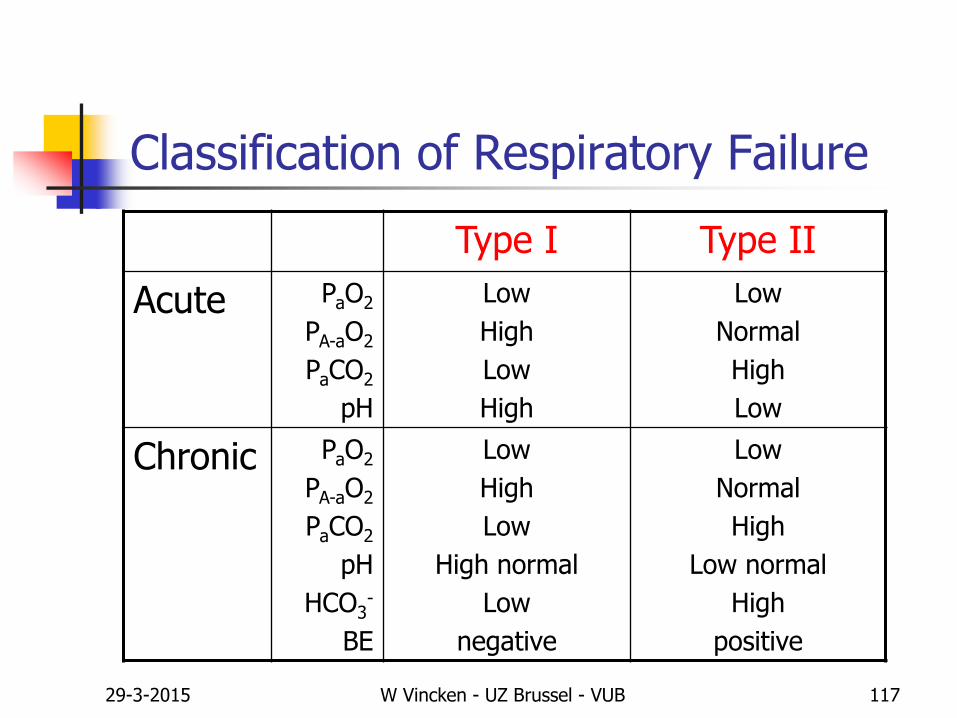
Classification of Respiratory Failure
Type I Type II
Acute PaO2
PA-aO2
PaCO2
pH
Low
High
Low
High
Low
Normal
High
Low
Chronic PaO2
PA-aO2
PaCO2
pH
HCO3-
BE
Low
High
Low
High normal
Low
negative
Low
Normal
High
Low normal
High
positive
29-3-2015 W Vincken - UZ Brussel - VUB 118
Thank you for listeningHope you learned something,
or at least enjoyed it
Prof. Dr. W. Vincken
Head Respiratory Division
UZ Brussel, VUB