interpretation of electron micrographs of adenovirus hexon arrays using a crystallographic molecular...
TRANSCRIPT

JOURNAL OF LILTRASTR”CT”RE AND MOLECULAR STR”CTURE RESEARCH 96,77-90 (1986)
Interpretation of Electron Micrographs of Adenovirus Hexon Arrays Using a Crystallographic Molecular Model
JAN VAN OOSTRUM,*.* P. R. SMITH,? MANIJEH MOHRAZ,? AND ROGER M. BURNETT*,~
*Department of Biochemistry and Molecular Biophysics, College of Physicians and Surgeons, Columbia University, 630 West 168th Street, New York, New York 10032, and
TDepartment of Cell Biology, New York University Medical School, 550 First Avenue, New York, New York 10016
Received February 2, I987
Two types of two-dimensional arrays of purified adenovirus type 2 hexon have been obtained and analyzed by Fourier filtration of their electron micrographs. One array contained continuously close-packed hexons, distributed on a hexagonal p3 lattice, with a unit cell dimension of 94 + 2 A. The other array contained close-packed hexons with a regular absence, so that rings of six hexons related by sixfold symmetry formed a p6 unit cell. The cell dimension of the hexagonal array was 153 t 3 A, with neighboring hexons separated by 88 f 2 A. Smaller p6 arrays were also formed by hexons freed from complete virions on the microscope grid by treatment with distilled water. A molecular model of hexon, known from the X-my crystallographic structure, was used to interpret Fourier-filtered images of the arrays, and to determine the relative orientations of the hexon molecules. The hexon-hexon interaction in the p3 array is that found in the virion facet, whereas that in the p6 array is a planar form of the interaction between peripentonal hexons around the vertex. <G 1986 Academic Press, Inc.
All adenoviruses have an icosahedral vi- rion of approximately constant size, which for type 2 (ad2) is 900 A in diameter cal- culated from a sphere touching all facets of the surrounding icosahedron (Burnett, 1985). The major coat protein of adenovi- rus, hexon, forms the 20 interlocking p3 facets of the outer capsid, each of which contain 12 hexons (Burnett, 1984; van Oos- trum and Burnett, 1984; van Oostrum et al., 1987). Penton, a complex between pen- ton base and fiber, occupies the 12 vertices of the outer capsid. The ad2 virion contains about 2700 polypeptides, derived from at least 10 different proteins, whose stoichio- metric ratios have been determined (van Oostrum and Burnett, 1985).
Mild dissociation of the virus first re- leases the pentons and their five surround- ing peripentonal hexons, and the remaining partial capsid then falls apart into 20 groups-
of-nine hexons (GONs) (Fig. 1) (Smith et al., 1965). Each GON arises from a facet from which the three peripentonal hexons have been removed. The GON is a planar assembly, which can be easily purified, con- taining 9 hexons and 12 copies of polypep- tide IX (van Oostrum and Burnett, 1985). The latter is a small protein that binds be- tween hexons to stabilize the capsid (Bur- nett, 1984). Crowther and Franklin (1972) showed that the hexons in the GON are distributed on a p3 net.
Adenoviral structural proteins are pres- ent in the infected cells in large excess and are easily purified (White et al., 1969). ad2 hexon contains three identical subunits of 967 amino acids (Akusjirvi et al., 1984) and forms three-dimensional crystals under var- ious conditions (Franklin et al., 1971). An X-ray crystallographic structure determi- nation of hexon is under way in our labo- ratory (Burnett, 1984). A 6-A resolution
’ Current address: Department of Biotechnology, envelope model showed the overall mor- CIBA-GEIGY AG, CH-4002 Basel, Switzerland. phology to be that of a pseudo-hexagonal
? To whom correspondence should be addressed. base with a superimposed triangular top (Fig. 77
0889-1605/86 $3.00 Copyright 0 1986 by Academic Press, Inc. All rights of reproduction in any form reserved.

VAN OOSTRUM ET AL. 78 FIBER
n
FIG. 1. Schematic view of the icosahedral adeno- virus capsid, showing the major external proteins. Dis- sociation of the capsid results in the loss of the 12 pentons, each a complex between penton base and fi- ber, and then the 60 peripentonal hexons surrounding the pentons at the vertices. Finally, 20 planar GONs are released. The GONs are left-handed when viewed from outside the capsid. Illustration by John Mack from Burnett (1984).
2) (Burnett et al., 1985). The polypeptide chain has recently been fitted to a 2.9 8, electron density map (Roberts et al., 1986). The structure shows the pseudo-hexagonal base to consist of three sets of two topolog- ically identical P-barrels, P 1 and P2 (Fig. 2). The two P-barrels are spatially similar and are arranged in an alternating fashion about a pseudo-sixfold, and exact threefold, mo- lecular axis. The /?-barrels form each of the six comers of the pseudo-hexagonal base. Two sets of vertical hexon-hexon contact faces in the pseudo-hexagonal base are dis- tinguished by reference to the three T do- mains, related by exact threefold symmetry, that form the triangular top of hexon. The A faces lie below the T domains and alter- nate with the B faces (Fig. 2).
The hexon crystals have the cubic space group P2,3, in which the arrangement of hexons does not reflect their packing in the adenovirus virion. The molecular shape led to a model for hexon packing, in which the 12 hexons in a capsid facet lie on a p3 net (Burnett, 1985). The hexons make asym- metric A:B facet contacts between their ver-
A FIG. 2. Symbolic representation of the trimeric
hexon molecule. A triangular top is superimposed on. a pseudo-hexagonal base. The A vertical hexon-hexon contact faces of the base are located under the apices of the triangular top, which correspond to the T do- mains in hexon. The comers of the hexagonal base are formed from Pl and P2 domains, which are similar eight-stranded flattened @-barrels. From Roberts et al. (1986).
B:B contacts at the facet edge (Fig. 3). The model was confirmed using averaged im- ages of GONs and a rotationally averaged image of a quarter-capsid, a capsid fragment containing five planar facets and a central penton (van Oostrum et al., 1987). GONs were stained at a very low level to empha- size their surface morphology, and the pre- cise relationship of the component hexons then was found using the X-ray crystallo- graphic model. The orientation of the per- ipentonal hexons, relative to those in the GON, was determined from the quarter- capsid.
Two types of hexon arrays have been re- ported previously. Pereira and Wrigley (1974) formed two-dimensional “holey” ar- rays of ad5 hexons from GONs purified form vu-ions disrupted by Na-deoxycholate and heat at pH 8.3. These GONs were treated with trypsin to prevent aggregation, and then dialyzed against 0.1 Mphosphatelcitric acid buffer at pH 5.0 and negatively stained with 2% phosphotungstic acid. The arrangement of hexons in the array was such that the GON could not be the repeating unit of the two-dimensional crystal, which was as- sumed to arise following partial disruption of the GONs. A similar arrangement was
tical basal faces, and symmetric A:A or observed by Carstens and Marusyk (1977)

ADENOVIRUS HEXON ARRAYS 79
G. 3. Model of the adenovirus capsid showing five interlocking facets. Each facet contains 12 aged on a planar p3 net. Asymmetric A:B interactions occur within the facets, and nonplanar syr and B:B contacts are found at the edges. From Burnett (1984).
hexons nmetric
after crystallization of hexons isolated from a crude extract of cells infected with ad5 virus. After storage for 3 to 4 weeks in 1 M KH2P04 at pH 4.4, holey sheets formed. A second type of two-dimensional crystal was obtained from ad1 hexons by Adam and N&z (1979) upon dialysis of purified ad1 hexons against 0.5 A4 acetate buffer at pH 4.5. These arrays showed a continuous ar- rangement of hexons, similar to the arrange- ment of hexons in the capsid facets (Adam and N&z, 198 1).
In the course of experiments designed to establish the orientation of the peripento- nal hexons (van Oostrum et al., 1987) we found two different two-dimensional arrays of ad2 hexons. The first was similar to the
continuous array described by Adam and N&z (1979) for ad1 hexons, and the second was a novel type of holey array, distinct from that reported by Pereira and Wrigley (1974). Both arrays were formed from puri- fied hexons directly on the microscope grid, but under different conditions.
MATERIALS AND METHODS
PuriJication procedures. The excess pool of adeno- viral structural proteins was obtained from human KB cells after infection with ad2 wild-type virus. After rup- turing the cells by repeated freezing and thawing, the suspension was DNAse treated at 37°C and centrifuged at 1500gfor 10 min, and the supematant was collected. The solution was extracted three times with equal vol- umes of Freon 113 (E. I. du Pont de Nemours and Co., Inc.), and the final aqueous phase was layered on a

80 VAN OOSTRUM ET AL.
FIG. 4. Electron micrograph showing numerous close-packed continuous arrays of hexons. The hexons were treated with acetate buffer at pH 4.8 before staining with 1% uranyl acetate. The scale bar shows 1000 A. Inset: Optical diffraction pattern of the hexagonal p3 hexon array, with cell dimensions a = b = 94 f 2 A, 01 = 120”. The scale bar shows 50 A-‘.
CsCl block gradient of density 1.2 to 1.4 g ml-‘. Until this stage, the hexon purification followed the isolation procedure of virions described in detail by van Oos- trum and Burnett (1985). After centrifugation for 3 hr at 4°C at 100 OOOg in a Beckman SW 27.1 rotor, the viral proteins were removed from the top of the gra- dient. Dialysis against 10 mM phosphate buffer, con- taining 150 mMNaC1 and 1 mMphenylmethylsulfony1 fluoride (pH 7.0) gave a coarse precipitate. After low- speed centrifugation, the supematant containing the bulk of hexon was collected and adsorbed onto a DEAE- Sephadex A-50 column, equilibrated with 10 mM phosphate buffer containing 150 mM NaCl at pH 7.0. The proteins were eluted from the column with a 50-
ml linear concentration gradient of NaCl from 0.15 to 1 .O M. All operations were performed at 4°C. Hexons eluted in fractions with a NaCl concentration of ap- proximately 0.55 M, and these were checked individ- ually for hexon purity using SDS-polyacrylamide gel electrophoresis.
Hexon was purified further by a crystallization step using the conditions of DGhner and Hudemann (1972) rather than those of Griitter and Franklin (1974), as the former were more efficient for bulk crystallization. Hexon was precipitated with 55% saturated ammo- nium sulfate (Gold Label, Aldrich Chemical Co.) and centrifuged. The precipitate was resolubilized in 10 mMphosphate buffer, containing 1 tiphenylmethyl-
FIGS. 5 AND 6. Electron micrographs showing rings of hexons forming “single-walled holey” arrays. FIG. 5. Arrays formed after hexons were treated with distilled water before staining with 1% many1 acetate.
The scale bar shows 1000 A. Inset: Optical diffraction pattern of the hexagonal p6 array, with cell dimensions a=b=153+2A,a=6O”.Scalebaris50A-‘.
FIG. 6. Arrays obtained after extensive disruption of complete virions on the grid with distilled water. This micrograph was taken with a Philips 301 electron microscope, and the scale bar shows 1000 A.

ADENOVIRUS HEXON ARRAYS 81
82 VAN OOSTRUM ET AL.
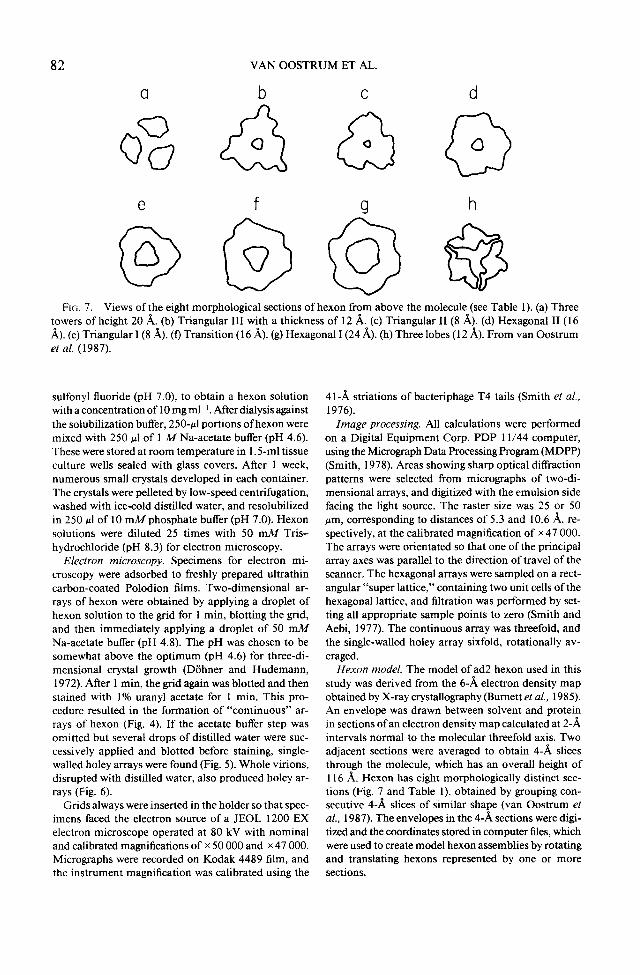
FIG. 7. Views of the eight morphological sections of hexon from above the molecule (see Table 1). (a) Three towers of height 20 A. (b) Triangular III with a thickness of 12 A. (c) Triangular II (8 A). (d) Hexagonal II (16 A). (e) Triangular I (8 A). (f) Transition (16 A). (g) Hexagonal I (24 A). (h) Three lobes (12 A). From van Oostrum et al. (1987).
sulfonyl fluoride (pH 7.0) to obtain a hexon solution with a concentration of 10 mg ml-‘. After dialysis against the solubilization buffer, 250~~1 portions of hexon were mixed with 250 ~1 of 1 M Na-acetate buffer (pH 4.6). These were stored at room temperature in 1 S-ml tissue culture wells sealed with glass covers. After 1 week, numerous small crystals developed in each container. The crystals were pelleted by low-speed centrifugation, washed with ice-cold distilled water, and resolubilized in 250 ~1 of 10 mM phosphate buffer (pH 7.0). Hexon solutions were diluted 25 times with 50 mM Tris- hydrochloride (pH 8.3) for electron microscopy.
Electron microscopy. Specimens for electron mi- croscopy were adsorbed to freshly prepared ultrathin carbon-coated Polodion films. Two-dimensional ar- rays of hexon were obtained by applying a droplet of hexon solution to the grid for 1 min, blotting the grid, and then immediately applying a droplet of 50 mM Na-acetate buffer (pH 4.8). The pH was chosen to be somewhat above the optimum (pH 4.6) for three-di- mensional crystal growth (Diihner and Hudemann, 1972). After 1 min, the grid again was blotted and then stained with 1% uranyl acetate for 1 min. This pro- cedure resulted in the formation of “continuous” ar- rays of hexon (Fig. 4). If the acetate buffer step was omitted but several drops of distilled water were suc- cessively applied and blotted before staining, single- walled holey arrays were found (Fig. 5). Whole virions, disrupted with distilled water, also produced holey ar- rays (Fig. 6).
Grids always were inserted in the holder so that spec- imens faced the electron source of a JEOL 1200 EX electron microscope operated at 80 kV with nominal and calibrated magnifications of x 50 000 and x 47 000. Micrographs were recorded on Kodak 4489 film, and the instrument magnification was calibrated using the
4 1 -A striations of bacteriphage T4 tails (Smith et al., 1976).
Image processing. All calculations were performed on a Digital Equipment Corp. PDP 1 l/44 computer, using the Micrograph Data Processing Program (MDPP) (Smith, 1978). Areas showing sharp optical diffraction patterns were selected from micrographs of two-di- mensional arrays, and digitized with the emulsion side facing the light source. The raster size was 25 or 50 pm, corresponding to distances of 5.3 and 10.6 A, re- spectively, at the calibrated magnification of x 47 000. The arrays were orientated so that one of the principal array axes was parallel to the direction of travel of the scanner. The hexagonal arrays were sampled on a rect- angular “super lattice,” containing two unit cells of the hexagonal lattice, and filtration was performed by set- ting all appropriate sample points to zero (Smith and Aebi, 1977). The continuous array was threefold, and the single-walled holey array sixfold, rotationally av- eraged.
Hexon model. The model of ad2 hexon used in this study was derived from the 6-A electron density map obtained by X-ray crystallography (Burnett et al., 1985). An envelope was drawn between solvent and protein in sections of an electron density map calculated at 2-A intervals normal to the molecular threefold axis. Two adjacent sections were averaged to obtain 4-A slices through the molecule, which has an overall height of 116 A. Hexon has eight morphologically distinct sec- tions (Fig. 7 and Table 1), obtained by grouping con- secutive 4-A slices of similar shape (van Oostrum et al., 1987). The envelopes in the 4-A sections were digi- tized and the coordinates stored in computer files, which were used to create model hexon assemblies by rotating and translating hexons represented by one or more sections.

ADENOVIRUS HEXON ARRAYS 83
TABLE I EIGHT MORPHOLOGICAL SECTIONS OF HEXON
Model Thickness Height Size Cavity section” Description (4 (‘9 (A) radius (A) Figure no. - 25-29 Three towers 20 116 e = 64 - 7a
r= 38 22-24 Triangular III 12 96 e= 88 7 7b
r= 50 20-2 1 Triangular II 8 84 e= 70 4 ?c
r=42 16-19 Hexagonal II 16 76 e, = 40, e2 = 50 7 7d
r = 44 14-15 Triangular I 8 60 e= 74 15 le
r = 44 IO-13 Transition 16 52 e, = 40, e2 = 55 15 7f
r= 50 4-9 Hexagonal I 24 36 e,, e2 = 52 22 7g
r=SO l-3 Three lobes 12 12 e = 46 - 7h
r = 40
Note. The height of hexon is 116 .& The size is given as the edge (e) of an idealized polygonal cross section, and the maximum radius (r) of actual density, e is the edge of a triangular section, and e, and e2 are the two edges of a pseudo-hexagonal section.
rl From Burnett et al. (1985). The table is taken from van Oostrum et al. (1987).
RESULTS
Array formation. The type of array was dependent on the conditions used. Contin- uous arrays were obtained using 50 mMNa- acetate buffer at pH 4.8 as a preciptant (Fig. 4). Single-walled holey arrays were obtained if distilled water, with a nominal pH of 6.3, was substituted for the Na-acetate buffer (Fig. 5). Washing with 50 mM Tris-hydro- chloride at pH 8.3, or immediate staining with uranyl acetate, gave electron micro- graphs showing only single hexons.
Single-walled holey arrays were observed occasionally after complete virions were ad- sorbed onto grids, followed by five succes- sive applications of distilled water, each lasting 10 to 15 set (Fig. 6). The distilled water treatment disintegrated the virions to an extent that depended on the length of the exposure. A total exposure of up to 20 set resulted in almost no disruption, whereas a 60-set exposure resulted in a large number of viral fragments among complete virions. ‘This technique occasionally also produced quarter-capsids (van Oostrum et al., 1987).
Array characteristics. Well-ordered ar- rays, containing at least 64 unit cells, were selected by the sharpness and extent of their optical diffraction patterns (Figs. 4 and 5). The unit cell dimensions of the arrays were calculated from the reciprocal lattice spac- ings on the optical diffraction patterns, the optical diffractometer scale factor, and the calibrated magnification of X 47 000. The single-walled holeyp6 arrays obtained from purified hexons had a unit cell with a = b = 153 f 3 A, (Y = 60”. The continuous p3 arrays showed a unit cell of a = b = 94 + 2 A, (Y = 120”. An image of a continuous p3 array was Fourier transformed, diffraction maxima selected to the (2,0) reflection, and back transformed with threefold symmetry imposed on the diffraction pattern to filter the image. The power loss was 3.1%, and the resultant resolution was 40 A. The trans- form of the single-walled holey p6 array was filtered using diffraction maxima out to the (3,0) reflection, corresponding to a resolu- tion of 44 A. Although higher-order reflec- tions were present, when included they did

84 VAN OOSTRUM ET AL.
FIGS. 8 AND 9. Images of the continuous hexon p3 array. Raster units of 5.3 8, are marked on the axes, FIG. 8. Image after rotational averaging, which caused a power loss of 3.1%. FIG. 9. Image of Fig. 8, contoured to outline the three regions of high density within each hexon.
not produce additional structural detail. The sixfold symmetry of the single-walled holey array already was evident from the image, but was tested by imposing threefold and sixfold symmetry. Both operations gave a power loss of 3.6%, indicating that the higher symmetry was present.
It is necessary to know whether hexons are base down or inverted for a correct in- terpretation of the images. Although var- ious groupings of planar GONs have been observed (Pereira and Wrigley, 1974), single GONs have two preferred interactions with the microscope grid. Hexons either contact the electron microscope grid with their pseudo-hexagonal bases, or are inverted with their triangular tops downward. If hexons are inverted, it is immediately apparent from the hand of the GON, which is defined by
the direction of the outer hexon duos with respect to the central hexon trio (Fig. 1) (Burnett, 1984). Although interpretation of the two-dimensional hexon arrays is not so straightforward, hexon bases are known to have an affinity for carbon film. Nermut and Perkins (1979) found that 75% of GONs were left-handed at pH 3.8 to 4.4 and 92% at pH 7.0 to 7.4. It is highly likely that the hexons in the p3 and p6 arrays also contact the grid with their bases, so that the view is from the hexon top downward. Since hex- ons lie on the threefold symmetry axes of the p3 and p6 arrays, their orientation is defined by a single axial rotation.
p3 array. The averaged image of the con- tinuous array revealed three symmetry-re- lated high-density areas within each hexon, set within a pseudo-hexagonal profile of

ADENOVIRUS HEXON ARRAYS 85
Fm. 10. A continuous p3 array in the form of a GON made from sections of the 6-A X-ray model of hexon. The hexon has been divided into three parts, each shown as a trio, to display hexon-hexon interactions in different regions of the molecule. For clarity, only four even-numbered sections have been plotted in each trio. The GON shows trios of hexons displaying their upper two morphological sections (TOP) (Table l), their middle three morphological sections (MIDDLE), and their bases, omitting the three lobes (BASE). From van Oostrum et ul. (1987).
lower density. A ridge of density runs be- tween neighboring hexons at the corners of the pseudo-hexagons so that hexons appear to be packed corner to comer (Figs. 8 and 9). The average orientation of the high-den- sity areas, relative to the p3 net connecting the centers of neighboring hexons, is -6”. The relative orientation of the hexons with respect to the p3 net, and the hexon-hexon distance of 94 A, indicate that the arrange- ment of the hexons in the continuous array is similar to that found in the GON. In the GON, hexons are close packed on a p3 net, with a hexon-hexon distance of 89 A, to
provide extensive intermolecular contacts through their pseudo-hexagonal bases (Bur- nett, 1985; van Oostrum et al., 1987).
Since hexons are packed in the continu- ous array in a manner similar to their ar- rangement in the GON, the information de- rived from the GON investigation could be used to interpret the image of the continu- ous array. An array of close-packed hexon bases gives a continuous layer of protein in contact with the microscope grid, with the exception of the basal cavities. Since little stain is likely to penetrate between neigh- boring bases, these would not be highly con-

86 VAN OOSTRUM ET AL.
FIGS. 11 AND 12. Images of the “single-walled holey” FIG. 11. Image after sixfold averaging, which caused FIG. 12. Image of Fig. 11, contoured to outline the tl
trasted in the image, which therefore must show hexon tops. The upper region of hexon commences above the top of the pseudo- hexagonal base, starting with the transition section at a height of 36 8, and extending to the top of the three towers at a height of 116 8, (Table 1 and Fig. 7). The three high- density features set within a pseudo-hex- agonal profile of lower density (Fig. 9) can be correlated with the morphological sec- tions described for the hexon model (Fig. 7). If full staining of the upper part is as- sumed, then the three high-density features in the image will correspond to the hexon towers.
The high densities in the hexon image lie directly above three of the six corners of the pseudo-hexagonal outline of lower density (Fig. 9). Two different hexagonal sections occur in hexon. The first is the pseudo-hex- agonal base (hexagonal I) up to a height of
array. Raster units of 10.6 A are marked on the axes. a power loss of 3.6%. lree high-density regions in each hexon.
36 A, and the second occurs in the middle of hexon from 60 to 76 A (hexagonal II) (Table 1 and Fig. 7). Two main arguments point to the assignment of the hexagonal projection to the hexagonal II section of hexon and not to the hexagonal I section in the base. The most convincing argument is that the corners of the hexagonal I section are about 30” away from the projected po- sitions of the towers, whereas the comers of the hexagonal II section lie beneath the tow- ers (Figs. 7 and 9). Only the latter position agrees with the image. Also, a considerable constraint on the packing is imposed by the hexon-hexon distance observed in the ar- ray, which is 94 t- 2 A. This agrees with the hexon-hexon distance of 89 8, deter- mined from hexon models close packed through their bases (hexagonal I sections) (Burnett, 1985). Comer-to-comer packing of hexagonal I sections would be ruled out

ADENOVIRUS HEXON ARRAYS 87
FIG. 13. A model “single-walled holey”p6 array showing three rings of hexons with five hexon tops (TOP), three hexon middle regions (MIDDLE), and five hexon bases (BASE). The hexon-hexon distance is 9 1 A, and the same molecular regions have been plotted as described in Fig. 10. All hexons make symmetric AA interactions and have their B faces exposed to the regular hole in the array,
by the resultant hexon-hexon separation of 100 %, (Table 1).
The high densities lie at - 6” from the p3 axis, which is slightly counterclockwise from the position expected from the staining model derived for the GONs (van Oostrum et al., 1987). There are two contact regions between hexons in the CON (van Oostrum et al., 1987). One is between the bases, and the other occurs in the upper part of hexon from sections 16 to 23 in the hexagonal II and triangular II and III sections (Table 1). This contact accounts for the ridges of den- sity between hexons in the averaged image of the p3 array (Figs. 8 and 9). The ridges also were clearly visible in averaged images of negatively stained GONs obtained from
conventional (van Oostrum et al., 1987) and scanning transmission electron microscopes (Furcinitti et al., in preparation). The hex- on-hexon distances obtained from these two approaches were 89 and 90 A, respectively, which agree closely. We conclude that hex- ons form the continuous p3 array in a man- ner identical to that seen in the GON, as illustrated in Fig. 10.
p6 array. The single-walled holey array has a distinctly different appearance from the holey array described by Pereira and Wrigley (1974). The single-walled holey ar- ray consists of rings, each containing six hexons, with neighboring rings sharing two hexons (Fig. 11). The holey arrays found earlier were formed from individual rings

88 VAN OOSTRUM ET AL.
of six hexons, packed together to give dou- ble-walled holey arrays. Both types of holey arrays have a regular absence at a position where a hexon would occur in continuous p3 arrays.
Each hexon in the single-walled holey ar- ray contains three equivalent high-density features, comparable with the high densities observed for hexons in the p3 array, located at - 18” from the axis connecting the centers of the holes (Fig. 12). The stain distribution in the holey array will be different from that in the p3 array. In the former, the stain can penetrate to grid level through the holes, whereas in the latter the close-packed hexon bases cover the grid. With normal stain levels, the rings of hexons will be fully con- trasted in the p6 array. However, since the bases are quite symmetric, they will provide a constant contribution to the image, which will arise almost exclusively from the hexon tops. This is clearly shown in images of GONs, fully stained using uranyl sulfate, where all the hexons within the GON have a similar appearance (Furcinitti et al., 1986).
Since the three high densities in the hex- ons within thep6 array correspond to hexon towers, there is a straightforward interpre- tation of the single-walled holey arrays. When hexon models are placed on a hex- agonal net to form close-packed rings of six hexons, with the hexon towers at - 18” from the net axes, hexons interact with each through their A faces (Fig. 13). The holes are surrounded by a ring of six B hexon faces. The hexon-hexon distance in this ar- ray is 91 A, in good agreement with the experimental value of 88 A.
Single-walled holey arrays also were ob- tained from disrupted vii-ions, and were similar in appearance to those formed from purified hexons. The arrays were much smaller and their optical diffraction patterns showed that they were poorly ordered and unsuitable for further analysis.
DISCUSSION
The formation of continuous and single- walled holey arrays from purified hexons,
directly on the microscope grid, is simple and relatively reproducible and yields many small areas of crystalline material. Small ar- rays in close proximity to each other have varying orientations and indicate formation of independent crystals rather than disrup- tion of an initially larger crystal. The rela- tively high hexon concentration (approxi- mately 0.4 mg ml-l) necessary for array formation in a short time presumably pro- vides many nucleation sites for arrays that grow until limited by contact with others. The poor quality and small size of the sin- gle-walled holey arrays obtained by hexons freed from disrupted virions may be due to the presence of other viral proteins, which interfere with the crystallization process. Arrays of the double-walled holey type de- scribed by Pereira and Wrigley ( 1974) were not observed.
Knowledge of the exact shape of hexon from the crystal structure was invaluable in recognizing molecular features in the elec- tron micrographs (van Oostrum et al., 1987). The combination of results from X-ray crystallography and electron microscopy has enabled a more detailed analysis of the ar- rays than that expected from their resolu- tion limits, which were 40 8, for the contin- uous array and 44 %, for the single-walled holey array. The hexon-hexon distance in the continuous array was 94 + 2 A, and the maximum densities were located at -6” from the p3 axis, close to the value of - 12” in the GON (van Oostrum et al., 1987). The hexon-hexon distances in minimally stained and fully stained GONs are 89 and 90 A, respectively (van Oostrum et aZ., 1987; Fur- cinitti et al., in preparation). The close agreement of these values is within exper- imental error, but may also indicate a slight- ly different arrangement of the hexons in the GON compared with those in the p3 array. The GON contains polypeptide IX in addition to hexons, and this protein oc- cupies the large cavities between the upper parts of hexon, but not the small cavities (Burnett, 1984; van Oostrum and Burnett, 1985). The role of polypeptide IX is to sta-

ADENOVIRUS HEXON ARRAYS 89
bilize the GON and it is possible that a slightly tighter arrangement occurs on bind- ing. This could explain the slight counter- clockwise shift of the high-density regions from -6 to - 12”, and the small decrease in the hexon-hexon distance.
The p3 arrays formed from purified ad2 hexon appear identical to those observed with ad1 hexons (Adam and N&z, 1979) which contained rows of hexon with every second row displaced by 47.5 A along the longitudinal axis, and a hexon-hexon dis- tance of 95 A. The arrays of ad 1 hexon were formed in 0.5 A4 Na-acetate buffer at pH 4.5. However, their conclusion that the two- dimensional crystals were the basis for the formation of three-dimensional crystals un- der the same conditions is questionable. Tetrahedral crystals of adl, ad2, ad5, and ad6 were obtained with the same buffer at pH 4.4 to 4.8, with the most rapid crystal- lization at pH 4.6 (Diihner and Hudemann, 1972). Although the space groups were not determined, all these were morphologically identical to hexon ad5 crystals obtained from 0.8 M phosphate buffer at pH 4.3 (Cornick et al., 1971) which had the space group P2,3. All the crystal forms of ad2 and ad5 hexon described so far, either tetrahedral or the rhombic dodecahedral form grown from 0.5 MNa-citrate buffer at pH 3.2 (Franklin et al., 197 l), have the same space group. Precession photographs of ad2 and ad5 rhombic dodecahedral crystals show that the cell edge for both is 150.5 +- 0.1 A (Roberts et al., 1987). The arrangement of hexons in the P2,3 unit cell is not planar and is there- fore different from that found in the two- dimensional p3 crystals. The formation of different crystalline arrays in two and three dimensions seems more likely. The fewer restrictions on the formation of two-dimen- sional crystals may explain their earlier ap- pearance.
There is an interesting correlation be- tween hexon interactions and pH. Planarp3 arrays form only below pH 5.0, as is the case for three-dimensional crystals. Ad2 crystals formed at pH 3.2 may be raised to
pH 5.0, but the crystals crack if the pH is raised to pH 5.5 (Burnett et al., 1985). The effect occurs near the isoelectric point of hexon, which is pH 4.5 for ad2 hexons, and suggests a change in hexon packing. This could occur directly through an alteration of charge, or indirectly through a charge- induced conformational change. A cluster of 16 contiguous glutamates and aspartates could provide the structural source of the effect (Burnett et al., 1985).
The formation of p3 arrays from purified hexons shows that free hexons can form fac- et-like assemblies in the absence of other proteins. However, there is no indication that the formation of individual planar fac- ets is an intermediate step in the assembly pathway of the virion. A more plausible case could be made for GONs as assembly in- termediates, as they self-assemble under certain conditions to form empty shells (Pereira and Wrigley, 1974). Even this scheme is very unlikely as a mutant virus lacking polypeptide IX, the other constit- uent of the GON, forms infectious particles (Colby and Shenk, 1981).
Single-walled holey p6 arrays form at a nominal pH of 6.3 from both purified hex- ons and virion hexons. It is surprising that virion hexons reassemble immediately in a holey arrangement, similar to that of the peripentonal hexons at the capsid vertices. The pH at which this occurs is closer to the physiological pH for virus assembly than that necessary for the formation of the p3 arrays (pH 4.6) or three-dimensional crys- tals (pH 4.4 to 4.8). The observation sug- gests that hexons in the infected cell are more likely to form a ring of peripentonal hexons than to form facets. The implication is that the vertex is the nucleation site for assembly of hexons into the virion.
Hexons form symmetric A:A interactions in the p6 array and at the capsid edge. The former are planar, but those in the virion are nonplanar and of two different types. Hexon forms no less than three distinct isol- ogous interactions through its A contact face. The planar A:A interaction must be quite
90 VAN OOSTRUM ET AL.
strong, as it is found not only in the p6 array but also at the interface between a pair of GONs associated in a planar configuration (Pereira and Wrigley, 1974). Both are ex- amples of twofold symmetry at an interface providing a powerful stabilizing influence on the configuration (Burnett, 1984). The same principle obtains in the vu-ion.
A slight lateral displacement can be seen in pairs of hexons involved in A:B (Fig. 10) and A:A interactions (Fig. 13). The direc- tion is the same in both cases, as it must be to permit close packing in the various as- semblies. The agreement confirms the gen- eral accuracy with which the relative hexon positions have been determined.
We thank Dr. H. S. Ginsberg, Dr. P. I. Freimuth, and Ulla Lundholm for their assistance in the produc- tion of adenovirus-infected cells, Dr. U. Aebi for mak- ing available his microdensitometer and Dr. L. Buhle, Jr., for advice and help in its use, and Hilary D. LaMonte for technical assistance. This investigation was sup- ported by Grant PCM 84-18 111 from the National Science Foundation and an Irma T. Hirsch1 Career Scientist Award to R.M.B., and Grant GM 26723 from the National Institute for General Medical Sciences to P.R.S.
REFERENCES ADAM, E., AND NAsz, I. (1979) Acta Microbial. Acad.
Sci. Hung. 26, 15-2 1. ADAM, E., AND N&z, I. (1981) Virology 114,265-267. AKUSJ;~RVI, G., ALESTRBM, P., PETTERSSON, M., LA-
GER, M., JKRNVALL, H., AND PETTERSSON, U. (1984) J. Biol. Chem. 259, 13976-13979.
BURNETT, R. M. (1984) in JURNAK, F. A., AND Mc- PHERSON, A. (Eds.), Biological Macromolecules and Assemblies, Vol. 1, Virus Structures, pp. 337-385, Wiley, New York.
BIJRNETT, R. M. (1985) J. Mol. Biol. 185, 125-143.
BURNETT, R. M., GR~~TTER, M. G., AND WHITE, J. L. (1985) J. Mol. Biol. 185, 105-123.
CARSTENS, E. B., AND MARUSYK, R. G. (1977) J. Gen. Virol. 34, 541-545.
COLBY, W. W., AND SHENK, T. (1981) J. Viral. 39,977- 980.
CORNICK, G., SIGLER, P. B., AND GINSBERG, H. S. (1971) J. Mol. Biol. 57, 397-401.
Crowther, R. A., and Franklin, R. M. (1972) J. Mol. Biol. 68, 181-184.
DGHNER, L., AND HUDEMANN, H. (1972) Arch. Ges. Virusforsch. 38, 279-289.
FRANKLIN, R. M., PETTERSSON, U., AKERVALL, K., STRANDBERG, B., AND PHILIPSON, L. (1971) J. Mol. Biol. 57, 383-395.
FIIRCINITTI, P. S., VAN OOSTRUM, J., WALL, J. S., AND BURNETT, R. M. (1986) in BAILEY, G. W. (Ed.), Pro- ceedings of the 44th Annual Meeting of the Electron Microscopy Society of America, pp. 153-l 54, San Francisco Press, San Francisco, CA.
GROTTER, M. G., AND FRANKLIN, R. M. (1974) J. Mol. Biol. 89, 163-178.
NERMIJT, M. V., AND PERKINS, W. J. (1979) Micron l&247-266.
PEREIRA, H. G., AND WRIGLEY, N. G. (1974) J. Mol. Biol. 85, 6 17-63 1.
ROBERTS, M. M., VAN OOSTRUM, J., AND BURNETT, R. M. (1987) Ann. N. Y. Acad. Sci. 494, 4 16-4 18.
ROBERTS, M. M., WHITE, J. L., GR~~TTER, M. G., AND BURNETT, R. M. (1986) Science 232, 1148-l 151.
SMITH, K. O., GEHLE, W. D., AND TROUSDALE, M. D. (1965) J. Bacterial. 90, 254-261.
SMITH, P. R. (1978) Ultramicroscopy 3, 153-160. SMITH, P. R., AND AEBI, U. (1977) J. Supramol. Struct.
5,493-495. SMITH, P. R.. AEBI, U., JOSEPHS, R., AND KESSEL, M.
(1976) J. Mol. Biol. 106, 243-275. VAN OOSTRIJM, J., AND BURNETT, R. M. (1984) Ann.
N. Y. Acad. Sci. 435, 578-58 1. VAN OOSTRUM, J., AND BURNETT, R. M. (1985) J. Viral.
56,439-448. VAN OOSTRUM, J., SMITH, P. R., MOHRAZ, M., AND
BURNETT, R. M. (1987) J. Mol. Biol., in press. WHITE, D. O., SCHARFF, M. D., AND MAIZEL, J. V., JR.
(1969) Virology 38, 395-406.