intrapartum results on differing degrees of...
TRANSCRIPT

Research ArticleIntrapartum Results on Differing Degrees of Ketonuria inNulliparous Women with Gestational Diabetes Mellitus duringSpontaneous Labor
Shi-Yun Huang , Bo Yu, Xin He, and Yi Chen
Beijing Obstetrics and Gynecology Hospital, Capital Medical University, Beijing 100026, China
Correspondence should be addressed to Yi Chen; [email protected]
Received 29 July 2019; Accepted 26 September 2019; Published 11 November 2019
Academic Editor: Rosaria Meccariello
Copyright © 2019 Shi-Yun Huang et al. *is is an open access article distributed under the Creative Commons AttributionLicense, which permits unrestricted use, distribution, and reproduction in any medium, provided the original work isproperly cited.
To compare intrapartum results associated with differing degrees of ketonuria in nulliparous women with gestational diabetesmellitus (GDM), we implemented a retrospective cohort study comparing clinical characteristics among differing degrees ofketonuria and the duration and distribution of ketonuria at different stages of labor. We also analyzed adverse maternal andneonatal outcomes for each group. A total of 570 GDM deliveries were included; of these, 238 had negative ketonuria (41.8%), 180had moderate ketonuria (31.6%), and 152 had ketosis (26.6%). *e proportion of patients with a family history of diabetessignificantly increased as the degree of ketonuria increased (P< 0.001). Moreover, a significantly lower level of HOMA-IR (theinsulin resistance index) was observed for the Negative group (P< 0.001). *e triglyceride (TG) level was significantly higher inthe Ketosis group (P< 0.001), and the total cholesterol (TC) levels significantly increased as the degree of ketonuria progressed(P< 0.001). *ere were also higher maternal blood sugar levels and a significantly higher proportion of oxytocin augmentation inketonuria cases (P< 0.001). Over three-fourths of patients (75.6%) had a ketonuria duration of ≤2 hours in the Moderate group,61.2% had a ketonuria duration of between 3 and 4 h in the Ketosis group, andmost of the ketonuria cases resolved in the first stageof labor. As the degree of ketonuria progressed, we observed a significantly higher number of cases with fetal heart rate pattern III(FHR pattern III), meconium-stained amniotic fluid III (MSAF III), postpartum hemorrhages, prolonged labor, neonatal hy-poglycemia, an umbilical cord arterial pH of <7.2, low Apgar scores, increased neonatal intensive care admissions, augmentedforceps-assisted deliveries, and conversions to cesarean sections. *e results showed that ketonuria is common during theintrapartum period and that the risk of adverse maternal and neonatal outcomes may increase when complicated with ketonuria.
1. Introduction
Gestational diabetes mellitus (GDM), the most commonmedical complication during pregnancy, is associated withadverse maternal and neonatal outcomes [1]. *e incidenceof GDM is positively correlated with ketone levels in oth-erwise healthy pregnant women [2]. Ketone bodies areformed from free fatty acids (FFA), and accelerated lipolysisand increased FFA are responsible for increased ketogenesisduring the second half of pregnancy. Moreover, severalhormones generated during pregnancy, including pro-gesterone, cortisol, and human placental lactogen, cancontribute to a diabetogenic state, presenting as insulin
resistance, increased lipolysis, augmented FFA, and keto-genesis [3].
Maternal ketonuria is a hyperosmolar condition, andketone bodies act as acidic compounds that bind bloodbicarbonates and lower serum pH [4]. In 1970, Felig andLynch first described a type of exaggerated fasting that couldresult in ketone overproduction during the second trimesterof pregnancy [5]. Similarly, Onyeije et al. found that ma-ternal ketonuria among patients with postterm pregnancywas associated with a significant increase in the occurrenceof oligohydramnios and a significant deceleration of fetalheart rate [6]. In addition, ketones diffuse freely across theplacenta and can be used as a source of energy by the fetus
HindawiInternational Journal of EndocrinologyVolume 2019, Article ID 7207012, 9 pageshttps://doi.org/10.1155/2019/7207012

[7], so Kurepa et al. suggested that a mother’s hyper-ketonemia plays a role in fetal development during preg-nancy [8]. Previous studies have also shown that maternalketones elicit potentially detrimental changes in the neu-rologic statuses of animals and human beings [9]. For ex-ample, a ketonic state in diabetic pregnant women has beenassociated with decreased intelligence and impaired finemotor skills in offspring [10]. *erefore, ketone bodies arebelieved to induce a variety of maternal metabolic de-rangements, including dehydration, hyperosmolarity, andketoacidosis, and to modulate fetal homeostasis [11].However, many hospital delivery units do not include ketonecontrol among routine recommendations to patients withGDM.
Diabetic pregnant women are predisposed to variationsin glucolipid metabolism and may be more prone to ke-togenesis compared to their nondiabetic counterparts [12].Physical stress during labor, compounded by reduced foodintake, can also lead to augmented levels of ketones in theblood and urine [13]. *e National Institute for Health andCare Excellence (NICE) recommends using variable rateintravenous insulin infusion (VRIII) to maintain capillaryglucose levels within a range of 4.0–7.0mmol/l, as well asmonitoring ketonuria during labor. Clear managementguidelines for ketonuria have also been recommended in thecase of diabetic ketoacidosis (DKA) [14]. However, acuteketoacidosis is an uncommon medical emergency that re-quires prompt treatment; it is different from ketosis, which isa natural state that allows the body to utilize fat for energy[15]. Although the presence of ketones during pregnancy isconsidered to be an abnormal physiologic response, it isunknown whether ketones present during labor in nor-moglycemic women are related to adverse intrapartumresults.
Monitoring urinary ketone levels is inexpensive andeasily performed by delivery units. However, there arelimited data available on ketonuria in patients with GDMduring the intrapartum period. In this retrospective ob-servational study, we first investigated the presence of dif-fering degrees of ketonuria (excluding acidosis) in womenwith GDM during labor. Second, we compared clinicalcharacteristics among different degrees of ketonuria (Neg-ative, Moderate, and Ketosis), as well as the duration ofketonuria and its distribution in different stages of labor.Finally, we analyzed adverse maternal and neonatal out-comes for each group.
2. Materials and Methods
We conducted a retrospective cohort study between April2018 and April 2019 at the Department of Beijing Obstetricsand Gynecology Hospital, Capital Medical University. *ecohort included only nulliparous women who had un-dergone singleton vaginal deliveries and had GDM. *einclusion criteria were ≥36 weeks of gestation in sponta-neous labor. All patients exhibited good metabolic controlduring gestation and were eligible for vaginal delivery. *emajority of patients exhibited diet-controlled GDM, whereasthe remaining women required a small amount of insulin
during pregnancy. Exclusion criteria were multiple preg-nancies, multiparous women, and women with abnormalrenal functions, including ketoacidosis, induced labor,precipitous delivery, hypertension, intrauterine growth re-striction, chorioamnionitis, women delivering at <36 weeksof gestation, and no extant measurement of maternalketonuria from the onset of labor.
*e control of maternal blood sugar levels (BSLs) duringlabor and delivery conformed to the management recom-mended by the Joint British Diabetes Societies (JBDS)guidelines [16]. Once labor was established, we evaluated thematernal BSL hourly; and for all women with GDM onhourly monitoring, the BSL was maintained within a targetrange (4− 7mmol/L). VRIII was started if two consecutiveBSL readings were above 7mmol/L; 0.9% NaCl with 5%glucose was used as the substrate fluid with VRIII. *e fluidwas administered at 50ml/h generally (the rate was adjustedto the volume status of the patient; see Supplemental Tablecited from the JBDS guidelines for more details).
According to the manufacturer’s protocol, ketonuria wasclassified into three levels: negative − /±, moderate +/++, andlarge +++/++++. *e criteria for diagnosing ketosis wereurinary ketones >++, and diagnosis of acidosis was a bloodgas pH <7.3 and/or bicarbonate <15mmol/L [14]. *eketonuria group was defined according to the highestketonuria results during labor. According to the ketonurialevel and diagnosis criteria for ketosis, women with GDMwere classified into three groups: group 1 (Negative group),group 2 (Moderate group), and group 3 (Ketosis group).
Ketonuria was initially tested within 2 h of the onset oflabor, and ketonuria was examined every 1-2 h during laborand delivery according to maternal BSL and ketonuria.When ketonuria was negative and maternal BSL was withinthe target range (4− 7mmol/L), ketonuria was examinedevery 2 h. When ketonuria was ≥+ or maternal BSL wasabove 7mmol/L consecutively, ketonuria was examinedhourly. As soon as ketonuria was ≥+, we routinely changedthe ketonuria status by administering the food/drink, hy-dration, or IV 0.9% NaCl with 5% dextrose, as appropriate, ifinadequate by mouth. If ketonuria status was still persistent,the affected women required an adjustment of VRIII (seeSupplemental Table here). Arterial blood gas was analyzed iftwo consecutive ketosis levels were observed.
Background medical data for the pregnant woman andnewborn were collected retrospectively from our antenatalcare records and partograms including age, family history ofdiabetes, pregestational body mass index (BMI), and in-cidence of using insulin therapy during pregnancy. An oralglucose tolerance test (OGTT) and the homeostasis modelassessment of insulin resistance (HOMA-IR) were recordedat 24− 28weeks of gestation. *e serum levels of hemoglobinA1c (HbA1c), triglycerides (TG), cholesterol (TC), high-density lipoprotein (HDLc), and low-density lipoprotein(LDLc) were determined retrospectively at 34− 36 weeks ofgestation. Intrapartum maternal variables included gesta-tional age at delivery, total duration of labor, BSL at the timeof delivery, mode of delivery and incidence of epiduralanalgesia, use of oxytocin augmentation, fetal heart ratepattern III (FHR pattern III), meconium-stained amniotic
2 International Journal of Endocrinology

fluid III (MSAF III), and postpartum hemorrhage. Weanalyzed the duration of the highest degree of ketonuria(from the onset of labor to delivery) according to differenttime periods (≤2 h, 3-4 h, 5-6 h, and >6 h). We also assessedthe distribution of ketonuria at different stages of labor.Neonatal variables included birth weight, analysis of um-bilical artery cord blood gas (pH), neonatal BSL at the timeof delivery, incidence of low Apgar scores, and admission tothe neonatal intensive care unit.
*e criteria we used to determine the onset of labor werestrong contractions at least every 5 minutes or an observedchange in cervical dilation with an uncertain contractionpattern. Moreover, MSAF III was opaque and had thickmeconium. *e FHR pattern III was established according tothe National Institute of Child Health and Human Devel-opment. Postpartum hemorrhage was defined as a bleedingvolume of more than 500mL during a vaginal delivery ormore than 1000mL during a cesarean section. *e deliveryneonatal BSL was that the one collected immediately prior todelivery. Neonatal hypoglycemia was defined as <2.6mmol/L.
*e statistical analysis was performed using the Statis-tical Package for the Social Sciences 19.0 (SPSS Inc., Chicago,IL, USA). In our study, continuous variables were all nor-mally distributed and expressed as mean± standard de-viation (mean± SD). Measurement data were comparedusing a one-way analysis of variance (ANOVA). If theANOVA revealed a significant interaction between thevariables, post hoc analyses were performed. Before themultiple comparisons were made, we looked at the signif-icance of the variance homogeneity test. If it was more than0.05, we carried out the Scheffe test to make multiplecomparisons; otherwise, we chose the Tamhane’s T2 test. Inaddition, categorical variables were expressed as percentages(%). *e Pearson chi-square test and Fisher’s exact testanalysis were used for categorical variables. A P value of<0.05 was considered to be statistically significant.
3. Results
A total of 570 deliveries by women with GDMwere includedin the study, and the differing degrees of ketonuria aresummarized in Figure 1. Of the deliveries, 238 were negativefor ketonuria (41.8%), 180 were moderate (31.6%), and 152were ketosis (26.6%).
*e associations between maternal baseline character-istics and ketonuria classification are summarized in Table 1.
*e mean maternal age of the study group was 32.1 years(ranging from 20 to 42 years), and we did not find anyrelationship between maternal age and ketonuria duringlabor. Neither pregestational BMI and gestational gainweight nor rate of insulin use during pregnancy was differentamong the three groups. We did, however, observe statis-tically significant associations between ketonuria classifi-cation and a family history of diabetes (5.9% in the Negativegroup, 15.0% in the Moderate group, and 20.4% in theKetosis group; P< 0.001). When we analyzed metabolicgestational characteristics, a significantly lower HOMA-IRwas found in the Negative group (1.60± 0.74 in the Negativegroup, 2.14± 0.89 in the Moderate group, and 2.36± 1.11 in
the Ketosis group; P< 0.001). In addition, the TG levels weresignificantly higher in the Ketosis group compared to theNegative and Moderate groups (3.32± 1.28 in the Ketosisgroup, 2.53± 0.90 in the Negative group, and 2.78± 1.20 inthe Moderate group; P< 0.001). Moreover, the TC levelsignificantly increased as the degree of ketonuria progressed(2.21± 0.70 in the Negative group, 3.60± 1.58 in the Mod-erate group, and 4.86± 1.52 in the Ketosis group; P< 0.001).Mean glucose at 0 h, 1 h, and 2 h and HbALc, HDLc, andLDLc levels were not significantly different among the threegroups.
*e intrapartum characteristics of the nulliparouswomen experiencing spontaneous labor are summarized inTable 2 according to ketonuria classification.
*e mean gestational age of the study group was39.1± 2.1 weeks (mean± SD; range, 36–40weeks), and therewas no relationship between the ketonuria level and ges-tational age. Moreover, we did not uncover any relationshipbetween birth weight or incidence of epidural analgesia andketonuria level. *ere was, however, a significantly higherproportion of use of oxytocin augmentation in the Moderateand Ketosis groups compared to the Negative group (21.1%and 26.3% vs. 10.5%; P< 0.001). In addition, we observed asignificantly lower maternal BSL at delivery in the Negativegroup, the majority of which fell within the target range of4− 7mmol/L (6.67± 0.71 in the Negative group, 7.00± 0.47in the Moderate group, and 7.13± 0.60 in the Ketosis group;P< 0.001). *e level of neonatal BSL at delivery also sig-nificantly decreased as the degree of ketonuria progressed(4.27± 0.57 in the Negative group, 3.77± 0.58 in theModerate group, and 3.56± 0.64 in the Ketosis group;P< 0.01). As to the total duration of labor, we observed asignificantly longer duration of labor in the Ketosis groupwhen compared to both the Negative and Moderate groups(13.85± 4.97 in the Ketosis group, 10.59± 4.88 in theNegative group, and 11.29± 4.83 in the Moderate group;P< 0.001). In addition, the Ketosis group had a significantlylonger duration of ketonuria compared to the Moderategroup (3.93± 1.54 vs. 2.87± 1.41, P< 0.001).
41.8%
31.6%
26.6%
NegativeModerateKetosis
Figure 1: Study groups (KET classification).
International Journal of Endocrinology 3

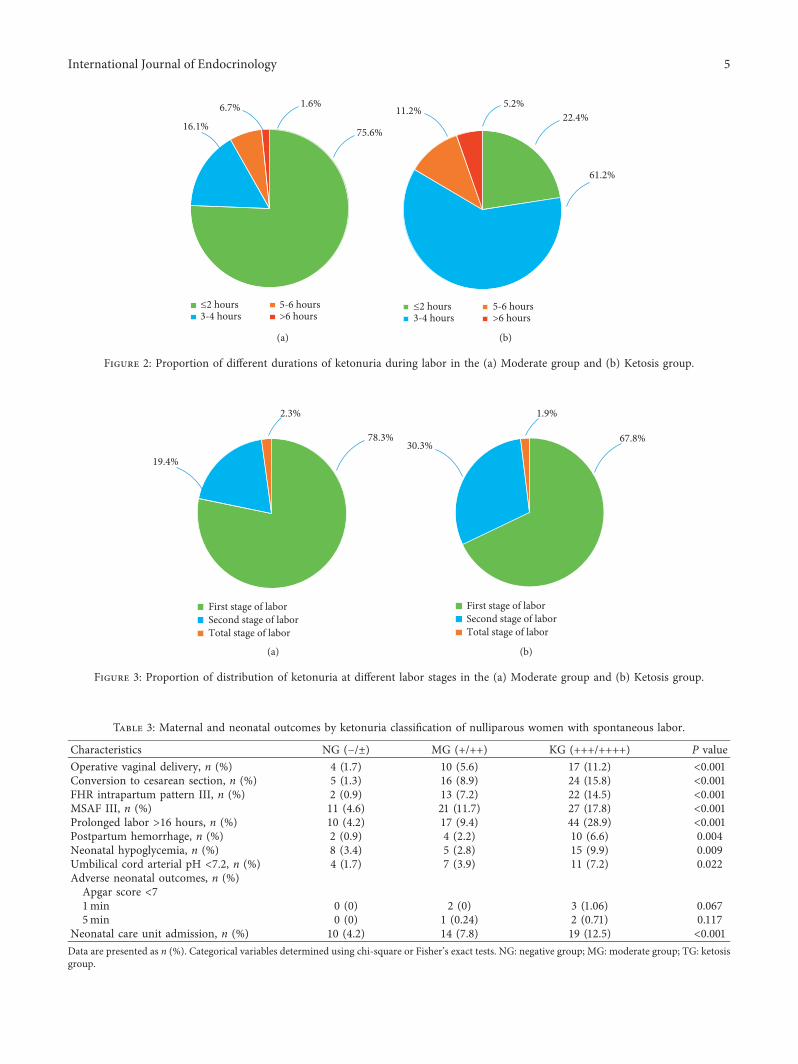
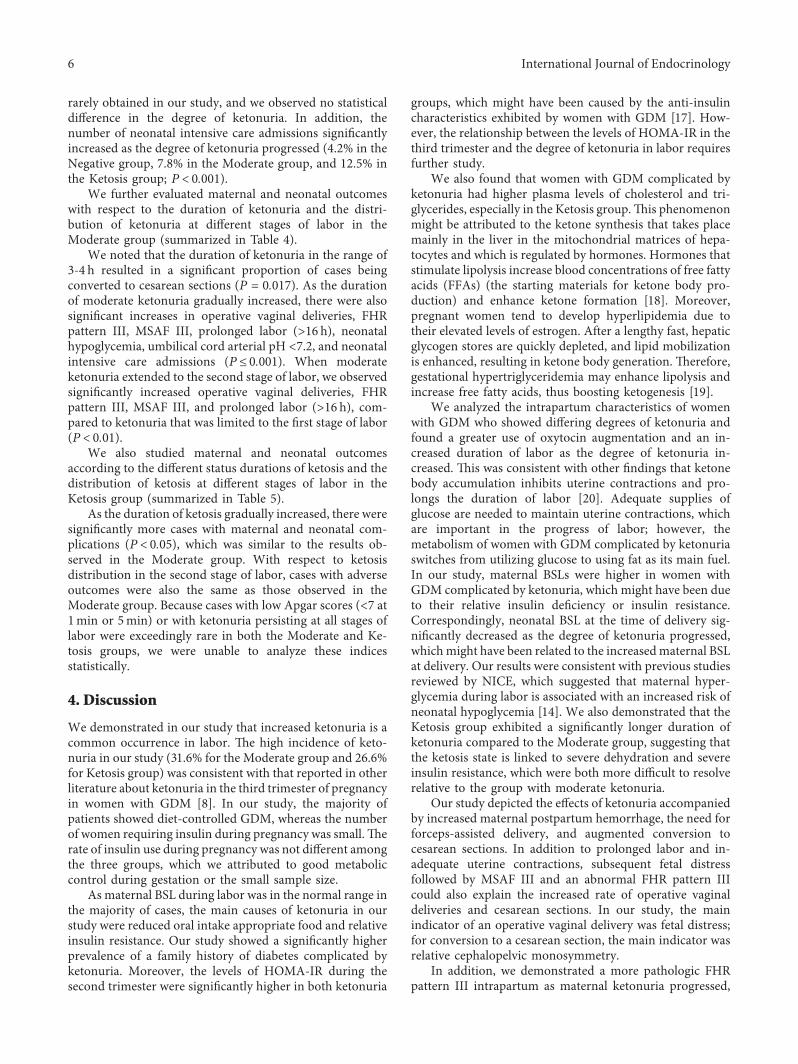
When we analyzed the different durations of ketonuria(Figure 2), we observed that in the Moderate group, 75.6%had a duration of moderate ketonuria of ≤2 h, 16.1%exhibited a duration of between 3 and 4 h, 6.7% exhibited aduration of 5-6 h, and 1.6% exhibited a duration of >6 h. Inthe Ketosis group, 22.4% of the duration of high ketonuriawas ≤2 h, 61.2% exhibited a duration of 3-4 h, 11.2%exhibited a duration of 5-6 h, and 5.2% exhibited a durationof >6 h. *e distribution of ketonuria at different stages oflabor is shown in Figure 3; as the figure shows, most of theketonuria state was resolved during the first stage (80% forthe Moderate group and 68.4% for the Ketosis group).
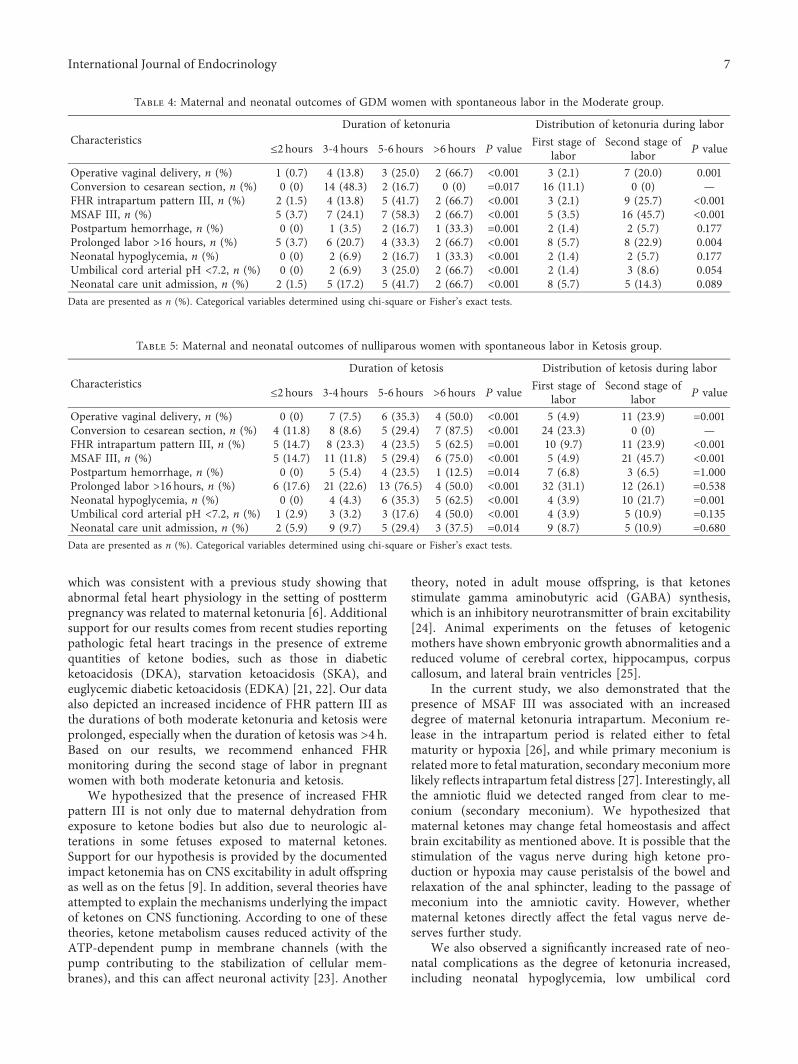
*e associations of maternal and neonatal outcomeswith ketonuria classification are summarized in Table 3.
We observed a significantly greater incidence of FHRpattern III intrapartum as the degree of ketonuria progressed(0.9% in the Negative group, 7.2% in the Moderate group,and 14.5% in the Ketosis group; P< 0.001) and a significantlyhigher amount of MSAF III (4.6% in the Negative group,11.7% in the Moderate group, and 17.8% in the Ketosisgroup; P< 0.001). In addition, a significantly higher numberof cases with postpartum hemorrhage were found as keto-nuria progressed (0.9% in the Negative group, 2.2% in the
Moderate group, and 6.6% in the Ketosis group; P � 0.004).Moreover, a significantly longer labor duration (>16 h) wasobserved in the Ketosis group compared to the Negative orModerate groups (28.9% in the Ketosis group, 4.2% in theNegative group, and 9.4% in theModerate group; P< 0.001).Regarding the mode of delivery, the vast majority (88.6%)were vaginal deliveries, and the rate of operative vaginaldelivery significantly increased as ketonuria progressed 1.7%for the Negative group, 5.6% for the Moderate group, and11.2% for the Ketosis group (P< 0.001). Of those womenwhose labor was converted to cesarean sections, the in-cidence in the Ketosis group increased 12.2 times comparedwith the Negative group and increased 1.8 times comparedwith the Moderate group (P< 0.001).
We also observed a significantly higher incidence ofneonatal hypoglycemia in the Ketosis group compared withboth the Negative and Moderate groups (9.9% in the Ketosisgroup, 3.4% in the Negative group, and 2.8% in theModerategroup; P � 0.009). Moreover, we observed a significantlyincreased incidence of umbilical artery pH <7.2 as the degreeof ketonuria increased (1.7% in the Negative group, 3.9% inthe Moderate group, and 7.2% in the Ketosis group;P � 0.022). Low Apgar scores (<7 at 1min or 5min) were
Table 1: Baseline characteristics by ketonuria classification of nulliparous women with spontaneous labor.
Characteristics NG (− /±) MG (+/++) KG (+++/++++) Overall P value Multiple comparisonAge (years) 31.84± 3.34 32.44± 3.23 32.24± 3.19 0.154 —Pregestational BM (kg/m2) 22.97± 3.33 22.96± 3.22 23.28± 3.58 0.616 —Gain weight (kg) 13.87± 2.86 13.59± 2.73 13.80± 2.86 0.539 —Family history of diabetes, n (%) 14 (5.9) 27 (15.0) 31 (20.4) <0.001 —Using insulin therapy during pregnancy, n (%) 6 (2.5) 11 (6.1) 9 (5.9) 0.147 —Pregnancy metabolic indicatorGlucose 0 h (OGTT) (mmol/l) 4.91± 0.40 4.88± 0.44 4.92± 0.46 0.673 —Glucose 1 h (OGTT) (mmol/l) 9.59± 1.50 9.87± 1.30 9.92± 1.30 0.064 —Glucose 2 h (OGTT) (mmol/l) 7.76± 1.34 8.07± 1.37 8.07± 1.30 0.075 —HbALc (%) 5.16± 0.35 5.23± 0.30 5.17± 0.29 0.066 —HOMA-IR (IU∗mmol/L) 1.60± 0.74 2.14± 0.89 2.36± 1.11 <0.001 NG<MG, TGTG (mmol/L) 2.53± 0.89 2.78± 1.19 3.32± 1.28 <0.001 NG, MG<TGTC (mmol/L) 2.21± 0.70 3.60± 1.58 4.86± 1.52 <0.001 NG<MG<TGHDLc (mmol/L) 1.63± 0.31 1.71± 0.36 1.70± 0.33 0.055 —LDLc (mg/dl) 2.90± 0.73 2.89± 0.79 2.91± 0.70 0.960 —
Data are presented as mean± SD or n (%). Overall P values for continuous variables determined using ANOVA and for categorical variables determined usingchi-square or Fisher’s exact tests. Multiple comparisons among the three groups were calculated using post hoc analysis (Scheffe or Tamhane’s T2 test). NG:negative group; MG: moderate group; TG: ketosis group.
Table 2: Intrapartum characteristics of nulliparous women with spontaneous labor by ketonuria classification.
Characteristics NG (− /±) MG (+/++) KG (+++/++++) Overall P value Multiple comparisonGestational age (weeks) 38.7± 1.2 38.9± 1.8 38.9± 0.9 0.277 —Birth weight (grams) 3370± 396.2 3408± 388.5 3413± 359.9 0.460 —Epidural analgesia, n (%) 182 (76.5) 137 (76.1) 116 (76.3) 0.997 —Oxytocin use during labor, n (%) 25 (10.5) 38 (21.1) 40 (26.3) <0.001 —Maternal BSL at delivery (mmol/L) 6.67± 0.71 7.00± 0.47 7.13± 0.60 <0.001 NG<MG, TGNeonatal BSL at delivery (mmol/L) 4.27± 0.57 3.77± 0.58 3.56± 0.64 <0.001 NG<MG<TGDuration of labor (hours) 10.59± 4.88 11.29± 4.83 13.85± 4.97 <0.001 NG, MG<TGUmbilical cord arterial pH 7.33± 0.06 7.31± 0.08 7.30± 0.73 0.008 NG<TGDuration of ketonuria (hours) — 2.87± 1.41 3.93± 1.54 <0.001 MG<TGData are presented as mean± SD or n (%). Overall P values for continuous variables determined using ANOVA and for categorical variables determined usingchi-square or Fisher’s exact tests. Multiple comparisons among the three groups were calculated using post hoc analysis (Scheffe or Tamhane’s T2 test). NG:negative group; MG: moderate group; TG: ketosis group.
4 International Journal of Endocrinology
First stage of laborSecond stage of laborTotal stage of labor
19.4%
78.3%
2.3%
(a)
First stage of laborSecond stage of laborTotal stage of labor
30.3%
1.9%
67.8%
(b)
Figure 3: Proportion of distribution of ketonuria at different labor stages in the (a) Moderate group and (b) Ketosis group.
Table 3: Maternal and neonatal outcomes by ketonuria classification of nulliparous women with spontaneous labor.
Characteristics NG (− /±) MG (+/++) KG (+++/++++) P valueOperative vaginal delivery, n (%) 4 (1.7) 10 (5.6) 17 (11.2) <0.001Conversion to cesarean section, n (%) 5 (1.3) 16 (8.9) 24 (15.8) <0.001FHR intrapartum pattern III, n (%) 2 (0.9) 13 (7.2) 22 (14.5) <0.001MSAF III, n (%) 11 (4.6) 21 (11.7) 27 (17.8) <0.001Prolonged labor >16 hours, n (%) 10 (4.2) 17 (9.4) 44 (28.9) <0.001Postpartum hemorrhage, n (%) 2 (0.9) 4 (2.2) 10 (6.6) 0.004Neonatal hypoglycemia, n (%) 8 (3.4) 5 (2.8) 15 (9.9) 0.009Umbilical cord arterial pH <7.2, n (%) 4 (1.7) 7 (3.9) 11 (7.2) 0.022Adverse neonatal outcomes, n (%)Apgar score <71min 0 (0) 2 (0) 3 (1.06) 0.0675min 0 (0) 1 (0.24) 2 (0.71) 0.117
Neonatal care unit admission, n (%) 10 (4.2) 14 (7.8) 19 (12.5) <0.001Data are presented as n (%). Categorical variables determined using chi-square or Fisher’s exact tests. NG: negative group; MG: moderate group; TG: ketosisgroup.
≤2 hours3-4 hours
5-6 hours>6 hours
75.6%16.1%
6.7% 1.6%
(a)
≤2 hours3-4 hours
5-6 hours>6 hours
22.4%11.2%5.2%
61.2%
(b)
Figure 2: Proportion of different durations of ketonuria during labor in the (a) Moderate group and (b) Ketosis group.
International Journal of Endocrinology 5
rarely obtained in our study, and we observed no statisticaldifference in the degree of ketonuria. In addition, thenumber of neonatal intensive care admissions significantlyincreased as the degree of ketonuria progressed (4.2% in theNegative group, 7.8% in the Moderate group, and 12.5% inthe Ketosis group; P< 0.001).
We further evaluated maternal and neonatal outcomeswith respect to the duration of ketonuria and the distri-bution of ketonuria at different stages of labor in theModerate group (summarized in Table 4).
We noted that the duration of ketonuria in the range of3-4 h resulted in a significant proportion of cases beingconverted to cesarean sections (P � 0.017). As the durationof moderate ketonuria gradually increased, there were alsosignificant increases in operative vaginal deliveries, FHRpattern III, MSAF III, prolonged labor (>16 h), neonatalhypoglycemia, umbilical cord arterial pH <7.2, and neonatalintensive care admissions (P≤ 0.001). When moderateketonuria extended to the second stage of labor, we observedsignificantly increased operative vaginal deliveries, FHRpattern III, MSAF III, and prolonged labor (>16 h), com-pared to ketonuria that was limited to the first stage of labor(P< 0.01).
We also studied maternal and neonatal outcomesaccording to the different status durations of ketosis and thedistribution of ketosis at different stages of labor in theKetosis group (summarized in Table 5).
As the duration of ketosis gradually increased, there weresignificantly more cases with maternal and neonatal com-plications (P< 0.05), which was similar to the results ob-served in the Moderate group. With respect to ketosisdistribution in the second stage of labor, cases with adverseoutcomes were also the same as those observed in theModerate group. Because cases with low Apgar scores (<7 at1min or 5min) or with ketonuria persisting at all stages oflabor were exceedingly rare in both the Moderate and Ke-tosis groups, we were unable to analyze these indicesstatistically.
4. Discussion
We demonstrated in our study that increased ketonuria is acommon occurrence in labor. *e high incidence of keto-nuria in our study (31.6% for the Moderate group and 26.6%for Ketosis group) was consistent with that reported in otherliterature about ketonuria in the third trimester of pregnancyin women with GDM [8]. In our study, the majority ofpatients showed diet-controlled GDM, whereas the numberof women requiring insulin during pregnancy was small.*erate of insulin use during pregnancy was not different amongthe three groups, which we attributed to good metaboliccontrol during gestation or the small sample size.
As maternal BSL during labor was in the normal range inthe majority of cases, the main causes of ketonuria in ourstudy were reduced oral intake appropriate food and relativeinsulin resistance. Our study showed a significantly higherprevalence of a family history of diabetes complicated byketonuria. Moreover, the levels of HOMA-IR during thesecond trimester were significantly higher in both ketonuria
groups, which might have been caused by the anti-insulincharacteristics exhibited by women with GDM [17]. How-ever, the relationship between the levels of HOMA-IR in thethird trimester and the degree of ketonuria in labor requiresfurther study.
We also found that women with GDM complicated byketonuria had higher plasma levels of cholesterol and tri-glycerides, especially in the Ketosis group.*is phenomenonmight be attributed to the ketone synthesis that takes placemainly in the liver in the mitochondrial matrices of hepa-tocytes and which is regulated by hormones. Hormones thatstimulate lipolysis increase blood concentrations of free fattyacids (FFAs) (the starting materials for ketone body pro-duction) and enhance ketone formation [18]. Moreover,pregnant women tend to develop hyperlipidemia due totheir elevated levels of estrogen. After a lengthy fast, hepaticglycogen stores are quickly depleted, and lipid mobilizationis enhanced, resulting in ketone body generation. *erefore,gestational hypertriglyceridemia may enhance lipolysis andincrease free fatty acids, thus boosting ketogenesis [19].
We analyzed the intrapartum characteristics of womenwith GDM who showed differing degrees of ketonuria andfound a greater use of oxytocin augmentation and an in-creased duration of labor as the degree of ketonuria in-creased. *is was consistent with other findings that ketonebody accumulation inhibits uterine contractions and pro-longs the duration of labor [20]. Adequate supplies ofglucose are needed to maintain uterine contractions, whichare important in the progress of labor; however, themetabolism of women with GDM complicated by ketonuriaswitches from utilizing glucose to using fat as its main fuel.In our study, maternal BSLs were higher in women withGDM complicated by ketonuria, which might have been dueto their relative insulin deficiency or insulin resistance.Correspondingly, neonatal BSL at the time of delivery sig-nificantly decreased as the degree of ketonuria progressed,whichmight have been related to the increasedmaternal BSLat delivery. Our results were consistent with previous studiesreviewed by NICE, which suggested that maternal hyper-glycemia during labor is associated with an increased risk ofneonatal hypoglycemia [14]. We also demonstrated that theKetosis group exhibited a significantly longer duration ofketonuria compared to the Moderate group, suggesting thatthe ketosis state is linked to severe dehydration and severeinsulin resistance, which were both more difficult to resolverelative to the group with moderate ketonuria.
Our study depicted the effects of ketonuria accompaniedby increased maternal postpartum hemorrhage, the need forforceps-assisted delivery, and augmented conversion tocesarean sections. In addition to prolonged labor and in-adequate uterine contractions, subsequent fetal distressfollowed by MSAF III and an abnormal FHR pattern IIIcould also explain the increased rate of operative vaginaldeliveries and cesarean sections. In our study, the mainindicator of an operative vaginal delivery was fetal distress;for conversion to a cesarean section, the main indicator wasrelative cephalopelvic monosymmetry.
In addition, we demonstrated a more pathologic FHRpattern III intrapartum as maternal ketonuria progressed,
6 International Journal of Endocrinology
which was consistent with a previous study showing thatabnormal fetal heart physiology in the setting of posttermpregnancy was related to maternal ketonuria [6]. Additionalsupport for our results comes from recent studies reportingpathologic fetal heart tracings in the presence of extremequantities of ketone bodies, such as those in diabeticketoacidosis (DKA), starvation ketoacidosis (SKA), andeuglycemic diabetic ketoacidosis (EDKA) [21, 22]. Our dataalso depicted an increased incidence of FHR pattern III asthe durations of both moderate ketonuria and ketosis wereprolonged, especially when the duration of ketosis was >4 h.Based on our results, we recommend enhanced FHRmonitoring during the second stage of labor in pregnantwomen with both moderate ketonuria and ketosis.
We hypothesized that the presence of increased FHRpattern III is not only due to maternal dehydration fromexposure to ketone bodies but also due to neurologic al-terations in some fetuses exposed to maternal ketones.Support for our hypothesis is provided by the documentedimpact ketonemia has on CNS excitability in adult offspringas well as on the fetus [9]. In addition, several theories haveattempted to explain the mechanisms underlying the impactof ketones on CNS functioning. According to one of thesetheories, ketone metabolism causes reduced activity of theATP-dependent pump in membrane channels (with thepump contributing to the stabilization of cellular mem-branes), and this can affect neuronal activity [23]. Another
theory, noted in adult mouse offspring, is that ketonesstimulate gamma aminobutyric acid (GABA) synthesis,which is an inhibitory neurotransmitter of brain excitability[24]. Animal experiments on the fetuses of ketogenicmothers have shown embryonic growth abnormalities and areduced volume of cerebral cortex, hippocampus, corpuscallosum, and lateral brain ventricles [25].
In the current study, we also demonstrated that thepresence of MSAF III was associated with an increaseddegree of maternal ketonuria intrapartum. Meconium re-lease in the intrapartum period is related either to fetalmaturity or hypoxia [26], and while primary meconium isrelated more to fetal maturation, secondary meconiummorelikely reflects intrapartum fetal distress [27]. Interestingly, allthe amniotic fluid we detected ranged from clear to me-conium (secondary meconium). We hypothesized thatmaternal ketones may change fetal homeostasis and affectbrain excitability as mentioned above. It is possible that thestimulation of the vagus nerve during high ketone pro-duction or hypoxia may cause peristalsis of the bowel andrelaxation of the anal sphincter, leading to the passage ofmeconium into the amniotic cavity. However, whethermaternal ketones directly affect the fetal vagus nerve de-serves further study.
We also observed a significantly increased rate of neo-natal complications as the degree of ketonuria increased,including neonatal hypoglycemia, low umbilical cord
Table 4: Maternal and neonatal outcomes of GDM women with spontaneous labor in the Moderate group.
CharacteristicsDuration of ketonuria Distribution of ketonuria during labor
≤2 hours 3-4 hours 5-6 hours >6 hours P value First stage oflabor
Second stage oflabor P value
Operative vaginal delivery, n (%) 1 (0.7) 4 (13.8) 3 (25.0) 2 (66.7) <0.001 3 (2.1) 7 (20.0) 0.001Conversion to cesarean section, n (%) 0 (0) 14 (48.3) 2 (16.7) 0 (0) �0.017 16 (11.1) 0 (0) —FHR intrapartum pattern III, n (%) 2 (1.5) 4 (13.8) 5 (41.7) 2 (66.7) <0.001 3 (2.1) 9 (25.7) <0.001MSAF III, n (%) 5 (3.7) 7 (24.1) 7 (58.3) 2 (66.7) <0.001 5 (3.5) 16 (45.7) <0.001Postpartum hemorrhage, n (%) 0 (0) 1 (3.5) 2 (16.7) 1 (33.3) �0.001 2 (1.4) 2 (5.7) 0.177Prolonged labor >16 hours, n (%) 5 (3.7) 6 (20.7) 4 (33.3) 2 (66.7) <0.001 8 (5.7) 8 (22.9) 0.004Neonatal hypoglycemia, n (%) 0 (0) 2 (6.9) 2 (16.7) 1 (33.3) <0.001 2 (1.4) 2 (5.7) 0.177Umbilical cord arterial pH <7.2, n (%) 0 (0) 2 (6.9) 3 (25.0) 2 (66.7) <0.001 2 (1.4) 3 (8.6) 0.054Neonatal care unit admission, n (%) 2 (1.5) 5 (17.2) 5 (41.7) 2 (66.7) <0.001 8 (5.7) 5 (14.3) 0.089Data are presented as n (%). Categorical variables determined using chi-square or Fisher’s exact tests.
Table 5: Maternal and neonatal outcomes of nulliparous women with spontaneous labor in Ketosis group.
CharacteristicsDuration of ketosis Distribution of ketosis during labor
≤2 hours 3-4 hours 5-6 hours >6 hours P value First stage oflabor
Second stage oflabor P value
Operative vaginal delivery, n (%) 0 (0) 7 (7.5) 6 (35.3) 4 (50.0) <0.001 5 (4.9) 11 (23.9) �0.001Conversion to cesarean section, n (%) 4 (11.8) 8 (8.6) 5 (29.4) 7 (87.5) <0.001 24 (23.3) 0 (0) —FHR intrapartum pattern III, n (%) 5 (14.7) 8 (23.3) 4 (23.5) 5 (62.5) �0.001 10 (9.7) 11 (23.9) <0.001MSAF III, n (%) 5 (14.7) 11 (11.8) 5 (29.4) 6 (75.0) <0.001 5 (4.9) 21 (45.7) <0.001Postpartum hemorrhage, n (%) 0 (0) 5 (5.4) 4 (23.5) 1 (12.5) �0.014 7 (6.8) 3 (6.5) �1.000Prolonged labor >16 hours, n (%) 6 (17.6) 21 (22.6) 13 (76.5) 4 (50.0) <0.001 32 (31.1) 12 (26.1) �0.538Neonatal hypoglycemia, n (%) 0 (0) 4 (4.3) 6 (35.3) 5 (62.5) <0.001 4 (3.9) 10 (21.7) �0.001Umbilical cord arterial pH <7.2, n (%) 1 (2.9) 3 (3.2) 3 (17.6) 4 (50.0) <0.001 4 (3.9) 5 (10.9) �0.135Neonatal care unit admission, n (%) 2 (5.9) 9 (9.7) 5 (29.4) 3 (37.5) �0.014 9 (8.7) 5 (10.9) �0.680Data are presented as n (%). Categorical variables determined using chi-square or Fisher’s exact tests.
International Journal of Endocrinology 7
arterial pH, low Apgar scores, and increased neonatal in-tensive care admissions. *is was especially true when theduration of ketosis was >4 h and ketosis extended to thesecond stage of labor. We rarely observed low Apgar scoresin our study, but this might have been due to our strictketone monitoring and elimination. Our primary indicatorfor neonatal intensive care admission was respiratorydistress.
*e adverse neonatal outcomes we uncovered may berelated to ketone bodies participating in maternal metabolicderangements and even changing fetal homeostasis. Long-standing ketonuria is considered to be a surrogate measureof both dehydration and caloric balance [28], and maternalketonemia that results in ketonuria is a hyperosmolarcondition [29]. Studies on sheep showed that maternalconditions involving hyperosmolarity (such as maternaldehydration) resulted in a diminution of fetal amniotic fluidvolume from decreased fetal urination [30], potentially dueto attenuated fetal production of atrial natriuretic factor [31].Similarly, several human studies showed that maternalhydration resulted in a significant increase in amniotic fluidvolume [32]. Moreover, investigators have detected within5min in fetal plasma the presence of radio-labeledβ-hydroxybutyrate (one of three ketone bodies) adminis-tered to pregnant rats through the femoral vein [33]. Otherstudies of offspring exposed in utero to maternal de-hydration showed evidence of specific nutritional de-ficiencies affecting fetal brain development [34].
*ere were a few limitations to our study. First, it was aretrospective design. Second, because this study was per-formed at a single center and included a small cohort size,the small number of low Apgar scores could not be analyzedstatistically among women with GDM with differing du-rations and distributions of ketonuria. Moreover, the fewadverse maternal and neonatal outcomes could not be ap-propriately analyzed with correlation and regression ana-lyses. Finally, maternal ketonuria is considered an indirectcause of changes in fetal homeostasis. We did not assess therelationship between maternal ketonemia and fetal keto-nemia at delivery, so this needs to be further addressed.However, our study was the first to emphasize the impor-tance of surveying the degrees of ketonuria and the durationand distribution of ketonuria in nulliparous women withGDM during labor.
5. Conclusions
In conclusion, we showed in the present study that maternalketonuria is fairly common in the intrapartum period fornulliparous women with GDM. When ketonuria manifests,the fetus may face increased risks of maternal and neonatalcomplications and increased operative vaginal deliveries andconversions to cesarean sections. *erefore, we suggest thatin the context of ketonuria, monitoring of the fetal heart rateduring labor and delivery should be increased in bothmoderate ketonuria and ketosis states. *at being said, ourresults need to be further confirmed by prospective studiesand the use of regression analyses. Eventually, the presenceof ketonuria during labor will require intensive monitoring,
and randomized studies should be undertaken to determinethe effects of treating maternal ketonuria on perinataloutcomes.
Data Availability
*e data used to support the findings of this study areavailable from the corresponding author upon request.
Conflicts of Interest
*e authors have no conflicts of interest regarding this study.
Authors’ Contributions
Shi-Yun Huang and Bo Yu contributed equally to this work.
Acknowledgments
*is study was financed by Beijing Obstetrics and Gyne-cology Hospital, Capital Medical University. *e authorsthank the professional consultation received regardingstatistical analyses. *e authors also thank LetPub (https://www.letpub.com) for its linguistic assistance during thepreparation of this manuscript.
Supplementary Materials
Our supplementary material file was about the protocol ofintravenous insulin for labor in our study. SupplementalTable: intravenous insulin prescription and protocol forlabor. (Supplementary Materials)
References
[1] S. L. Yong, B. K. Ng, M. A. J. Mohd Yassin, S. Z. Syed Zakaria,and N. A. Mohamed Ismail, “Impact of late pregnancyhaemoglobin A1c at 29-30 weeks’ gestation on adversepregnancy outcomes among women with pre-existing di-abetes: a retrospective analysis,” Journal of Obstetrics andGynaecology, vol. 38, no. 4, pp. 461–465, 2018.
[2] M. G. Dalfra, S. Burlina, G. Sartore, and A. Lapolla,“Ketoacidosis in diabetic pregnancy,” (e Journal of Mater-nal-Fetal & Neonatal Medicine, vol. 29, no. 17, pp. 2889–2895,2018.
[3] H. L. Robinson, H. L. Barrett, K. Foxcroft, L. K. Callaway, andM. Dekker Nitert, “Prevalence of maternal urinary ketones inpregnancy in overweight and obese women,” ObstetricMedicine, vol. 11, no. 2, pp. 79–82, 2018.
[4] S. Misra and N. S. Oliver, “Utility of ketone measurement inthe prevention, diagnosis and management of diabeticketoacidosis,” Diabetic Medicine, vol. 32, no. 1, pp. 14–23,2015.
[5] P. Felig and V. Lynch, “Starvation in human pregnancy:hypoglycemia, hypoinsulinemia, and hyperketonemia,” Sci-ence, vol. 170, no. 3961, pp. 990–992, 1970.
[6] C. I. Onyeije and M. Y. Divon, “*e impact of maternalketonuria on fetal test results in the setting of posttermpregnancy,” American Journal of Obstetrics and Gynecology,vol. 184, no. 4, pp. 713–718, 2001.
[7] L. Spanou, K. Dalakleidi, K. Zarkogianni et al., “Ketonemiaand ketonuria in gestational diabetes mellitus,” Hormones(Athens), vol. 14, no. 4, pp. 644–650, 2015.
8 International Journal of Endocrinology

[8] D. Kurepa, A. K. Pramanik, V. Kakkilaya et al., “Elevatedacetoacetate and monocyte chemotactic protein-1 levels incord blood of infants of diabetic mothers,” Neonatology,vol. 102, no. 3, pp. 163–168, 2012.
[9] A. Bronisz, M. Ozorowski, and M. Hagner-Derengowska,“Pregnancy ketonemia and development of the fetal centralnervous system,” International Journal of Endocrinology,vol. 2018, Article ID 1242901, 7 pages, 2018.
[10] M. DeCapo, J. R. *ompson, G. Dunn, and E. L. Sullivan,“Perinatal nutrition and programmed risk for neuropsychi-atric disorders: a focus on animal models,” Biological Psy-chiatry, vol. 85, no. 2, pp. 122–134, 2019.
[11] D. G. Cotter, D. A. d’Avignon, A. E. Wentz, M. L. Weber, andP. A. Crawford, “Obligate role for ketone body oxidation inneonatal metabolic homeostasis,” Journal of BiologicalChemistry, vol. 286, no. 9, pp. 6902–6910, 2011.
[12] S. N. Bryant, C. L. Herrera, D. B. Nelson, andF. G. Cunningham, “Diabetic ketoacidosis complicatingpregnancy,” Journal of Neonatal-Perinatal Medicine, vol. 10,no. 1, pp. 17–23, 2017.
[13] R. M. Ehsanipoor, G. Saccone, N. S. Seligman, R. A. M. Pierce-Williams, A. Ciardulli, and V. Berghella, “Intravenous fluidrate for reduction of cesarean delivery rate in nulliparouswomen: a systematic review and meta-analysis,” ActaObstetricia et Gynecologica Scandinavica, vol. 96, no. 7,pp. 804–811, 2017.
[14] National Collaborating Centre for Women’s and Children’sHealth, Diabetes in Pregnancy: Management of Diabetes andits Complications from Preconception to the Postnatal Period,National Institute for Health and Care Excellence: ClinicalGuidelines, London, UK, 2015.
[15] U. Dashora, H. R. Murphy, R. C. Temple et al., “Managinghyperglycaemia during antenatal steroid administration, la-bour and birth in pregnant women with diabetes,” DiabeticMedicine, vol. 35, no. 8, pp. 1005–1010, 2018.
[16] Joint British Diabetes Societiesfor Inpatient Care Group,“Management of glycaemic control in pregnant women withdiabetes on obstetric wards and delivery units,” May 2017,https://www.diabetes.org.uk/joint-british-diabetes-society.
[17] A. Chelliah, J. Walejko, M. Ho et al., “605: metabolomic al-terations in pregestational diabetic placentas at term,”American Journal of Obstetrics and Gynecology, vol. 216, no. 1,p. S356, 2017.
[18] K. Sikder, S. K. Shukla, N. Patel, H. Singh, and K. Rafiq, “Highfat diet upregulates fatty acid oxidation and ketogenesis viaintervention of PPAR-c,” Cellular Physiology and Bio-chemistry, vol. 48, no. 3, pp. 1317–1331, 2018.
[19] S. C. Simmons, D. P. Dorn, C. M. Walton, L. A. Williams 3rd,and H. P. Pham, “Hypertriglyceridemia in pregnancy,”Transfusion, vol. 57, no. 12, pp. 2824-2825, 2017.
[20] J. Pare, J. C. Pasquier, A. Lewin, W. Fraser, and Y. A. Bureau,“Reduction of total labor length through the addition ofparenteral dextrose solution in induction of labor in nullip-arous: results of DEXTRONS prospective randomized con-trolled trial,” American Journal of Obstetrics and Gynecology,vol. 216, no. 5, pp. 508.e1–508.e7, 2017.
[21] J. M. Chausse, F. Paruk, S. Motilall, P. Soma-Pillay, andS. Ndaba, “Starvation ketoacidosis in pregnancy presenting aseuglycaemic, high anion gap metabolic acidosis: a case reporthighlighting the significance of early recognition and promptintervention,” South African Medical Journal, vol. 108, no. 8,pp. 636–639, 2018.
[22] U. Graham, I. Cooke, and D. McCance, “A case of euglya-cemic diabetic ketoacidosis in a patient with gestational
diabetes mellitus,” Obstetric Medicine, vol. 7, no. 4, pp. 174–176, 2014.
[23] S. A. Masino and J. M. Rho, “Metabolism and epilepsy: ke-togenic diets as a homeostatic link,” Brain Research, vol. 1703,no. 1, pp. 26–30, 2019.
[24] K. Augustin, A. Khabbush, S. Williams et al., “Mechanisms ofaction for the medium-chain triglyceride ketogenic diet inneurological and metabolic disorders,”(e Lancet Neurology,vol. 17, no. 1, pp. 84–93, 2018.
[25] Y. Ling, D. D. Wang, Y. X. Sun, D. J. Zhao, and H. Ni, “Neuro-behavioral status and the hippocampal expression of metabolicassociated genes in wild-type rat following a ketogenic diet,”Frontiers in Neurology, vol. 10, no. 65, Article ID 30804881,2019.
[26] L. Hiersch, E. Krispin, N. Linder et al., “Meconium-stainedamniotic fluid and neonatal morbidity in low-risk pregnanciesat term: the effect of gestational age,” American Journal ofPerinatology, vol. 34, no. 2, pp. 183–190, 2017.
[27] V. Rodrıguez Fernandez, C. N. Lopez Ramon y Cajal, E. MarınOrtiz, and E. Couceiro Naveira, “Intrapartum and perinatalresults associated with different degrees of staining of me-conium stained amniotic fluid,” European Journal of Ob-stetrics & Gynecology and Reproductive Biology, vol. 228,pp. 65–70, 2018.
[28] R. L. Veech, P. C. Bradshaw, K. Clarke, W. Curtis,R. Pawlosky, and M. T. King, “Ketone bodies mimic the lifespan extending properties of caloric restriction,” IUBMB Life,vol. 69, no. 5, pp. 305–314, 2017.
[29] L. Hui and L. Shuying, “Acute starvation ketoacidosis inpregnancy with severe hypertriglyceridemia: a case report,”Medicine (Baltimore), vol. 97, no. 19, p. e0609, 2018.
[30] R. A. Brace, C. Y. Cheung, and D. F. Anderson, “Regulation ofamniotic fluid volume: insights derived from amniotic fluidvolume function curves,” American Journal of Physiology-Regulatory, Integrative and Comparative Physiology, vol. 315,no. 4, pp. R777–R789, 2018.
[31] H. Zhang, Y. Fan, F. Xia et al., “Prenatal water deprivationalters brain angiotensin system and dipsogenic changes in theoffspring,” Brain Research, vol. 1382, no. 3, pp. 128–136, 2011.
[32] K. Ulker, “Maternal hydration therapy improves the quantityof amniotic fluid and the pregnancy outcome in third-tri-mester isolated oligohydramnios,” Journal of Ultrasound inMedicine, vol. 33, no. 5, p. 922, 2014.
[33] D. W. Seccombe, P. G. R. Harding, and F. Possmayer, “Fetalutilization of maternally derived ketone bodies for lipogenesisin the rat,” Biochimica et Biophysica Acta (BBA)—Lipids andLipid Metabolism, vol. 488, no. 3, pp. 402–416, 1977.
[34] G. Koren, A. Ornoy, and M. Berkovitch, “Hyperemesisgravidarum-is it a cause of abnormal fetal brain develop-ment?,” Reproductive Toxicology, vol. 79, no. 8, pp. 84–88,2018.
International Journal of Endocrinology 9

Stem Cells International
Hindawiwww.hindawi.com Volume 2018
Hindawiwww.hindawi.com Volume 2018
MEDIATORSINFLAMMATION
of
EndocrinologyInternational Journal of
Hindawiwww.hindawi.com Volume 2018
Hindawiwww.hindawi.com Volume 2018
Disease Markers
Hindawiwww.hindawi.com Volume 2018
BioMed Research International
OncologyJournal of
Hindawiwww.hindawi.com Volume 2013
Hindawiwww.hindawi.com Volume 2018
Oxidative Medicine and Cellular Longevity
Hindawiwww.hindawi.com Volume 2018
PPAR Research
Hindawi Publishing Corporation http://www.hindawi.com Volume 2013Hindawiwww.hindawi.com
The Scientific World Journal
Volume 2018
Immunology ResearchHindawiwww.hindawi.com Volume 2018
Journal of
ObesityJournal of
Hindawiwww.hindawi.com Volume 2018
Hindawiwww.hindawi.com Volume 2018
Computational and Mathematical Methods in Medicine
Hindawiwww.hindawi.com Volume 2018
Behavioural Neurology
OphthalmologyJournal of
Hindawiwww.hindawi.com Volume 2018
Diabetes ResearchJournal of
Hindawiwww.hindawi.com Volume 2018
Hindawiwww.hindawi.com Volume 2018
Research and TreatmentAIDS
Hindawiwww.hindawi.com Volume 2018
Gastroenterology Research and Practice
Hindawiwww.hindawi.com Volume 2018
Parkinson’s Disease
Evidence-Based Complementary andAlternative Medicine
Volume 2018Hindawiwww.hindawi.com
Submit your manuscripts atwww.hindawi.com