intro to modern stats - ucla · 2017-04-20 · intro to modern stats computers, not calculus ....
TRANSCRIPT

Intro to Modern Stats computers, not calculus

Why conduct experiments & collect data? To discover something fundamental about a group/gene/effect/etc
We rarely care about the actual data you collected. We CARE about the ‘truth’ behind the scenes: the ACTUAL, complete population from which you drew your data
VS
Experimental Samples
Who Cares?

VS
True, population distributions

What is the mean salary at UCLA?
$64k Exactly $64k? Not $65k?

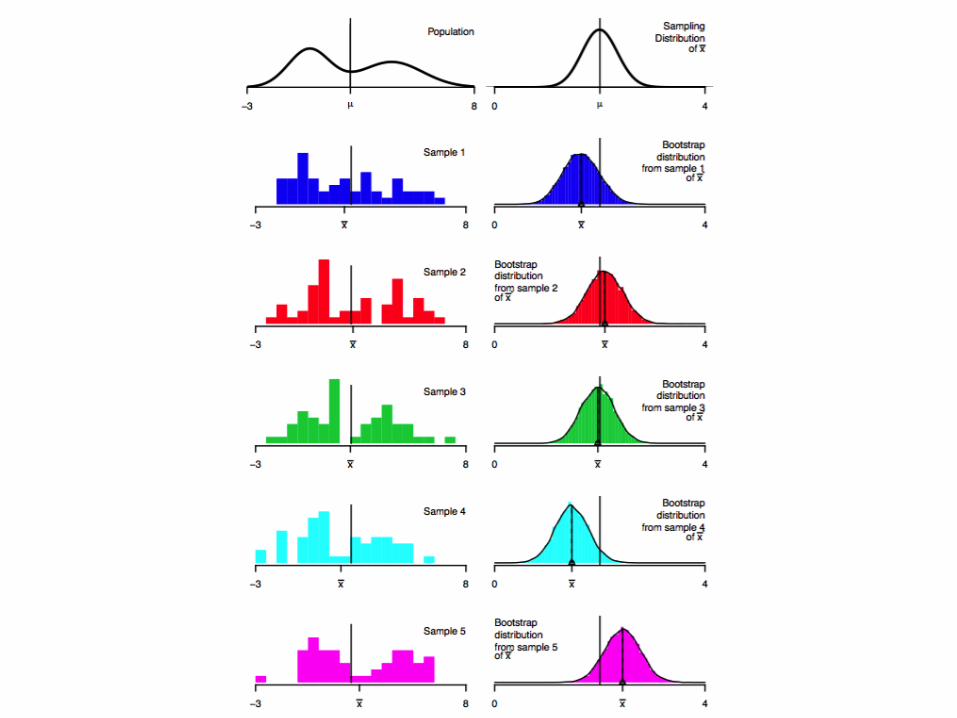
The Bootstrap

Bootstrap Resample

Glossary
1. Population Distribution: the underlying distribution we actually care about
2. Bootstrap: to resample from your dataset, WITH replacement

One-Sample Bootstrap
**Lucid Chart**

The Bootstrap

One-Sample Bootstrap Example
Credit: Dr. Nick Wisniewski

One-Sample Bootstrap Example code in R
** RStudio **

What can we say?
If our assumptions for applying the bootstrap are met (more on that Thursday), our claim is that we are:
There is a 95% chance the true population median lies between $42,180.00 & $59,000.05.

One-sample bootstrap code results

And then, there were two
What’s the difference in true population means?
Two-Sample Magnitude Bootstrap
**Lucid Chart**

Magnitude: How big is your effect?
One-sample Two-sample

Two-Sample Bootstrap Magnitude Example code in R
** RStudio **

What can we say?
If our assumptions for applying the bootstrap are met (more on that Thursday), our claim is that we are:
95% confident the difference between the true population means lies between $7,190.181 & $34,356.97.
This interval does not include 0, which suggests there may be a significant difference between the groups. However, this code was NOT a hypothesis test.

Is this observed difference ‘real’?
Or… Is there no actual difference between groups; the observed difference is purely random noise?

Two-Sample Significance Bootstrap
**Lucid Chart**

Significance: Is your effect real?

Two-sample bootstrap significance example code
** RStudio **

Two-sample significance bootstrap results Actual observed difference
Probability the observed difference is
random noise

Magnitude vs. Significance
1. How big is your effect?
a. Mean/median/mode (collectively, central tendency)
b. Left & right confidence intervals on your
2. Is your effect ‘real’? ← Hypothesis test
a. p-value
“Between condition A and condition B, we observed a mean effect magnitude of x [xLeftCI, xRightCI]. This effect size was significantly (or not) different from the null hypothesis (p< 0.##, two-sample percentile bootstrap).
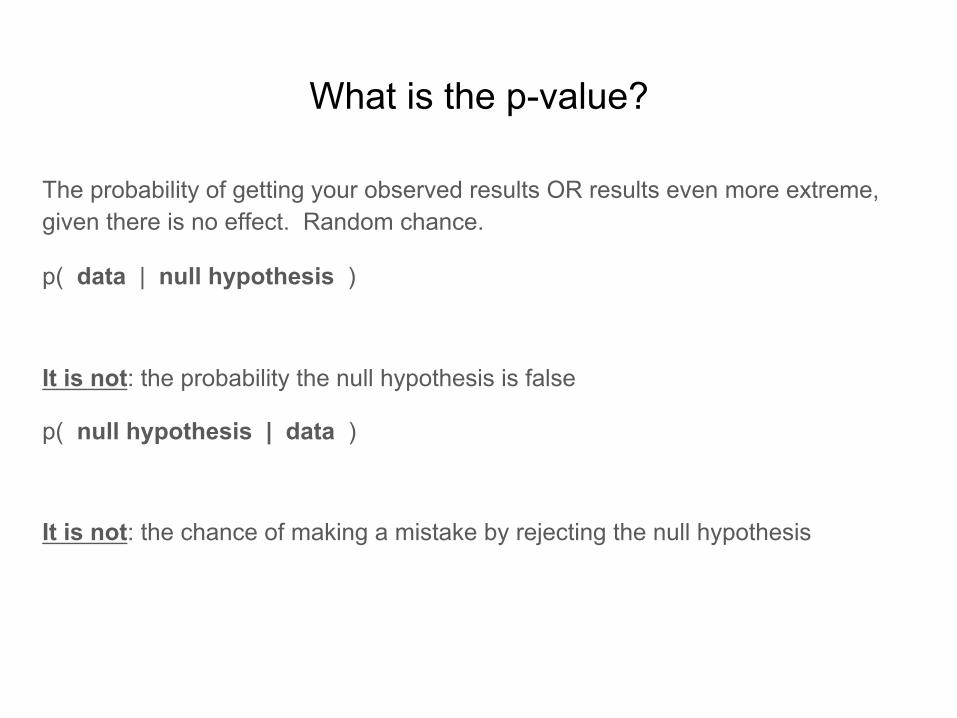
What is the p-value?
The probability of getting your observed results OR results even more extreme, given there is no effect. Random chance.
p( data | null hypothesis )
It is not: the probability the null hypothesis is false
p( null hypothesis | data )
It is not: the chance of making a mistake by rejecting the null hypothesis

Take this home Magnitude Significance

Intro to Modern Stats computers, not calculus

Assessment
1) What is 95% confidence interval for the true standard deviation of sampleB from yesterday?
2) Is the standard deviation of sampleA significantly different from the standard deviation of sampleB?

True distribution of ALL the UCLA salaries

Two-sample bootstrapping, shown another way
We bootstrap to better quantify uncertainty in our inferences, not to get more accurate estimates

Why ‘cult of normal’ stats fails

Paired Data

How to sample linked data

Paired data bootstrap magnitude example code
** RStudio **

Paired data bootstrap magnitude results

How would you do a null hypothesis test?
1) Well, what’s your actual hypothesis?
2) Null: that’s not true; you just got lucky with your data

Permutation Test
Permutation: a way, especially one of several possible variations, in which a set or number of things can be ordered or arranged.


Correlation / Regression


No.

Requirements for correlation coefficient
1. X is normally distributed
2. Y is normally distributed
3. Variances are uniform across the scale (homoscedasticity)
4. Not obviously nonlinear (by eye)
5. No auto-correlation (samples are independent)
Credit: Dr. Nick Wisniewski

Requirements for correlation coefficient
1. X is normally distributed
2. Y is normally distributed
3. Variances are uniform across the scale (homoscedasticity)
4. Not obviously nonlinear (by eye)
5. No auto-correlation (samples are independent)
Credit: Dr. Nick Wisniewski

Intro to Modern Stats computers, not calculus

Assessment
I sent you some new Salary data. It’s the salaries of 69 professors who have each worked at usc, ucla, and irvine in their career. Each row is a professor; each column is a university. Based on publically available data, I hypothesize that usc & irvine salaries are positively, linearly correlated.
1) Is that true, at a 5% significance level?

Assessment
I am interested in the RATIO of salaries between usc and ucla.
1) Is the ratio salaries significantly different, at a 5% significance level?
2) What is the magnitude of the true ratio of salaries between these universities, with confidence intervals?

Assessment
Let’s better characterize the salary relationship between UCLA and USC with a regression. What is the slope and intercept (w confidence intervals) of the salary of USC as a function of the salary at UCLA?
Helpful code:
bootfit = lm(d$usc ~ d$ucla) ←- that’s the regression
bootfitb[i] = bootfit$coefficients[[1]] ←- these are the coefficients
bootfitm[i] = bootfit$coefficients[[2]]
Bonus points for testing signifiance


How to quantify what we intuitively know

Are the means all equal?

ANOVA Example from R

Hypothesis Question Magnitude Significance
1 Group N/A bootstrap samples N/A 2 Groups, different subjects
Is the mean different between these groups?
bootstrap each group's samples independently
shuffle group assignment across subjects
2 Groups, same subjects
Is the mean different between these groups? bootstrap subjects
shuffle condition within each subject
Bivariate Data Are these variables meaningfully related? bootstrap subjects
shuffle one condition across subjects
> 2 groups, diff subs
Do these groups all share the same mean?
bootstrap each group's samples independently
shuffle group assignment

Multiple Comparisons
I have a 20-sided die.
1) I have one roll; what are the odds I roll the number 1?
2) I roll 30 million times; what are the odds I roll the number 1, at least once?
This is the multiple-comparisons problem

Other
Type I error: incorrect rejection of a true null hypothesis (a "false positive")
Type II error: incorrectly retaining a false null hypothesis (a "false negative")

Rules
1. You’re visual animals; plot the raw data
2. (almost) nobody cares about your sample dataset
a. You care about the underlying population distribution
3. Bootstrap (resample WITH replacement) to quantify uncertainty
4. Permute (resample WITHOUT replacement) for significance
5. p-value is probability (data | null hypothesis is true)
a. What fraction of the time your null results are >= your effect
b. How often would you be wrong in ‘discovering’ there’s an effect?
6. The hard work of hypothesis testing is to construct the null distribution
7. To build the null distribution, ‘break’ your effect, by shuffling, then calculate your question statistic (mean/median/ratio) 10k times.
8. Confidence intervals on everything

Fin

Extra

I was wrong
In our trout-length data from yesterday, my undergrad mixed up the sampling on Day7. We don’t know if the Day7 & Day1 measurements are from the same fish or different fish. So, assume they’re 2 separate populations: are they still significantly different in length?

How to bin histogram data?