introduction (chapter 1, gruber textbook)saez/course131/intro_ch01_new.pdf · introduction (chapter...
TRANSCRIPT

Introduction
(Chapter 1, Gruber textbook)
131 Undergraduate Public Economics
Emmanuel Saez
UC Berkeley
1

PUBLIC ECONOMICS DEFINITION
Public Economics (or public finance) = Study of the Role ofthe Government in the Economy
Government is instrumental in most aspects of economic life:
1) Government in charge of huge regulatory structure
2) Taxes: governments in advanced economies collect 35-50% of National Income in taxes
3) Expenditures: tax revenue funds traditional public goods(infrastructure, public order and safety, defense) and welfarestate (Education, Retirement benefits, Health care, IncomeSupport)
4) Macro-economic stabilization through central bank (inter-est rate, inflation control), fiscal stimulus, bailout policies
2
Four questions of public finance
1) When should the government intervene in the economy?
2) How might the government intervene?
3) What is the effect of those interventions on economic out-
comes?
4) Why do governments choose to intervene in the way that
they do?
3
When should the government intervene
in the economy?
1) Market Failures: Market economy sometimes fails to de-
liver an outcome that is efficient ⇒ Government intervention
may improve the situation
2) Redistribution: Market economy generates substantial in-
equality in economic resources across individuals ⇒ People
willing to pool their resources (through government taxes and
transfers) to help reduce inequality
First part of the class focuses on Redistribution
Second part of the class focuses on Market Failures
4
Main Market Failures
1) Externalities: (example: greenhouse carbon emissions) ⇒require govt interventions (Pigouvian taxes/subsidies, public
good provision)
2) Imperfect competition: (example: monopoly) ⇒ requires
regulation (typically studied in Industrial Organization)
3) Imperfect or Asymmetric Information: (example: ad-
verse selection in health insurance may require mandatory in-
surance)
4) Individual failures: People are not always rational. This
is analyzed in behavioral economics, field in huge expansion
(example: myopic people may not save enough for retirement)
5
Inequality and Redistribution
Even if market outcome is efficient, society might not be happywith the market outcome because market equilibrium mightgenerate very high economic disparity across individuals
Governments use taxes and transfers to redistribute from richto poor and reduce inequality
Redistribution through taxes and transfers might reduce in-centives to work (efficiency costs)
⇒ Redistribution creates an equity-efficiency trade-off
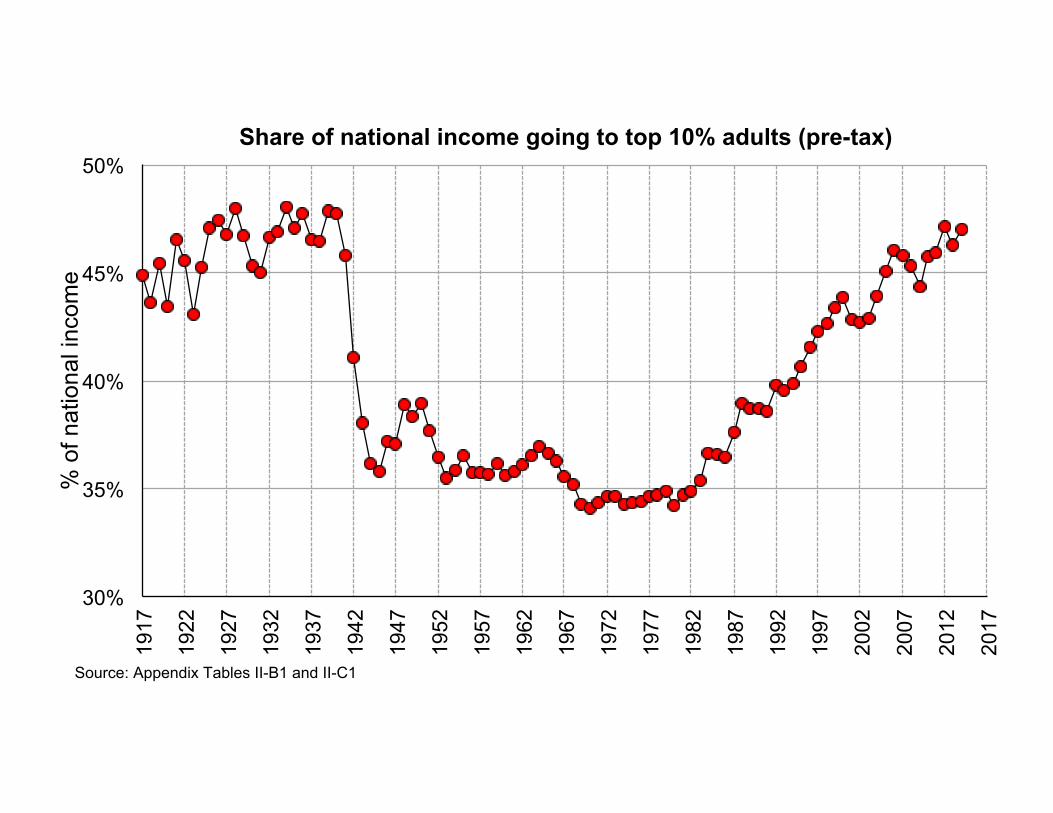
Income inequality has soared in the United States in recentdecades, and has moved to the forefront in the public de-bate (Piketty’s 2014 book success, stats from Piketty-Saez-Zucman ’16)
6
30%
35%
40%
45%
50% 19
17
1922
1927
1932
1937
1942
1947
1952
1957
1962
1967
1972
1977
1982
1987
1992
1997
2002
2007
2012
2017
% o
f nat
iona
l inc
ome
Share of national income going to top 10% adults (pre-tax)
Source: Appendix Tables II-B1 and II-C1

25%
30%
35%
40%
45%
50% 19
17
1922
1927
1932
1937
1942
1947
1952
1957
1962
1967
1972
1977
1982
1987
1992
1997
2002
2007
2012
2017
% o
f nat
iona
l inc
ome
Top 10% national income share: pre-tax vs. post-tax
Pre-tax
Post-tax
Source: Appendix Tables II-B1 and II-C1
0
10,000
20,000
30,000
40,000
50,000
60,000 19
62
1966
1970
1974
1978
1982
1986
1990
1994
1998
2002
2006
2010
2014
Aver
age
inco
me
in c
onst
ant 2
014
dolla
rs
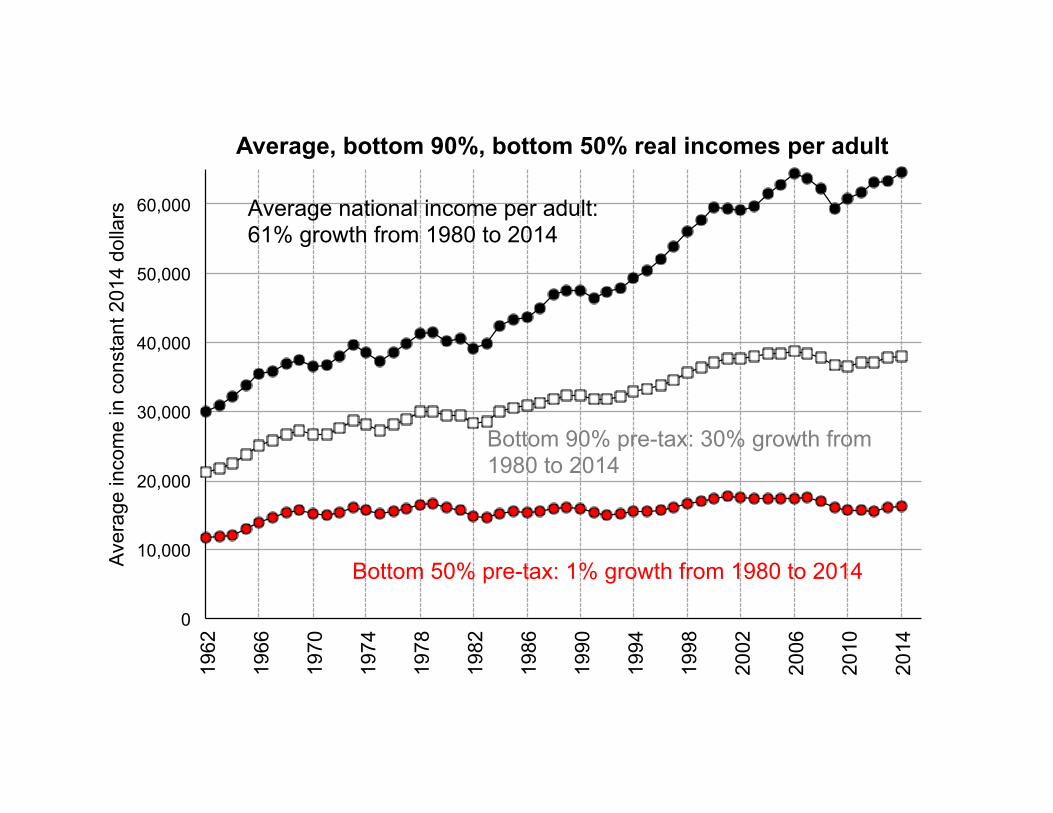
Average, bottom 90%, bottom 50% real incomes per adult
Average national income per adult: 61% growth from 1980 to 2014
Bottom 50% pre-tax: 1% growth from 1980 to 2014
Bottom 90% pre-tax: 30% growth from 1980 to 2014
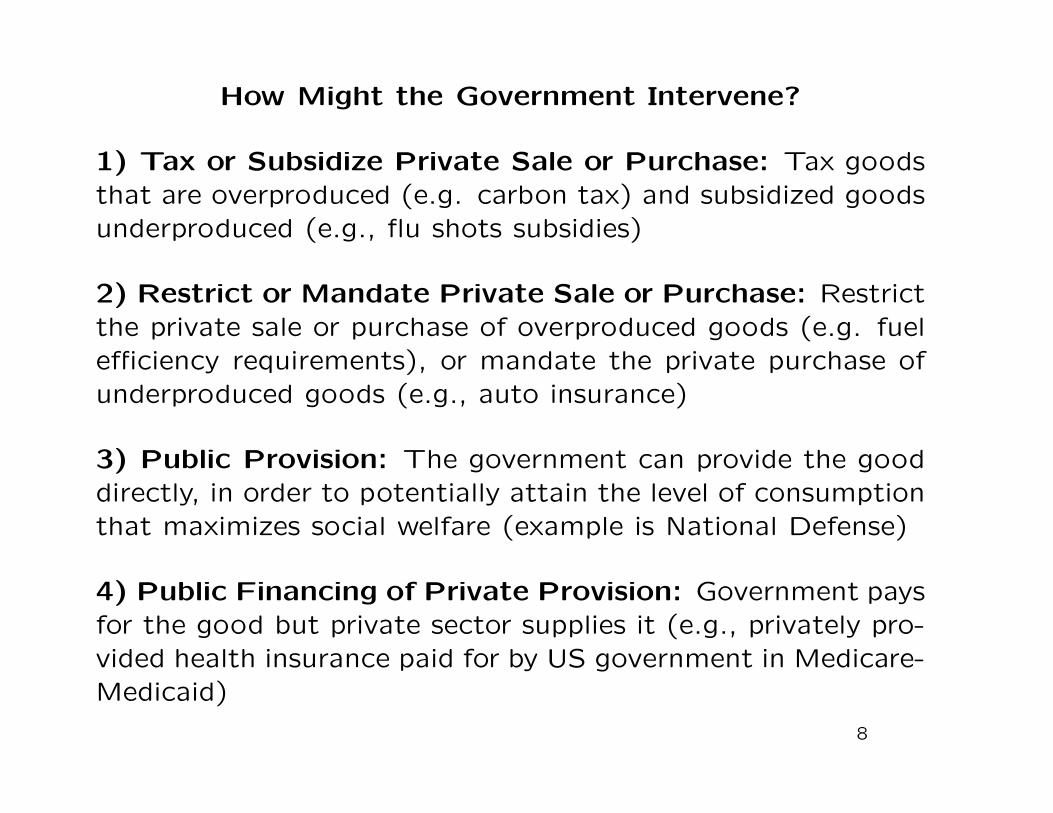
How Might the Government Intervene?
1) Tax or Subsidize Private Sale or Purchase: Tax goodsthat are overproduced (e.g. carbon tax) and subsidized goodsunderproduced (e.g., flu shots subsidies)
2) Restrict or Mandate Private Sale or Purchase: Restrictthe private sale or purchase of overproduced goods (e.g. fuelefficiency requirements), or mandate the private purchase ofunderproduced goods (e.g., auto insurance)
3) Public Provision: The government can provide the gooddirectly, in order to potentially attain the level of consumptionthat maximizes social welfare (example is National Defense)
4) Public Financing of Private Provision: Government paysfor the good but private sector supplies it (e.g., privately pro-vided health insurance paid for by US government in Medicare-Medicaid)
8
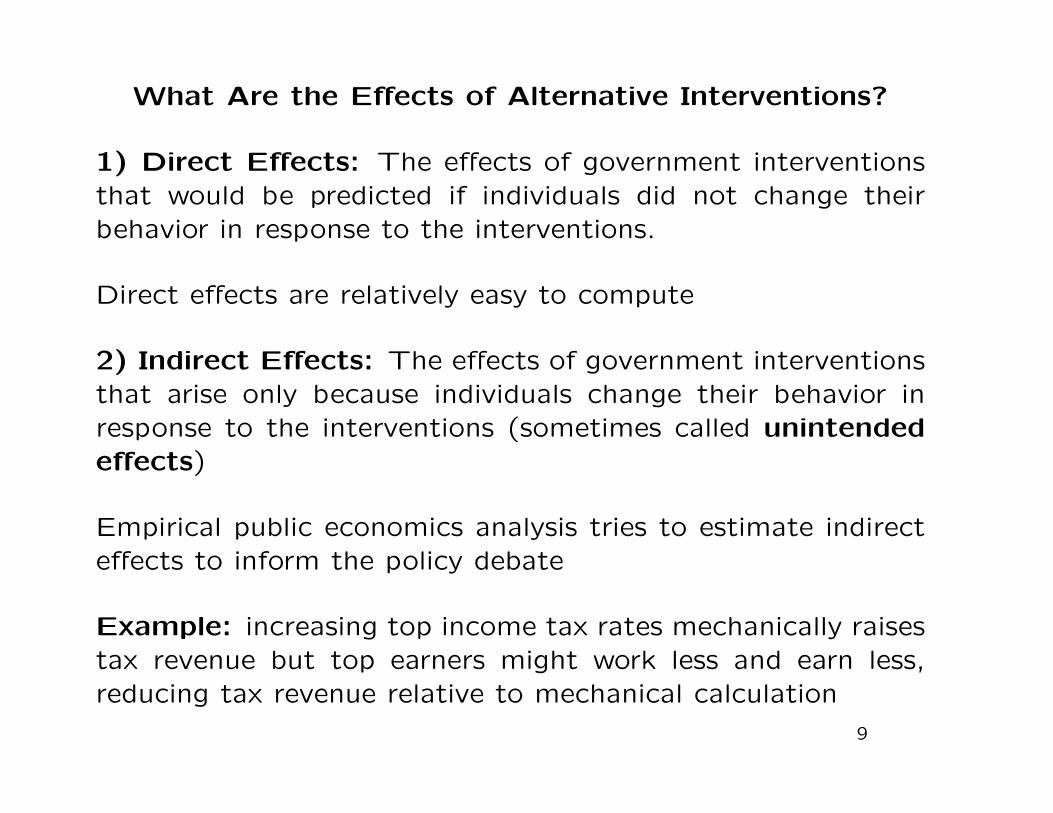
What Are the Effects of Alternative Interventions?
1) Direct Effects: The effects of government interventionsthat would be predicted if individuals did not change theirbehavior in response to the interventions.
Direct effects are relatively easy to compute
2) Indirect Effects: The effects of government interventionsthat arise only because individuals change their behavior inresponse to the interventions (sometimes called unintendedeffects)
Empirical public economics analysis tries to estimate indirecteffects to inform the policy debate
Example: increasing top income tax rates mechanically raisestax revenue but top earners might work less and earn less,reducing tax revenue relative to mechanical calculation
9
Why Do Governments Do What They Do?
Political economy: The theory of how the political process
produces decisions that affect individuals and the economy
Example: Understanding how the level of taxes and spending
is set through voting and voters’ preferences
Public choice is a sub-field of political economy from a Lib-
ertarian perspective that focuses on government failures
government failures = situations where the government does
not act in the benefit of society
10
Normative vs. Positive Public Economics
Normative Public Economics: Analysis of How Things Should
be (e.g., should the government intervene in health insurance
market? how high should taxes be?, etc.)
Positive Public Economics: Analysis of How Things Really
Are (e.g., Does govt provided health care crowd out private
health care insurance? Do higher taxes reduce labor supply?)
Positive Public Economics is a required 1st step before we can
complete Normative Public Economics
Positive analysis is primarily empirical and Normative analysis
is primarily theoretical
11
Paternalism vs. Individual Failures
In many situations, individuals may not or do not seem to actin their best interests [e.g., many individuals are not able tosave for retirement]
Two Polar Views on such situations:
1) Paternalism [Libertarian View] Individual failures do notexist and government wants to impose its own preferencesagainst individuals’ will
2) Individual Failures [Behavioral Economics View] Indi-vidual Failures exist: Self-control problems, Cognitive Limita-tions
Distinguishing the 2 views: Under Paternalism, individuals areopposed to government interventions. If individuals under-stand they have failures, they will support govt interventions.
12
Key Facts on Taxes and Spending
1) Government Growth: Size of government relative to Na-
tional Income grows dramatically over the process of devel-
opment from less than 10% in less developed economies to
30-50% in most advanced economies
2) Government Size Stable in richest countries after 1980
3) Government Growth is due to the expansion of the wel-
fare state: (a) public education, (b) public retirement bene-
fits, (c) public health insurance, (d) income support programs
4) Govt spending > Taxes: Most rich countries run deficits
and have significant public debt (relative to GDP), particularly
after Great Recession of 2008
13
20%
30%
40%
50%
60%
Tota
l tax
reve
nues
(% n
atio
nal i
ncom
e)
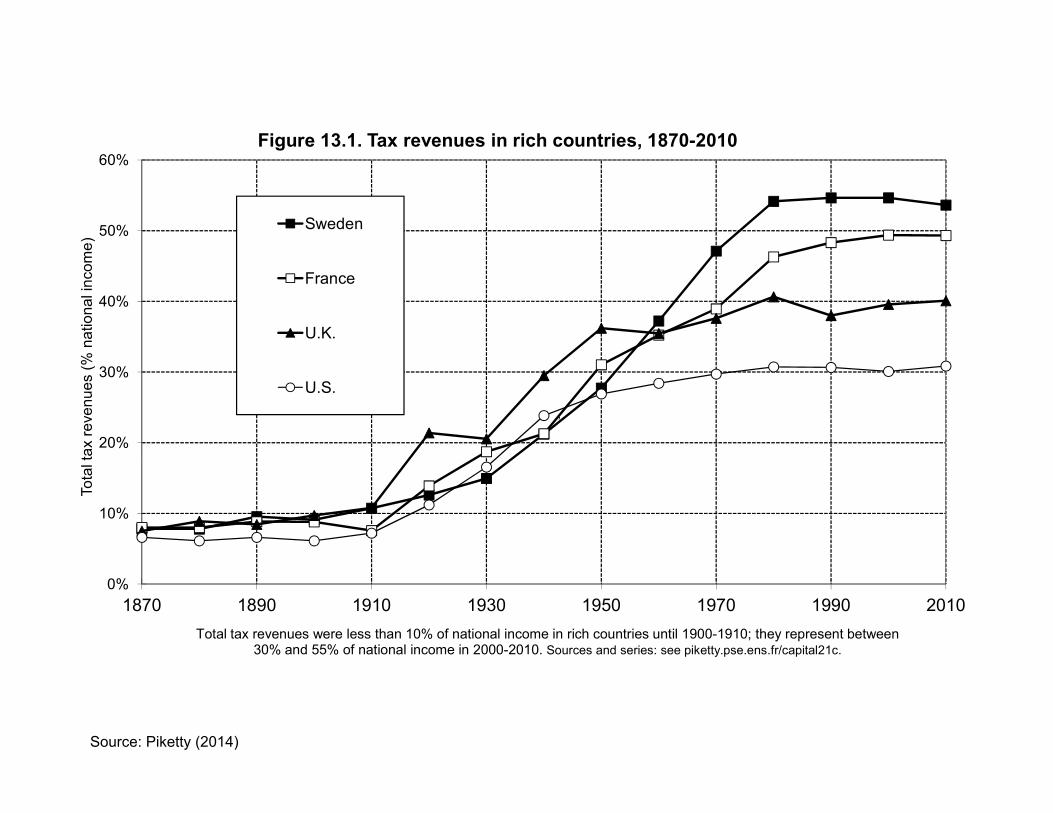
Figure 13.1. Tax revenues in rich countries, 1870-2010
Sweden
France
U.K.
U.S.,
0%
10%
1870 1890 1910 1930 1950 1970 1990 2010
Tota
l tax
reve
nues
(% n
atio
nal i
ncom
e)
Total tax revenues were less than 10% of national income in rich countries until 1900-1910; they represent between 30% and 55% of national income in 2000-2010. Sources and series: see piketty.pse.ens.fr/capital21c.
Source: Piketty (2014)

Public Finance and Public Policy Jonathan Gruber Fourth Edition Copyright © 2012 Worth Publishers
C H A P T E R 1 ■ W H Y S T U D Y P U B L I C E C O N O M I C S ?
17 of 32
Federal Revenues and Expenditures, 1930−2011
1.2
DIFFERENT LEVELS OF GOVERNMENTS
US Federal govt raises about 20% of National Income in taxes
State+Local govts raise about 10% of Nat. Income in taxes
Decentralized states = states where a larger fraction of taxes/spendingtake place at local level
Decentralized states give additional power to individuals whocan also vote with their feet
Creates competition between local govts: If local govt is inef-ficient (high taxes and wasteful spending), residents can leave,putting the local govt out of business
Redistribution through taxes and transfers harder to achieveat local level (rich can leave if local taxes are too high)
⇒ Conservatives/libertarians tend to prefer decentralized states
16
Public Finance and Public Policy Jonathan Gruber Fourth Edition Copyright © 2012 Worth Publishers
C H A P T E R 1 ■ W H Y S T U D Y P U B L I C E C O N O M I C S ?
21 of 32
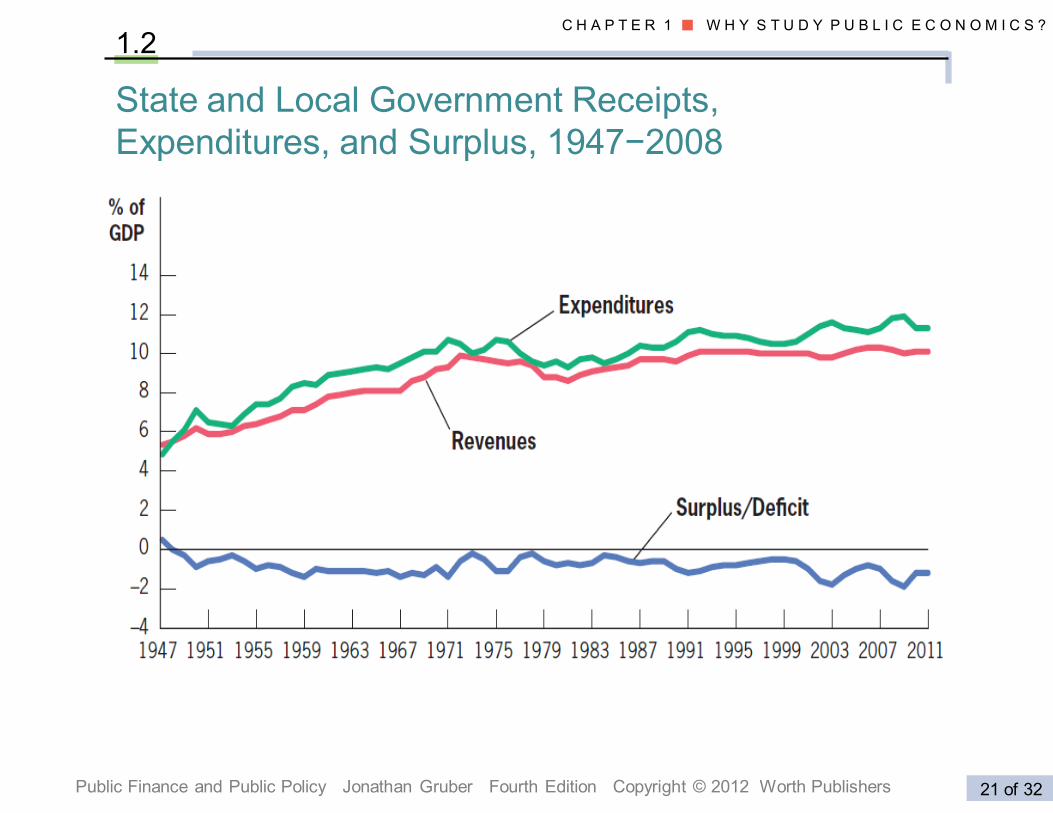
1.2
State and Local Government Receipts, Expenditures, and Surplus, 1947−2008
Public Finance and Public Policy Jonathan Gruber Third Edition Copyright © 2010 Worth Publishers
C H A P T E R 1 ■ W H Y S T U D Y P U B L I C E C O N O M I C S ?
21 of 24
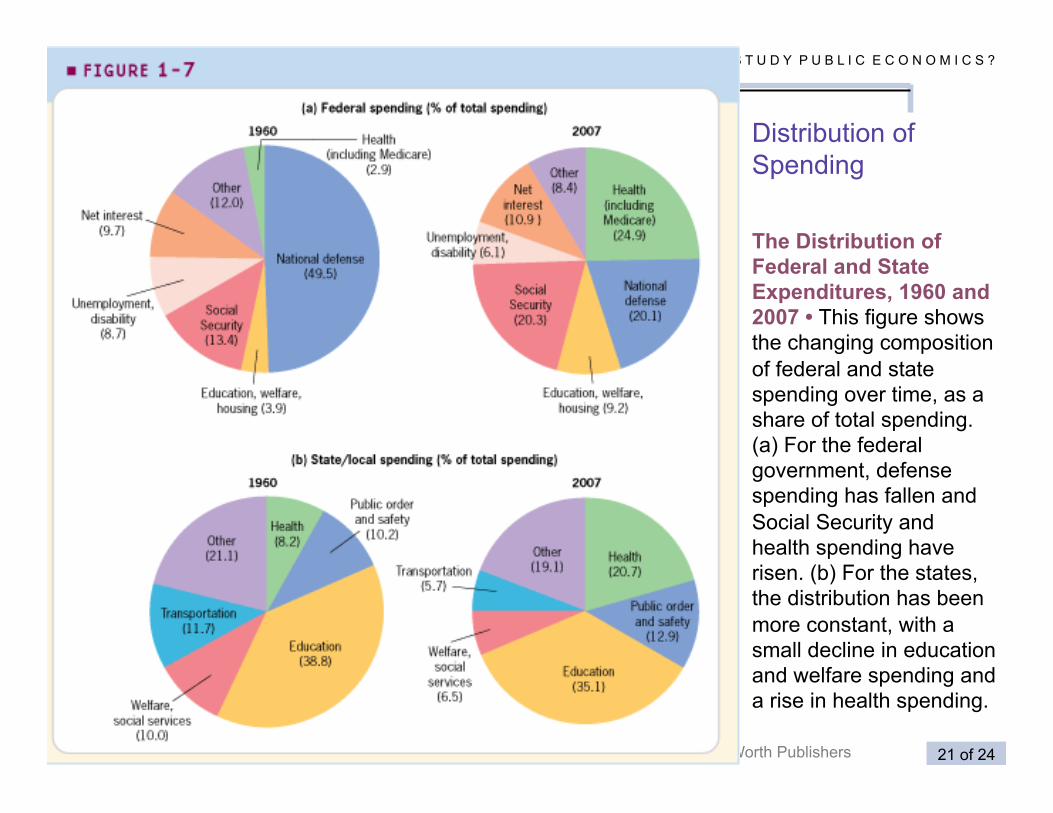
Distribution of Spending
1.2
The Distribution of Federal and State Expenditures, 1960 and 2007 • This figure shows the changing composition of federal and state spending over time, as a share of total spending. (a) For the federal government, defense spending has fallen and Social Security and health spending have risen. (b) For the states, the distribution has been more constant, with a small decline in education and welfare spending and a rise in health spending.
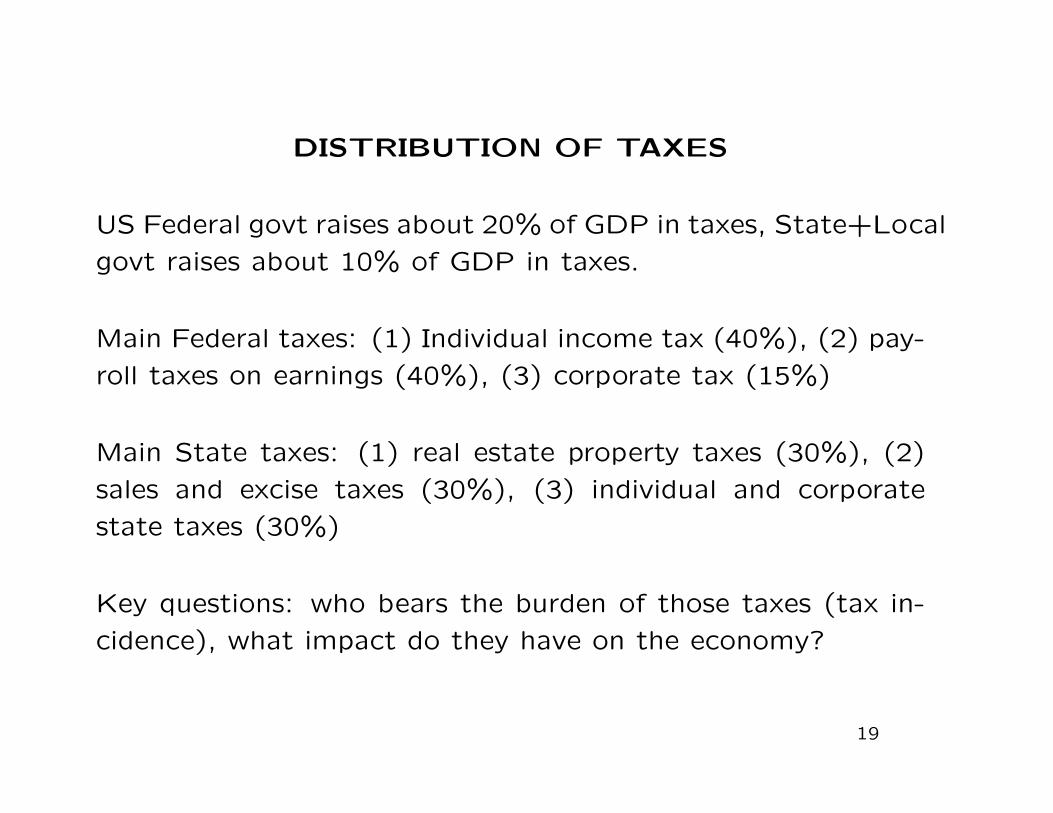
DISTRIBUTION OF TAXES
US Federal govt raises about 20% of GDP in taxes, State+Local
govt raises about 10% of GDP in taxes.
Main Federal taxes: (1) Individual income tax (40%), (2) pay-
roll taxes on earnings (40%), (3) corporate tax (15%)
Main State taxes: (1) real estate property taxes (30%), (2)
sales and excise taxes (30%), (3) individual and corporate
state taxes (30%)
Key questions: who bears the burden of those taxes (tax in-
cidence), what impact do they have on the economy?
19
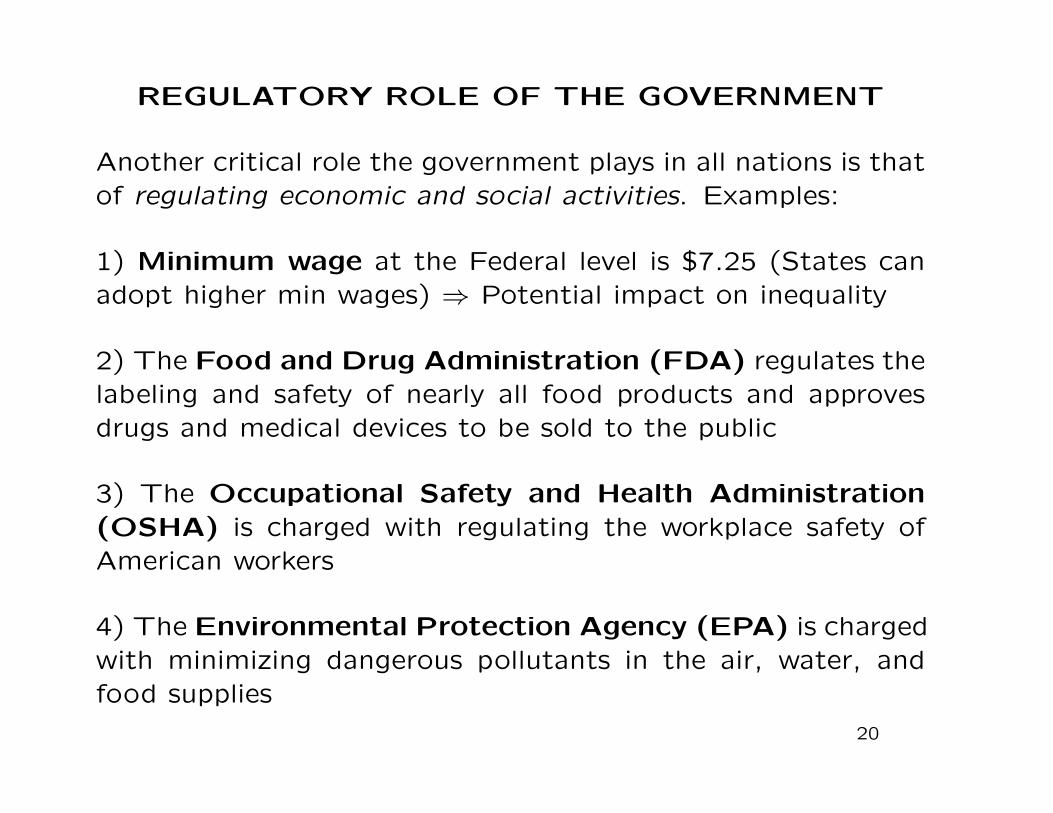
REGULATORY ROLE OF THE GOVERNMENT
Another critical role the government plays in all nations is thatof regulating economic and social activities. Examples:
1) Minimum wage at the Federal level is $7.25 (States canadopt higher min wages) ⇒ Potential impact on inequality
2) The Food and Drug Administration (FDA) regulates thelabeling and safety of nearly all food products and approvesdrugs and medical devices to be sold to the public
3) The Occupational Safety and Health Administration(OSHA) is charged with regulating the workplace safety ofAmerican workers
4) The Environmental Protection Agency (EPA) is chargedwith minimizing dangerous pollutants in the air, water, andfood supplies
20

PUBLIC DEBATES OVER SOCIAL SECURITY,HEALTH CARE AND EDUCATION
Taxes, health care, and climate change are each the subject ofdebate, with both the “liberal” and “conservative” positionsholding differing views in their approach to each problem.
Taxes: Obama’s administration increased taxes on top earn-ers significantly in 2013 (repeal of Bush tax cuts + Oba-macare taxes). New Trump administration wants to reversethese changes and more.
Health Care: Up to 2013, about 20% of the non-elderly U.S.population did not have health insurance Obamacare cut thisnumber down to 10% but might be repealed
Climate change: Carbon emissions are generating globalwarming with potentially huge negative consequences in thefuture (sea rise, extreme weather, agricultural output). De-bate on costs of global warming. What should govt do?
21
PROFESSOR SAEZ’ RESEARCH
Most of my research (available on my webpage) is in public
economics:
1) Design of optimal tax policies and optimal transfer pro-
grams (theory, normative)
2) Analysis of the effects of taxes and transfers on individual
behavior (empirical, positive)
3) Analysis of inequality overtime and across countries (em-
pirical, descriptive)
I will discuss some of my research in this course when we cover
the relevant topics
22
REFERENCES
Jonathan Gruber,Public Finance and Public Policy, Fifth Edition, 2016Worth Publishers, Chapter 1
National Center for Education Statistics “Highlights from TIMSS 2007:Mathematics and science achievement of US fourth-and eighth-grade stu-dents in an international context.” Institute of Education Sciences, USDepartment of Education, 2009.(web)
Piketty, Thomas, Capital in the 21st Century, Cambridge: Harvard Uni-versity Press, 2014, Chapter 13, (web)
Piketty, Thomas and Emmanuel Saez “Income Inequality in the UnitedStates, 1913-1998”, Quarterly Journal of Economics, 118(1), 2003, 1-39,series updated to 2012 in September 2013 (web)
Piketty, Thomas, Emmanuel Saez, and Gabriel Zucman, “DistributionalNational Accounts: Methods and Estimates for the United States”, NBERWorking Paper No. 22945, 2016. (web)
23