introduction: poverty and vulnerability
TRANSCRIPT
UNDERSTANDING POVERTY AND VULNERABILITY IN INDIA’S UTTAR PRADESH AND BIHAR: A Q-SQUARED APPROACH Barbara Parker Save the Children US, Dushanbe, Tajikistan Email: [email protected] Valerie Kozel The World Bank Email: [email protected]
Q-Squared Working Paper No. 9 October 2005
Q-squared • Centre For International Studies • University Of Toronto 1 Devonshire Place, Toronto ON M5S 3K7 Canada
t: 416-885-7721 • f: 416-652-1678 • e: [email protected]
ACKNOWLEDGEMENTS The authors would like to acknowledge the essential role of the study team on both sides of the Atlantic: in India, in Washington DC, and parts in-between. The research approach, field instruments, and rich analysis and findings represent the work of the entire team – who were willing not only to work from the understanding and strengths of their own disciplines, but also to acknowledge and learn from the strengths of other’s.

I. INTRODUCTION: POVERTY AND VULNERABILITY IN INDIA Poverty remains widespread in India, despite decades of anti-poverty programs and
spending and an extensive research and policy literature. Much of the existing work on
Indian poverty has focused on material deprivation: the poor are identified as individuals
living in households whose per-capita expenditures fall below some norm, or poverty
line. Using this definition, there is a broad literature on levels and trends in income
poverty, often based on India’s long-running National Sample Survey (NSS) of
households and individuals. However, in a culturally rich and socially diverse setting
such as India, poverty is a highly complex phenomenon: income poverty is only one
facet (albeit a very important one). Indian poverty is linked to economic, social, cultural
and political factors that interact to maintain long-term structural disparities in
opportunities and resources.
To identify the full range of pertinent factors and to examine their interaction, it is
necessary to broaden and deepen conventional approaches to poverty measurement
and analysis. This paper describes a study that examined poverty and vulnerability in
India using a multidisciplinary approach in which more conventional poverty analyses
(based on household survey data and other sources of statistical information) were used
in interaction with open-ended qualitative research methods, primarily drawn from the
repertoire of Participatory Rural Appraisal (PRA) instruments. In the literature (e.g.
Kanbur, 2003) this is referred to as a quantitative-qualitative or q-squared approach.
The study’s immediate goal was to inform the ongoing poverty debate in India and to
help shape the World Bank’s country assistance strategy. It also provides an illustration
of the value added by an interdisciplinary mixed-method approach in understanding the
1

dynamics of impoverishment, vulnerability, and downward mobility among India’s poor
and the near-poor.
The slow pace of poverty reduction in some of India’s poorest states could be interpreted
to mean that poor Indian households experience a constant state of chronic deprivation
with little change from year to year. In reality, poverty is often a volatile condition. On
one hand, persistent poverty can be linked to past and present policies, institutions and
structural features of the political and economic system. It is no accident that poverty
tends to cluster among social groups (such as low-caste and female-headed
households) that are traditional targets for stigma and discrimination. Nevertheless, the
association between poverty and social identity is far from perfect. This is in part
because adventitious shocks and catastrophic events, which occur among all caste and
income groups, also contribute significantly to high poverty levels. For many low-income
households, a rapid slide into acute poverty and destitution is an ever-present threat, but
even better-off and higher-caste households can be impoverished by a series of shocks
that drain household’s savings and assets. Thus, although structural factors may
impose a barrier to upward mobility, there is no barrier to downward mobility.
Adverse shocks do, however, occur more often among the poor because they are
exposed to greater risks in terms of dangerous working conditions, poor nutrition, lack of
preventive health care, and exposure to environmental contaminants. What is more, the
poor are less able to manage shocks successfully e.g. they possess fewer cushions in
the form of savings and insurance. When a shock occurs, poor households may be
pushed deeper into poverty and ultimately become destitute. Once destitute, it is difficult
if not impossible for the afflicted household to recover or regain basic economic security.
If programs are to be effective in promoting security and reducing risk for the most
2

vulnerable, then the processes that cause these households to descend irreversibly into
destitution must be better understood.
A. Analytic Approach: Mixed Disciplines, Mixed Methods
The study builds on decades of work on poverty in India, including analyses of National
Sample Surveys (NSS) and other household surveys as well as a rich base of ‘village
studies’ and related qualitative research. Historically, the Indian statistical system led
the world in the measurement of poverty. Sample surveys were pioneered by
Mahalanobis at the Indian Statistical Institute in the 1940s and 1950s, and seminal work
by Rudra (1974) and Bardhan (1973) laid out an approach for calculating poverty lines
and provided all-India poverty estimates for 1960-61. Poverty estimates based on the
NSS have been part of India’s National Development Plans since the early 1960s. India
also has a rich tradition of rural villages studies (findings are brought together in
Jayaraman and Lanjouw, 1999; also Harriss-White, 1992) that have influenced thinking
about poverty and the design of public policies. Many of these studies used inductive,
mixed method approaches, combining ethnographic and sociological approaches with
household and community surveys. They brought context and perspective to the
understanding of life in rural India, identifying the relationships between poor individuals
and their communities, and the role of local institutions in daily life.
The long-running study of Palanpur village in North India provides one of the best known
examples. (Bliss and Stern, 1982; Dreze, Lanouw, and Sharma, 1998; Lanjouw and
Stern, 1998). A number of additional studies have been carried out in the regions
covered under this study, with particular focus on Green Revolution technologies,
agrarian reform, rural diversification, and changes in the lives of the rural poor (Saith and
Tankha, 1992; Epstein, 1973; Wadley and Derr, 1989; Sharma and Poleman, 1993;
3

Srivastava, 1995, 1997; also Jha (1994)). These studies helped to provide background
and context for this research, and confirmed many of our findings.
Where India led, the rest of the world followed. As early as 25 years ago, researchers
outside India were beginning to formally draw attention to the advantages and difficulties
of inter-disciplinary thinking about poverty and mixed method approaches. Bardhan’s
seminal volume Conversations Between Economists and Anthropologists:
Methodological Issues in Measuring Economic Change in Rural India (1989) describes
how these issues were debated in India in the 1970s and 1980s. Beginning in the early
1990s, the global discussions about research methodologies began to take on an
atmosphere of controversy, either overt or covert, about whether quantitative or
qualitative research is superior and better suited to the examination of poverty. These
controversies in part grew out of the increasing use of so-called participatory poverty
assessments based on rapid data collection methods (e.g. rapid rural appraisal,
participatory rural appraisal) in lieu of ethnographic and other more traditional social
science methodologies. (see Rew, Khan, and Rew, this volume, also Whitehead and
Lockwood, 1999) While the debate focused on methods, it arose out of deeper
concerns about the fundamental nature of poverty and strengths and limitations of
different disciplines in addressing it.
Now, however, researchers are attempting to transcend this controversy by recognizing
the multi-dimensionality of poverty and validity of cross-disciplinary approaches, and
thus looking to both qualitative and quantitative methods for the specific strengths and
insights they can bring to research and policy design. As one component of a
complementary approach, quantitative research is required to ensure that finding are
reliable and statistically representative, while the qualitative component can contribute to
4
validity by ensuring that the questions being asked are appropriate to actual conditions
on the ground and that the interpretation of results is accurate. Attempts to address
“why” questions through survey questionnaires have proven disappointing. Surveys, by
seeking uniformity of response, are generally not flexible enough to probe the motives
that lead to behaviors (though the behaviors themselves may be quantifiable).
Qualitative research, which is flexible, opportunistic and heuristic, provides more
appropriate techniques for this purpose. Because qualitative researchers do not have to
assume (e.g. through pre-coded survey questionnaires) that they know already the
possible universe of responses, they are prepared to follow up any unexpected
responses and pursue them – using probing and improvisation – as opportunities to gain
new and previously unexpected information.
The UP/Bihar Study of Rural Poverty and Vulnerability was a multi-disciplinary and
multi-method examination of the factors that maintains or exacerbate poverty, and that
lead to upward and downward mobility in specific regions of Uttar Pradesh (UP) and
Bihar, two large states in northern India. Its broad objective was to contribute to the
achievement of India’s poverty-reduction goals by updating and enriching the current
understanding of how economic, social, cultural and political factors work, individually
and in relation to each other, in creating and maintaining disparities in opportunities and
resource endowments.
5

II. METHODOLOGICAL APPROACH
A. Overall Organization of the Study
Approach:
The benefits of the Q-squared approach cannot be fully realized unless the two methods
(quantitative and qualitative) are sequenced such that each can enrich and clarify the
results of the other. The design of the study, therefore, was based on a phased, iterative
methodology that joined a modified Living Standards Survey (LSS), using a multi-topic,
pre-coded questionnaire administered to households and communities, with a
complementary set of qualitative research instruments. The qualitative component was
scheduled first (“qual-quan” sequencing), so it could be used not only to create a free-
standing base of information, but also to focus and strengthen the survey questionnaire
and to ensure that questions and code categories reflect the true range of possible
issues, factors and responses. More specifically, qualitative methods were used for
three purposes:
1. To identify factors linked to the perpetuation of poverty which are
known to the poor themselves but may not be fully reflected in
conventional surveys,
2. To provide, through example and case history, an understanding of
the specific mechanisms through which poverty arises and is
maintained in the study villages,
6

3. To build theories and hypotheses which will help in designing the
household survey and for testing in the quantitative portion of the
research project; and to ensure that the survey instrument is well-
tailored to the examination of specific local conditions.
Because the qualitative work was initiated first, it offered significant insights about the
research questions even before the quantitative results were compiled and analyzed.
These insights permitted the development of a richer analytic frame that assisted the
researchers to better understand the significance of certain patterns of economic and
social behavior. These patterns, in turn, were explored in ensuing analytic work based
on household and community surveys. After the survey data was analyzed, two
additional mini-studies using mostly qualitative methods were initiated to follow-up and
clarify ambiguous points raised by the survey results. The finalized research agenda,
then, actually pursued a “qual-quant-qual” sequencing pattern in which the household
survey was both preceded and followed by in-depth qualitative fieldwork.
The overall design of the study, thus, reflects several important assumptions; first, that
cross-disciplinary approaches help to develop a richer and more nuanced understanding
of poverty and the constraints and opportunities faced by the poor; second, that
qualitative and quantitative methodological approaches provide different types of
information; third, that each approach provides unique information that is valuable in its
own right as well as in combination with other sources of information, and fourth, that to
fully capture the advantages of the combined approach, the two components must be
sequentially phased and integrated. What we refer to as quantitative and qualitative
approaches are complements rather than substitutes, and any effort to determine which
is better or more important in terms of poverty analysis is misguided. In short, the goal
7

of the study’s integrated methodological approach was to achieve a more
comprehensive view of the multiple dimensions of poverty than could be obtained
through either approach alone.
Preparation:
The field research was carried out by a team of Indian nationals drawn from Allahabad
University and local NGOs, working in collaboration with a team from the World Bank.
The teams were multi-disciplinary, including members trained e.g. in economics,
statistics, anthropology, rural sociology, as well as several NGO leaders and social
activists. In addition to World Bank staff inputs1, a team of seven researchers2 (six local,
one international) were assembled during the six months preceding the start of the
fieldwork, and the full team was actively involved in determining the final design of the
fieldwork and developing the instruments used. The team participated in development of
instruments and in the qualitative analysis during a series of workshops held before and
after the fieldwork. Both design and analysis, therefore, were flexible and participatory
processes in which team members who actually conducted field exercises, discussions
and interviews were fully involved.
B. The Qualitative Component
In order to elicit the participation of villagers in identifying the key social, institutional and
economic forces that perpetuate poverty in these districts, a qualitative substudy
featuring Participatory Rural Appraisal (PRA) techniques and in-depth, semi-structured
interviews was implemented in 30 villages. These villages were located in the
Allahabad, Gorakhpur and Banda Districts of Uttar Pradesh, and in the Jehanabad,
8

Vaishali, Munger and Saharsa Districts of Bihar. Each village was visited for a period of
about one week by a 4-8-person team. The qualitative component was designed to
systematically listen to and learn from the poor themselves. To this end, a series of
research instruments and exercises were developed to capture the views of a wide
range of villagers -- poor, middle-income, well off, male, and female. The teams carried
out the exercises in roughly the order below
1. Village Overview: Upon entry to each village, the teams met with village leaders and
prepared an “objective” map that identified all neighborhoods (tola) and whether each
was wealthy, poor or mixed. The team then selected a subsample of one to three
communities for intensive study -- at least one with a majority of poor households.
2. Social Mapping Exercise: Villagers were asked to prepare a “social” map of their own
tola. The objectives of the exercise were: 1) To obtain an inventory of village resources
(wells, handpumps, schools, public services buildings, commonly held lands, etc.) and
households of differing wealth levels; and to pinpoint the location of village resources in
relation to wealthy and poor households, and 2) To initiate discussion among
participants and bystanders about past and present relationships between better-off and
poor households; and about whether unequal access to local resources is a factor in the
perpetuation of wealth differentials within the village.
3. Wealth Ranking Exercise: As a technique to focus the attention of participants on
issues related to wealth and poverty, a group of villagers in each tola was asked to rank
a randomly chosen sample of 30 village names on the basis of relative household
wealth. The exercise was carried out in one poor and one non-poor community to
compare the perceptions of persons of different levels of economic well-being. The
9

objectives of this exercise were to obtain local views on the visible components of wealth
and poverty; to elicit opinions on the means of upward mobility among the poor and on
the most common causes of downward mobility among all income groups; and to initiate
discussion of why some households can succeed in gaining wealth while others fall
behind.
3. Social Capital Inventory: The Social Capital Inventory attempts to identify organized
groups (indigenous or introduced) and mutual assistance networks or relationships that
exist in the research villages. The goals were to ascertain the importance of social
capital to households of different economic standing; to determine whether the poor
were as well-supplied with informal support system as the better-off, to examine the
economic uses of social capital among the poor and non-poor, and to assess current
trends in its distribution.
4. User Perception of Government Programs and Survey of Facilities: The teams asked
focus group participants in each study village to identify all government and NGO
programs that are active in their communities and to describe any benefits they or their
neighbors had received from these programs. The research teams also visited public
facilities and talked with staff members. The objectives were to examine whether the
poor are aware of the GOI’s anti-poverty and social protection programs; whether these
programs are working well for them, and to identify shortcomings and their causes.
5. Women’s Roles and Gender Issues Exercise: During the initial review of the PRA
instruments, some of the field team leaders designed and tested two separate exercises
that would foster a discussion with poor women participants of their own unique
problems. The first encouraged a group of women to draw pictures of the good and bad
10
things about being a woman, and to explain their drawings. The second was a series of
ambiguous images of women interacting with men and children in a village setting. The
women were asked to tell a story about what was happening in the pictures, and to
comment on whether this story was typical of life in the village.
6. Case History Interviews: Team members carried out a series of 8-10 case history
interviews with lower and middle income members of the target communities. The
research instrument was designed to elicit a description of actual events as they have
unfolded in the lives of the informants. Household decision-making with respect to social
services was emphasized, including the perceived availability and utilization of
educational and health resources in the area. The goal was to yield a composite picture
of common responses to decision-points and life events presented by the interviewers --
enrollment of children in school, treatment-seeking in case of major illness, need for
credit, food shortages in the home, shocks and disasters, etc. – in order to explore felt
needs and the barriers that prevent the poor and vulnerable from meeting these needs.
C. The Quantitative Component
1. The Household Questionnaire.
After the Phase I qualitative data collection was completed, the research team analyzed
the results and identified issues and themes that were particularly appropriate for follow-
up in the planned multi-topic household survey. A household questionnaire was
designed, building on a modified version of the Living Standards Survey (LSS) format.
The questionnaire had ten core sections; (1) the household roster; (2) economic
activities; (3) housing; (4) education; (5) health; (6) marriage and maternity history; (7)
11

consumer expenditures and durable goods; (8) vulnerability; (9) farming and livestock;
and (10) remittances and transfers.
Additional questions were added to the questionnaire to better capture issues that the
qualitative results (Phase I) had revealed to be important dimensions of poverty in the
study villages. These included questions on stability and diversity of economic activities,
gender relations, female autonomy and violence; use of key public service programs,
use of common property resources, inter-caste and inter-class debt and economic
relationships, and the frequency of shocks (particularly health shocks). The field survey
was administered in 120 villages drawn from 123 districts in UP and 134 districts in Bihar.
Of the sample of villages, 30 had been visited previously in the qualitative phase of the
work and 90 were drawn at random from the sample districts. In the 30 villages covered
under the qualitative phase, a larger number of households were interviewed (30
households in total), while only 15 households were sampled in each of the “new”
villages. The overall size of the household sample was 2252 households.
2. The Village Questionnaire
In addition to administering a household survey, a range of quantitative information was
collected at the level of the revenue5 village. The village questionnaire was intended to
complement and expand upon information collected in the earlier qualitative component
of the study. Included in the village questionnaire are sections on (1) village
characteristics, including size, caste composition, and political structure, and
infrastructure; (2) access to facilities and services; (3) agriculture, irrigation, and forestry;
(4) employment and migration, including wages; (5) anti-poverty programs and
organizations; (6) changes over time; (7) visits to facilities, including the Anganwadi
12

(early education) Center, primary schools, health posts, and the PDS fair price shop.
Information for the village questionnaire was collected from expert informants e.g. the
pradhan or village headman, the school teacher, NGO workers active in the area.
III. THE STUDY AREA -- SOUTH/EASTERN UP AND NORTH/CENTRAL BIHAR
UP and Bihar, together with Madhya Pradesh, have been referred to as India’s “poverty
belt” because all three states are characterized by unusually large populations whose
per-capita expenditure levels fall below the poverty line. Of all of India’s states, UP has
the largest population and, according to recent estimates, the highest number of people
below the poverty line; in 1999/00, UP accounted for nearly one-fifth of India’s total poor
(34 percent of the population in UP fell below the poverty line in 1999/006). Bihar, which
lies just to the east of UP, has the lowest per capita rural income in India, and with 87
percent of Bihar’s population classified as rural, it is the most rural state in the country. It
has suffered from unrest, inter-caste conflict and political violence during the past
decade. Poverty levels are even higher in Bihar than in UP – nearly 50 percent of the
population lived below the official poverty line in 1999/00. (Deaton and Kozel, 2005)
IV. STUDY FINDINGS
This section describes a number of key findings that were initially drawn from the
qualitative fieldwork and analysis. The section also describes the supplementary
examination and verification of these issues and conclusions that was carried out during
the survey research phase of the study.
13
A. Who Are the Poor and Vulnerable?
The Wealth Ranking and Social Mapping exercises yielded a composite picture of
impoverished households and the ways in which they differ from the better off. The
results supported the standard proposition from the poverty analysis literature that
poverty is caused by low levels of assets coupled with low and uncertain returns. The
poor7 were found to be a highly heterogeneous group whose situation is characterized
by a complex set of social and economic relationships. These relationships often do not
work to their advantage, and they perceived themselves as highly vulnerable. They
have few assets beyond their own unskilled labor. Usually without fertile land, illiterate,
and frequently in ill-health, the poor suffer from poverty of private assets. In addition, the
poor have limited access to such public assets as community infrastructure, basic
services and government programs. They therefore suffer from poverty of access to
public goods and services. Finally, they are often deprived of informal systems of
support and social capital – poverty of social relationships8. (Kozel and Parker, 2001)
The households described as the poorest and most destitute were relatively few in
number, They were generally without private assets in the form of land, animals, farming
equipment or, often, even a homestead plot. Most had become destitute through
idiosyncratic shocks that permanently undermined their physical or human resource
base. Many were headed by women without husbands or adult male relatives, while
others were headed by disabled male breadwinners. Analysis of the survey results
supported informants’ claims that the cost of medical care was a significant cause of
extreme poverty. The research team was surprised to discover this because the
Government of India is committed to providing free primary health care to the poor. If
14

basic primary health care is free to the poor, why do they tend to fall into debt and
destitution when illness strikes?
To clarify this issue, a third component of the study was launched in which a qualitative
district health assessment was carried out to determine why the health needs of the poor
were not being met by he government’s primary health care program9. It was learned
that the first-contact level of the government health care system was usually by-passed
by the poor, primarily because it lacked medicines and supplies. Instead, they patronize
untrained or minimally trained private practitioners (jhola chap doctors or “quacks”)
whose services are expensive and often ineffectual. These qualitative findings were
borne out by the survey findings10I, as shown below.
15
Box 1
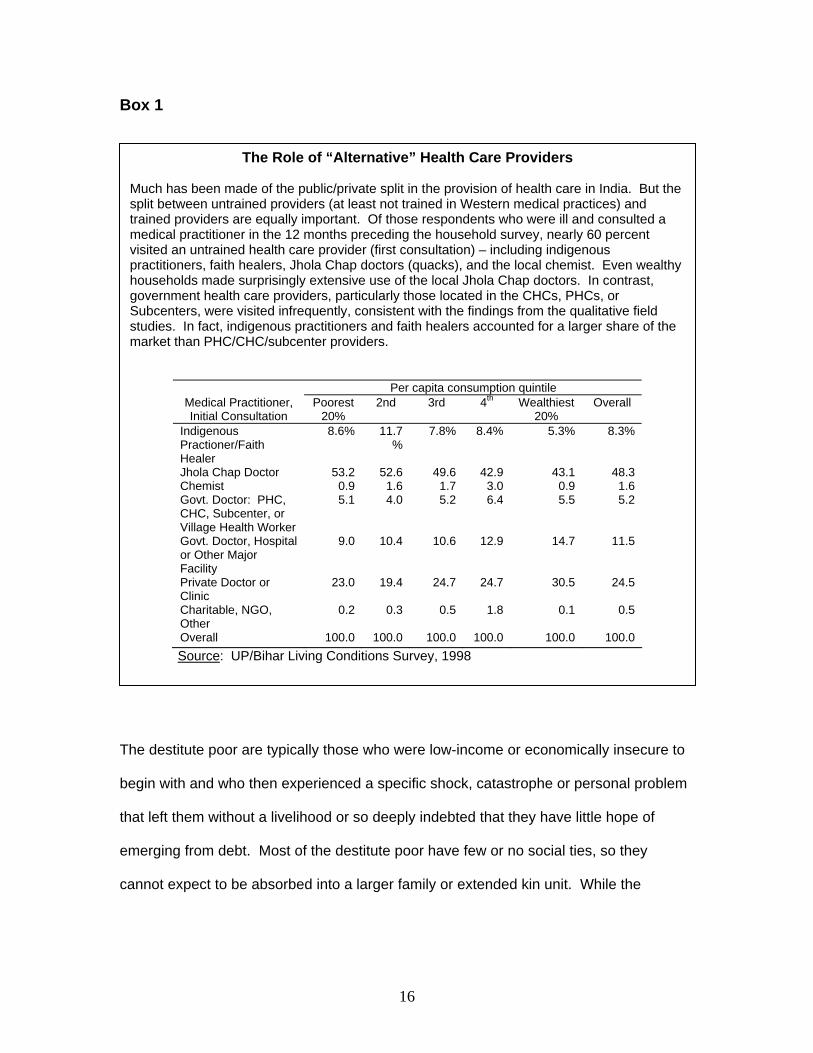
The Role of “Alternative” Health Care Providers Much has been made of the public/private split in the provision of health care in India. But the split between untrained providers (at least not trained in Western medical practices) and trained providers are equally important. Of those respondents who were ill and consulted a medical practitioner in the 12 months preceding the household survey, nearly 60 percent visited an untrained health care provider (first consultation) – including indigenous practitioners, faith healers, Jhola Chap doctors (quacks), and the local chemist. Even wealthy households made surprisingly extensive use of the local Jhola Chap doctors. In contrast, government health care providers, particularly those located in the CHCs, PHCs, or Subcenters, were visited infrequently, consistent with the findings from the qualitative field studies. In fact, indigenous practitioners and faith healers accounted for a larger share of the market than PHC/CHC/subcenter providers.
Per capita consumption quintile Medical Practitioner, Initial Consultation
Poorest 20%
2nd 3rd 4th Wealthiest 20%
Overall
Indigenous Practioner/Faith Healer
8.6% 11.7%
7.8% 8.4% 5.3% 8.3%
Jhola Chap Doctor 53.2 52.6 49.6 42.9 43.1 48.3 Chemist 0.9 1.6 1.7 3.0 0.9 1.6 Govt. Doctor: PHC, CHC, Subcenter, or Village Health Worker
5.1 4.0 5.2 6.4 5.5 5.2
Govt. Doctor, Hospital or Other Major Facility
9.0 10.4 10.6 12.9 14.7 11.5
Private Doctor or Clinic
23.0 19.4 24.7 24.7 30.5 24.5
Charitable, NGO, Other
0.2 0.3 0.5 1.8 0.1 0.5
Overall 100.0 100.0 100.0 100.0 100.0 100.0 Source: UP/Bihar Living Conditions Survey, 1998
The destitute poor are typically those who were low-income or economically insecure to
begin with and who then experienced a specific shock, catastrophe or personal problem
that left them without a livelihood or so deeply indebted that they have little hope of
emerging from debt. Most of the destitute poor have few or no social ties, so they
cannot expect to be absorbed into a larger family or extended kin unit. While the
16

destitute are a small proportion of the poor, the quality of their lives is precarious in the
extreme:
Box 2
Destitution in Rural India
Ramesh belongs to one of the scheduled castes in Allahabad District, UP. He was married at the age of 12. He used to be able to support his mother, wife and three children by cultivating the fields of the wealthy as a tenant farmer. Now, however, he has contracted tuberculosis and is too weak to perform manual labor. He is illiterate, and so he knows he would not be eligible for skilled employment even if it were available in his village. His wife works during the harvest season, but the season is brief and she earns only Rs. 15 or two-and-a-half kg. of rice in kind for a day’s labor. Ramesh cannot even get a loan, because everyone knows he is too ill to work it off or pay it back. As a result, Ramesh’s family often sleeps hungry, unless fellow villagers donate a meal out of pity. Ramesh doesn’t know very much about health. He believes illness is caused by the attack of evil spirits, and he does not know that immunization might have prevented the deaths of some of his and his neighbors’ lost children. However, he does receive treatment for his TB from a government hospital in Allahabad, and he is able to buy his allotment of subsidized grain and kerosene every month from the local PDS shop. These services help him to survive, but he cannot afford to send any of his children to school. He says he would like to educate both his daughters and his son, but he knows that all his children will grow up to be illiterate and without job skills. He fears that their lives will be no different than his own.
Social Identity and Poverty
Caste and gender have long been recognized as important determinate of poverty in
India; although caste and social inequities have been addressed in many villages studies
(Mencher, 1980; Rodgers, 1983; Ramachandran, 1990; Jha, 1994; Dreze, Lanjouw, and
Sharma, 1998), they have not until recently been discussed widely in the conventional
poverty literature. Recent studies highlight large and continuing disparities between
lower caste households and others, particularly in the poorer northern states (Lieten,
1996; Dreze and Gazdar, 1996; Pai, 1998; Breman, 2003; Ray, 2000). In addition to
shocks and downward mobility, the study also explored social structural component of
poverty using a sequential phasing of qualitative and quantitative methods. In contrast
to the poorest, informants identified a typical poor household as one which is at the low
17

end of the caste11 hierarchy -- most often a member of the Scheduled Castes or
Scheduled Tribes12 (SC/ST). While ST and SC households are usually grouped in a
separate hamlet at the edge of the village, a few may occupy a homestead plot in the
village which belongs to their upper-caste employer – usually as part of an “attached”
labor relationship between the two households. Cross-caste patron-client relationships
of this kind may be inherited through generations, but in the aftermath of an
economically devastating shock, a rural laborer without savings may become bound to a
patron landowner through chronic indebtedness. Debt bondage is illegal in India, but
cases can still be found. Commonly, an attached laborer is obliged to work in the
patron’s fields (at wages significantly below the market rate) until the debt is paid off. If
the debt is large, this might equal a lifetime commitment. Even when low-caste workers
are independent, however, they are usually limited to the lowest paid, lowest status
employment (e.g. casual agricultural labor) as a result of illiteracy, lack of skills, and
discrimination in hiring.
These findings alerted the research team to the importance of social hierarchy as a
factor in long-term poverty. Structural Poverty is used to describe individuals and
households whose poverty is chronic through several generations and in many cases is
linked to their social identity. Individuals afflicted with a stigmatized social identity are
often caught in a poverty trap which is a feature of a particular social system. The
question of the relationship between poverty and social identity was subsequently
analyzed using the survey data. Results indicated that, although not all impoverished
households are members of lower castes, low social standing has historically been
strongly associated with poverty in all its many dimensions. For example, analysis of
recent rounds of India’s National Sample Survey (NSS) show that SC/ST household are
much more likely to be poor than majority households (Table 1).
18

Table 1: Poverty Incidence by Caste, 1987-88, 1993-94, and 1999-00
Source: GOI National Sample Survey (NSS) 1987-88, 1993-94, 1999-00
Caste Incidence of Poverty Percentage of: Year Group Urban Rural Overall Population Poor
SC / ST 48.3 56.2 55.3 24 32 1987-88 Other 35.7 37.5 37.2 76 68
Overall 37.4 42.3 41.5 100 100 SC / ST 57.5 58.6 58.4 23 33
1993-94 Other 31.3 37.0 35.7 77 67 Overall 35.0 42.4 40.9 100 100 SC/ST 44.1 44.0 44.0 26 35
1999-00 Other 30.3 29.4 29.6 74 65 Overall 32.5 33.2 33.1 100 100
Moreover, in many regions of India, the gap between ST/SCs and majority is not closing,
despite India’s increasing industrialization and rising incomes. In the study regions in
UP and Bihar, low caste households were disproportionately represented in the
agriculture sector, typically working as low-paid, low-status casual labors. Many did not
own land, but instead worked on land owned by their upper caste neighbors. Those not
working as casual laborers in agriculture were likely to be working as causal laborers in
non-farm activities. Unlike those with higher social status, few members of low caste
households in rural UP had permanent or secure jobs.
Table 2: Composition of Employment Days, by Caste Distribution of
Employment Days
Upper
Other Backward
SC/ST
Self emp: farming 39.1 42.2 20.5 Self-emp: non-farm 14.8 19.9 11.8 Agriculture laborer 1.5 7.6 29.4 Non-farm laborer 11.0 17.5 23.6 Salaried employment 31.6 11.2 12.0 Total 100 100 100
Source: UP/Bihar Living Conditions Survey, 1998
19

One of the most critical dimensions of poverty is illiteracy and low educational
attainments. While enrollment rates in UP have increased sharply over the 1990s. The
quantitative portion of the study revealed that, while poverty is strongly associated with
illiteracy and low enrollments, caste has a strong and independent effort on educational
attainments, particularly for girls. Only 55 percent the SC/ST girls in even the highest
welfare quintile were enrolled in school, in contrast to nearly 90 percent of upper and
middle caste households living in households at the same per-capita expenditure level.
20

Box 3
Thus caste was found to have an impact on enrollments that was independent of wealth.
A companion study was launched to determine whether lower caste households were
more likely to be poor because they had lower levels of assets (e.g. land, human capital)
or because they received low returns to assets than majority households. (Lanjouw and
Wealth and Caste: Effects on School Enrollments Survey estimates indicate that 74 percent of primary school-aged boys (6-12 yr.) attend school as compared to only 55 percent of girls, despite the fact that most households lived within 3 kilometers of a public primary school. Enrollment rates vary not only by welfare levels but also quite significantly by caste. With the exception of upper caste households, poverty has a far stronger impact on enrollments levels of girls than those of boys. For example, only 35 percent of poor SC/ST girls (defined as 6-12 year old girls from households in the bottom 40 percent of the welfare distribution) were enrolled in primary school, as compared to over 70 percent of poor upper and middle caste girls. In contrast, 55 percent of poor, SC/ST boys were enrolled in school in comparison to over 75 percent of equally poor, upper and middle caste boys. Caste-based differences in girl’s primary school enrollments were still evident for well-off households: only 55 percent of SC/ST girls living in the wealthiest quintile of households were enrolled in primary school, as compared to 90 percent of girls from wealthier upper caste households School Enrollments of Boys – by Caste and Per-capita Consumption Quintile
Per capita consumption quintile Caste group 1st 2nd 3rd 4th 5th Overall
Upper / middle caste 60.0% 93.1% 92.5% 95.9% 96.6% 83.1% Backward agriculture 73.5 78.0 75.1 74.6 90.6 78.8 Backward – other 62.8 74.2 78.1 90.9 85.0 75.9 SC / ST 48.9 59.3 65.6 77.7 82.7 60.1 Muslim 50.4 58.2 70.1 67.6 88.9 63.6 Overall 57.3 70.6 75.2 81.2 91.4 73.9
School Enrollments of Girls – by Caste and Per-capita Consumption Quintile
Per capita consumption quintile Caste group 1st 2nd 3rd 4th 5th Overall
Upper / middle caste 72.7% 78.2% 60.2% 89.2% 89.7% 83.4% Backward agriculture 24.3 42.8 74.8 59.4 78.8 58.4 Backward – other 39.3 49.8 55.0 57.7 63.0 49.6 SC / ST 30.3 39.3 46.7 54.4 55.1 39.1 Muslim 46.3 38.8 54.8 51.8 70.8 50.5 Overall 35.6 46.0 58.7 64.5 80.2 54.9
Source: UP/Bihar Living Conditions Survey, 1998
21

Kijima, forthcoming) The findings suggest that, all other things being equal, SC/STs in
UP and Bihar have lower returns to labor. The results of the qualitative work suggest
that a similarly educated son or daughter of a poor family with limited contacts outside
the village and a stigmatized social identity is less likely to find suitable employment and
more likely to join the ranks of the educated unemployed. Conversely, a high-caste
family’s social position and influential contacts outside the village enhance the returns to
education for these households, and thus may render them more likely than the poor to
invest in the education of children.
More generally, the quantitative findings support the hypothesis, suggested by
qualitative informants, that the lowest caste households are more likely than other
households to be poor and illiterate. Consistent with informants’ statements, the survey
results revealed that lower caste households not only lacked private assets but also
were less likely to have access to public goods and services resources. Regardless of
income level, low-caste children (especially girls) in rural UP and Bihar are less likely to
utilize or gain access to education services that can enable them to break the cycle of
poverty.
In sum, households that were trapped in chronic poverty were usually found to be those
that are constrained by insurmountable barriers such as a stigmatized social identity,
catastrophic shocks, or both. However, many poor Indian households do not face these
constraints; and some of these were found to be deploying strategies for economic
improvement that were at least moderately successful. The less poor (i.e. the best-off
among poor households) are often those who own a small amount of agriculture land
and have begun to diversify their earnings portfolio, e.g. through petty trading or small
business activities often linked to agriculture or livestock (selling eggs or milk, producing
22
simple prepared foods). Many are members of Extremely Backward Castes (EBCs) and
Other Backward Castes (OBCs both are higher in the caste hierarchy than SC/STs. In
dry regions, access to inputs and especially irrigation water is required if land is to
produce good yields. Better-off households are more likely to own private ponds and
pumpsets, or they are able to utilize political contacts outside their tola and village to
ensure that public wells and pumpsets are located on or near their own fields.
Households with irrigated lands are better able to achieve food self-sufficiency. Those
households which are able to produce enough food, either through agriculture or
employment, to feed all family members throughout the twelve months of the year were
identified as those which can attain a steady state or may even have the potential for
advancement. In contrast, those who can feed themselves for only part of the year are
expected to lose ground and to fall into chronic debt.
Among the less poor, impoverishment may in some cases be a transient condition.
Mobile poverty describes a situation in which households are low-income but debt free;
they possess assets or employment sufficient to maintain at least a steady state; and
they face fewer social constraints to economic mainstreaming than do the structural
poor. Some of the poor exhibit a clear potential for beginning to accumulate surplus
resources and climb out of poverty:
23

Box 4
The Mobile Poor A Yahdev (an OBC caste) household in Banda, UP, shows classic characteristics of economically mobile albeit poor households in rural India. The household has managed to escape extreme poverty by virtue of owning a small piece of rain-fed agricultural land; but since five sons were born to the household head, the family was threatened by impoverishment through subdivision of a small landholding. The father was able to avoid this danger by securing cooperation among his grown sons in a family-owned business. In part by intensive cultivation of their land, the household was able to accumulate a herd of about 50 cows. These animals produce enough surplus milk for the household to produce a variety of popular milk sweets for purchase by wealthier households in the village. Although transport costs have prevented the five brothers from extending sales outside the village, expansion to a nearby town is planned if the business continues to prosper. According to the household head, the upper castes are against him and resent his success. Nevertheless, his household is upwardly mobile and, barring unforeseen shocks, shows promise of making the transition to the rural middle-class.
Heterogeneity of the Poor, Heterogeneity of Pro-poor Policies and Programs
Thus, although a specific household may show overlapping traits, three different types of
poverty syndromes were identified over the course of the study. These syndromes do
not represent discrete, mutually-exclusive categories of poor households, but rather
schematic types. Each of these three poverty syndromes entails its own set of
circumstances in terms of barriers and opportunities for advancement. Strategies for
survival or improvement vary in consequence. An effective poverty reduction strategy
will not treat all three uniformly. Instead, separate assistance tools and tactics may be
required to effectively address the specific conditions of each syndrome.
C. Using Q2 to Address Specific Research Questions: How do Rural Elites
Maintain Control in India?
Although the study’s Q-squared design was interactive, the initial qualitative phase
provided hypotheses and a conceptual framework that were examined and tested in the
subsequent components. For example, the study‘s qualitative and quantitative
24
components both support the contention that structural factors, particularly caste, trap
many Indian households in persistent poverty. This pattern continues despite the fact
that the jajmani (hereditary patron-client) system is on the wane, in so far as attached
labor is now less common than free casual labor in most of the study villages. India is a
democracy, however, wherein caste discrimination is illegal and higher castes are in the
minority. How, then, do these elites retain economic and political dominance; and how
are lower caste households prevented from moving up in the economic hierarchy?
In addition to the question of “why,” qualitative research is also well suited to pose the
question “how.” Through case history and example, qualitative research can
demonstrate the mechanisms through which a social, economic or political situation
arises and is maintained. For example, the study’s discussions and other qualitative
exercises drew the researchers’ attention to a number of specific mechanisms that
contribute to the persistent pattern of economic domination of upper-castes. Among
them are the fact that, as described by informants and observed by the research team
during social mapping exercises, higher caste households and neighborhoods were
found to be in control of natural resources and many public assets such as irrigation and
drinking water, fertile land, and government jobs and services. Other key mechanisms
of caste domination include chronic debt obligations, often caused by emergency
borrowing, that tie the debtor’s labor to the demands of the (usually upper-caste)
creditor. Focus group discussions suggested that members of elite groups who borrow
(whether from relatives or from formal sources) often do so in order to acquire capital for
investment in productive assets i.e. for economic advancement. In contrast, borrowing
by the rural poor was most often linked to shocks and/or meeting emergency
consumption needs. Expenses associated with illness were a common cause of
emergency borrowing. Complementary survey analysis supported the fact that, although
25

illness strikes households at all economic levels, poor households are less able to
depend on savings and more likely to cope by taking unsecured loans: (Table 3)
Table 3: Sources of Financing for Illness-Related Expenditures
Means of financing Per-capita Consumption Quintile Expenditure Poorest 2 3 4 Richest Overall
Savings 68% 69% 77% 82% 92% 77% Sale of Assets 5% 2% 2% 2% 1% 3% Unsecured Loans 23% 23% 19% 14% 7% 18% Mortgage or Assistance 3% 6% 2% 2% 1% 3% Total 100% 100% 100% 100% 100% 100% Source: UP/Bihar Living Conditions Survey, 1998
Another advantage that supports domination by the higher castes is a greater density of
social capital. Upper caste households were found to maintain broader and more
productive social capital networks, both within their communities and with urban centers
beyond. Outside the household, upper-caste households were found to hold the
advantage in terms of the density and utility of horizontal ties of mutual assistance. This
is in part because they are better able to conform to the cultural ideal of maintaining a
joint family structure in which brothers reside together after marriage, pool their
resources and cooperate productively. Poor families, it was said, were forced by
necessity to break from the joint household and set up nuclear families. These nuclear
families, which are likely to be low-caste, are viewed as inferior in so far as they can
command fewer resources, benefit less from economies of scale, and have less political
influence than can a large joint family. The household survey results supported
informants’ assertions that upper and middle caste households are almost twice as likely
to live in joint families as lower caste households. Both income and land holdings were
found to be particularly important factors in determining whether households were joint
or nuclear; the wealthiest land-owning households nearly always had a joint family
structure.
26

The social capital advantage was found to have particular relevance to the issue of
chronic debt described above. In one UP village, informants in a low-caste tribal tola
described their sources of small-scale and short-term assistance in times of emergency
as being largely limited to a few close kin and neighbors. For large-scale or long-term
help, such as might be required in case of major illness or natural disaster, they would
turn to money-lenders or members of the dominant caste. Both of these options might
include actions that damage the household’s potential for economic recovery e.g. selling
or pawning land, livestock, or farm implements, entering fixed labor arrangements.
Members of an upper-caste household in the same village, by contrast, said they could
ask for help or interest-free loans from a large group of about twenty families to whom
they are related through the male line. To examine these assertions quantitatively, the
survey questionnaire was amplified to include questions about the caste status of
borrowers and creditors. Survey analysis highlighted the dependency of SC/STs on
higher caste households for short run credit
27
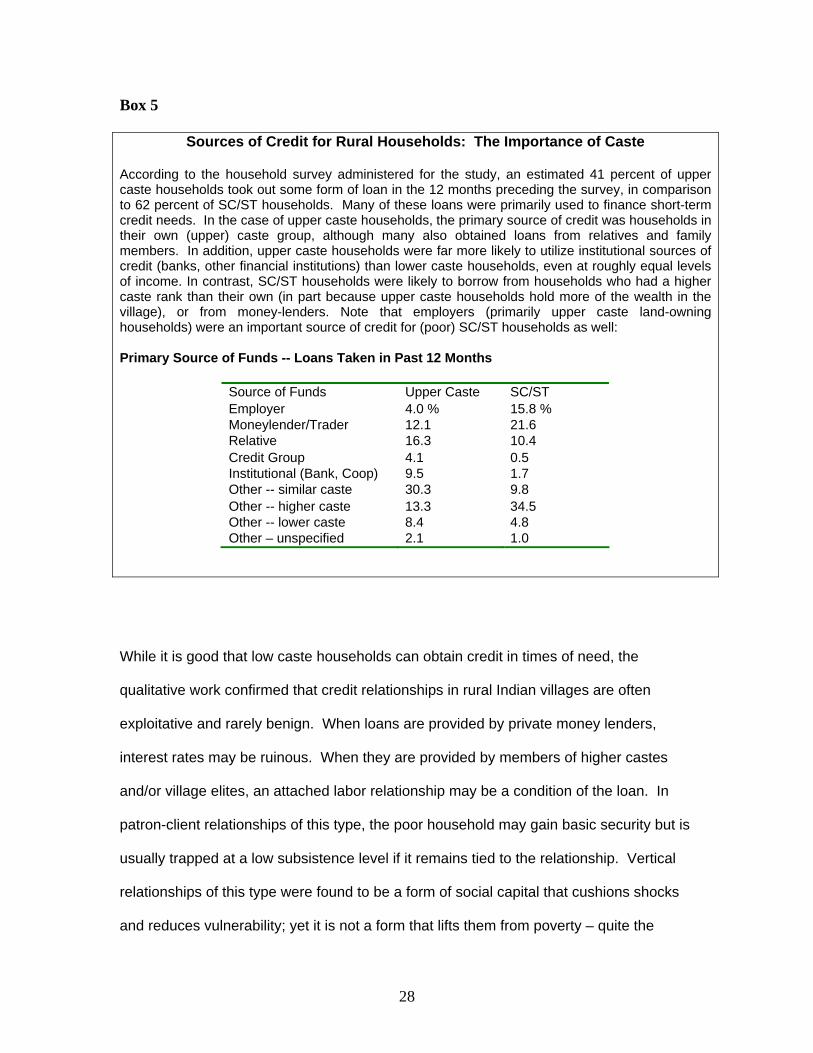
Box 5
Sources of Credit for Rural Households: The Importance of Caste According to the household survey administered for the study, an estimated 41 percent of upper caste households took out some form of loan in the 12 months preceding the survey, in comparison to 62 percent of SC/ST households. Many of these loans were primarily used to finance short-term credit needs. In the case of upper caste households, the primary source of credit was households in their own (upper) caste group, although many also obtained loans from relatives and family members. In addition, upper caste households were far more likely to utilize institutional sources of credit (banks, other financial institutions) than lower caste households, even at roughly equal levels of income. In contrast, SC/ST households were likely to borrow from households who had a higher caste rank than their own (in part because upper caste households hold more of the wealth in the village), or from money-lenders. Note that employers (primarily upper caste land-owning households) were an important source of credit for (poor) SC/ST households as well: Primary Source of Funds -- Loans Taken in Past 12 Months
Source of Funds Upper Caste SC/ST Employer 4.0 % 15.8 % Moneylender/Trader 12.1 21.6 Relative 16.3 10.4 Credit Group 4.1 0.5 Institutional (Bank, Coop) 9.5 1.7 Other -- similar caste 30.3 9.8 Other -- higher caste 13.3 34.5 Other -- lower caste 8.4 4.8 Other – unspecified 2.1 1.0
While it is good that low caste households can obtain credit in times of need, the
qualitative work confirmed that credit relationships in rural Indian villages are often
exploitative and rarely benign. When loans are provided by private money lenders,
interest rates may be ruinous. When they are provided by members of higher castes
and/or village elites, an attached labor relationship may be a condition of the loan. In
patron-client relationships of this type, the poor household may gain basic security but is
usually trapped at a low subsistence level if it remains tied to the relationship. Vertical
relationships of this type were found to be a form of social capital that cushions shocks
and reduces vulnerability; yet it is not a form that lifts them from poverty – quite the
28
reverse, in fact. There is, then, a tension between the desire to retain a time-honored
form of security and the desire to tap opportunities for economic advancement. If
alternative (public) safety nets are available, then landless households and unskilled
laborers will not be defenseless because they lack a traditional patron. The Government
of India thus may have an important role in protecting the vulnerable as an alternative to
the now deteriorating jajmani (patron-client) system.
The extensive external contacts of powerful upper castes can also help them better
capture government and other resources slated for the village. And, since residence
patterns are often segregated by caste, this often means that resources such as drinking
and irrigation water, schools, health posts, infrastructure projects, Public Distribution
System (PDS) shops, etc. become concentrated in the wealthy or dominant-caste
communities. Capturing these resources strengthens their ability to retain economic and
political dominance of their villages, and to block lower caste households from moving
up in the economic hierarchy. When the school is at the far end of the village, for
example, the stigmatized poor are less likely to enroll their children (especially girls), and
low caste people have expressed unwillingness to brave the insults and humiliations
they receive when attempting to utilize resources located in high-caste neighborhoods.
Lack of external contacts, therefore, contributes to the failure of the poor to gain access
to or to effectively use many of the government services that were designed to help
them. In rural India, then, poverty of social relationships is linked to poverty of access to
public resources.
29
V. CONCLUSIONS
The study was organized as an ongoing conversation between researchers from
different disciplines and different cultures, which yielded a rich and nuanced
understanding of the various dimensions of poverty, as well as answers to specific
research questions. The sequential phasing of the qualitative and quantitative
components of the study allowed the research team to fully capture the advantages of
the combined approach. The iterative approach also permitted the team to build and
revise theories of behavior, and to develop pertinent hypotheses, throughout the
research process, in response to what is learned and how it is learned. By leading off
with the qualitative component, the team was able to develop a survey questionnaire
that was appropriate to actual field conditions and collected relevant information on key
issues. The subsequent household survey helped us ground and test many of the
qualitative findings and provided an opportunity to examine causal relationships between
variables. The follow-up qualitative mini-studies (e.g. on health) then provided an
opportunity to look deeper into specific issues, also to clarify ambiguous survey results.
Each of the q-methodologies, therefore, was useful for focusing and strengthening the
results of the other. The principle contributions of each of the two components can be
summarized as follows:
The Qualitative Component:
• The results of the initial qualitative phase enabled the study team to identify key
hypotheses and to construct an overall conceptual framework to guide the
subsequent research and analysis.
30

• Because qualitative methods are well suited to the identification of key particularities
of time and place, the research team’s attention was drawn to the role of India’s
unique social system (particularly caste) in determining who remains poor. This
awareness was reflected in the design of the survey questionnaire and in the
subsequent identification of variables for quantitative analysis.
• The follow-up qualitative component was able to clarify and explain survey results
that initially appeared enigmatic or counter-intuitive.
The Quantitative Component:
• The survey results contributed a valuable verification and clarification of many points
and issues raised by the informants in the qualitative component, also to describe
typical behavior in the study regions. It also identified specific issues to address
through rigorous econometric analysis e.g. whether SC and ST households were
worse off because they had fewer assets, or whether they also received lower
returns to the assets they did possess. Lower caste respondents included in the
qualitative phase of the study said that they faced various forms of discrimination e.g.
in obtaining well-paying jobs; analysis of the survey data provided further
confirmation. In general, the results of the two components were found to be
consistent. I
• The quantitative analysis allowed to team to assess the degree to which issues and
problems identified during the PRA exercises are actually widespread enough to
merit the attention of government or donors.
31

More specifically, the Q2 approach helped in identifying three broad poverty syndromes
and highlighted the significance of both shocks and structural poverty associated with
stigmatized caste identity. Specific factors that trapped households in poverty or
plunged them into destitution – such as chronic debt obligations, expensive health
shocks, and sparse, localized social capital networks -- were identified in the initial
qualitative work for subsequent quantitative examination. The survey results then cast
additional light on these issues by demonstrating that the poor do face high costs when
illness strikes them and that members of stigmatized castes do suffer specific
disadvantages. They receive lower returns to their material and human capital assets,
they are more likely to take emergency loans from higher caste individuals than are
members of the caste elite (who usually borrow from relatives); and public resources are
more often located in upper-caste neighborhoods. The question of the impoverishing
impact of health shocks was then examined through a qualitative district health
assessment that revealed the many factors that lead to under-utilization of free
government services and direct the poor toward expensive (usually untrained) private
providers. In sum, this study’s qual-quan-qual sequencing enabled each component to
add value to the previous one by clarifying, explaining or supporting its finding
In closing, we would highlight two points. First, if time and resources permit, a “qual-
quan-qual” sequencing of study components is potentially a “best practice” approach. It
is useful to begin with a qualitative study aimed at developing hypotheses, identifying
key issues and informing the development of a survey questionnaire. After the
questionnaire survey is completed and analyzed, the study team should stand ready to
return to the study villages (if necessary) in order to further examine any issues that
were left unclear. Second, in order for the integration of methodologies, there is a
parallel need to have an integrated (and multi-disciplinary) study team. Individuals who
32

collected qualitative information in the field should participate in the process of
recognizing relevant patterns and linkages in the data, developing ideas and hypotheses
to be tested using survey data, and formulating operationally useful conclusions and
recommendations. Similarly the quantitative data analysis should be done in close
coordination, and iteratively, with the qualitative analysis. The richness and ultimate
success of the UP/Bihar study was as much due to the willingness of the survey team to
work closely and across disciplinary boundaries as it was to the methodologies
themselves
33

REFERENCES Bardhan, P.K. (1973) “On the Incidence of Poverty in Rural India of the Sixties”, Economic and Political Weekly, Annual Number, February. Bardhan, P.K., ed. (1989) Conversations Between Economists and Anthropologists: Methodological Issues in Measuring Economic Change in Rural India. Delhi: Oxford University Press Barrett, C. (2004) “Mixing Qualitative and Quantitative Methods of Analyzing Poverty Dynamics”. SAGA working paper. Breman, Jan. (2003) The Laboring Poor in India: Patterns of Exploitation, Subordination, and Exclusion. Delhi: Oxford University Press. Bliss, C.J. and Nicholas Stern. (1998) Palanpur: The Economy of an Indian Village. Oxford: Oxford University Press. De, Anuradha and Jean Dreze. (1999) The Public Report on Basic Education in India (PROBE). Delhi: Oxford University Press. De Haan, Arjan and Amaresh Dubey. (2004) “Conceptualizing Social Exclusion in the Context of India’s Poorest Regions: a Contribution to the Quantitative Qualitative Debate”. Paper presented at Q-squared conference… Deaton, A. and Valerie Kozel, eds. (2004) The Great Indian Poverty Debate. Delhi: Macmillan. Dreze, Jean. (1990) “Widows in Rural India”. STICERD Discussion Paper Series DEP 26. London School of Economics, Development Economics Program. Processed. Dreze, Jean and Hariss Gazdar. (1996) “Uttar Pradesh: the Burden of Inertia”. Printed in Indian Development: Selected Regional Perspectives, edited by Jean Dreze and Amartya Sen. Oxford and New Delhi: Oxford University Press. Dreze, Jean, Peter Lanjouw, and Naresh Sharma. (1998) “Economic Development 1957-93”. In Lanjouw and Stern, eds. Dreze, Jean and Amartya Sen. (1995) India: Economic Development and Social Opportunity. Oxford and New Delhi: Oxford University Press. Epstein, T. Scarlett. (1973) South India – Yesterday, Today, and Tomorrow: Mysore Villages Revisited. London: Macmillan. Harriss-White, Barbara. (1992) “Rural Poverty in India: Micro-level Evidence”. In Barbara Harriss-White, S. Guhan, and R.H. Cassen, eds., Poverty in India: Research and Policy. Oxford: Oxford University Press. Jayaraman, R. and Peter Lanjouw. (1999) “The Evolution of Poverty and Inequality in Indian Villages”. World Bank Research Observer, 14(1), 1-30.
34

Jha, P.K. (1994) “Changing Conditions of Agriculture Laborers in Post-Independence India: A Case Study from Bihar”. Ph.D.dissertation Jawarharlal Nehru University, Centre for Economic Studies and Planning, School of Social Sciences, New Delhi. Processed. Jodha, N. (1988) “Poverty Debate in India: a Minority View”. Economic and Political Weekly, November, 2421-2428. Kanbur, Ravi, ed. (2003) Q-squared: Combining Qualitative and Quantitative Methods in Poverty Appraisal. Delhi: Permanent Black. Kozel, V. and Barbara Parker. (2001) “Poverty in Rural India: the Contribution of Qualitative Research in Poverty Analysis”. Poverty Reduction and Economic Management Unit, South Asia Region. Washington DC: World Bank. Krishna, Anirudh. (2004) “Escaping Poverty and Becoming Poor: Who Gains, Who Loses, and Why”. World Development, 32(1), 121-136. Lanjouw, Peter and Nicolas Stern, eds. (1998) Economic Development in Palanpur Over Five Decades. Oxford: Oxford University Press. Leiten, G.K. (1996) “Panchayats in Western Uttar Pradesh: ‘Namesake’ Members”. Economic and Political Weekly, September 28. Mencher, Joan. (1980) “The Lessons and Non-Lessons of Kerala: Agriculture Laborers and Poverty”. Economic and Political Weekly, Special Number (October), 1781-1802. Ramachandran, V.K. (1990) Wage Labor and Unfreedom in Agriculture: An Indian Case Study. Ray, Ranjan. (2000) “Poverty, Household Size, and Child Welfare in India”. School of Economics, University of Tasmania. Processed. Rew, Alan, Shahzad Khan, and Martin Rew. “P-cubed is Greater than Q-squared in Northern Orissa: An Example of Integrating ‘Combined Methods’ (Q-squared) through a ‘Platform of Probing Poverties’ (P-cubed)”. Forthcoming in World Development. Rodgers, G.B. and J. Rodgers. (1984) “Incomes and Work Among the Poor of Rural Bihar”. Economic and Political Weekly, Review of Agriculture. March. Rudra, Ashok. (1974) “Minimum Level of Living”. Printed in Poverty and Income Distribution in India, P.K. Bardhan and T.N. Srinivasan, eds. Indian Statistical Institute, Calcutta. Saith, Ashwani and A. Tankha. (1992) “Longitudinal Analysis of Structural Change in a North Indian Village: 1970-1987”. Working Paper Series 128. Institute of Social Studies, The Hague. Processed. Sharma, Rita, and Thomas Poleman. (1993) The New Economics of India’s Green Revolution: Income and Employment Diffusion in Uttar Pradesh. Ithaca: Cornell University Press.
35

Srivastava, Ravi. (1995) “Beneath the Churning: Studying Develoipment in Two Villages in Uttar Pradesh”. Paper presented to a workshop on The Village in Asia Revisited, Center for Development Studies, January, Thiruvanatapuram. Processed. __________. (1997) “Change and Resilience in Producer Strategies in Uttar Pradesh Agriculture.” In Jan Breman, Peter Kloos, and Ashwani Saith, eds. The Village in Asia Revisited. Delhi: Oxford University Press. Thoret, S. and S. Venkatesan. (2004) “Caste Conflict, Poverty, and Human Development in India”. Indian Institute of Dalit Studies. Paper presented at the WIDER conference, June 4-5th, in Helsinki. Wadley, Susan S. and Bruce W. Derr. (1989) “Karimur 1925-1984: Understanding Rural India Through Restudies”. In Bardhan, ed. White, H. (2002) “Combining Quantitative and Qualitative Approaches in Poverty Analysis”. World Development 30, 511-522.
36
END NOTES 1 From the World Bank’s side, the work was overseen by Valerie Kozel, with inputs from Barbara Parker, Giovanna Prennushi, Peter Lanjouw, and Salman Zaidi. 2 The study team in India was headed by Professor Ravi Srivastava (Department of Economics, JNU). Field team leaders, who prepared the background papers on which much of this paper is based, include Professor Nisha Srivastava (Department of Economics, Allahabad University), Madhavi Kuckreja (Vanangana, Karvi, UP), Ajay Kumar (Center for Action Research and Development Initiatives, Patna, Bihar), Sandeep Khare (Vigyan, Lucknow, UP), and Sashi Bhushan (Patna, Bihar). 3 Allahabad, Banda, Gorakhpur (phase I), Mirzapur, Jaunpur, Basti, Sidharthanagar, Hamirpur, Mau, Ghazipur, Faizabad, and Bahraich. 4 Jehanabad, Vaishali, Saharsa, Munger (Phase I), Muzaffarpur, Samastipur, Bhojpur, Saran, Gaya, Madhepura, Araria, Bhagalpur, and Pashchimi Champaran. 5 A revenue village is primarily an administrative entity in India. It typically consists of a group of settlements (also called tolas or bustis) clustered around the main or central village. 6 There has been an ongoing debate on poverty estimates for India. These figures are based on Deaton’s corrected estimates in “Adjusted Indian Poverty Estimates for 1999-2000”, Economic and Political Weekly, January 25, 2003. The debate is summarized in an edited volume by Deaton and Kozel, The Great Indian Poverty Debate, Macmillan Ltd/Delhi, 2005. 7 In the PRA exercises, the poor were identified by local respondents according to their own criteria and not criteria predetermined by the study team. These criteria may or may not correspond to identification through consumption-based poverty lines (note that future work is planned to compare poverty rankings from the PRA exercise with consumption-based rankings from the household survey). In addition, respondents may be addressing poverty as a relative rather than absolute concept, e.g. which households are the poorest in a particularly village, rather than which are the poor according to some externally defined standard. 8 The framework of the three sources of poverty (private assets, public goods and services, social assets) was initially developed for the World Bank’s poverty assessment for Uttar Pradesh (2003). 9 Follow-up research was also carried out to clarify the issue of why, given the inefficiency and leakages that are known to characterize India’s Public Distribution System, many poor informants nevertheless characterized this government program as the one that was most beneficial to them. 10 Many of the tabulations presented in this paper are categorized by per capita expenditure quintile. In creating these categories, households were sorted from poorest to wealthiest using per-capita expenditure levels, and then grouped so that each quintile comprised 20 percent of the total population. The first quintile includes the poorest 20 percent of the population, while the 5th quintile includes the wealthiest 20 percent of the population 11 The caste system in India is complex. For purposes of this paper, we prefer to upper castes (Brahmins and Thakurs), other backward castes (denoted OBCs), extremely backward casts (EBCs), and scheduled castes and scheduled tribes (SC/STs). Within any broad caste grouping -- e.g. the OBCs -- there are hundreds of castes and subcastes and all have a hierarchical or vertical relationship to one another. 12 The term “scheduled” is used because the names of certain lower castes and tribal groups are listed on a state schedule that entitles them to specific subsidies, employment quotas, and other public programs.
37